PGAM5 promotes lasting FoxO activation after developmental mitochondrial stress and extends lifespan in Drosophila
- Buck Institute for Research on Aging, United States
- Genentech, United States
Figures
Figure 1 with 3 supplements

The Drosophila signaling pathway and transcriptional response to mitochondrial proteostatic stress.
(A) Mitochondrial proteostatic stress was triggered by overexpression of a misfolding mitochondrial protein (ΔOTC) or knockdown of the complex I subunit ND75, as previously reported. The ubiquitous DaGS::GeneSwitch driver was activated for 24 hr at day 7 of adulthood, and female thoracic tissue collected for RNAseq analysis. Venn and bar diagrams show genes upregulated 3-fold/downregulated 2-fold with both treatments relative to controls, and with control FKPM > 10. Full raw data found in Supplementary File 1. (B) Gene Ontology analysis of the shared stress response; upregulated genes include chaperones, stress pathways, and antimicrobial peptides/innate immune genes. Redundant GO terms were trimmed using REVIGO. (C) Mitochondrial proteostatic stress response genes from RNAseq analysis verify by qPCR and are not activated by heat shock or induction of the ER-UPR through RNAi of Hrd1. p-values for ΔOTC ± RU486 are 0.109, 0.130, 0.255 and 0.008. (D) Knocking down the transcription factors FoxO or Relish, or the JNK kinase, during ΔOTC expression blocks induction of response genes. The kinase ASK1 and the mitochondrial membrane protein PGAM5 are also required for the mitochondrial proteostatic stress response. See supplementary for verification of additional UPRmt genes. p-values relative to ΔOTC + RU are (left to right)<0.0001,<0.0001,<0.0001,<0.0001,<0.0001, 0.0185 and 0.9888; 0.002,<0.0001,<0.0001, and <0.0001. (E) Proposed signaling pathway for immune activation by mitochondrial proteostatic stress. All error bars are SEM of 3+ independent experiments. ANOVA with Dunnett’s multiple comparisons test; *p<0.05, **p<0.01, then each *=0.1 x.. 200 µM RU486 was used in all experiments.
-
Figure 1—source data 1
The Drosophila signaling pathway and transcriptional response to mitochondrial proteostatic stress.
- https://doi.org/10.7554/eLife.26952.006
Figure 1—figure supplement 1
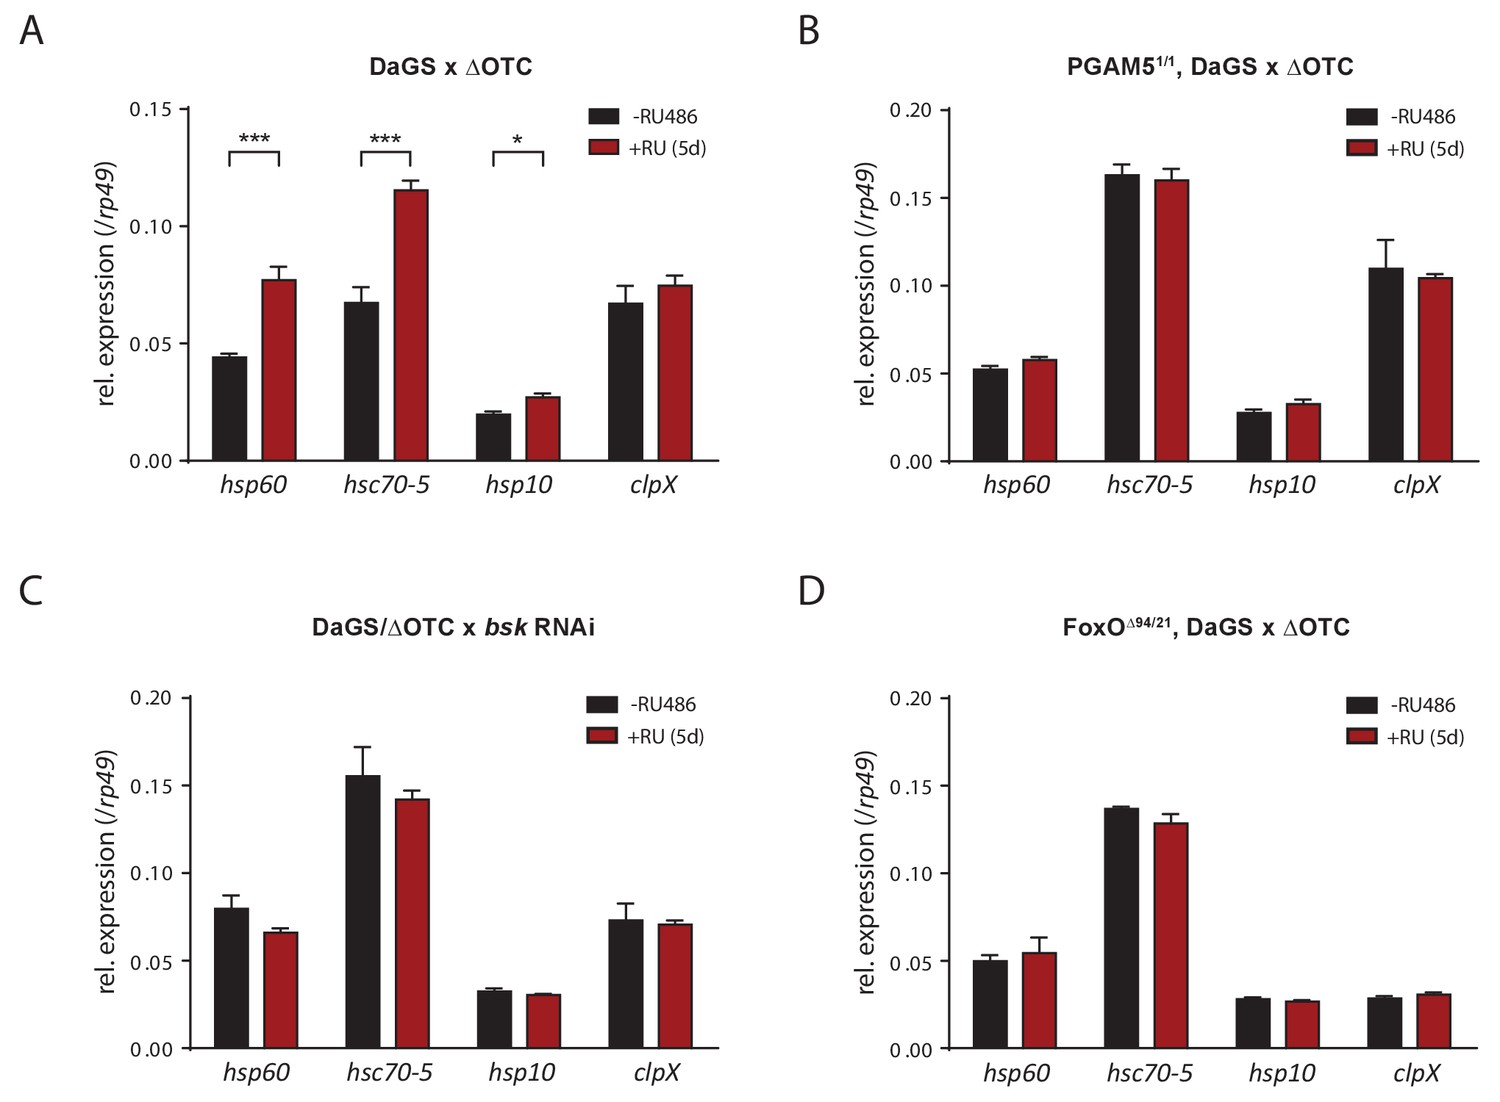
Activation of UPRmt markers by ΔOTC expression.
(A) In accord with previous studies, 5 days of mitochondrial proteostatic stress (here by ΔOTC expression) leads to induction of specific UPRmt chaprones and proteases. This induction in not observed in PGAM5 null flies (B), with simultaneous knockdown of bsk/JNK (C), or in FoxO null flies (D), demonstrating that the identified pathway is part of the UPRmt in Drosophila. RNA was extracted from female thoracic tissue, at 7 days of age. All error bars are SEM of three technical replicates; *p<0.05, **p<0.01, then each *=0.1 x. 200 µM RU486 was used in all experiments.
Figure 1—figure supplement 2
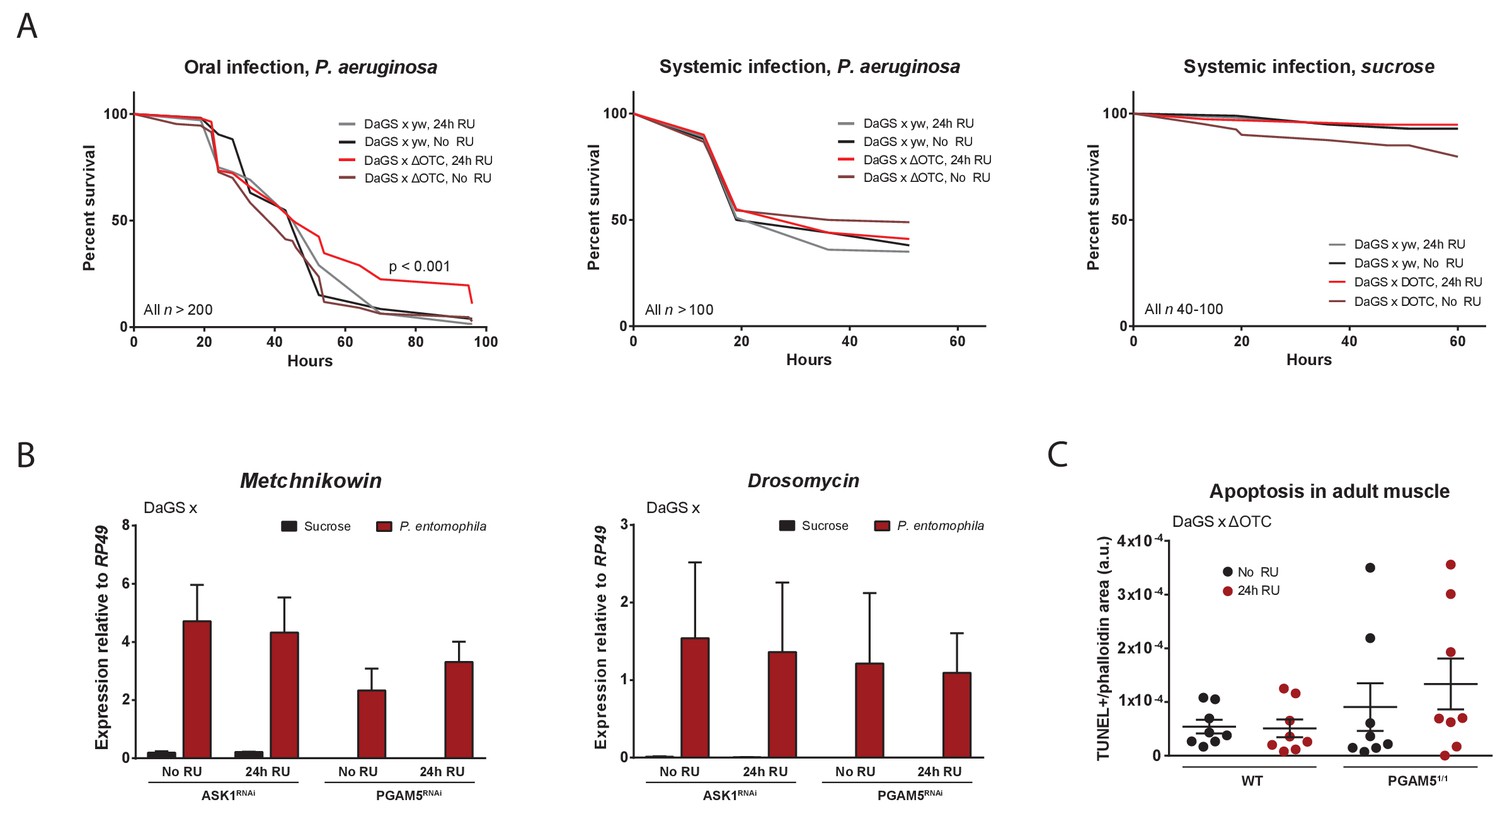
Immune activation by mitochondrial proteostatic stress.
(A) Acute adult ΔOTC expression for 24 hr mildly improves resistance to pathogenic Pseudomonas aeruginosa, administered by feeding a sucrose solution (left). Resistance to humoral infections, by abdominal pricking, is not improved (right). (B) Induction of antimicrobial peptide genes by pathogen exposure is not affected by disrupting UPRmt signaling, by knockdown of either ASK1 or PGAM5 for 24 hr pre-infection. (C) Quantification of muscle apoptosis as measured by the TUNEL assay, normalized to tissue area as determined by phalloidin staining. PGAM5 null flies show higher levels of apoptosis, but neither WT nor PGAM5 nulls show an increase in apoptosis after 24 hr ΔOTC expression.
Figure 1—figure supplement 3
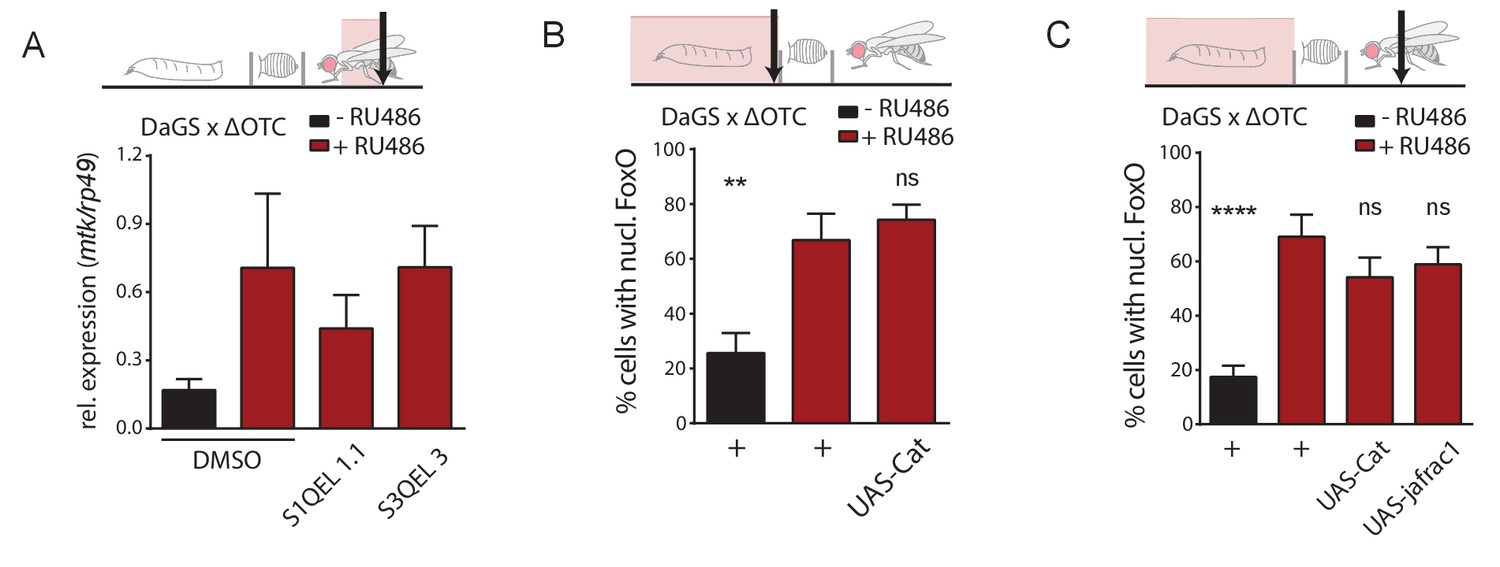
Drosophila UPRmt signaling does not depend on reactive oxygen species (ROS).
(A) Induction of antimicrobial peptides by ΔOTC expression is not affected by blocking mitochondrial ROS production, using inhibitors specific for either site IQ or site IIIQo (see text for references on these compounds). (B) Reducing ROS by overexpression of the antioxidant enzyme catalase does not affect FoxO activation by developmental ΔOTC expression. (C) Overexpressing either catalase or thioredoxin peroxidase 1 (jafrac1) have no effect on persistent FoxO activation in adult flies following developmental ΔOTC expression. Error bars are SEM of two independent experiments; *p<0.05, **p<0.01, then each *=0.1 x. 200 µM RU486 used in all experiments.
Figure 2 with 4 supplements

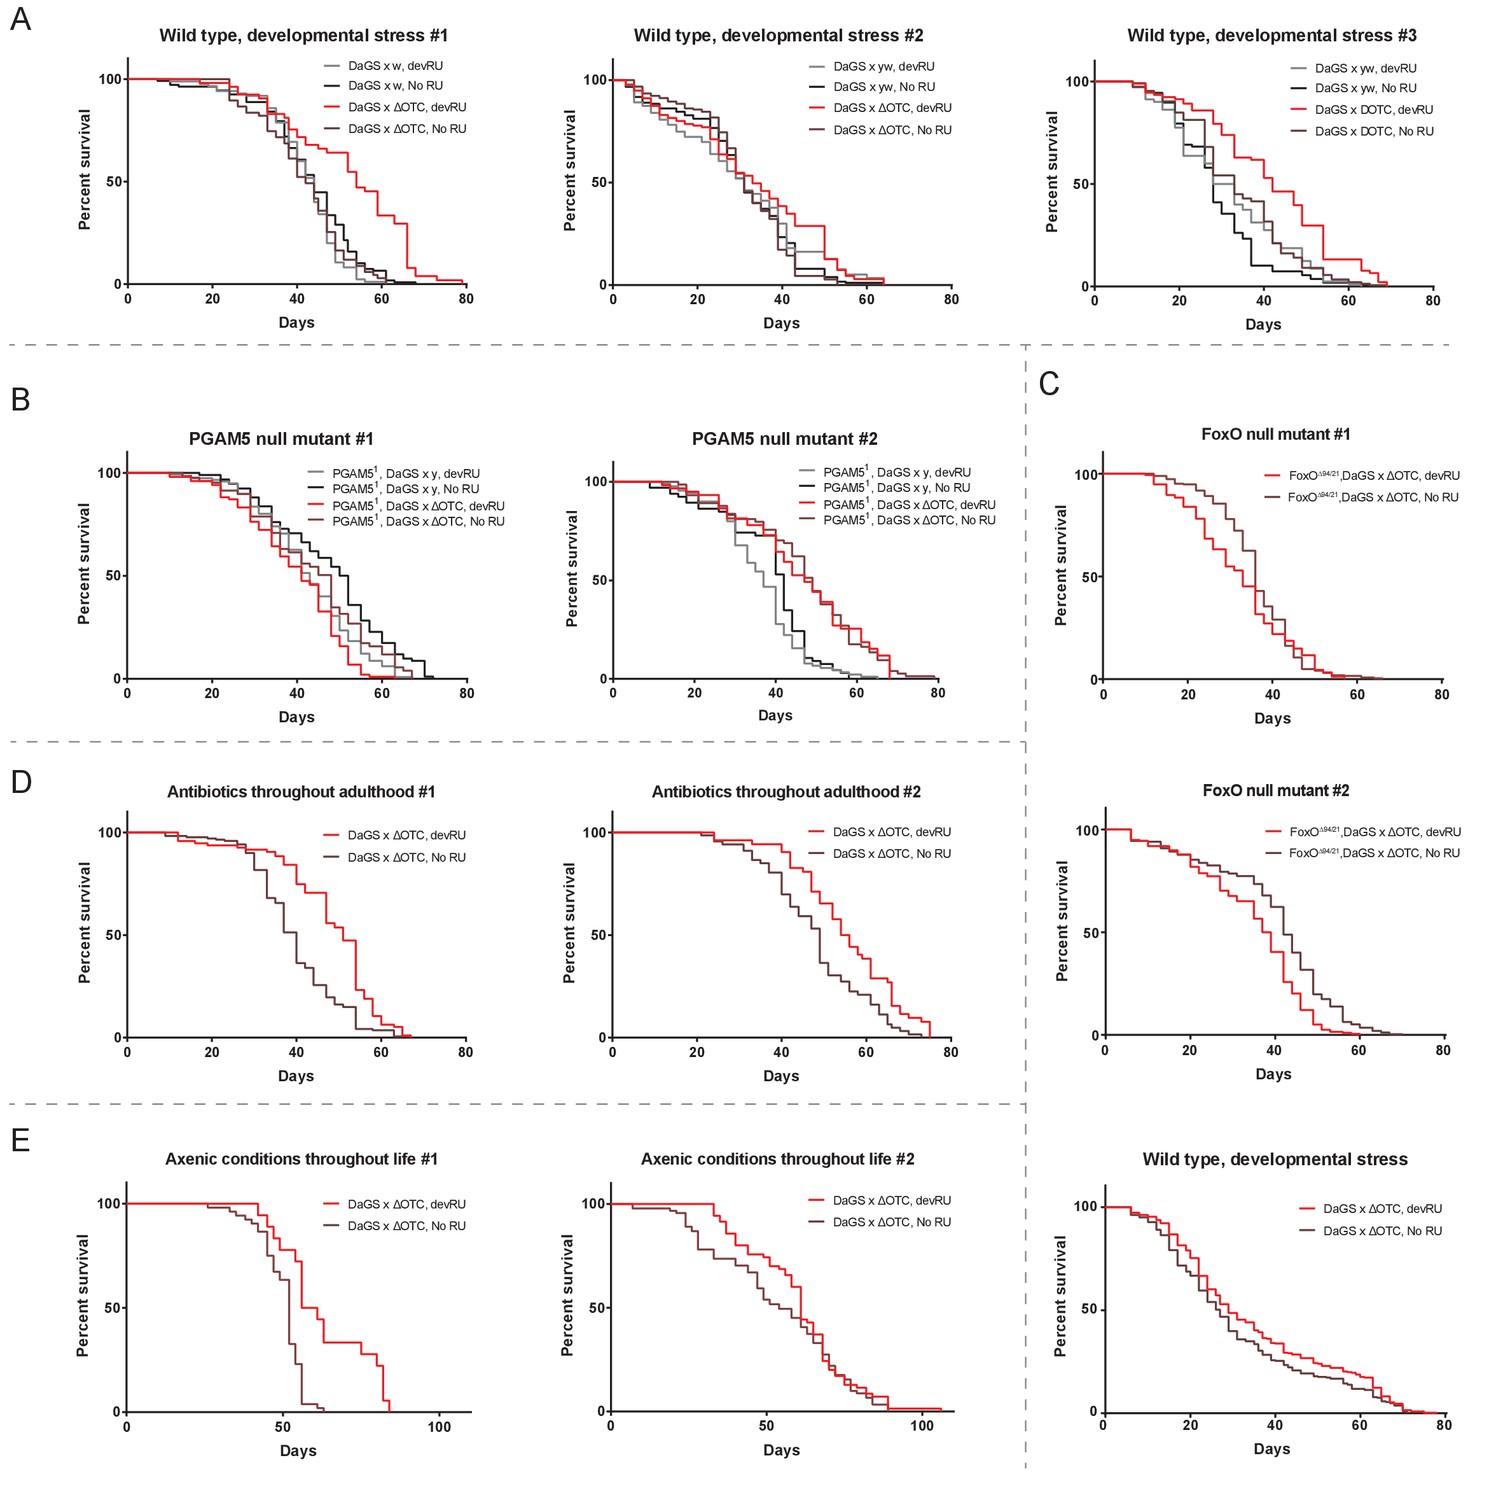
Developmental mitochondrial stress extends adult lifespan.
(A) Expressing ΔOTC throughout larval development extends median and maximal adult lifespan by 21/14%, respectively. RU486 at 200 µM does not affect lifespan in genetic control flies. (B) Expressing ΔOTC throughout adulthood does not extend lifespan. (C) Null mutants for the mitochondrial protein PGAM5 do not live longer following developmental ΔOTC expression. (D) Null mutants for FoxO do not live longer following developmental ΔOTC expression. These flies also showed strongly reduced survival through developmental mitochondrial stress (see supplementary). (E) Flies given antibiotics throughout adulthood still show lifespan extension by developmental ΔOTC expression. (F) Flies raised in a sterile environment from egg stage still show lifespan extension by developmental ΔOTC expression. (G) Statistical analysis of lifespan experiments. Each graph contains data pooled from 2 + independent experiments. Individual experiments, mortality graphs and life tables are shown in Supplement 4 and File 2.
Figure 2—figure supplement 1
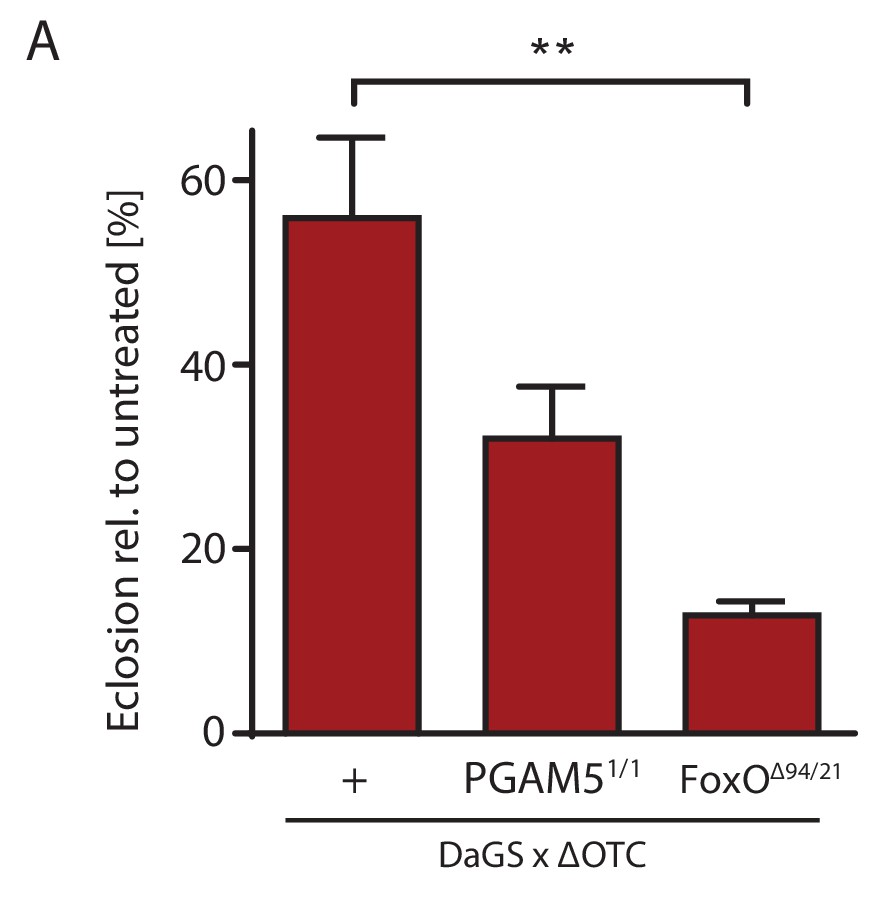
Survival through development stress requires UPRmt signaling.
(A) Null mutants for FoxO show significantly impaired survival during larval development when exposed to mitochondrial proteostatic stress. Survival of PGAM5 null flies was affected, but less severely. Error bars are SEM of three independent experiments; *p<0.05, **p<0.01, then each *=0.1 x. 200 µM RU486 used in all experiments.
Figure 2—figure supplement 2
Individual longevity curves.
Individual experiments comprising the curves presented in Figure 2, for (A) developmental ΔOTC expression, (B) developmental ΔOTC expression in a PGAM5 null background, (C) developmental ΔOTC expression in a FoxO null background, including a simultaneous control experiment of developmental ΔOTC expression in wild type flies as a positive control for lifespan exptension (bottom). (D) Developmental ΔOTC expression in flies fed antibiotics throughout adulthood, and (E) developmental ΔOTC expression in flies raised in sterile conditions.
Figure 2—figure supplement 3
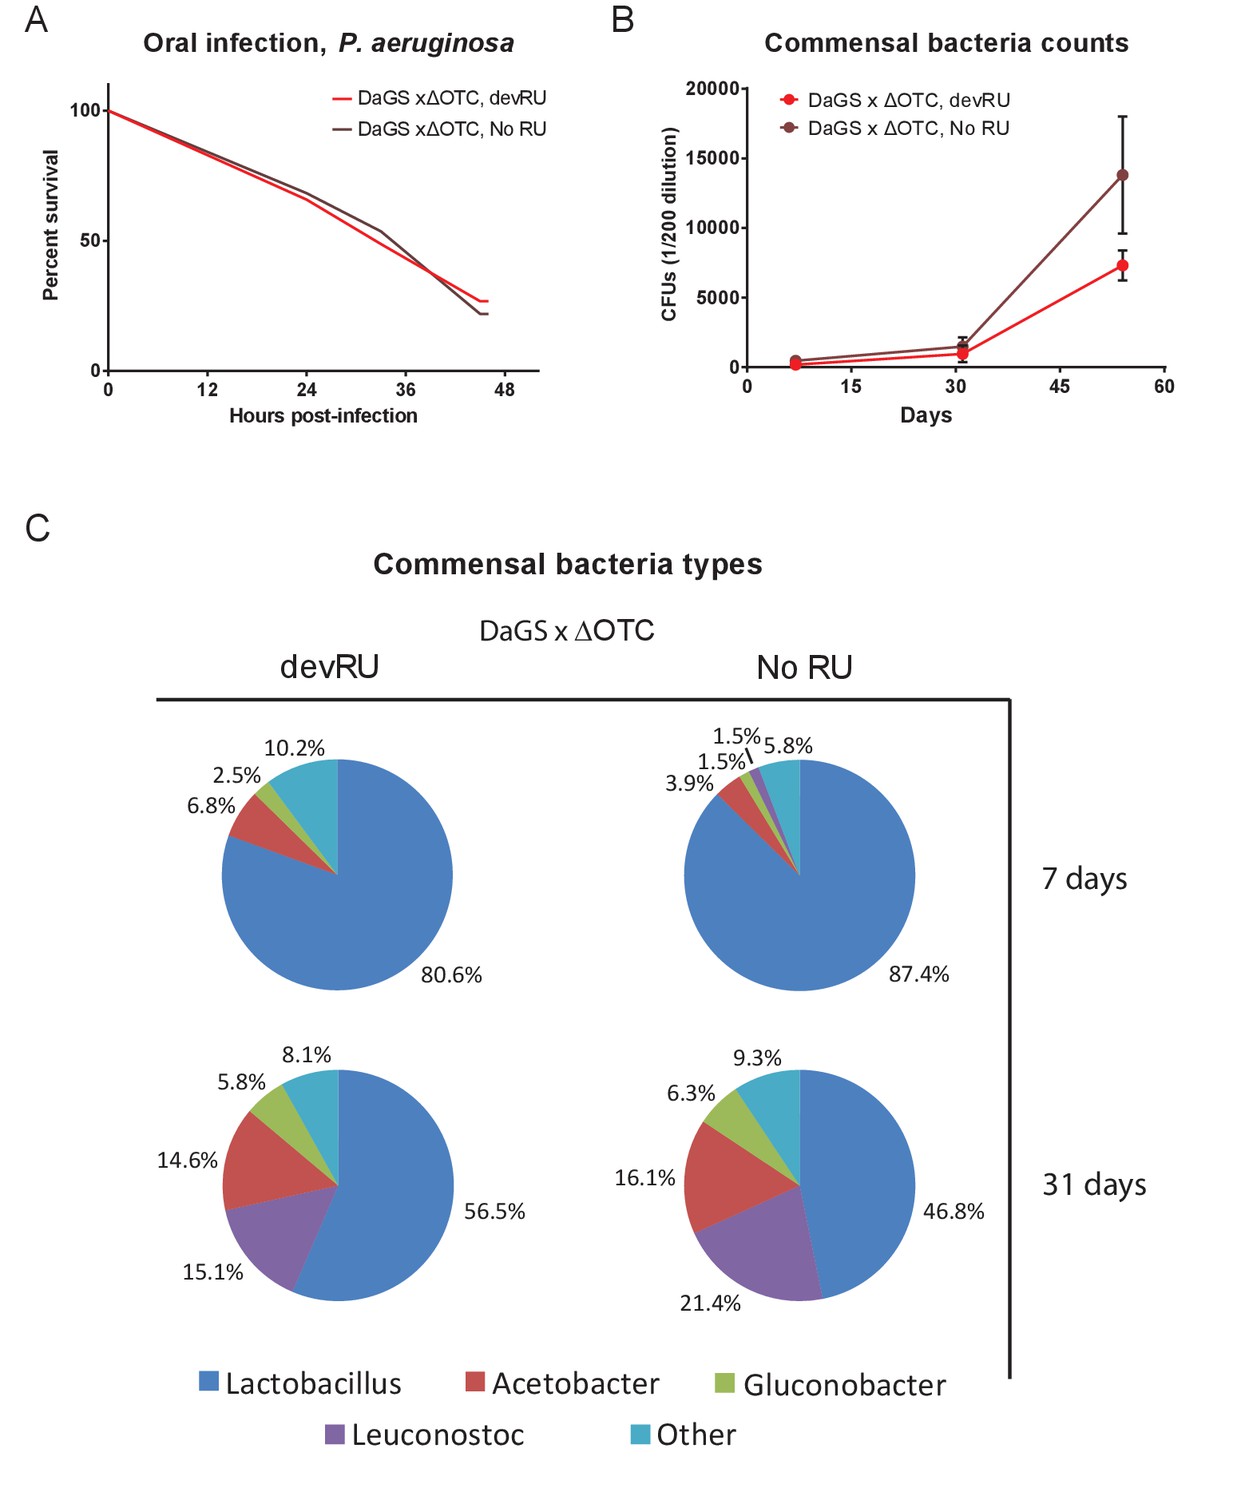
Developmental ΔOTC expression does not produce long-term changes in pathogen resistance or to the microbiome.
(A) Resistance to pathogenic P. aeruginosa, administered orally, is not changes in adult flies following developmental ΔOTC expression. (B) Commensal bacteria were quantified in early (7 d), mid (31 d) and late life (54 d), by plating intestinal extracts on non-selective plates. No significant difference is seen after developmental ΔOTC expression. (C) Microbiome composition was evaluated by 16S sequencing at 7 and 31 days. Again, no significant differences in distribution of genii was introduced by developmental ΔOTC expression.
Figure 2—figure supplement 4
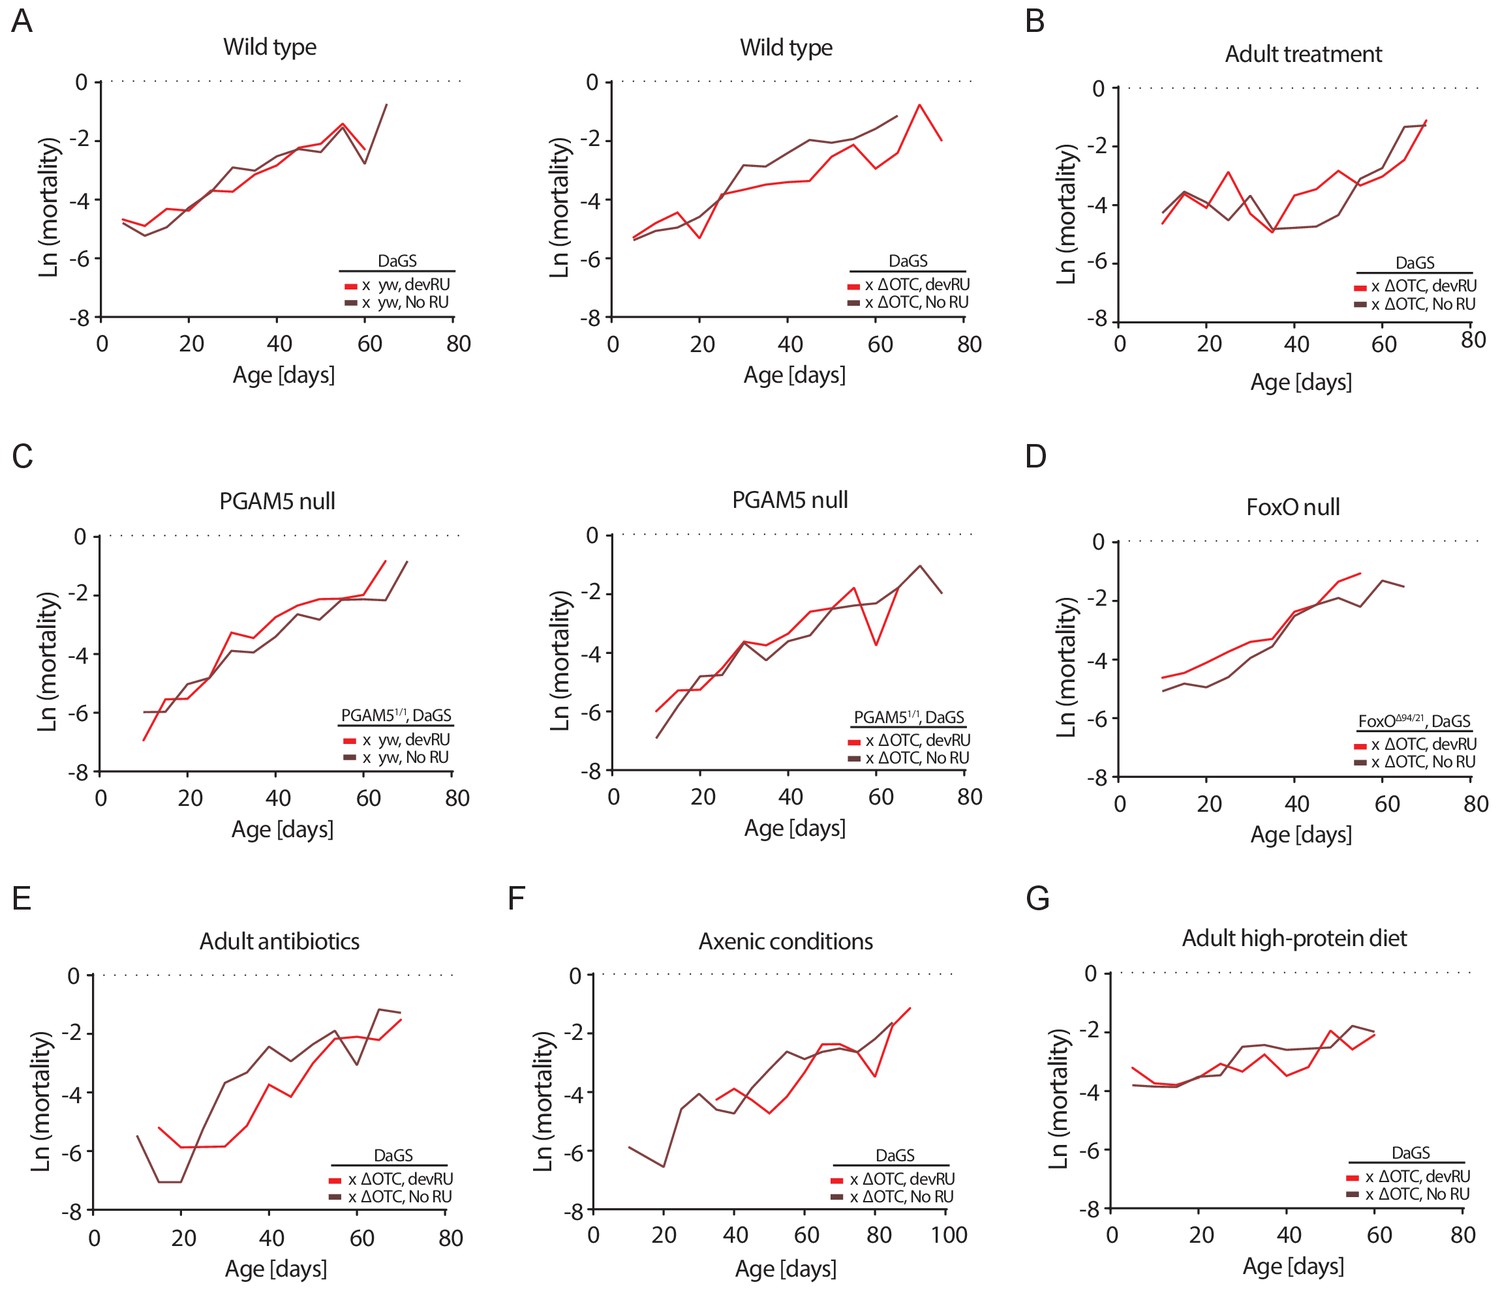
Mortality rates for all lifespan experiments.
Age-specific mortality (µx) was estimated as µx = -ln(px), where px is the probability of an individual alive during the previous interval surviving to interval x. As deaths were counted thrice weekly, mortality was binned to intervals of five days. Data matches lifespan curves in Figures 2 and 5: (A) Developmental ΔOTC expression, (B) adult ΔOTC expression, (C) developmental ΔOTC expression in a PGAM5 null background, (D) developmental ΔOTC expression in a FoxO null background, (E) developmental ΔOTC expression in flies fed antibiotics throughout adulthood, (F) developmental ΔOTC expression in flies raised in sterile conditions, and (G) developmental ΔOTC expression with adult flies receiving a high-protein diet. See Supplementary file 2 for complete life tables.
Figure 3 with 1 supplement

Developmental mitochondrial stress changes adult metabolism and leads to lasting activation of FoxO.
(A) Developmental ΔOTC expression does not affect the ratio of NAD/NADH in adult flies. (B) Developmental ΔOTC expression lowers steady-state triglyceride levels in adult flies, consistent with fat body FoxO activation. In PGAM5 null flies this effect is not seen. p-values are 0.011 and 0.567. (C) ΔOTC expression throughout development leads to increased nuclear localization of FoxO in the fat body of third instar larvae. This effect is neutralized in PGAM5 null larvae. p-values are <0.0001 and 0.0001. (D) Adult fat bodies show persistent nuclear FoxO localization after developmental stress. Flies were dissected 7 days after eclosion, with no adult ΔOTC expression. p-values are 0.002 and 0.002. (E) Larval and lasting FoxO translocation by the mitochondrial stress can be blocked by simultaneously administering the JNK inhibitor SP600125 (far left and left). p-values are 0.001 and <0.0001;<0.0001 and 0.0002. Similarly, 24 hr mitochondrial stress in adult flies leads to FoxO translocation, which is blocked by simultaneous expression of dominant negative bsk/JNK (right). p-values are <0.0001 and<0.0001. In contrast to developmental treatment, FoxO activation induced by adult ΔOTC expression does not persist 1 week after treatment is stopped (far right). p-values are <0.0001 and 0.96. All error bars are SEM from two independent experiments. Student’s t-test (B) or ANOVA with dunnett’s multiple comparisons (A, C–E); *p<0.05, **p<0.01, then each *=0.1 x. 200 µM RU486 used in all experiments. .
-
Figure 3—source data 1
Developmental mitochondrial stress changes adult metabolism and leads to lasting activation of FoxO.
- https://doi.org/10.7554/eLife.26952.014
Figure 3—figure supplement 1
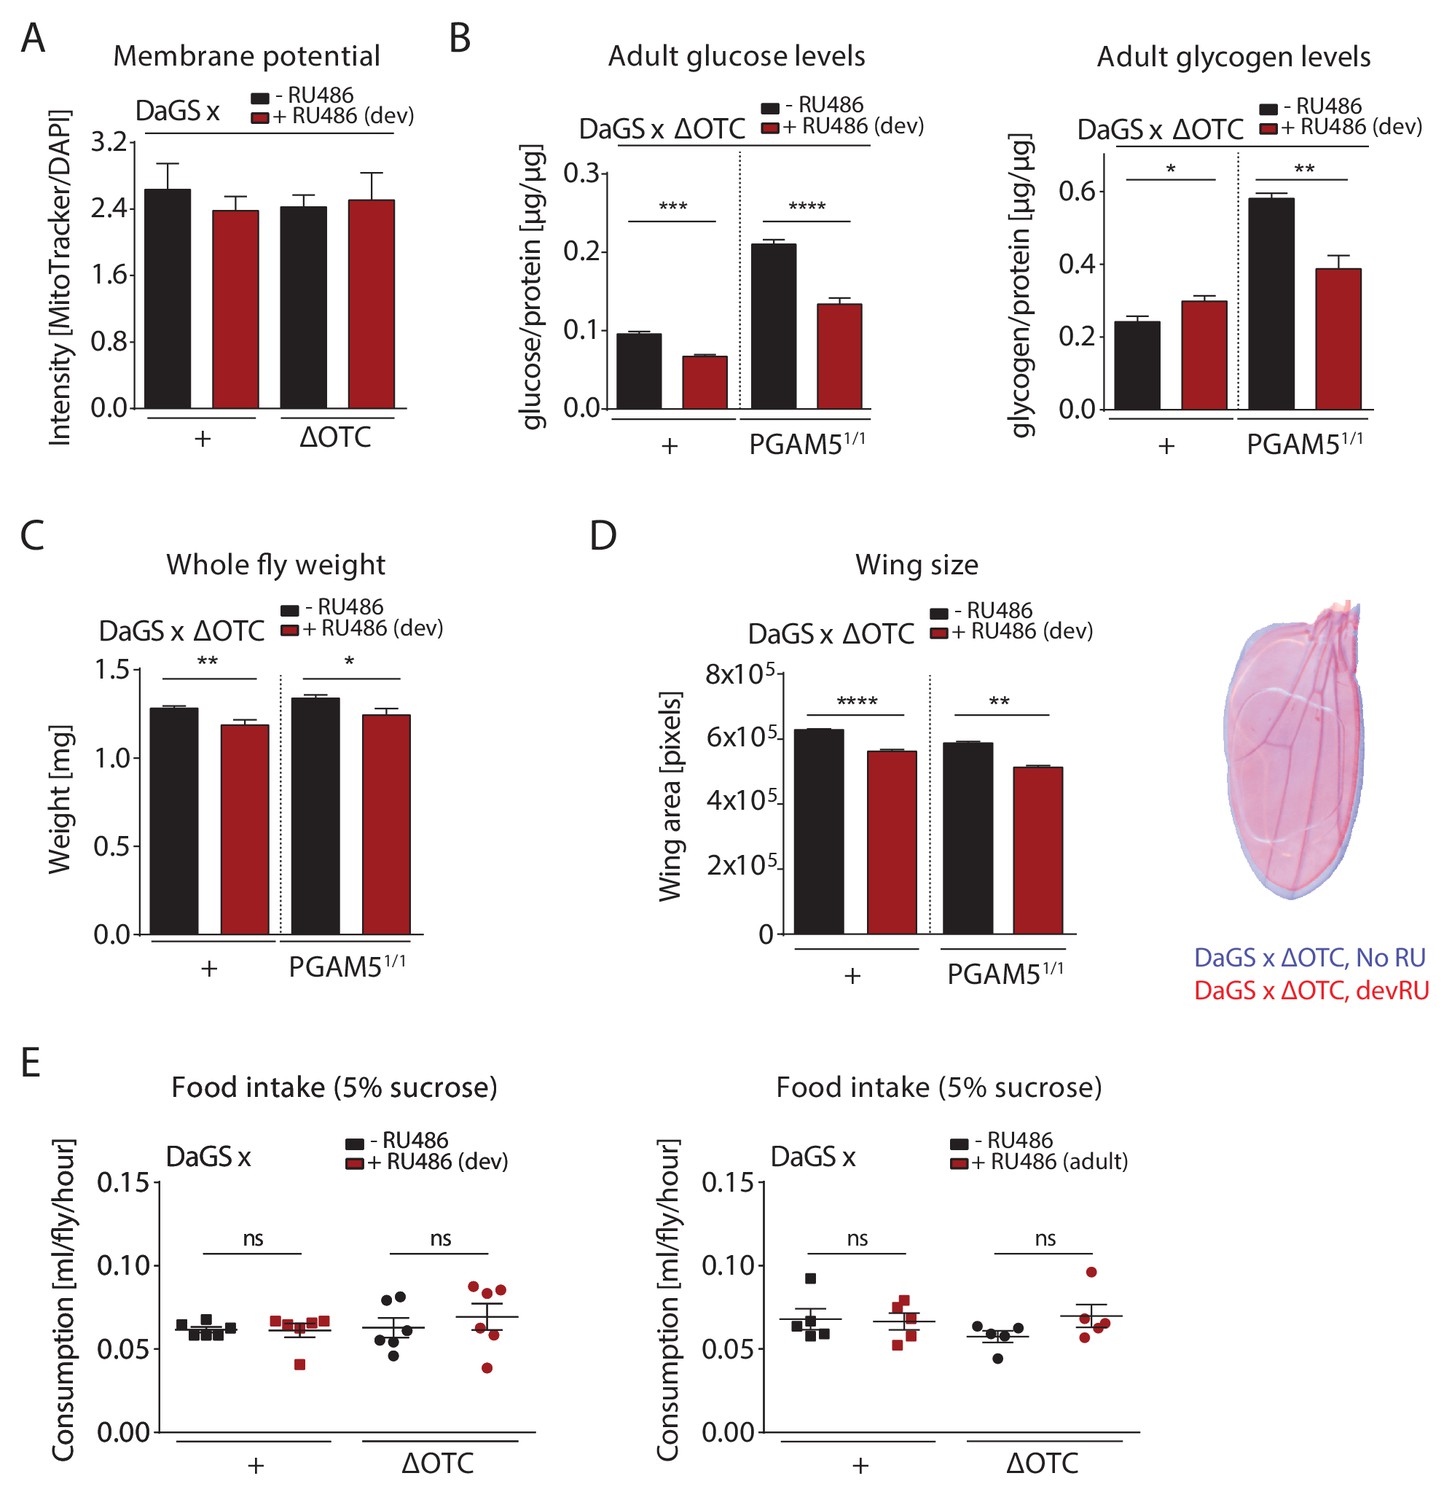
Metabolic effects of developmental ΔOTC expression.
(A) Developmental ΔOTC expression does not change mitochondrial content/membrane potential, as determined by relative intensity of MitoTracker to intensity normalized to DAPI. (B) Developmental ΔOTC expression leads to a slight increase in adult whole body glycogen stores, normalized to total protein. This effect is reversed in PGAM5 null flies. Adult whole body glucose levels in both wild type and PGAM5 null flies. (C) Adult body weight is reduced in both wild type and PGAM5 null flies after developmental ΔOTC expression. (D) Adult wing size is similarly reduced in both wild type and PGAM5 null flies after developmental ΔOTC expression. (E) Food intake is not affected in adult flies after developmental or acute ΔOTC expression, as determined by the CAFE liquid feeding assay.
Figure 4

Lasting transcriptional activation of FoxO targets after developmental stress.
(A) Venn diagram shows genes upregulated ≥3 x in fat bodies from third instar larvae undergoing mitochondrial proteostatic stress relative to untreated controls, where control FKMP ≥10. We separate genes whose upregulation depends on the identified stress signaling pathway (red) from those induced by other means (green), by comparing the transcriptional profile of PGAM5 null mutant larvae. Bar graphs show overrepresented Gene Ontology terms within each group of genes, showing mainly metabolic changes. Redundant GO terms were trimmed using REVIGO. (B) Venn diagram shows genes whose expression levels are persistently upregulated ≥3 x after developmental stress. All these genes were dependent on functional UPRmt signaling (i.e. not induced in PGAM5 nulls). Most of these genes correspond to heat-shock proteins. (C) Expression of the persistently upregulated genes is shown for all conditions, with FoxO target genes highlighted in red. Several of these have been shown to extend lifespan when overexpressed (see text). Full raw data found in Suppl. File 1. 200 µM RU486 was used.
Figure 5 with 2 supplements

ΔOTC-mediated FoxO activity is regulated by diet, through mTORC1 and GCN-2.
(A) Adult flies show nuclear localization of FoxO after developmental ΔOTC expression. After 9 hr of wet starvation, FoxO is nuclear in treated and untreated flies alike. 24 hr of refeeding returns FoxO to the cytoplasm in untreated flies, but does not reset the effect of developmental stress. p-values are (pre to starved) 0.517 and 0.031, (starved to refed) 0.723 and 0.001. (B) FoxO nuclear localization following developmental stress is reset by 5 days on a high-protein diet, but not a pure sucrose diet. Feeding rapamycin at 200 µM to inhibit mTORC1 with the high-protein diet blocks this effect. p-values are (±RU) 0.007, (+RU vs diets) 0.790, 0.915,<0.0001 and 0.338, (HPD ± rapa) 0.001. (C) Knocking down TSC1 during developmental ΔOTC expression blocks persistent activation of FoxO in adults (left). Conversely, overexpressing the mTORC1 inhibitors TSC1 and two in adult flies is sufficient to change FoxO localization absent mitochondrial stress (right). p-values are <0.0001 and 0.0027. (D) Knocking down GCN-2 during developmental ΔOTC expression is sufficient to block persistent FoxO activation (left). p-values are 0.0005 and 0.0006. Overexpressing the GCN-2 kinase in larvae produces FoxO nuclear localization similar to the effect of mitochondrial stress (right). p-values are (ΔOTC vs UAS-GCN2) 0.703 and (UAS-GCN2 ±RU)<0.0001. (E) Inhibiting mTOR with 200 µM rapamycin is sufficient to induce nuclear FoxO localization. This effect is blocked by RNAi of GCN-2, suggesting a downstream role for this kinase. p-values are 0.032 and 0.602. (F) Developmental ΔOTC expression does not extend lifespan when flies are fed a high-protein diet throughout adulthood, consistent with a requirement for persistent FoxO activity. All error bars are SEM from 2 + independent experiments. ANOVA with Tukey’s (A-B) or dunnett’s (D) post-hoc, or student’s t-test (C and E); *p<0.05, **p<0.01, then each *=0.1 x. 200 µM RU486 used in all experiments.
-
Figure 5—source data 1
ΔOTC-mediated FoxO activity is regulated by diet, through mTORC1 and GCN-2.
- https://doi.org/10.7554/eLife.26952.019
Figure 5—figure supplement 1
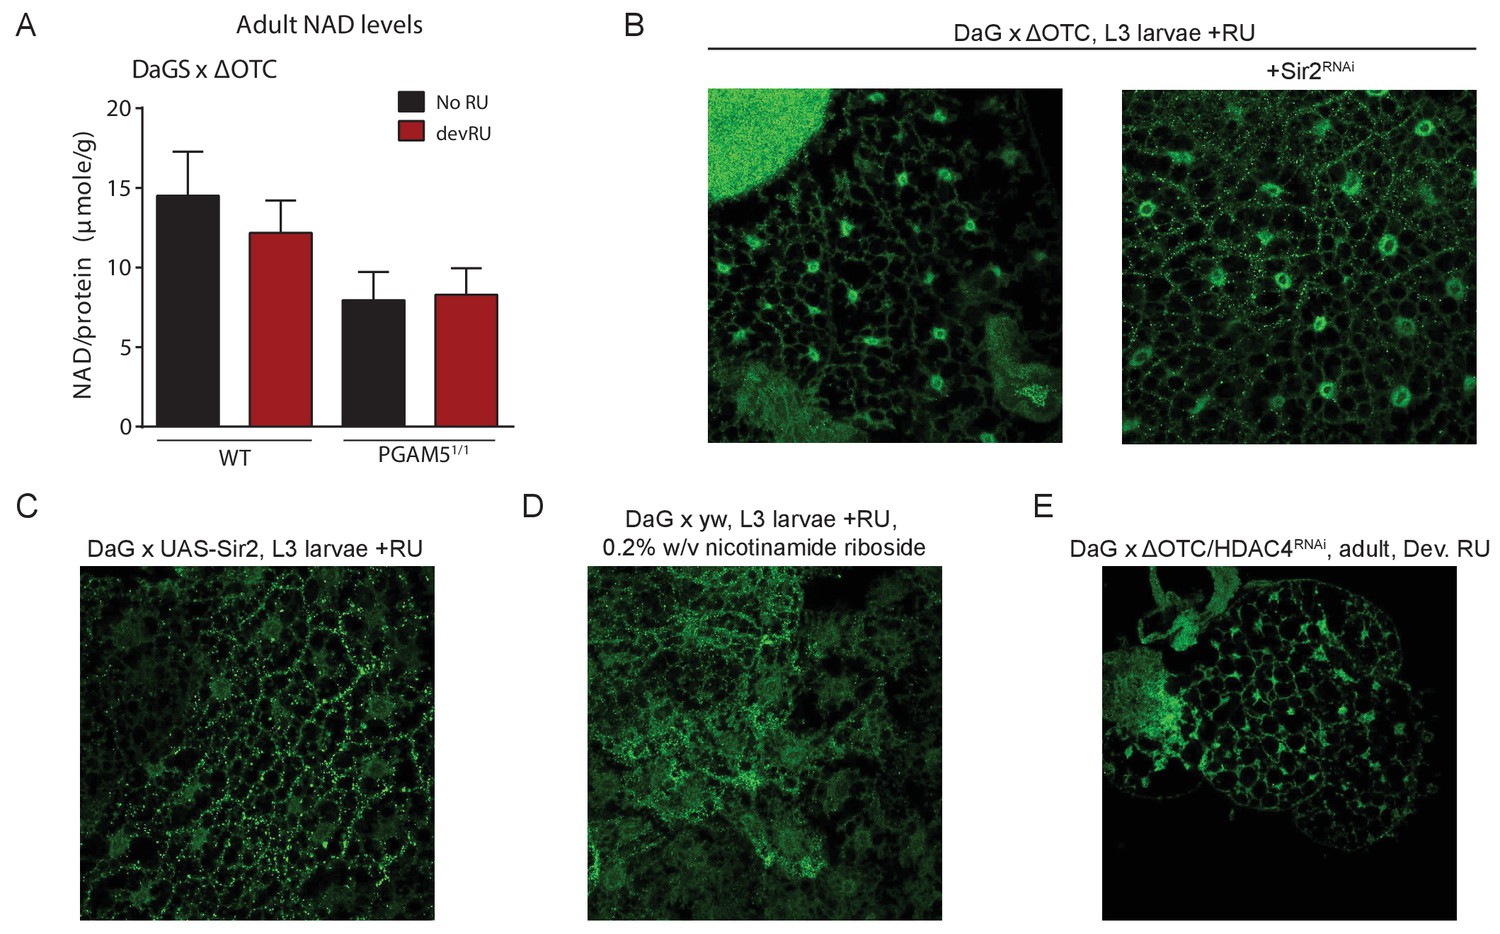
Lasting FoxO activation is not mediated by NAD-dependent histone deacetylases.
(A) Absolute levels of NAD + are not increased by developmental ΔOTC expression. (B) Knocking down the Sir2 deacetylase during developmental ΔOTC expression does not prevent FoxO activation in the larval fat body. (C) Overexpressing the Sir2 deacetylase in not sufficient to activate FoxO activation in the larval fat body. D) Supplementing the NAD precursor nicotinamide riboside does not lead to FoxO activation in the larval fat body. (E) Knocking down the histone deacetylase HDAC4 during developmental ΔOTC expression does not prevent FoxO activation in the larval fat body.
Figure 5—figure supplement 2
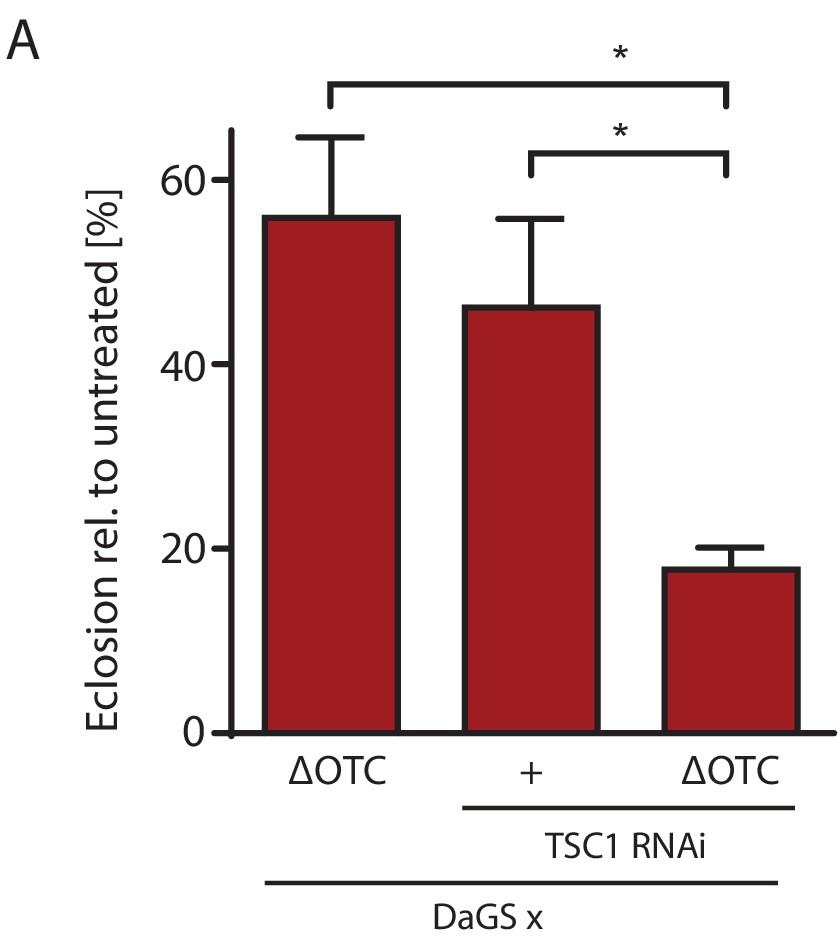
mTOR activation impairs survival through developmental stress.
(A) Knocking down TSC1 to activate mTORC1 during development ΔOTC expression strongly reduces survival, beyond the effect of the individual treatments. This fits with the observation that mTORC1 activity blocks FoxO activation (Figure 5), which is required for survival through developmental stress (Figure 2—figure supplement 1). Error bars are SEM of three independent experiments; *p<0.05, **p<0.01, then each *=0.1 x. 200 µM RU486 used in all experiments.
Figure 6

Proposed model for UPRmt-mediated longevity.
https://doi.org/10.7554/eLife.26952.020Additional files
-
Supplementary file 1
Raw data for RNA sequencing experiments in Figure 1 and 4.
- https://doi.org/10.7554/eLife.26952.021
-
Supplementary file 2
Life tables for all longevity experiments.
- https://doi.org/10.7554/eLife.26952.022
-
Transparent reporting form
- https://doi.org/10.7554/eLife.26952.023
Download links
A two-part list of links to download the article, or parts of the article, in various formats.
Downloads (link to download the article as PDF)
Open citations (links to open the citations from this article in various online reference manager services)
Cite this article (links to download the citations from this article in formats compatible with various reference manager tools)
PGAM5 promotes lasting FoxO activation after developmental mitochondrial stress and extends lifespan in Drosophila
eLife 6:e26952.
https://doi.org/10.7554/eLife.26952


