A connectome of a learning and memory center in the adult Drosophila brain
- Janelia Research Campus, Howard Hughes Medical Institute, United States
Figures
Figure 1
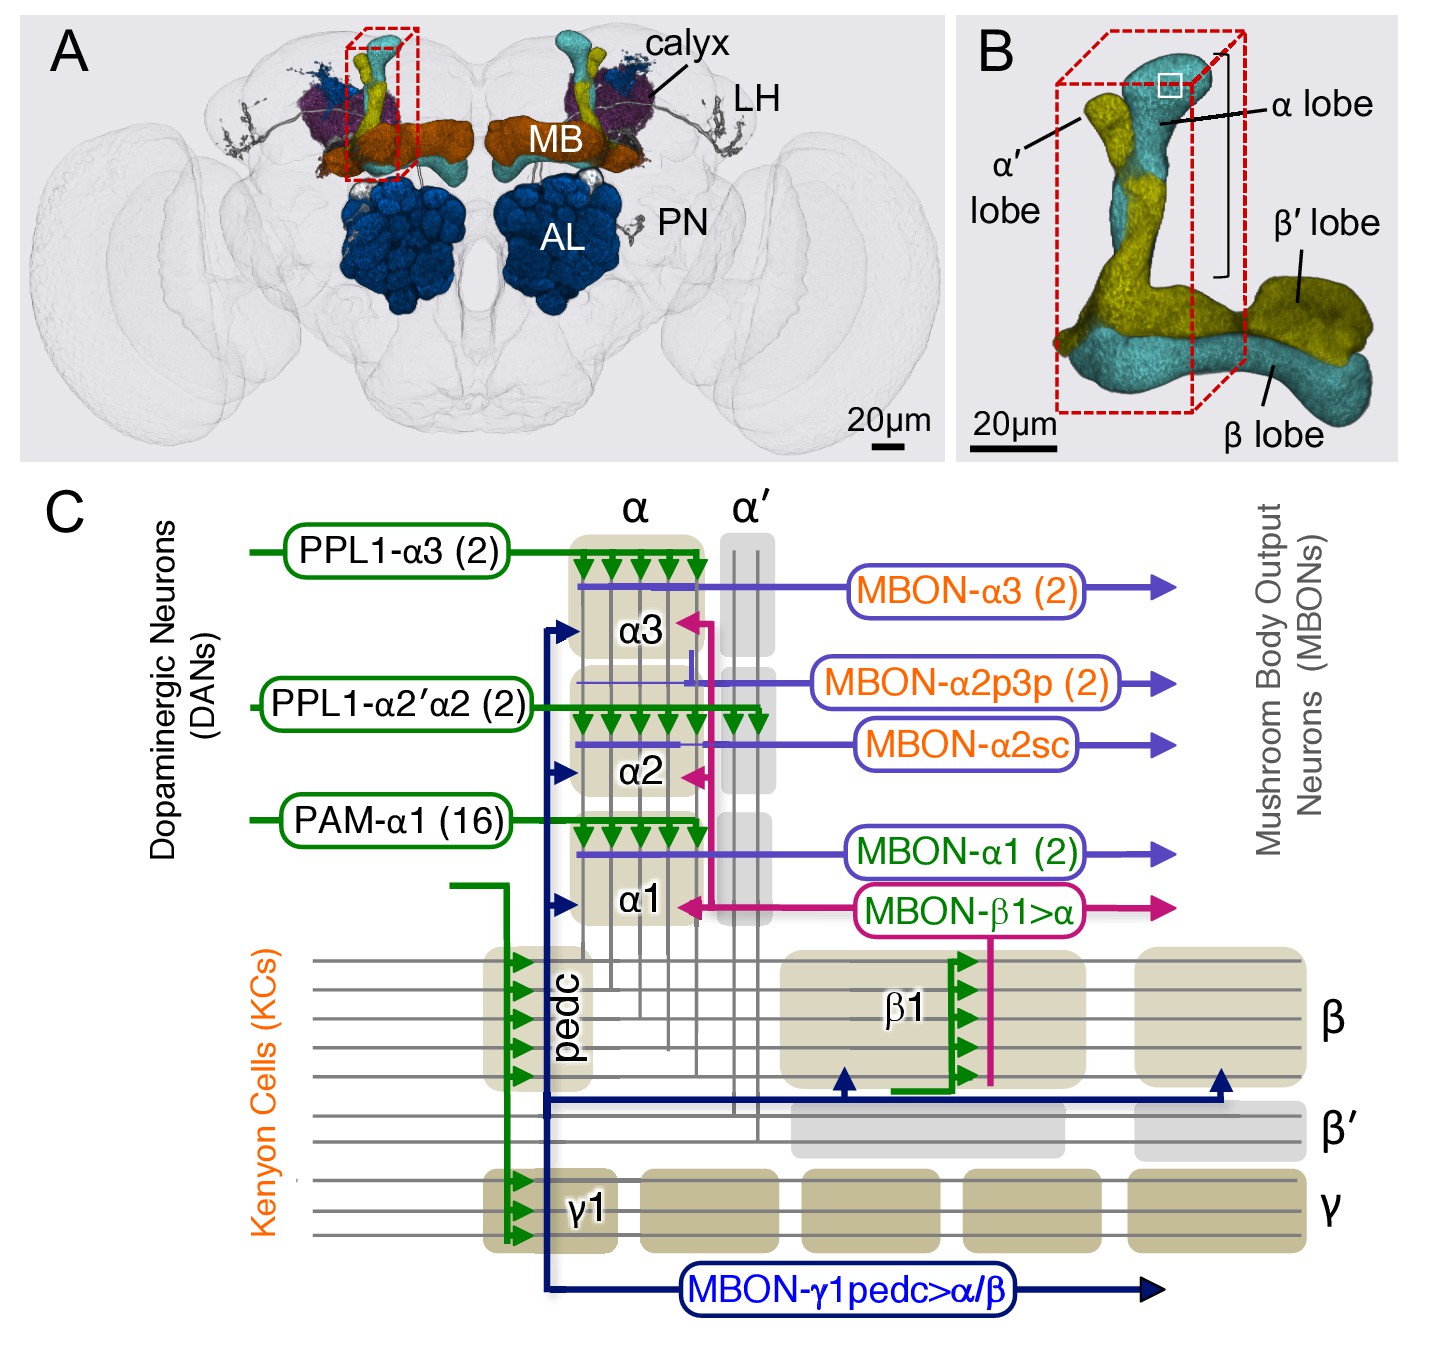
Diagram of the α lobe of the mushroom body.
(A) An image of the adult brain showing the antennal lobes (AL), the mushroom bodies (MB) and an example of one of the ~50 types of projection neurons (PN) that carries olfactory information from the AL to the MB calyx and the lateral horn (LH). See Aso et al. (2014a) for more detail. The approximate position of the ~40 × 50 x 120 μm volume imaged by FIBSEM is indicated by the red dashed lines. (B) Magnified view of the α/β lobes showing the imaged volume. The α/β neurons bifurcate in the α1 compartment and project to the α and β lobes. The white box indicates the portion of the α3 compartment shown in Video 2. (C) Simplified diagram of the circuit organization in the α lobe. The projection patterns of the axons of dopaminergic neurons (DANs) and the dendrites of the MB output neurons (MBONs) onto the parallel axonal fibers of Kenyon cells define three compartmental units in the α lobe. The DANs (green) and MBONs with dendrites in the α1, α2 and α3 compartments (purple), known from previous light microscopic studies (see Aso et al., 2014a for more detail), are indicated. Arrows indicate the main presynaptic sites of each of the extrinsic neuron types. The names of neurons (shown in the rectangles with rounded corners) are color-coded to reflect their main neurotransmitter: black, dopamine; orange, acetylcholine; green, glutamate; blue, GABA. In addition to MBONs with dendrites in the α lobe, all three compartments receive projections from the GABAergic MBON-γ1pedc>α/β (dark blue) and the glutamatergic MBON-β1>α feedforward neurons (magenta), whose dendrites lie in other MB lobes.
Figure 2
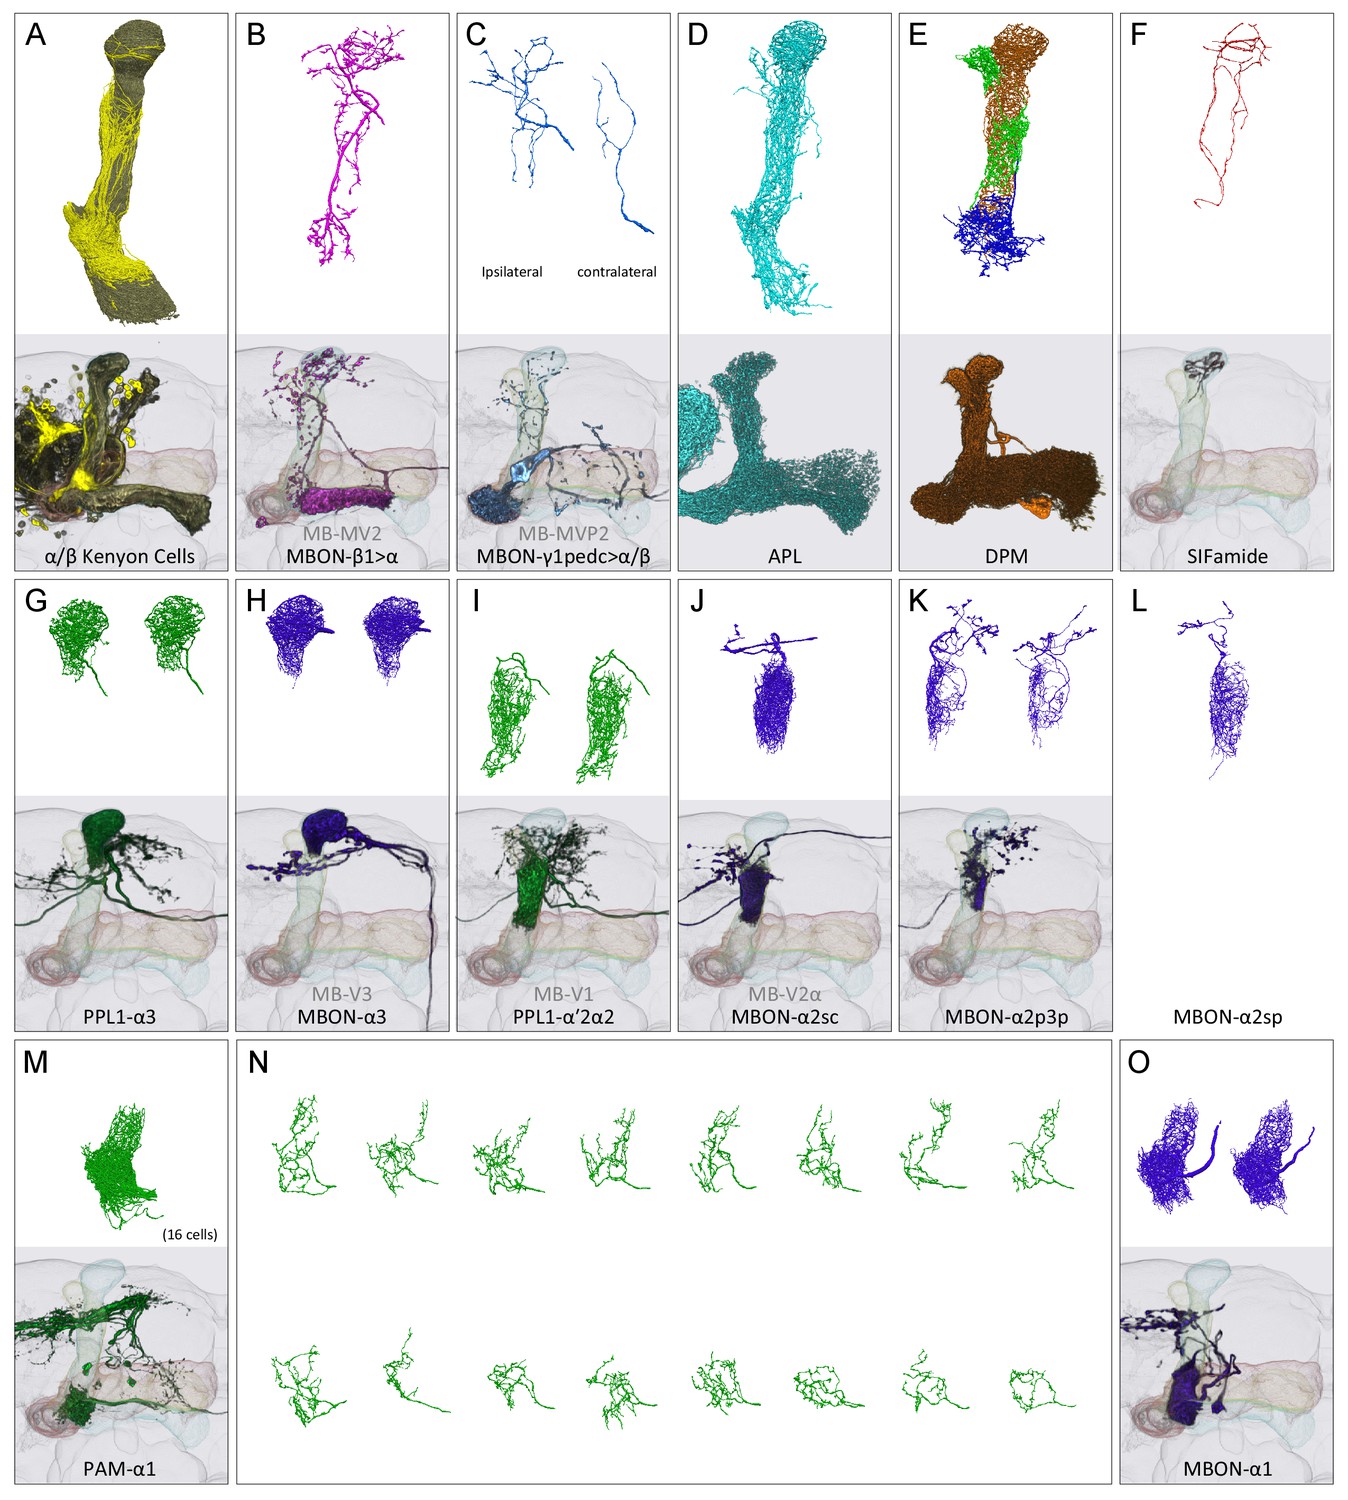
Reconstructions of cells present in the α lobe.
In panels (A-M) and (O), the upper image shows EM reconstructions generated as part of this study and the lower image shows the same cell type, segmented from previously acquired light microscopic images (Aso et al., 2014a). The EM reconstructions are limited to that portion of the neurons found in the α lobe, while the light images show the portion of each neuron found in the entire MB. (A) A total of 949 α/β Kenyon cells (KCs) were traced: 871 surface and core KCs (khaki); 78 posterior KCs (yellow). (B) The glutamatergic feedforward neuron, MBON-β1>α, arborizes in all three compartments of the α lobe. (C) The arborizations of the ipsi- and contralateral MBON-γ1pedc>α/β, GABAergic feedforward neurons, are shown separately in the upper panel. (D) The GABAergic APL neuron arborizes throughout the MB lobes and calyx. (E) The DPM neuron arborizes throughout the MB lobes. (F) The SIFamide neuron arborizes very widely, extending throughout the brain; only the αlobearborizations are shown. Panels (G-M) and (O) show compartment-specific MB output neurons (MBONs) and dopaminergic neurons (DANs). The α3 compartment has the axonal terminals of two DANs, PPL1-α3 (G), and the dendrites of two MBONs, MBON-α3 (H). The α2 compartment has two DANs, PPL1-α’2α2 (I), and four MBONs: a single MBON-a2sc (J); two MBON-α2p3p (K); and one newly found MBON, MBON-α2sp (L). The α1 compartment has 16 DANs, PAM-α1 (M in aggregate and N as individual cells), and two MBONs, MBON-α1 (O).
Figure 3
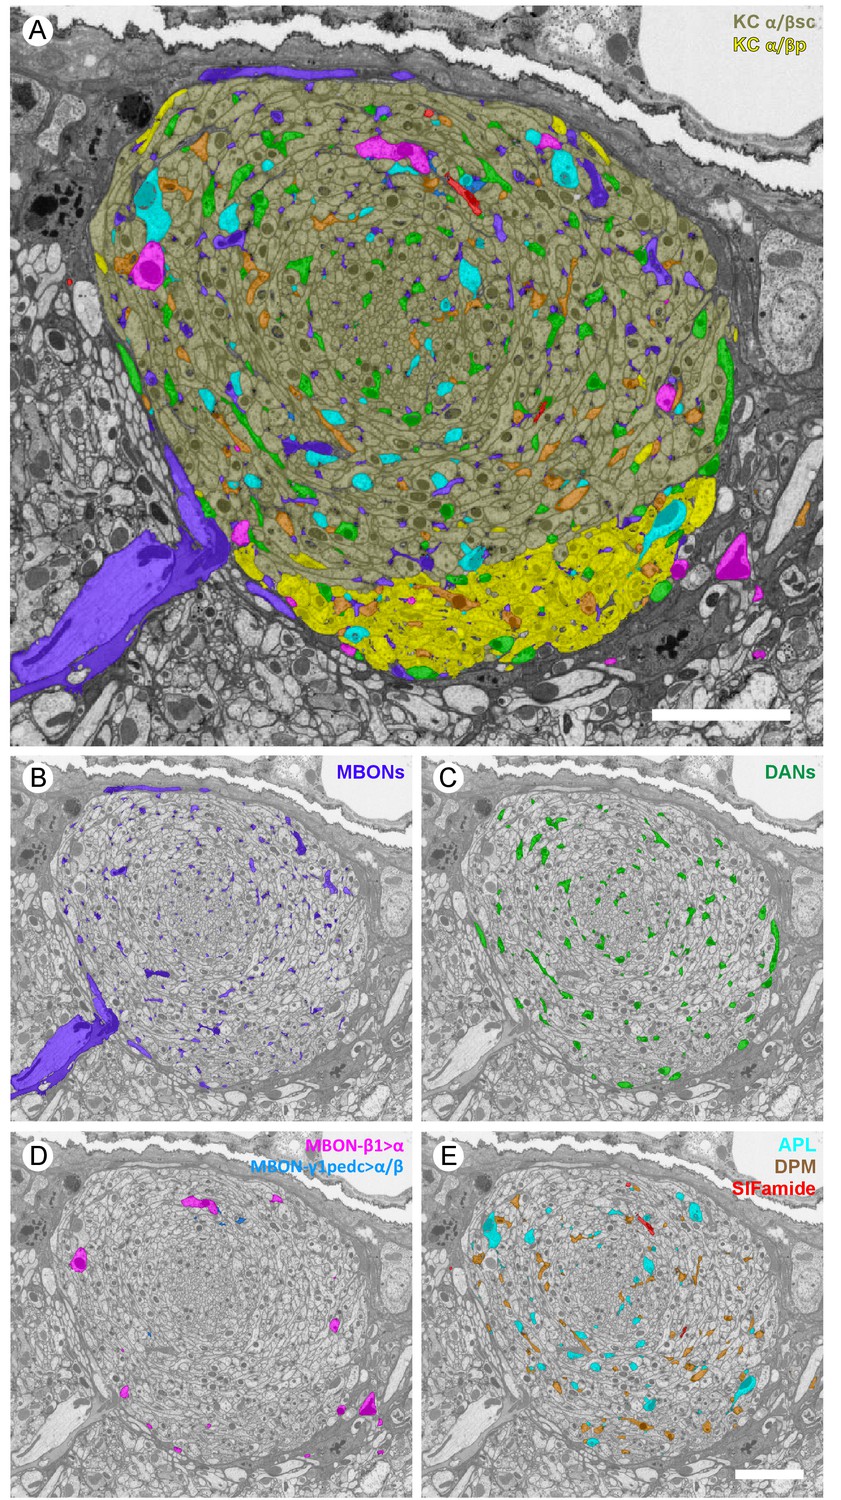
Profiles of reconstructed neurons in an EM cross-section at the depth of α3.
(A) All the reconstructed neurons that have neurites at this depth are color-labeled using the same color scheme as in Figure 2. (B-E) Subsets of cell types are shown separately: (B) dendrites of the two MBON-α3 cells; (C) axonal projections of the two PPL1-α3 DANs; (D) axonal feedforward projects of MBON-β1>α and MBON-γ1pedc>α/β, of which only a few small profiles can be seen in a single section; and (E) APL, DPM and SIFamide neurons. Scale bars: 5 µm.
Figure 4 with 2 supplements
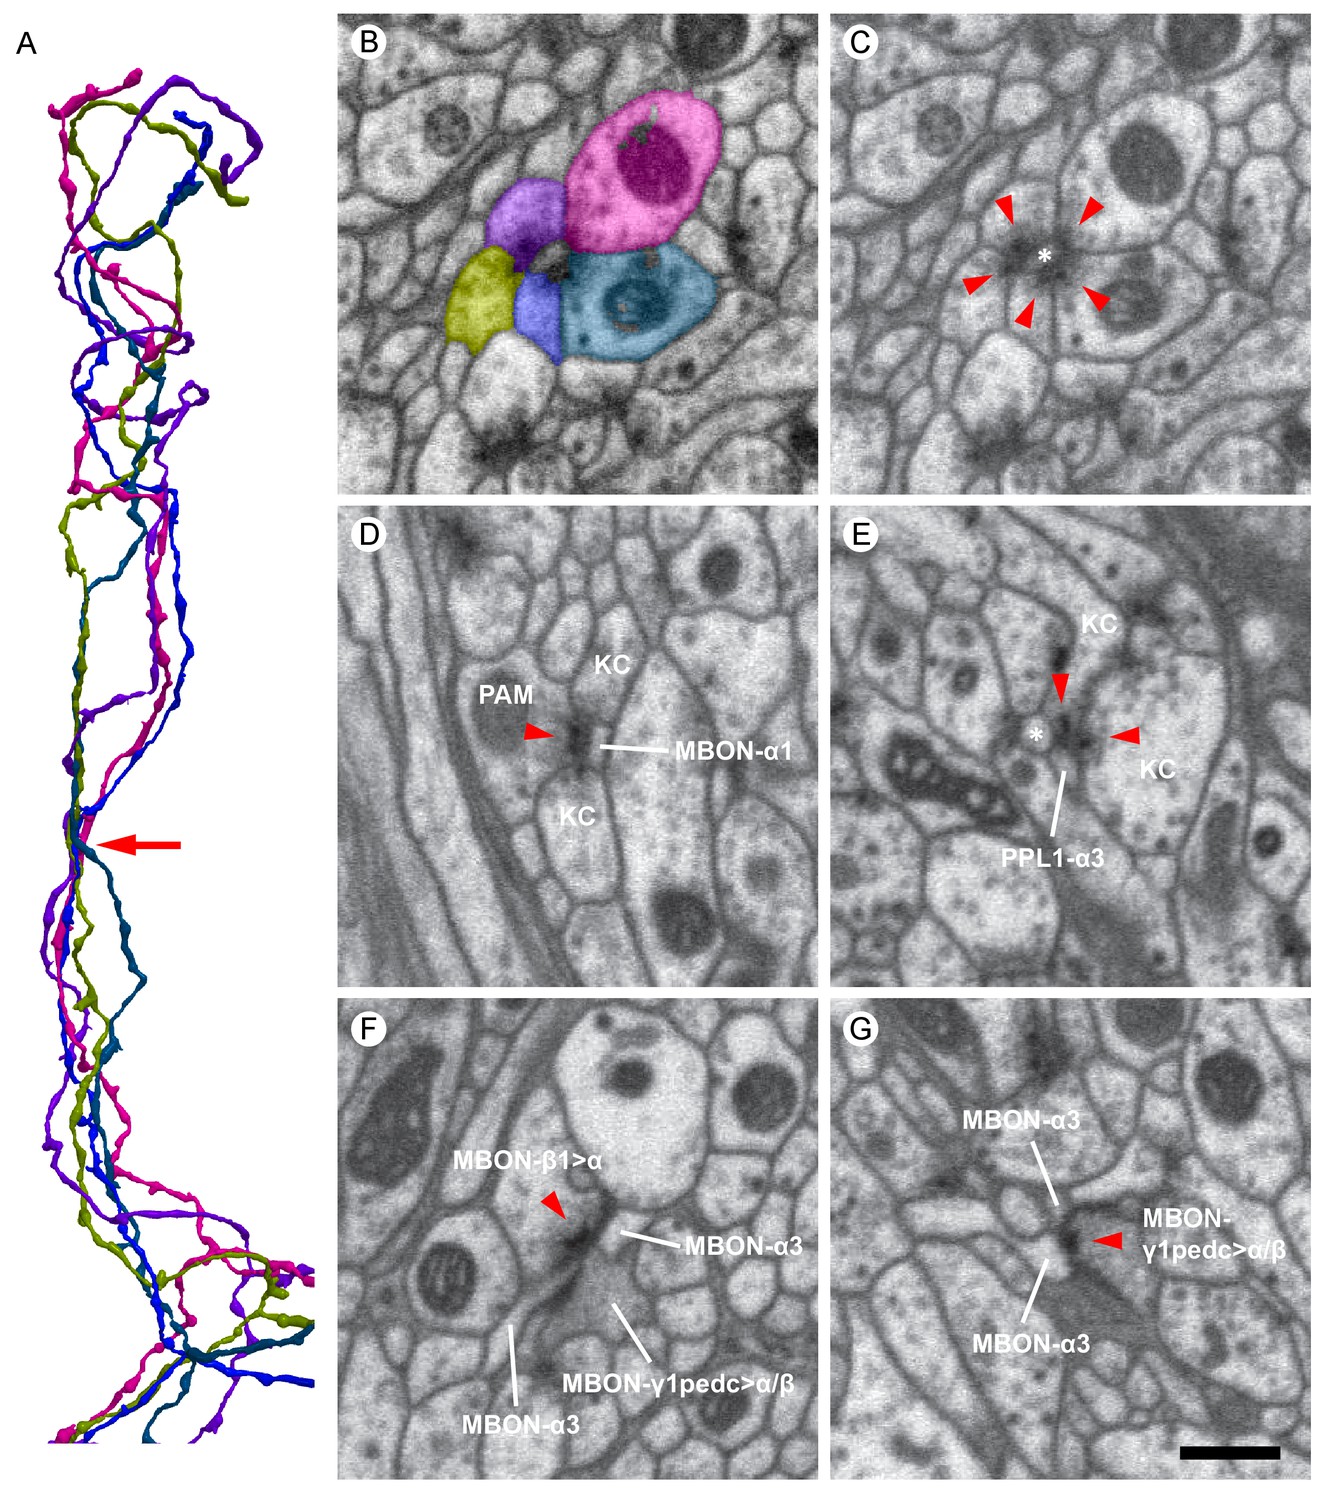
Examples of synaptic motifs in the α lobe.
(A) Five KCs are shown, converging once in the α lobe to form a rosette synapse (arrow). (B,C) EM cross-section of the rosette synapse formed by these five KCs. Each KC is colored in (B) with the same color as the corresponding reconstructed cell in (A). (C) The same EM image as (B) with a dendrite of an MBON (asterisk). Presynaptic specializations of the KCs are indicated by red arrowheads at which KCs contact with both the MBON and neighboring KC. (D) A PAM-α1 dopaminergic neuron synapses onto MBON-α1 and KCs in the α1 compartment; the red arrowhead marks the presynaptic specialization in PAM-α1. (E) Two KCs synapse onto a PPL1-α3 dopaminergic neuron. An adjacent MBON (asterisk) also appears to receive input from one of these KCs. (F) The MBON-β1>α feedforward neuron makes an axon-axonal synapse onto the MBON-γ1pedc>α/β feedforward neuron, as well as a synapse onto MBON-α3 dendrites, in the α3 compartment; the presynaptic specialization in MBON-β1>α is marked by a red arrowhead. (G) The MBON-γ1pedc>α/β feedforward neuron synapses onto MBON-α3 dendrites; the presynaptic specialization in MBON-γ1pedc>α/β is marked by a red arrowhead. Scale bar: 500 nm, applies to panels (B)-(G).
Figure 4—figure supplement 1
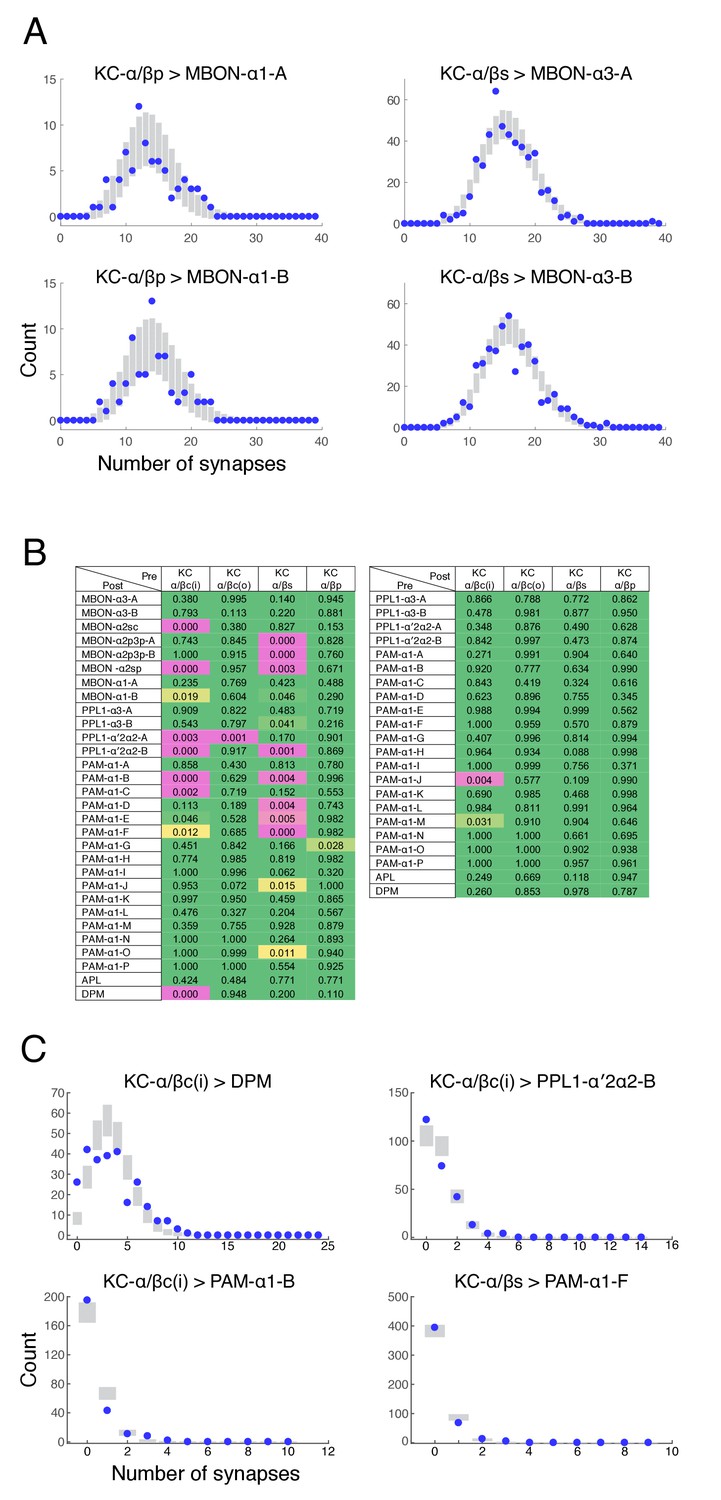
Poisson distribution of KC output connectivity.
(A) The number of synapses made by individual KCs onto each of the two pairs of output neurons from the α3 and α1 compartments (KC-α/βs > MBON-α3 and KC-α/βp > MBON-α1). Points represent experimentally observed synapse numbers, bars represent SD of Poisson fits to the experimental distributions. Both MBONs within each compartment show similar distributions, all of which show Poisson statistics. (B) Poisson statistics of KC connectivity. Each entry is a p-value expressing the likelihood that the observed distribution of synapse numbers is compatible with a Poisson distribution of the same mean. Connections where KCs were pre-synaptic (left) and post-synaptic (right) were evaluated independently. Green entries are statistically indistinguishable from Poisson (p>0.05), magenta entries are more than three sigma different (p<0.003), and yellow entries are intermediate. Most distributions were not significantly different from Poisson. (C) Distributions of synapse numbers for connection types whose distribution showed the strongest deviation from Poisson in (B). Our reconstructions showed that the KC-α/βc(i) > DPM connections deviate from Poisson likely because DPM processes do not strongly innervate the very core of the α-lobe. The other examples deviate because a few cells are connected with high numbers of synapses, which a Poisson distribution predicts is very unlikely.
Figure 4—figure supplement 2
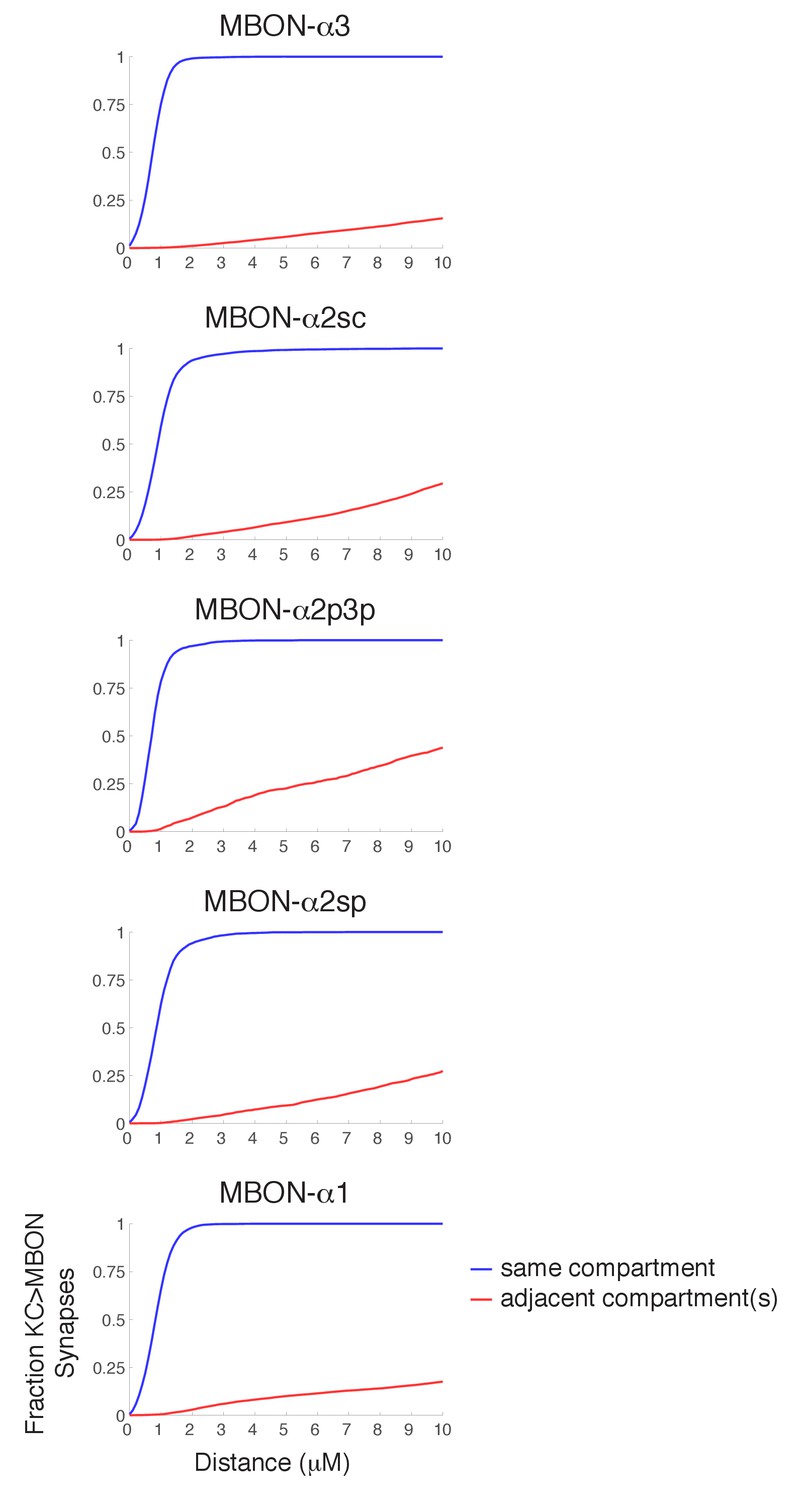
Synapse specificity with volume transmission of dopamine.
Plots show the fraction of KC>MBON synapses with a dopaminergic output synapse within the indicated range. Blue lines show cumulative fraction with dopaminergic synapse from the same compartment, red line represents cumulative fraction with a DAN output in an adjacent compartment. These plots indicate that there is a wide tolerance for volume transmission in every compartment; essentially all KC>MBON synapses are within a two micron diffusion range of a DAN synapse from the same compartment, yet much larger diffusion distances would be necessary for DAN outputs in other compartments to reach them.
Figure 5

Images from the higher resolution dataset and examples of the distribution of synapses on a KC.
(A) A triangular motif of KC<>KC>MBON synapses. Presynaptic densities in two adjacent KCs (arrowheads) contact to an MBON (asterisk); the KCs also appear to make reciprocal contacts. (B) A rosette synapse formed by a postsynaptic MBON (asterisk) surrounded by five KCs. (C) The α3 and α2 portion of a core KC that has a total of 63 presynaptic sites in the α lobe (red puncta) is shown. This KC makes 49 synapses onto MBONs; the remaining 14 synapses are onto other cell types such as APL and DPM. (D) Sites where the same KC as in (C) is postsynaptic (black puncta) are also shown: Of the 114 inputs this KC receives in the α lobe, 94 come from 65 other core KCs; 13 from 11 different surface KCs; four from DANs (three times in α3 and once in α1); and three from APL. Note that because multiple synapses can occur in close proximity, the number of distinct puncta visible is smaller than the number of synapses and that red and black puncta are often co-localized, indicating the KC is pre- and postsynaptic at the same site on its axon. (E) We found three kinds of synaptic vesicles in neurons in the α lobe: rounded clear vesicles (white arrowheads), small-rounded dense-core vesicles (yellow arrowheads), and larger dense-core vesicles (double-arrowheads). Scale bars: 500 nm in (A, B, E).
Figure 6
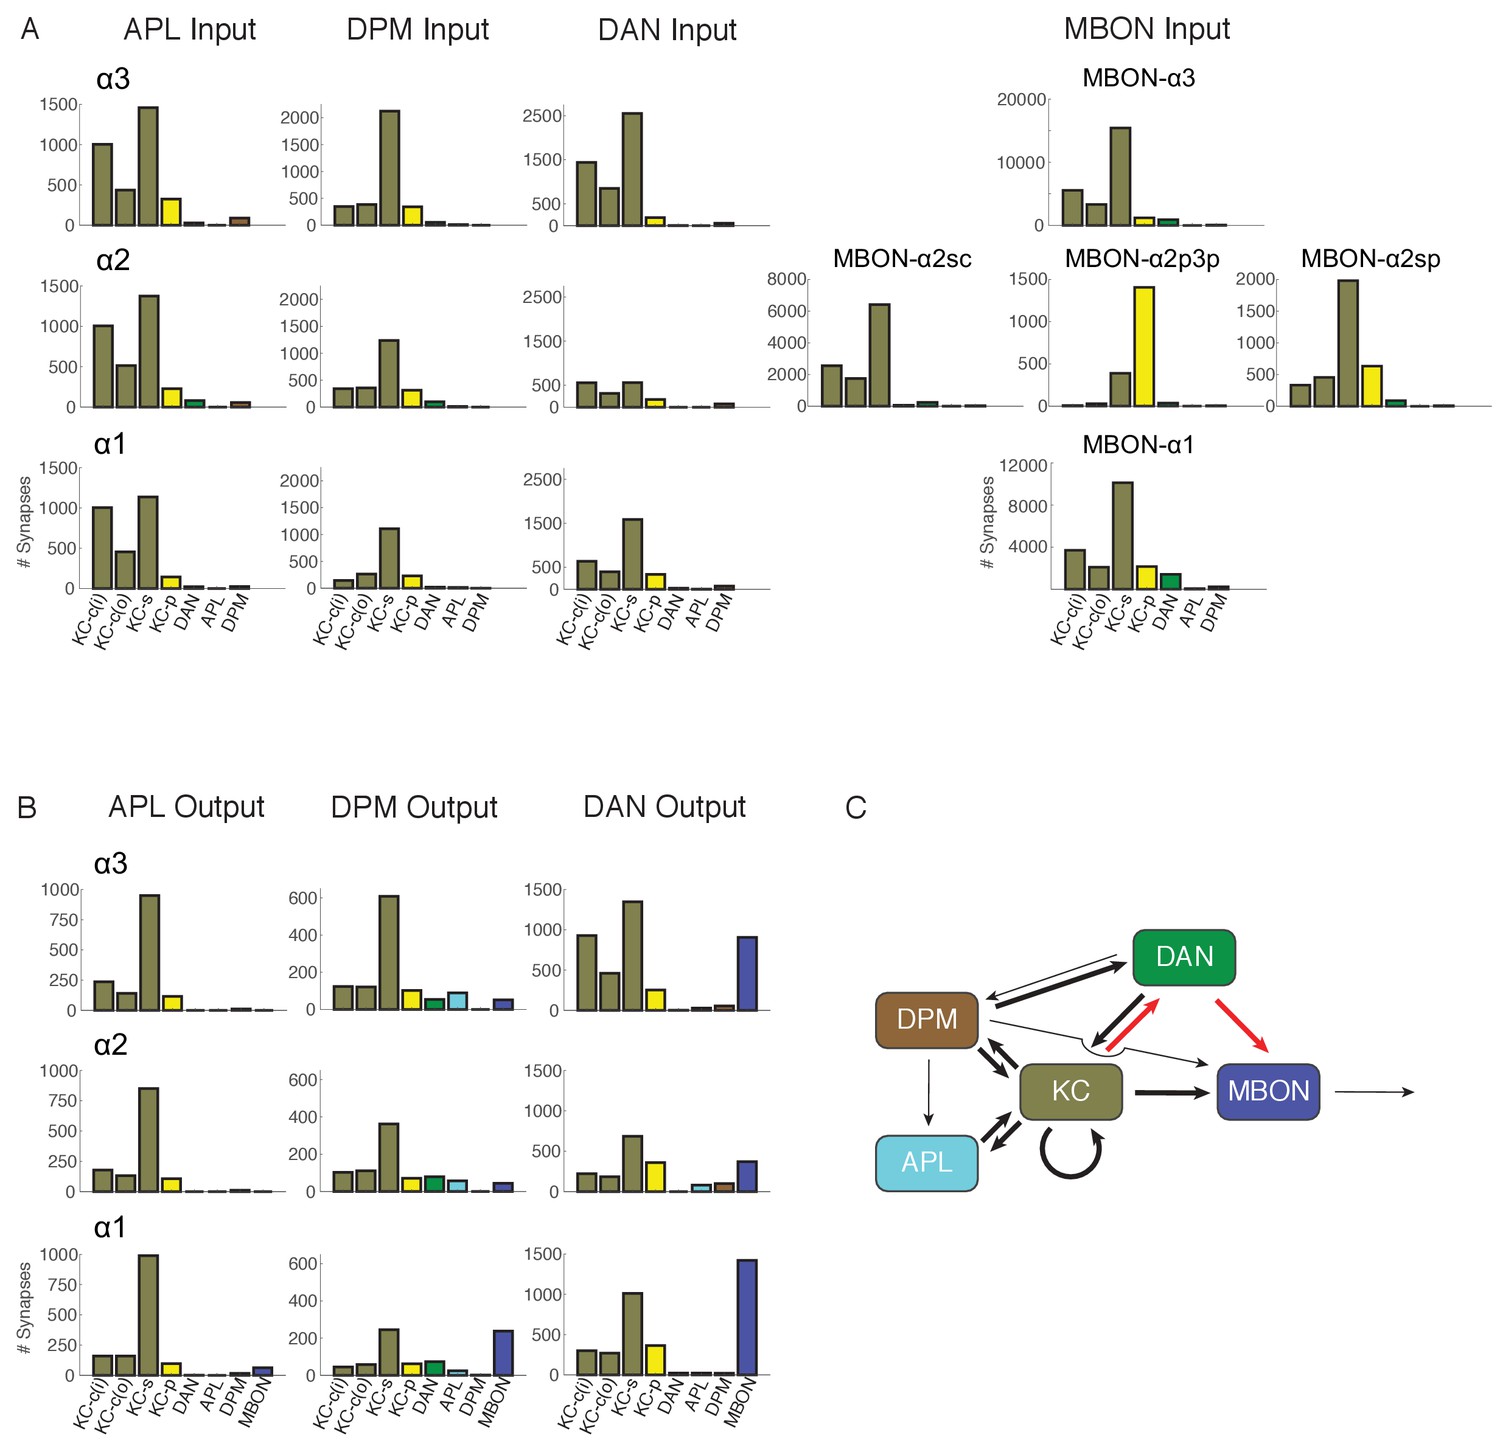
Connectivity profiles of the different neuron classes in the lobes.
(A) Input profiles of different cell types within each α lobe compartment. All cells within a cell type are combined, so for example DAN inputs in the α1 compartment represent the inputs to all 16 PAM-α1 neurons, while in α2 it is the two PPL1-α′2α2 neurons and in α3 it is the two PPL1-α3 cells. Bar heights indicate the total number of input synapses from the different sources, with KC-c(i) indicating α/β KCs from the inner core, and KC-c(o) the outer core. The feedforward MBONs were omitted from these profiles; see Table 5 for the distribution of their synaptic outputs. The input profiles of the DANs and particularly the MBONs are quite distinct in each compartment. By comparison, APL and DPM input profiles are very similar across compartments, suggesting they uniformly pool input from multiple compartments. (B) Output profiles. Note the overall similarity of output connectivity of APL and DPM across all three compartments – aside from the numerous DPM>MBON connections observed in α1. Again, this contrasts with the output profiles of the DANs, which are quite different in each compartment. Note that we did not find any output sites of MBONs, except for ones providing feedforward input from other compartments, indicating that MBONs are strictly dendritic inside the lobe (C) Primary connectivity motifs observed. Thick arrows indicate connections composed of >200 synapses, thin arrows > 50 synapses in at least two compartments, and connections with fewer than 50 synapses are not represented in this schematic (but see Figure 6—source data 1). Red arrows indicate synaptic connections newly identified in this study; similar connections were also seen in parallel connectomics studies of the larval MB (Eichler et al., 2017).
-
Figure 6—source data 1
Connectivity matrix of cell types in the α lobe.
Numbers of synapses detected between different circuit elements corresponding to the graphical display in Figure 6. Left column indicates the compartment where the connections were observed, and the next column shows cell types presynaptic to the cell types shown in the top row. In α3, PPL refers specifically to two PPL1-α3neurons, in α2 it is the two PPL1-α′2α2 cells and in α1 it is 16 PAM-α1 neurons. The MBONs do not make any output synapses within the lobes and so are omitted from the rows of the matrix. Red shading indicates synaptic connections newly identified in this study.
- https://doi.org/10.7554/eLife.26975.022
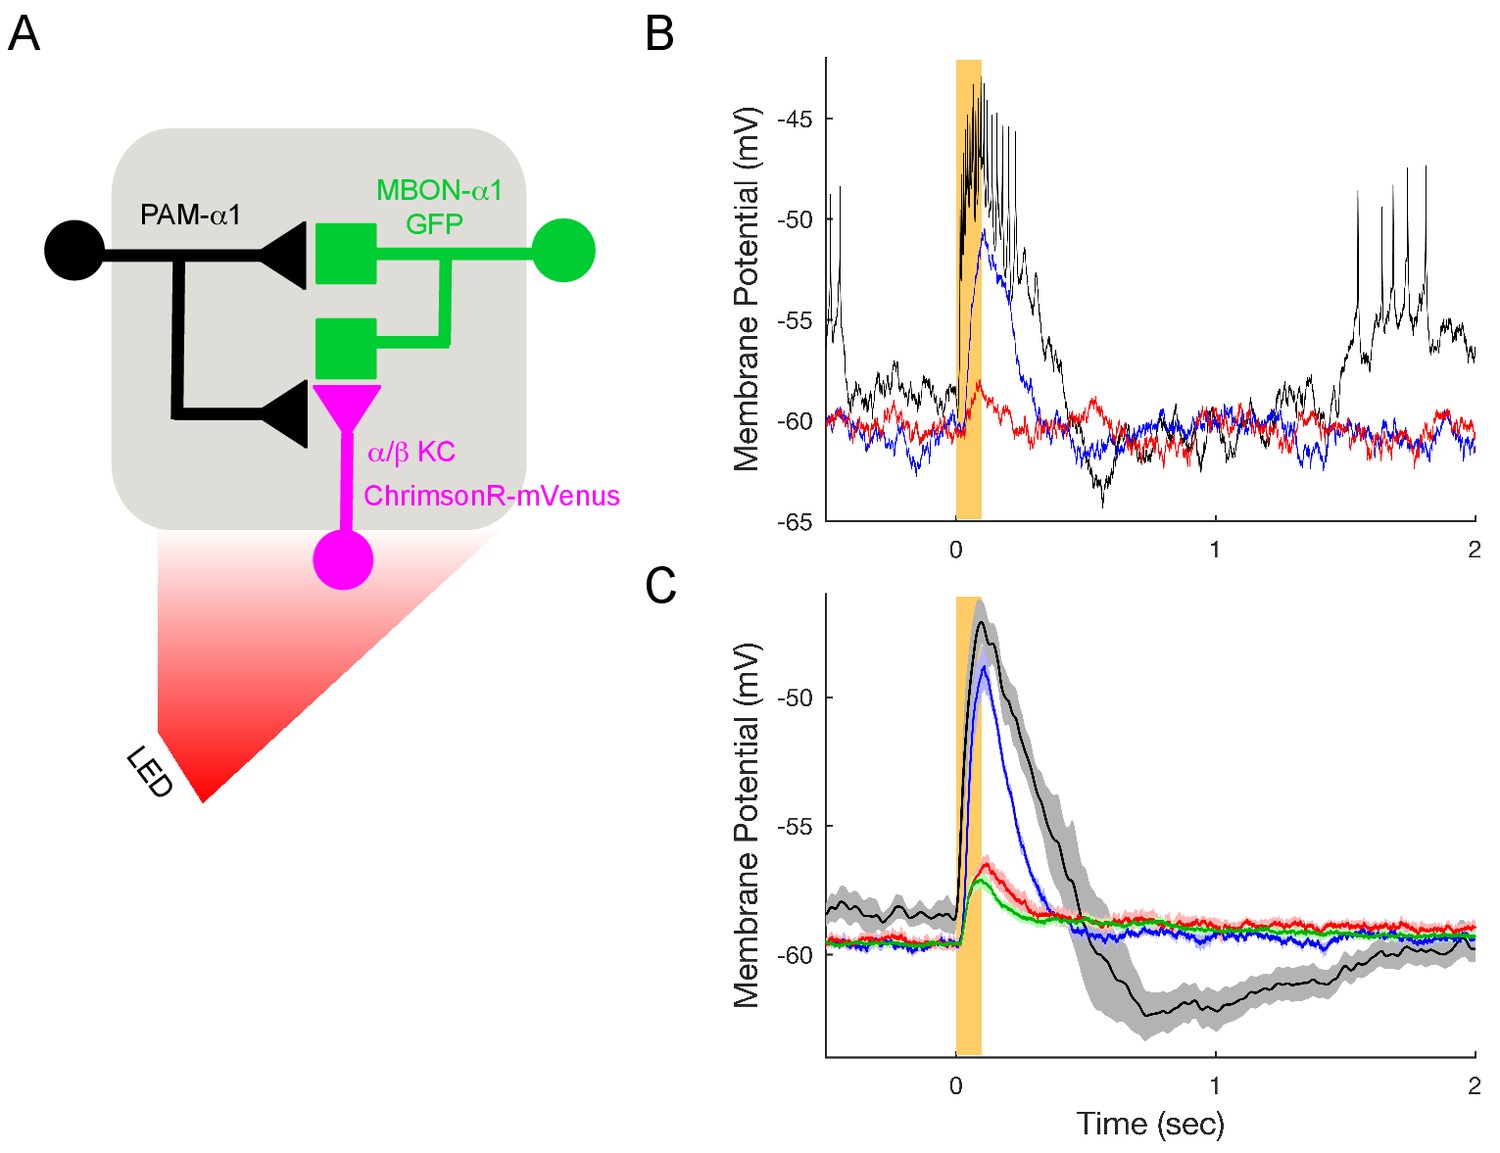
Figure 7 with 1 supplement
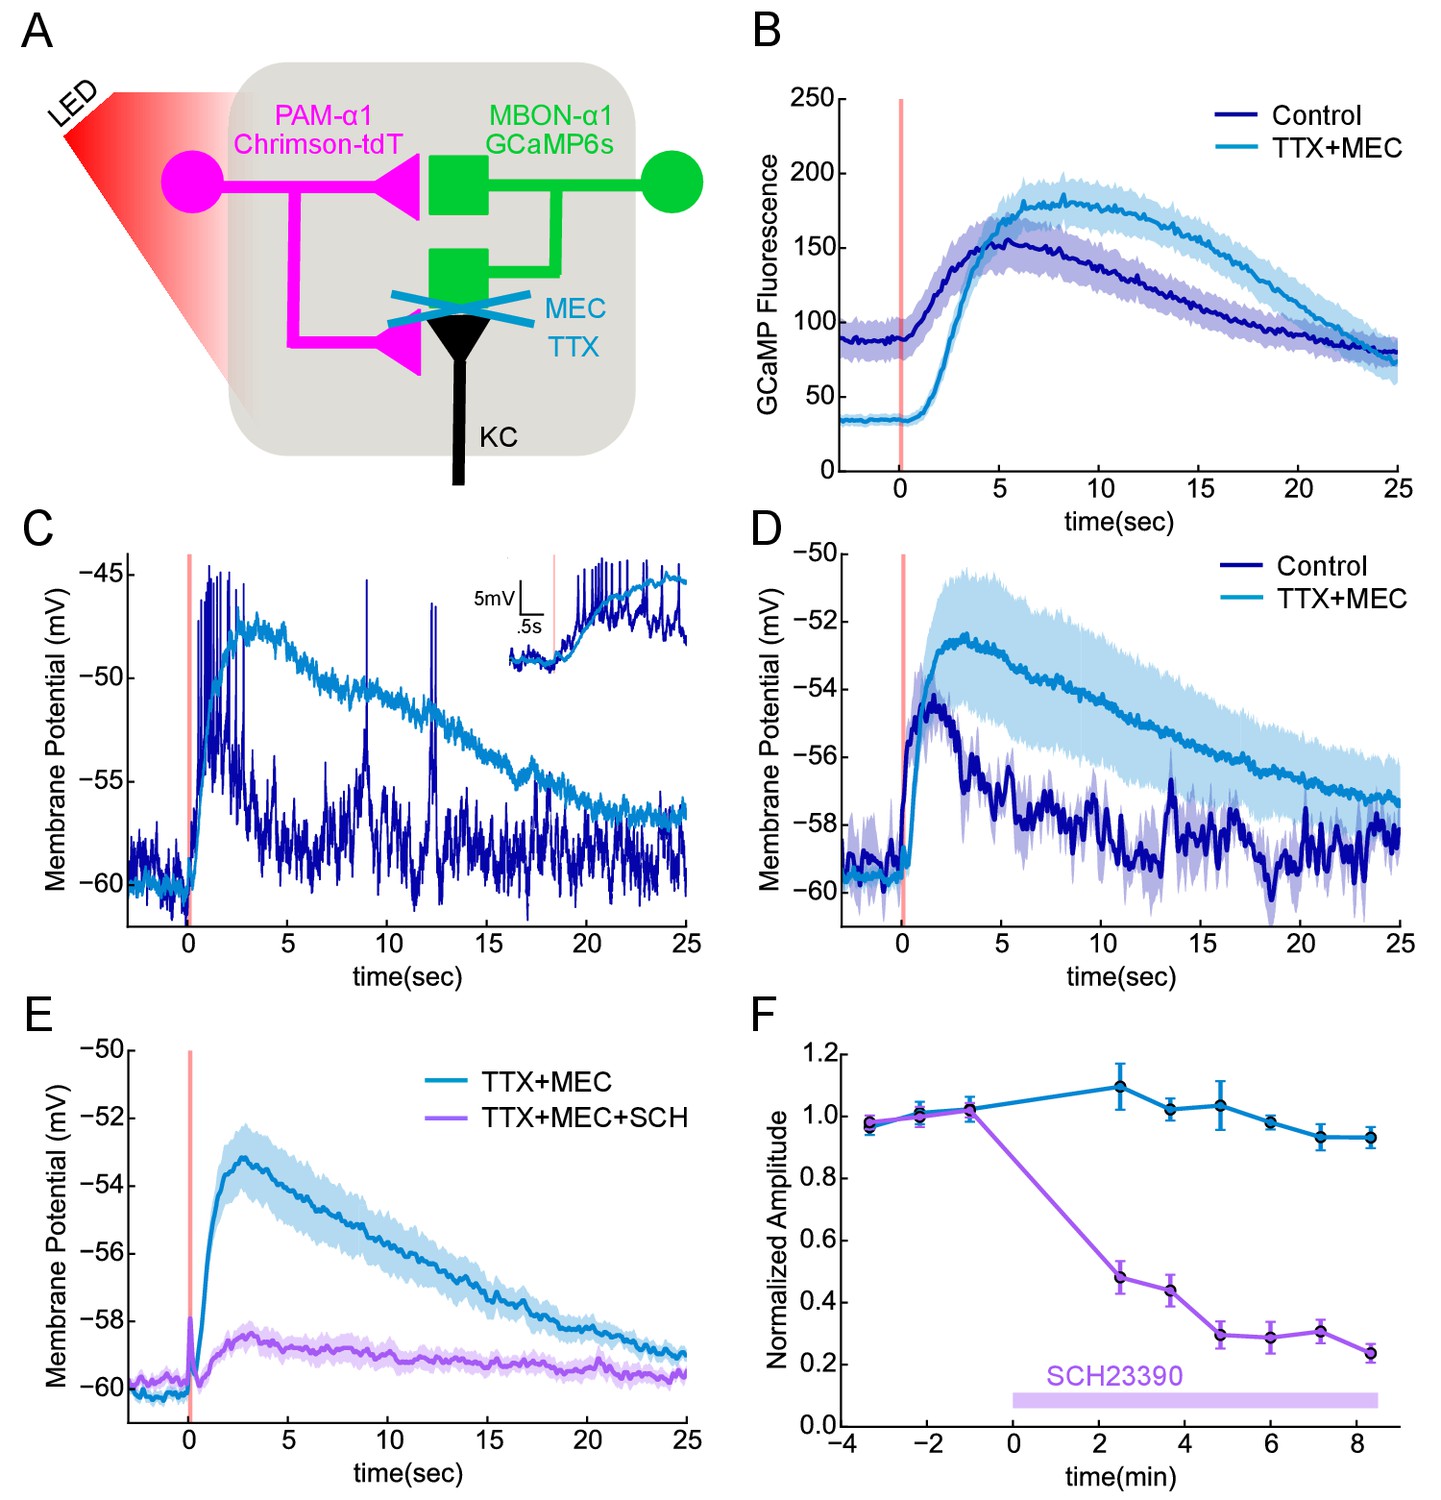
Functional connectivity between DAN and MBON in the α1compartment.
(A) Experimental schematic. Chrimson-expressing PAM-α1 DANs were photostimulated and MBON-α1 responses measured either with the calcium sensor GCaMP6s or with whole cell recordings targeted via GCaMP fluorescence. (B) Calcium response of MBON to DAN photostimulation. Dark blue trace shows fluorescence values taken from the dendritic region of the MBON, with photostimulation (100 msec) demarcated by the red bar (mean ± SEM of recordings from n = 7 different flies). Light blue trace shows the response persisted in the presence of blockers of spiking and nicotinic transmission (1 μM tetrodotoxin (TTX), 250 μM mecamylamine (MEC)). Overall response magnitude actually grew larger. (C) Whole cell recordings showing MBON responses to DAN photostimulation. Dark blue trace shows a representative single trial in control conditions, where DAN photostimulation (two msec) elicits a strong depolarization, driving the cell across spike threshold. Light blue trace shows a single trial of the response from the same cell following addition of the blockers as in B, again indicating that the evoked response does not require spikes or nicotinic transmission. As with imaging, the depolarization was larger in the presence of the blockers. Insert in upper right shows the initial portion of the trace at an expanded time scale. (D) Average MBON responses to DAN photostimulation before and after blocker addition (mean ± SEM of n = 4 whole cell recordings). The responses prior to blocker addition were low-pass filtered to eliminate spikes before averaging. (E) MBON responses to DAN photostimulation in the presence of TTX and MEC (light blue; mean ± SEM from n = 5 recordings) were strongly diminished by the application of the dopamine receptor antagonist SCH 23390 (100 μM; magenta). (F) MBON response amplitudes during wash-in of SCH 23390. Peak amplitudes were normalized to the mean of the first three trials in each cell. Error bars: SEM.
Figure 7—figure supplement 1
KC>MBON transmission is blocked under the conditions used to test DAN>MBON connectivity.
(A) Experimental schematic. ChrimsonR-expressing α/β KCs were photostimulated for 100 msec, and MBON-α1 responses measured with whole-cell recordings. (B) Representative recordings from a single cell. Black trace shows response in the absence of blockers; note the much shorter response time course compared to DAN stimulation (Figure 7). Blue trace shows the response when spiking is blocked (1 μM tetrodotoxin (TTX)), indicating a strong monosynaptic connection. This response was effectively blocked by the addition of the nicotinic antagonist 250 μM mecamylamine (MEC), red trace. (C) Average responses (mean ± SEM; n = 6). The small upward deflection remaining in the presence of TTX and MEC (red) was also observed in flies that did not express ChrimsonR (green trace; n = 6 with TTX and MEC), indicating that it is brought about by the light itself, not from optogenetic stimulation. Similar photoelectric effects have been observed by others (Cardin et al., 2010).
Figure 8
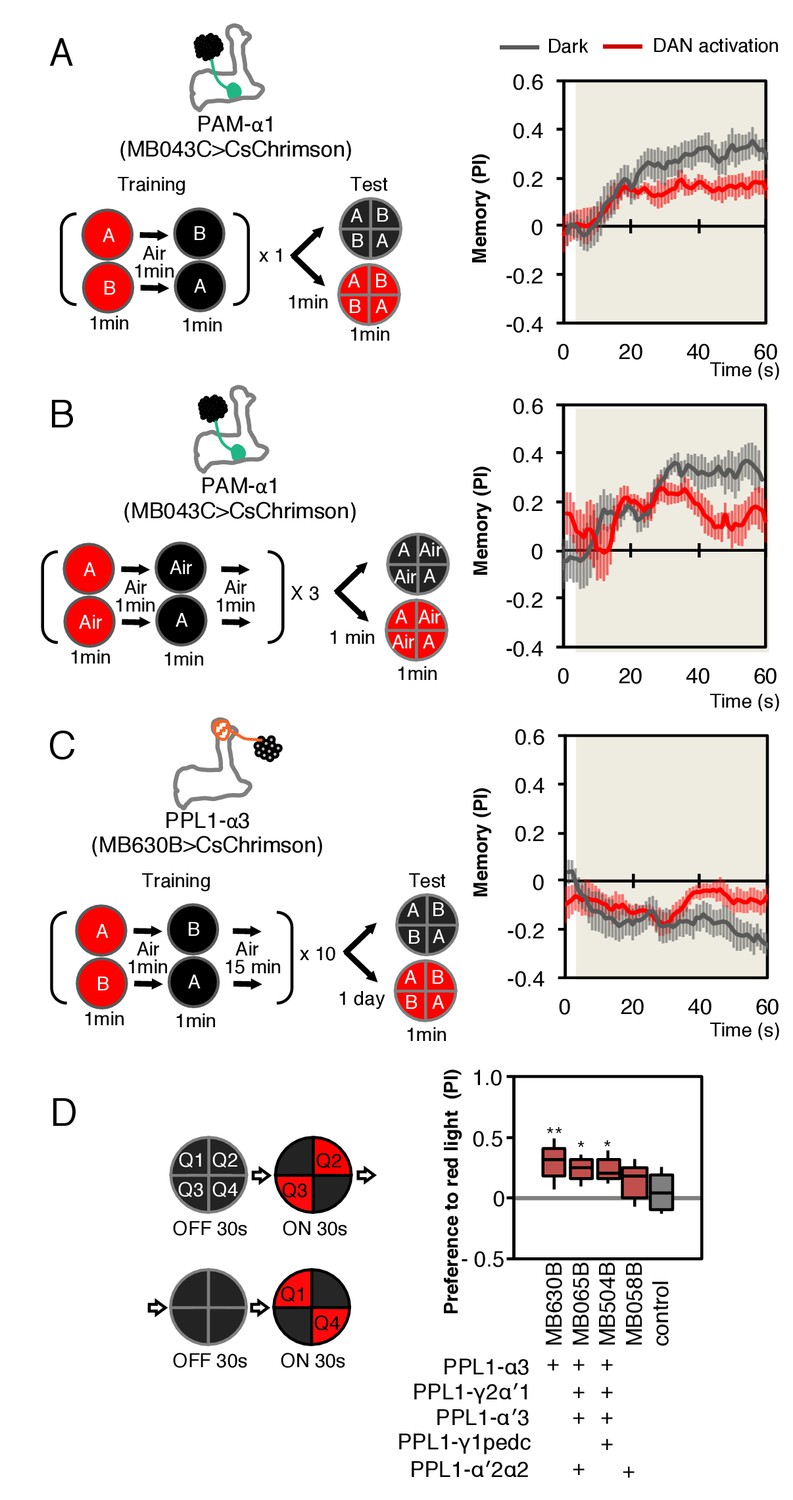
Behavioral consequences of DAN activation.
(A) Female flies expressing CsChrimson in PAM-α1 (MB043C x 20xUAS-IVS-CsChrimson-mVenus in attP18) were starved for 48 hr and then trained to form an appetitive odor memory by exposure to an odor (odor A) while delivering thirty 1 s pulses of red light (1 s ON +1 s OFF), followed by exposure to a second odor (odor B) in the dark. The conditioned odor response was tested immediately after the training with or without the activating red light (see Materials and methods for details). Experiments were done reciprocally: In one group of flies, odor A and B were 3-octanol and 4-methylcyclohexanol, respectively, while in a second group of flies, the odors were reversed. The performance index (PI) is defined as [(number of flies in the odor A quadrants) - (number of flies in odor B quadrants)]/(total number of flies). The average PI of reciprocal experiments during the test period is plotted. The odor delivery started at 2 s and the arena was filled with odor by 5 s. Thick lines and error bars represent mean and SEM, respectively. Mean PI of the final 30 s of each test period was significantly (p<0.05; N = 8; Mann-Whitney U test) lower when activation light was ON (red; 1 s ON +1 s OFF) compared to the PI of flies tested in dark (gray). (B) The conditioned response was also reduced in single odor conditioning (p<0.05; N = 8; Mann-Whitney U test). Flies were trained in the similar protocol as in (A), but odors A and B were 3-octanol and air. Because memory scores tend to be lower in this type of single odor conditniong, training was repeated three times. (C) Female flies expressing CsChrimson-mVenus in PPL1-α3 (MB630B x 20xUAS-IVS-CsChrimson-mVenus in attP18) were trained 10 times with 15 min inter-training intervals to form an aversive odor memory and then tested 1 day later. The conditioned response was significantly reduced by DAN activation during test (p<0.05; N = 12; Mann-Whitney U test). Note that the α3 compartment has a slow memory acquisition rate and the same 60 s paring of odor and thirty times 1 s activation was insufficient to induce significant immediate memory (Aso and Rubin, 2016). Thus, the reduced conditioned odor preference is likely due to the suppression of memory expression rather than formation of a new odor memory for the control odor. (D) Untrained female flies were tested for preference to optogenetic activation of DANs. From 30–60 s, two of the quadrants (Q2 and 3) were continuously illuminated with red LED lights to activate CsChrimson-containing neurons; from 90 to 120 s, the other two quadrants (Q1 and 4) were illuminated instead. The preference index was calculated based on the distribution of flies during the last 5 s of these two test periods (Aso et al., 2014b). Flies expressing CsChrimson in PPL1-α3 (MB630B) or PPL-α3 and additional PPL1 DANs (MB065B and MB504B) preferred the illuminated quadrants, whereas the control genotype (empty split-GAL4 driver, pBDP-p65ADZp in attP40; pBDP-GAL4ZpDBD in attP2/20xUAS-CsChrimson-mVenus in attP18) showed a very slight preference for illuminated quadrants. * and ** denotes p<0.05 or p<0.01 respectively by Kruskal Wallis One way ANOVA followed by Dunn's post-test for comparison between control and experimental genotype. N = 13–20.
Figure 9
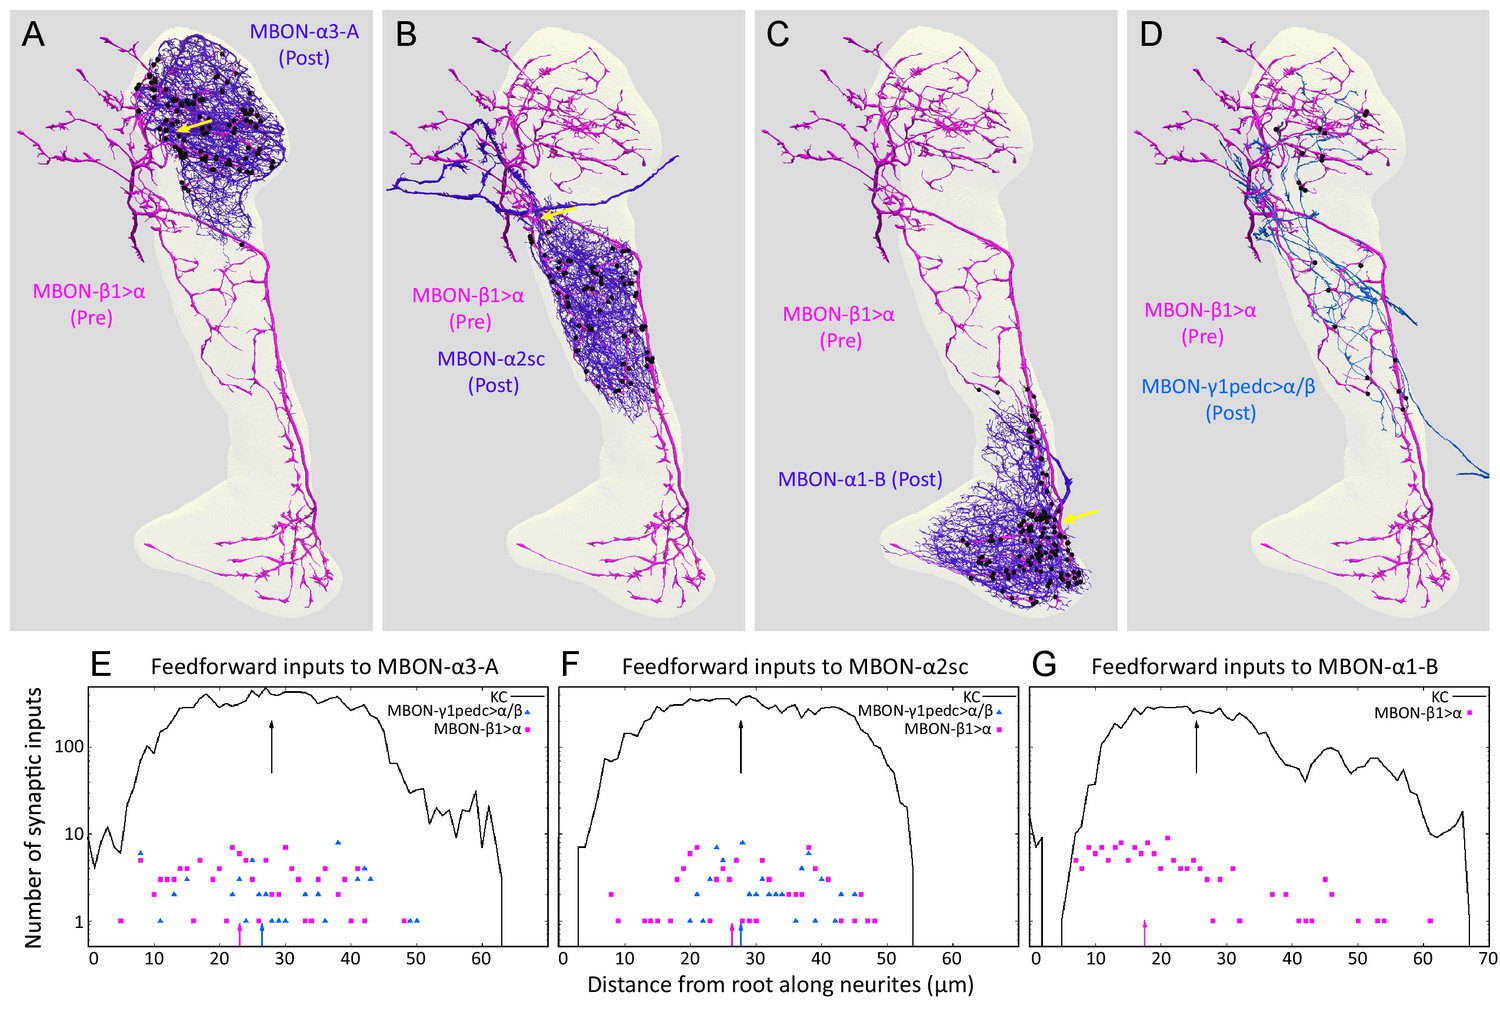
Distributions of synapses between the feedforward glutamatergic MBON-β1>α and GABAergic MBON-γ1pedc>α/β, and the dendrites of an MBON in each compartment.
(A–C) Synaptic inputs from MBON-β1>α are shown as black dots and are distributed uniformly over the dendrites of MBON-α3 (A) and MBON-α2sc (B). In contrast, its synaptic inputs to MBON-α1 are located more closely to the root of the dendrites (C). (D) Synapses of MBON-β1>α onto MBON-γ1pedc>α/β in the α3 and α2 compartments are shown; we lack data for these synapses in α1. (E–G) The numbers of synapses are plotted (on a log scale) as a function of distance from the root of MBON’s dendrites, the point where the dendrites become a single axonal fiber (indicated by arrows in A-C). Arrows indicate average of all positions.
Figure 10
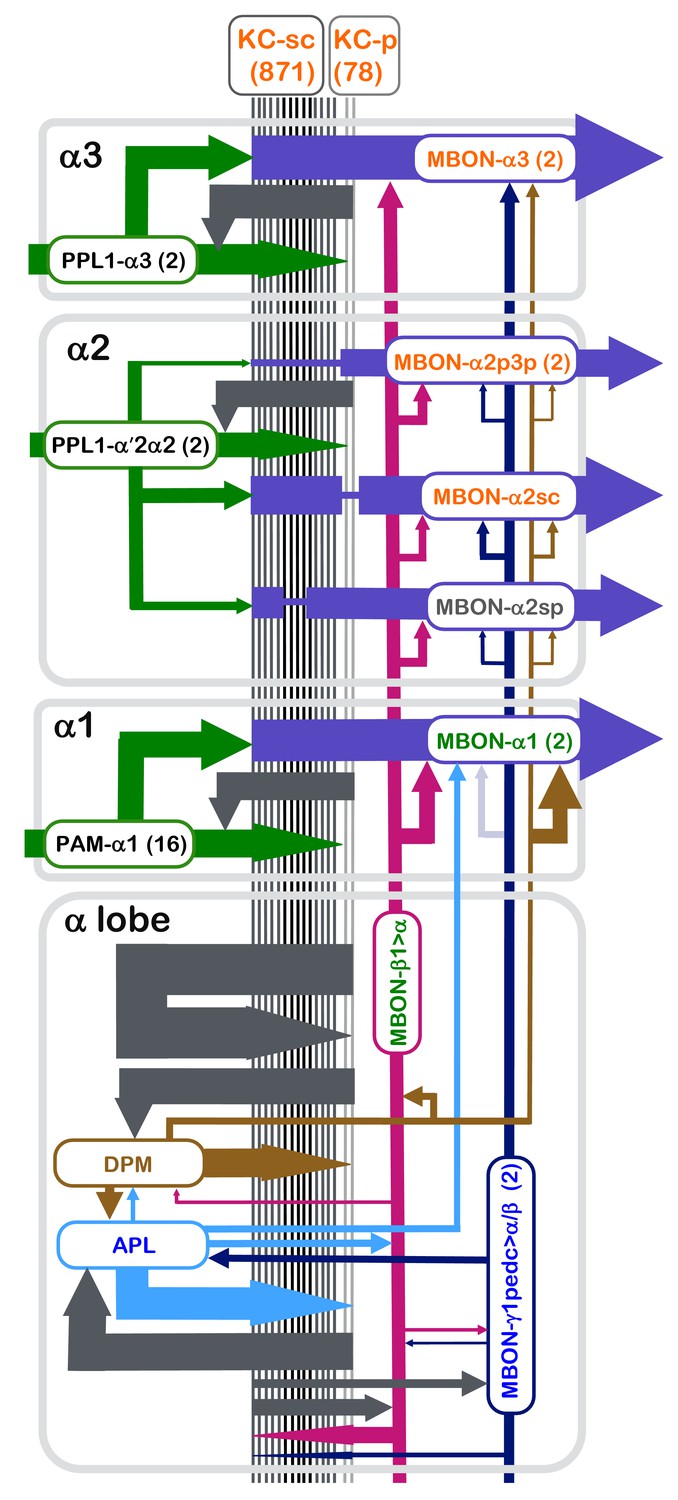
Summary diagram of the connectome reconstruction of the α lobe.
The synaptic connectivity in each compartment are shown as arrows whose width is indicative of the number of synapses connecting the corresponding cell types. The arrows are color-coded as follows: DANs, green; MBONs with dendrites in the α1, α2 and α3 compartments, purple; the feedforward MBON-γ1pedc>α/β, dark blue; the feedforward MBON-β1>α, magenta; DPM, brown; and APL, light blue. Arrowheads indicate the main presynaptic sites of each neuron type. The names of cell types (shown in the rectangles with rounded corners) are color coded to reflect the major neurotransmitter of the cell: black, dopamine; orange, acetylcholine; green, glutamate; blue, GABA. The transmitter for MBON-α2sp is unknown (name is shown in grey), and for DPM (name shown in brown) is 5HT, GABA and the neuropeptide amnesiac. The correspondence of number of connections and line thickness is as follows: no line is shown when there are less than five connections; five connections, 2 pt line; 50 connections, 4 pt line; 15000 connections, 35 pt line; with line widths interpolated between these values using a log scale. Precise numbers can be found in the Tables 2–8 and Supplementary file 1. For some connections, such as the connections to and from KCs of APL, DPM, MBON-γ1pedc>α/β, MBON-β1>α and KCs, we have pooled the data from all three α-lobe compartments and present them in the lower rectangle labeled α lobe. We similarly pooled data on synapses between MBON-γ1pedc>α/β and MBON-β1>α and from MBON-γ1pedc>α/β to APL that was derived from counts in the α2 and α3 compartments. When more than one cell of a given type is present, such as the two MBON-α3 cells, the synapse counts for each cell have been added in determining line widths. The connection from MBON-γ1pedc>α/β to MBON-α1 is shown as a faint arrow because the EM reconstruction failed to identify MBON-γ1pedc>α/β in the α1 compartment (see text), although the presence of its arbors is indicated by light level data (Aso et al., 2014a).
Videos
Video 1
A portion of the dataset that was used for connectome reconstruction shown at down-sampled resolution.
Approximately, 9600 sequential x-y imaging planes are shown covering a 35 × 35 × 77 µm region of the complete image volume (40 × 50 × 120 µm). The original voxel size was 8 × 8 × 8 nm; the video has been down sampled by a factor of eight, making the voxel size shown 64 × 64 × 64 nm. The video progresses from top of the vertical lobe, which is ensheathed in glia, through the α3 and α2 compartments as indicated by the black bracket in Figure 1B.
Video 2
A portion of the data set that was used for connectome reconstruction shown at the resolution at which the data was acquired, 8 × 8 × 8 nm voxels.
The region shown corresponds to the portion of the α3 compartment indicated by the white box in Figure 1B.
Video 3
All KCs in the α lobe, except outer-core (α/βc(o)).
A total of 259 α/βc(i), 480 α/βs, and 78 α/βp KCs are shown colored in ivory, orange and yellow, respectively.
Video 4
Tiling of the MBONs and DANs in the α lobe.
Neurites of MBONs and DANs are confined to a single compartment where they are intermingled. Two MBON-α3, two PPL1-α3 and the one MBON-α2sc are shown in sequence.
Video 5
PAM-α1 DANs.
Individual morphologies of 16 PAM-α1 neurons are displayed in sequence showing how the terminals of these cells collectively fill the compartment.
Video 6
Distribution of synaptic inputs onto MBON-α3 arbor.
MBONs in each compartment receives thousands of synaptic inputs from KCs as well as DANs and feedforward MBONs.
Video 7
Distribution of sites of single input and convergent synapses.
Synaptic inputs onto an MBON arbor as single synapses are uniformly distributed over the MBON dendrites and the inputs of convergent/rosette synapses are found much more frequently.
Video 8
Inner core KCs (α/βc(i)).
Five cells are displayed first with presynaptic locations indicated by magenta puncta. All other reconstructed core KCs are then added.
Video 9
Surface KCs (α/βs).
Five cells are displayed first with presynaptic locations indicated by magenta puncta. All other reconstructed surface KCs are then added.
Video 10
Posterior KCs (α/βp).
Five cells are displayed first with presynaptic locations indicated by magenta puncta. All other reconstructed posterior KCs are then added.
Video 11
A few APL branches are randomly picked and separated from the main body to show their morphological features.
APL branches are first shown individually and then in combination.
Tables
Table 1
Types of synaptic vesicles and synaptic motifs in different neuron types. The size estimates for dense core vesicles (mean ± SD) were based on counting 100 vesicles for each cell type. Clear vesicles size 40–50 nm in diameter and all appear to have uniform shape and size.
| Cell types | Clear vesicles | Dense-core vesicles (nm) | Synaptic motif |
|---|---|---|---|
| KCs | + | 74.6 ± 10.1 | Convergent (rosette) synapses Polyadic to modulatory cells, occasionally monad |
| PPL1-α3 | + | 107.8 ± 19.6 | Polyadic |
| PPL1-α′2α2 | + | 84.4 ± 14.9 | Polyadic |
| PAM-α1 | + | 80.3 ± 10.8 | Polyadic |
| MBON-β1>α | + | 83.2 ± 16.9 | Polyadic |
| MBON-γ1pedc>α/β | + | - | Polyadic |
| APL | + | 82.8 ± 12.8 | Polyadic |
| DPM | + | 80.8 ± 12.2 | Polyadic |
| SIFamide | - | 125.5 ± 26.4 | Monad/Dyad |
Table 2
Direct connections from KCs to MBONs. Synapses per KC is the mean over all connected KCs.
| Postsynaptic MBON | Number of pre-synaptic KCs | Total number of KC>MBON synapses | Mean number of KC>MBON synapses per KC | Number and (percent) of KC>MBON synapses for α/βsc | Number and (percent) of KC>MBON synapses for α/βp |
|---|---|---|---|---|---|
| MBON-α3-A | 948 | 12770 | 13.47 | 12278 (96.1%) | 492 (3.9%) |
| MBON-α3-B | 948 | 13129 | 13.85 | 12425 (94.6%) | 704 (5.4%) |
| MBON-α2p3p-A | 236 | 1311 | 5.56 | 325 (24.8%) | 986 (75.2%) |
| MBON-α2p3p-B | 168 | 692 | 4.12 | 113 (16.3%) | 579 (83.7%) |
| MBON-α2sc | 909 | 11281 | 12.41 | 11214 (99.4%) | 67 (0.6%) |
| MBON -α2sp | 823 | 3529 | 4.29 | 2835 (80.3%) | 694 (19.7%) |
| MBON-α1-A | 949 | 9303 | 9.80 | 8239 (88.6%) | 1064 (11.4%) |
| MBON-α1-B | 949 | 9286 | 9.79 | 8178 (88.1%) | 1108 (11.9%) |
Table 3
How output neurons sample from KCs. KC α/βs is surface, KC α/βc(i) is inner core, KC α/βc(o) outer core and KC α/βp is posterior. Blank rows divide compartments. Each entry is of the form A/B x C, where A is the number of contributing KCs out of B of that type, and C is the average number of KC>MBON synapses, for those that are connected. In general, the connections are both numerous and complete. However, some output neurons from α2 sample only from a subset of the available KCs, and only with weak connections.
| Neuron | KC α/βs | KC α/βc(o) | KC α/βc(i) | KC α/βp |
|---|---|---|---|---|
| MBON-α3-A | 480/480 × 15.88 | 131/132 × 13.27 | 259/259 × 11.26 | 78/78 × 6.31 |
| MBON-α3-B | 480/480 × 16.32 | 131/132 × 12.60 | 259/259 × 11.36 | 78/78 × 9.03 |
| MBON-α2p3p-A | 138/480 × 2.17 | 15/132 × 1.27 | 5/259 × 1.20 | 78/78 × 12.64 |
| MBON-α2p3p-B | 80/480 × 1.27 | 9/132 × 1.11 | 1/259 × 1.00 | 78/78 × 7.42 |
| MBON-α2sc | 480/480 × 14.13 | 132/132 × 13.67 | 259/259 × 10.14 | 38/78 × 1.76 |
| MBON -α2sp | 470/480 × 4.33 | 130/132 × 3.58 | 145/259 × 2.30 | 78/78 × 8.90 |
| MBON-α1-A | 480/480 × 10.73 | 132/132 × 7.99 | 259/259 × 7.85 | 78/78 × 13.64 |
| MBON-α1-B | 480/480 × 10.86 | 132/132 × 8.57 | 259/259 × 7.09 | 78/78 × 14.21 |
Table 4
Direct connections from DANs to KCs. Blank rows divide compartments. Mean synapses per KC is the number of DAN to KC for that presynaptic DAN cell type/number of postsynaptic KCs. The right two columns specify the number of postsynaptic KC-sc and KC-p; the percentages are the fraction of DAN-KC synapses for that class of KC.
| Presynaptic DAN | Number of postsynaptic KCs | Total synapse number | Mean synapses per KC | Number of synapses to α/βsc KCs | Number of synapses to α/βp KCs |
|---|---|---|---|---|---|
| PPL1-α3-A | 706 | 1336 | 1.89 | 1226 (91.8%) | 110 (8.2%) |
| PPL1-α3-B | 786 | 1646 | 2.09 | 1513 (91.9%) | 133 (8.1%) |
| PPL1-α′2α2-A | 455 | 653 | 1.44 | 502 (76.9%) | 151 (23.1%) |
| PPL1-α′2α2-B | 484 | 813 | 1.68 | 589 (72.4%) | 224 (27.6%) |
| PAM-α1-A | 158 | 182 | 1.15 | 164 (90.1%) | 18 (9.9%) |
| PAM-α1-B | 121 | 134 | 1.11 | 129 (96.3%) | 5 (3.7%) |
| PAM-α1-C | 149 | 181 | 1.21 | 128 (70.7%) | 53 (29.3%) |
| PAM-α1-D | 149 | 170 | 1.14 | 159 (93.5%) | 11 (6.5%) |
| PAM-α1-E | 163 | 177 | 1.09 | 161 (91.0%) | 16 (9.0%) |
| PAM-α1-F | 135 | 151 | 1.12 | 137 (90.7%) | 14 (9.3%) |
| PAM-α1-G | 123 | 138 | 1.12 | 120 (87.0%) | 18 (13.0%) |
| PAM-α1-H | 95 | 105 | 1.11 | 102 (97.1%) | 3 (2.9%) |
| PAM-α1-I | 71 | 81 | 1.14 | 54 (66.7%) | 27 (33.3%) |
| PAM-α1-J | 100 | 112 | 1.12 | 107 (95.5%) | 5 (4.5%) |
| PAM-α1-K | 40 | 43 | 1.07 | 40 (93.0%) | 3 (7.0%) |
| PAM-α1-L | 89 | 95 | 1.07 | 69 (72.6%) | 26 (27.4%) |
| PAM-α1-M | 148 | 179 | 1.21 | 166 (92.7%) | 13 (7.3%) |
| PAM-α1-N | 78 | 125 | 1.60 | 30 (24.0%) | 95 (76.0%) |
| PAM-α1-O | 52 | 56 | 1.08 | 46 (82.1%) | 10 (17.9%) |
| PAM-α1-P | 61 | 82 | 1.34 | 19 (23.2%) | 63 (76.8%) |
Table 5
Connections of cells that innervate the α lobe. The top section shows connectivity to cells that innervate all three compartments. Lower sections are the compartment specific connectivity. Blank rows divide compartments, with α3 on top. *We were unable to identify with certainty the arbor of MBON-γ1pedc>α/β in α1 and so no counts of synapses for this neuron in α1 are included (see text).
| Number of synapses where APL is | Number of synapses where DPM is | Number of synapses where SIFamide is | Number of synapses where MBON-β1>α is | Number of synapses where MBON-γ1pedc>α/β* is | |||||||
|---|---|---|---|---|---|---|---|---|---|---|---|
| Post- Synaptic | Pre- synaptic | Post- synaptic | Pre- synaptic | Post- synaptic | Pre- synaptic | Post- synaptic | Pre- synaptic | Post- synaptic | Pre-synaptic | ||
| KCs (α lobe) | 9128 | 4123 | 7224 | 1978 | 68 | 15 | 325 | 320 | 102 | 1 | |
| All α lobe | APL | - | - | 39 | 166 | 0 | 0 | 76 | 2 | 0 | 98 |
| DPM | 166 | 39 | - | - | 0 | 1 | 73 | 15 | 4 | 1 | |
| SIFamide | 0 | 0 | 1 | 0 | - | - | 0 | 0 | 0 | 0 | |
| MBON-β1>α | 2 | 76 | 15 | 73 | 0 | 0 | - | - | 22 | 6 | |
| MBON-γ1pedc>α/β-R* | 77 | 0 | 0 | 3 | 0 | 0 | 3 | 21 | - | - | |
| MBON-γ1pedc>α/β-L* | 21 | 0 | 1 | 1 | 0 | 0 | 3 | 1 | - | - | |
| α3 | KCs (α3) | 3244 | 1443 | 3213 | 922 | 42 | 7 | 152 | 136 | 30 | 0 |
| PPL1-α3-A | 10 | 0 | 24 | 12 | 0 | 0 | 0 | 1 | 0 | 3 | |
| PPL1-α3-B | 13 | 0 | 29 | 31 | 0 | 0 | 1 | 0 | 0 | 3 | |
| MBON-α3-A | 0 | 0 | 0 | 4 | 0 | 0 | 0 | 107 | 0 | 60 | |
| MBON-α3-B | 0 | 0 | 0 | 4 | 0 | 0 | 0 | 95 | 0 | 61 | |
| α2 | KCs (α2) | 3144 | 1276 | 2262 | 643 | 25 | 8 | 84 | 49 | 69 | 0 |
| PPL1-α′2α2-A | 38 | 0 | 58 | 33 | 0 | 0 | 0 | 6 | 0 | 1 | |
| PPL1-α′2α2-B | 45 | 0 | 44 | 46 | 0 | 0 | 1 | 12 | 0 | 2 | |
| MBON-α2p3p-A | 0 | 0 | 0 | 3 | 0 | 0 | 0 | 62 | 0 | 17 | |
| MBON-α2p3p-B | 0 | 0 | 0 | 3 | 0 | 0 | 0 | 47 | 0 | 10 | |
| MBON-α2sc | 0 | 0 | 0 | 21 | 0 | 2 | 0 | 80 | 0 | 69 | |
| MBON-α2sp | 0 | 0 | 0 | 7 | 0 | 0 | 0 | 101 | 0 | 21 | |
| α1 | KCs (α1) | 2740 | 1404 | 1749 | 413 | 1 | 0 | 89 | 135 | * | |
| PAM-α1 (16) | 21 | 0 | 22 | 80 | 0 | 0 | 85 | 84 | |||
| MBON-α1-A | 0 | 29 | 0 | 134 | 0 | 0 | 0 | 132 | |||
| MBON-α1-B | 0 | 34 | 0 | 111 | 0 | 0 | 0 | 156 | |||
Table 6
Direct connections from DANs to MBONs in the same compartment. Blank rows separate the compartments, with α3 on top. All MBONs in the α lobe share this circuit motif, though with varying strengths. For each MBON, the absolute number of DAN to MBON synapses is shown as well as the percentage that number represents of synapses from KCs received by that MBON.
| Presynaptic DANs | Postsynaptic MBONs | Total synaptic counts | Percent |
|---|---|---|---|
| PPL1-α3 (2) | MBON-α3-A | 456 | 3.57% |
| MBON-α3-B | 451 | 3.43% | |
| PPL1-α′2α2 (2) | MBON-α2p3p-A | 26 | 1.95% |
| MBON-α2p3p-B | 12 | 1.66% | |
| MBON-α2sc | 246 | 2.18% | |
| MBON -α2sp | 91 | 2.57% | |
| PAM-α1 (16) | MBON-α1-A | 727 | 7.77% |
| MBON-α1-B | 736 | 7.90% | |
Table 7
Connections from KCs to DANs. Blank rows divide compartments, with α3 at the top. There are two DANs each in the α3 and α2 compartments, and 16 in α1. Mean synapses per KC is the number of KC>DAN synapses/number of KCs making synapses to DANs. The left two columns specify the number of presynaptic KC α/βsc and KC α/βp, respectively; the percentages are the fraction of KC>DAN synapses provided by that class of KC.
| Postsynaptic DAN | Number of presynaptic KCs | Total synapse number | Mean synapses per KC | Number of synapses from KC α/βsc | Number of synapses from KC α/βp |
|---|---|---|---|---|---|
| PPL1-α3-A | 883 | 2822 | 3.20 | 2706 (95.9%) | 116 (4.1%) |
| PPL1-α3-B | 834 | 2215 | 2.66 | 2155 (97.3%) | 60 (2.7%) |
| PPL1-α ′2α2-A | 488 | 809 | 1.66 | 728 (90.0%) | 81 (10.0%) |
| PPL1-α ′2α2-B | 480 | 791 | 1.65 | 683 (86.3%) | 108 (13.7%) |
| PAM-α1-A | 209 | 251 | 1.20 | 239 (95.2%) | 12 (4.8%) |
| PAM-α1-B | 239 | 332 | 1.39 | 320 (96.4%) | 12 (3.6%) |
| PAM-α1-C | 218 | 283 | 1.30 | 212 (74.9%) | 71 (25.1%) |
| PAM-α1-D | 191 | 256 | 1.34 | 239 (93.4%) | 17 (6.6%) |
| PAM-α1-E | 194 | 254 | 1.31 | 248 (97.6%) | 6 (2.4%) |
| PAM-α1-F | 193 | 241 | 1.25 | 235 (97.5%) | 6 (2.5%) |
| PAM-α1-G | 143 | 171 | 1.20 | 156 (91.2%) | 15 (8.8%) |
| PAM-α1-H | 156 | 176 | 1.13 | 170 (96.6%) | 6 (3.4%) |
| PAM-α1-I | 156 | 212 | 1.36 | 155 (73.1%) | 57 (26.9%) |
| PAM-α1-J | 124 | 149 | 1.20 | 148 (99.3%) | 1 (0.7%) |
| PAM-α1-K | 86 | 97 | 1.13 | 87 (89.7%) | 10 (10.3%) |
| PAM-α1-L | 174 | 215 | 1.24 | 161 (74.9%) | 54 (25.1%) |
| PAM-α1-M | 218 | 266 | 1.22 | 252 (94.7%) | 14 (5.3%) |
| PAM-α1-N | 49 | 59 | 1.20 | 26 (44.1%) | 33 (55.9%) |
| PAM-α1-O | 50 | 56 | 1.12 | 47 (83.9%) | 9 (16.1%) |
| PAM-α1-P | 29 | 36 | 1.24 | 12 (33.3%) | 24 (66.7%) |
Table 8
KC to KC connections in the α lobe. Each box has three entries, one each for the three compartments. Each entry is of the form A x B, where A is the average number of connected presynaptic cells (averaged over all KCs) and B is the average number of synapses between cells that are connected. No pairs are strongly connected, but there are many connections. Squares with less than one synapse per KC on average are left blank.
| From | To | ||||
|---|---|---|---|---|---|
| Compartment | KC α/βp | KC α/βs | KC α/βc(o) | KC α/βc(i) | |
| α3 α2 α1 | KC α/βp | 18.0 × 1.29 13.5 × 1.31 23.5 × 1.30 | 3.4 × 1.10 1.6 × 1.12 4.0 × 1.09 | ||
| α3 α2 α1 | KC α/βs | 34.0 × 1.22 16.6 × 1.18 22.8 × 1.22 | 2.7 × 1.11 1.3 × 1.13 2.0 × 1.13 | ||
| α3 α2 α1 | KC α/βc(o) | 9.0 × 1.13 4.4 × 1.12 7.1 × 1.12 | 12.5 × 1.21 9.5 × 1.18 12.0 × 1.14 | 7.3 × 1.16 3.6 × 1.12 5.4 × 1.10 | |
| α3 α2 α1 | KC α/βc(i) | 4.1 × 1.16 1.8 × 1.12 2.7 × 1.11 | 21.5 × 1.22 13.7 × 1.17 22.2 × 1.23 | ||
Additional files
-
Supplementary file 1
This file unzips to a directory containing the connectome and synapse locations in human readable (JSON) format, and the program used to analyze this data for this paper.
The synapse locations, both pre-and post-synaptic, are in file ‘synapse.json’. The mapping of neuron identifiers to names is in file ‘annotations-body.json’. Files annotating which synapses are in alpha lobes 1, 2 or 3, and in the alpha lobe as a whole, are in bool-lobe-N.json, where N is the lobe and 100 is used for the alpha lobe as a whole. The program used to analyze these data is included as ‘s.cpp’.
- https://doi.org/10.7554/eLife.26975.035
Download links
A two-part list of links to download the article, or parts of the article, in various formats.
Downloads (link to download the article as PDF)
Open citations (links to open the citations from this article in various online reference manager services)
Cite this article (links to download the citations from this article in formats compatible with various reference manager tools)
A connectome of a learning and memory center in the adult Drosophila brain
eLife 6:e26975.
https://doi.org/10.7554/eLife.26975


