Chromatin-associated RNA sequencing (ChAR-seq) maps genome-wide RNA-to-DNA contacts
- Stanford University, United States
Figures
Figure 1 with 10 supplements
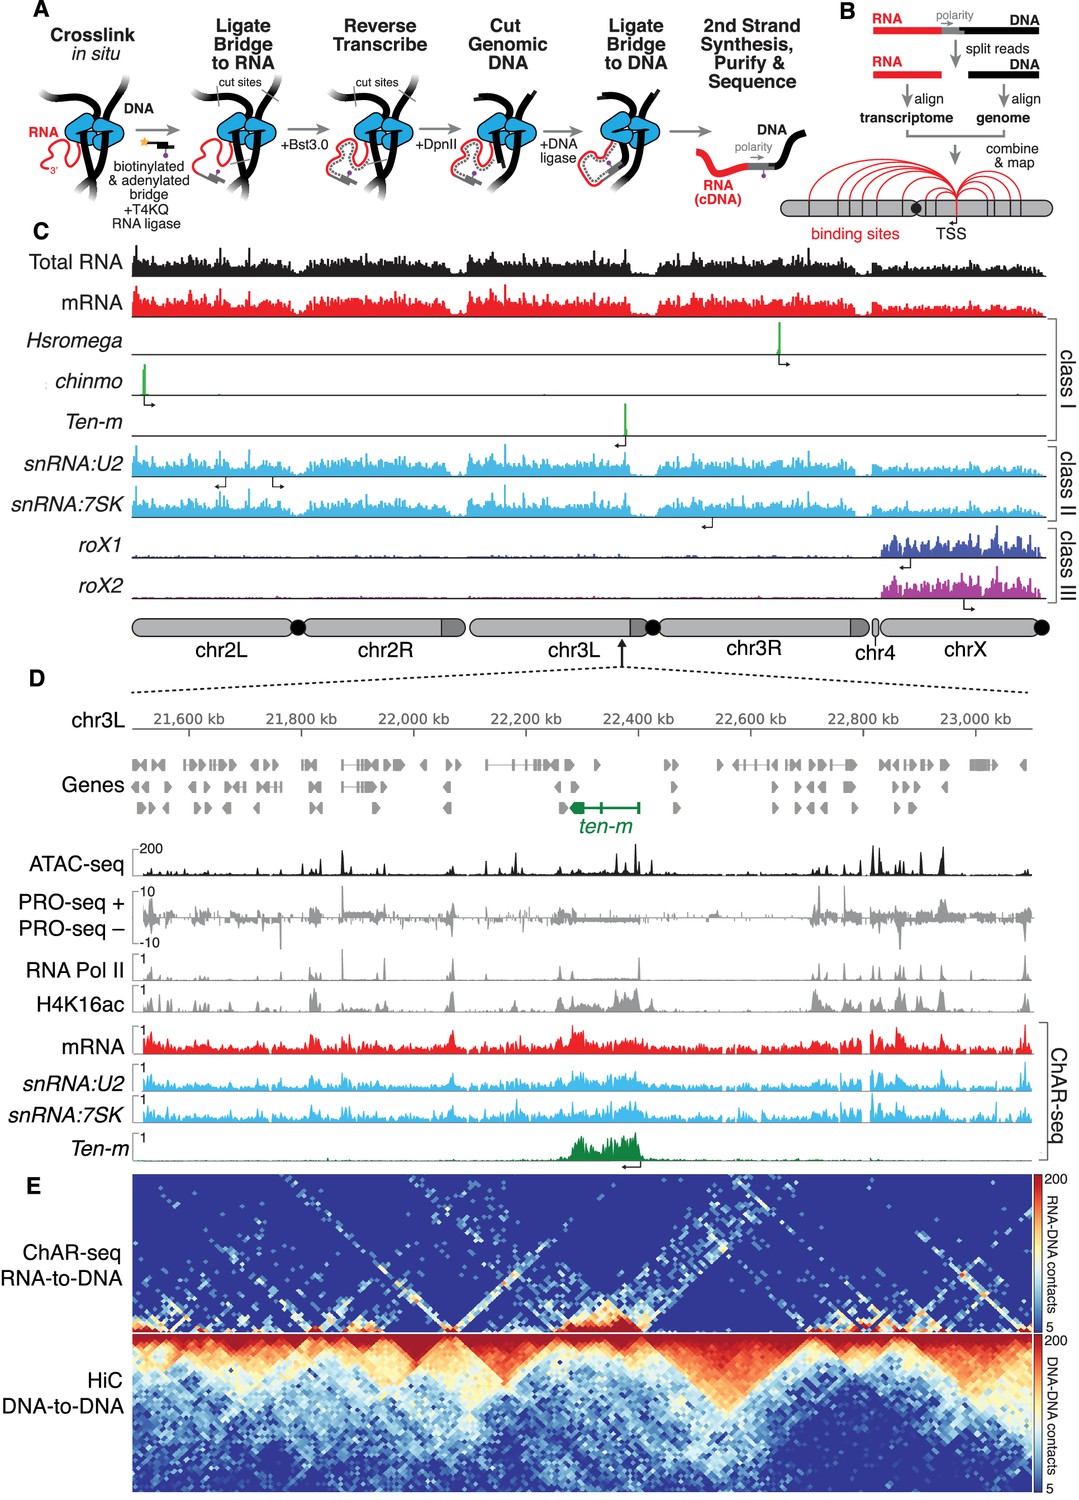
ChAR-seq uses proximity ligation of chromatin-associated RNA and deep sequencing to map RNA-DNA contacts in situ.
(A) Overview of the ChAR-seq method wherein RNA-DNA contacts are preserved by crosslinking, followed by in situ ligation of the 3’ end of RNAs to the adenylated 5’ end of the ssDNA tail of an oligonucleotide ‘bridge’ containing a biotin modification and a DpnII-complementary overhang on the opposite end. After extending the bridge by reverse transcription to generate a strand of cDNA complementary to the RNA, the genomic DNA is then digested with DpnII and then re-ligated, capturing proximally-associated bridge molecules and RNA. The chimeric molecules are reverse-transcribed, purified and sequenced. (B) Chimeric molecules are sequenced and the RNA and DNA ends are distinguished owing to the polarity of the bridge, which preferentially ligates to RNA via the 5'-adenylated tail and to DNA via the DpnII overhang. The RNA and DNA reads are then computationally recombined to produce contact maps for each annotated RNA in the genome. (C) Representative examples of genome-wide RNA coverage plots generated for Total RNA (black), mRNA (red), Hsromega (green), chinmo (green), ten-m (green), snRNA:U2 (cyan), snRNA:7SK (cyan), rox1 (blue) and roX2 (purple). Arrows show the transcription start site for each gene. In chromosome cartoons throughout the paper, light gray represents the primary chromosome scaffolds, darker gray regions are heterochromatic scaffolds, and black circles are centromeres. (D) Zoomed in region for an 850 kilobase region of chromosome 3L (chr3L). ChAR-seq tracks for Total RNA, ten-m, snRNA:U2, and snRNA:7SK are shown in comparison with PRO-seq tracks (Drosophila S2 [Kwak et al., 2013]) and ATAC-seq (this study, CME-W1-cl8+). (E) ChAR-seq contact matrix (RNA-to-RNA, top) plotted and aligned with same 850 kb region as panel D. ChAR-seq was performed without bridge addition (Hi-C/Mock-ChAR), resulting in DNA-DNA proximity ligation as in Hi-C (‘Hi-C, DNA-to-DNA’, bottom).
Figure 1—figure supplement 1
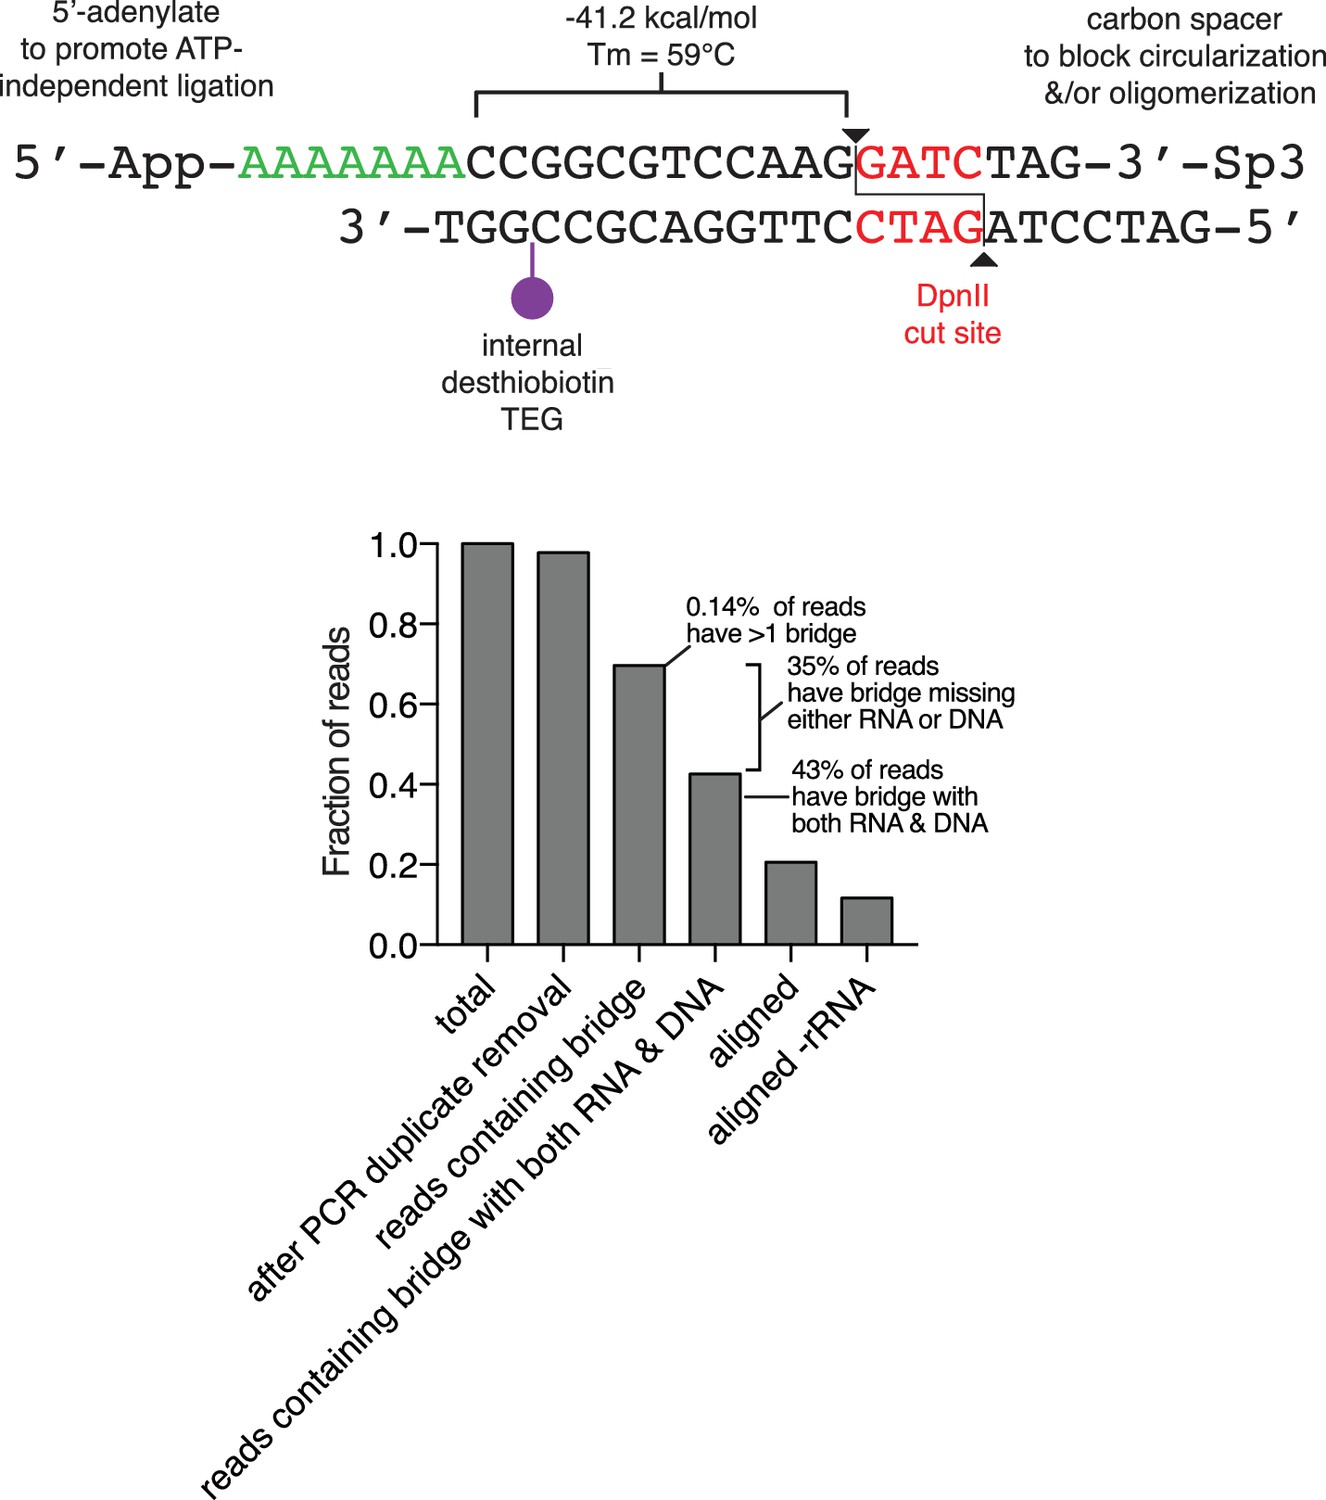
Diagram of the oligonucleotide bridge and efficiency of bridge ligation and capture.
The oligonucleotide bridge contains a 5'-adenylated (5'-App) six nucleotide ssDNA tail (green), a single biotin modification (purple), a DpnII site (red) and a 3'-three carbon spacer (Sp3). The 3'-Sp3 is removed from the bridge during genomic DpnII digestion, permitting subsequent ligation to genomic DNA. Lower panel, Bar plot of the fraction of reads at each step of the data processing pipeline from a representative library preparation.
Figure 1—figure supplement 2
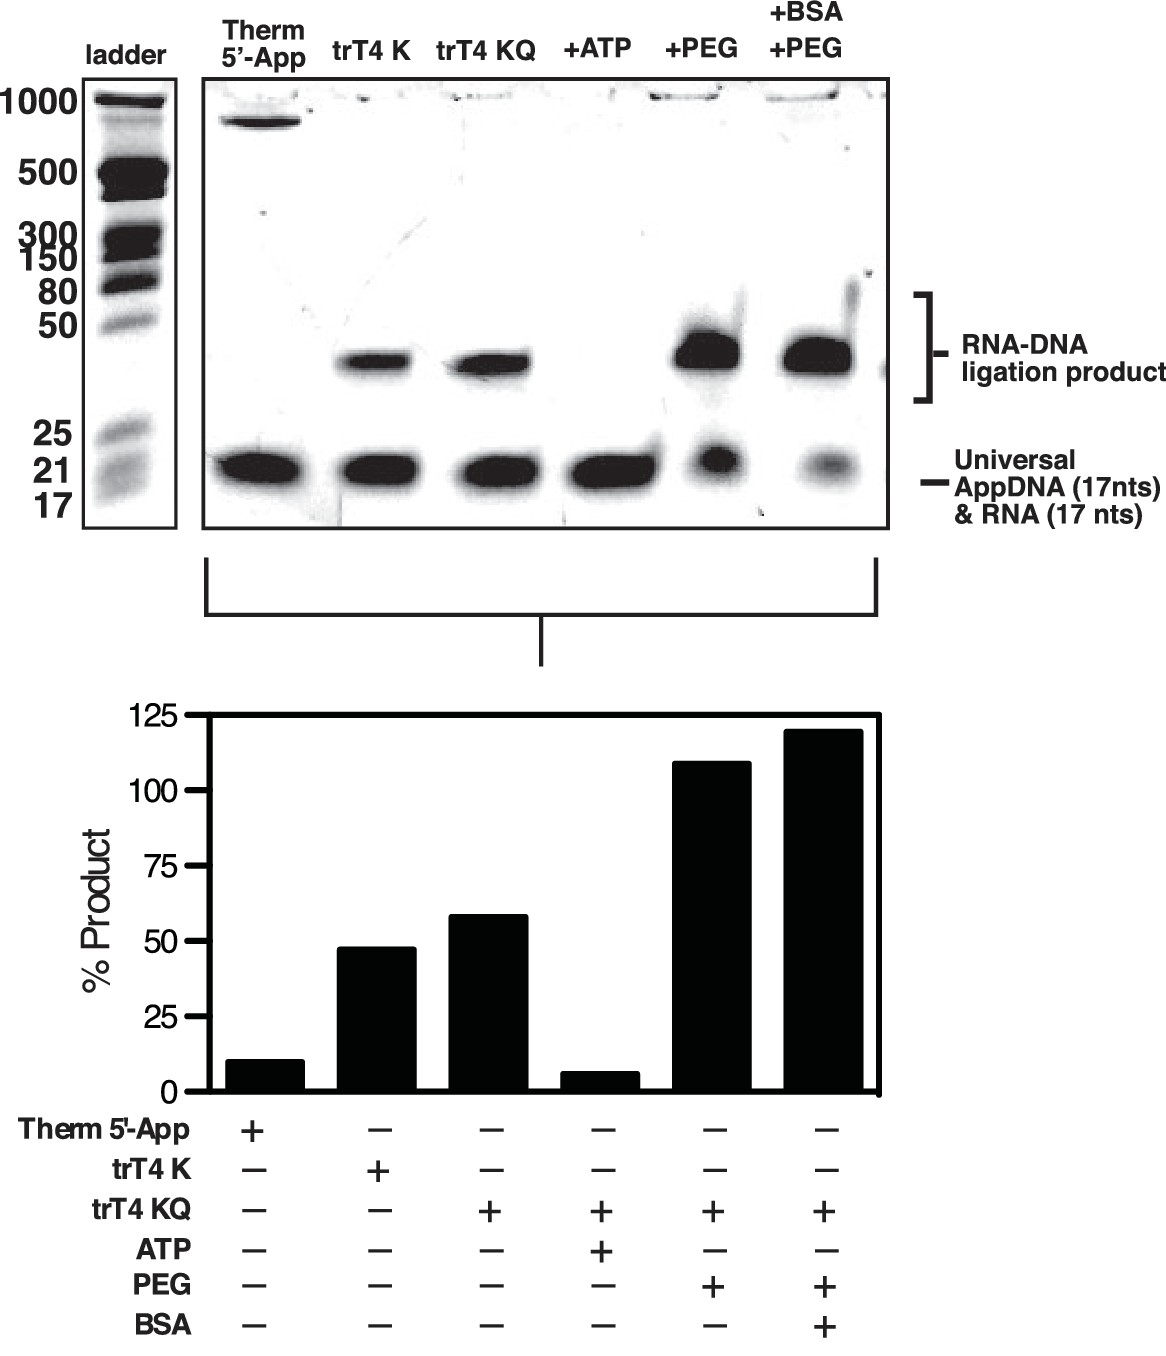
In vitro optimization of RNA-to-DNA ligation conditions.
Upper panel, Ten pmols of 17-nt adenylated ssDNA oligonucleotide (Universal App DNA, CTGTAGGCACCATCAAT) was incubated with 5 pmols of a 17nt ssRNA test probe (TTTCGTTGGAAGCGGGA) in 1x NEB T4 RNA Ligase Buffer with the indicated ligase (NEB Thermostable 5’ AppDNA/RNA ligase (Therm 5' Ligase), NEB T4 Rnl2tr K227Q Ligase (trT4K) or NEB T4 Rnl2tr R55K, K227Q ligase (trT4KQ)) and/or supplements (PEG, BSA, ATP, RNaseOUT). Products were then analyzed using denaturing polyacrylamide gel electrophoresis using a combination of NEB microRNA and low range ssRNA ladders and stained with SYBR-gold. Bands were quantified and the percent product was calculated using (shifted / (total * 0.66)) to account for the molar excess of DNA over RNA. No adjustment was made to account for preferential staining of ssDNA over ssRNA. Residual signal is expected in the lower band owing to the molar excess of DNA over RNA. A high molecular weight band is visible in the Therm 5’ Ligase lane, which most likely consists of high molecular weight concatemers of the AppDNA substrate caused by incomplete 3’ blocking of these oligos or removal of the 3’ block by the Therm 5’ Ligase. This experiment was performed once.
Figure 1—figure supplement 3
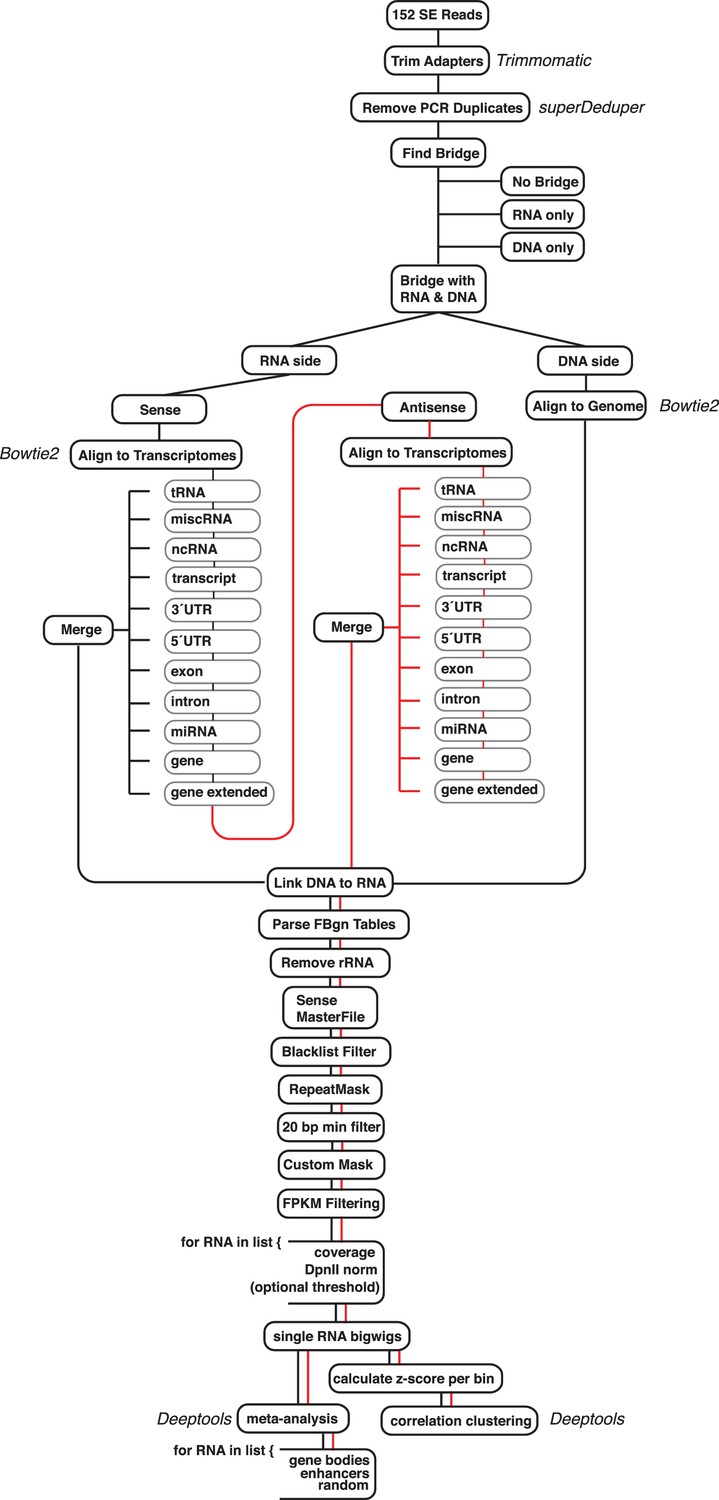
Diagram of the ChAR-seq data processing pipeline and bar plot of RNA alignment.
(a) Data were processed using a custom pipeline, which can be accessed and is fully documented at: https://github.com/straightlab/flypipe (Bell, 2017 copy archived at https://github.com/elifesciences-publications/flypipe. Red lines indicate reads that do not align to any transcriptome in the sense orientation, and are then permitted to test alignment in the antisense orientation.
Figure 1—figure supplement 4
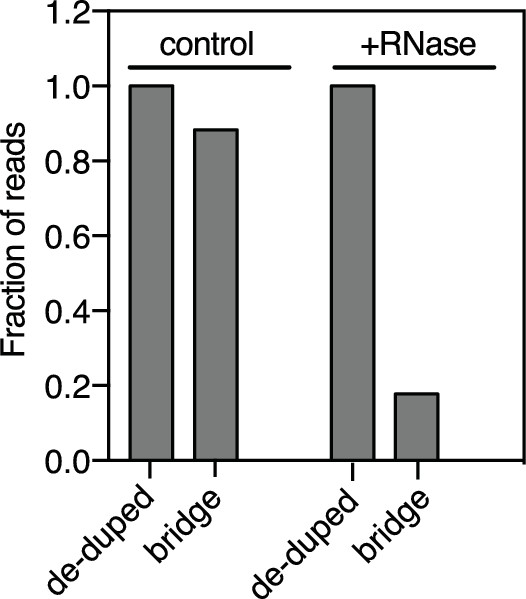
ChAR-seq RNA-to-bridge ligation is sensitive to RNase treatment.
Bar plot of the relative number of reads after PCR duplicate removal and the fraction of those reads that contained the bridge. The RNase-treated cross-linked sample was incubated with 0.25 mg/mL RNase A and 12.5 Units of RNase H for 1 hr at 37°C between steps 4 and 5 of the extended protocol, followed by an additional wash step identical to step 4.
Figure 1—figure supplement 5
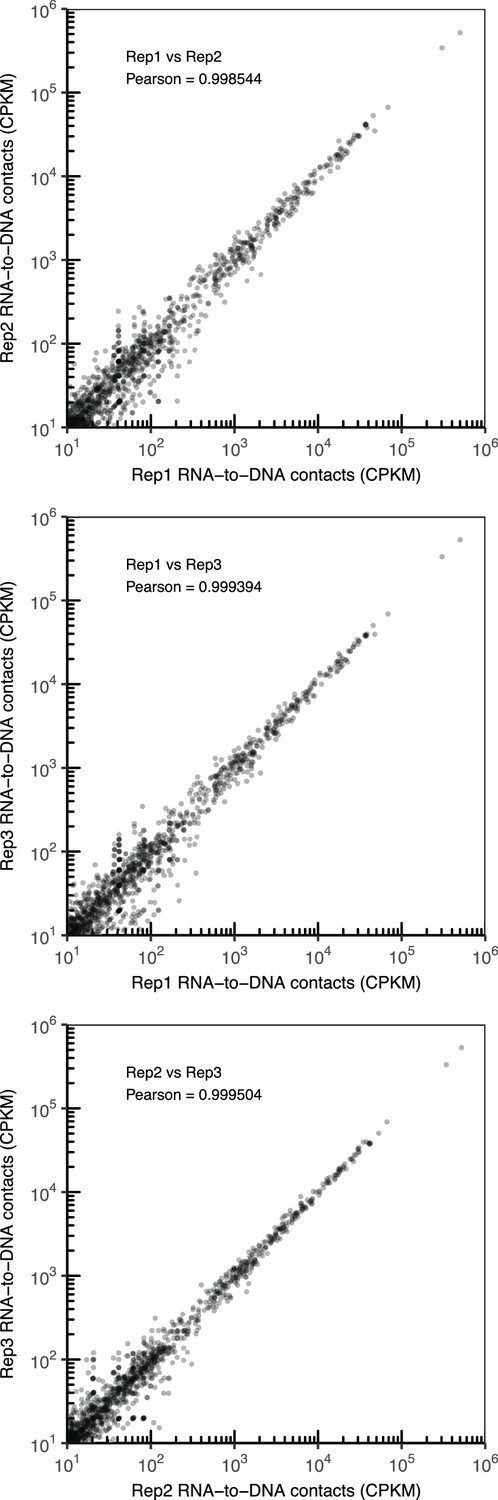
Comparison of RNA-to-DNA contacts between replicates.
Scatter plot of the number of contacts for chromatin-associated RNAs identified in CME-W1-cl8+ rep1 vs rep2 (top), rep1 vs rep3 (middle), and rep2 vs rep3 (bottom). Pearson correlation coefficient between each replicate pair is reported.
Figure 1—figure supplement 6
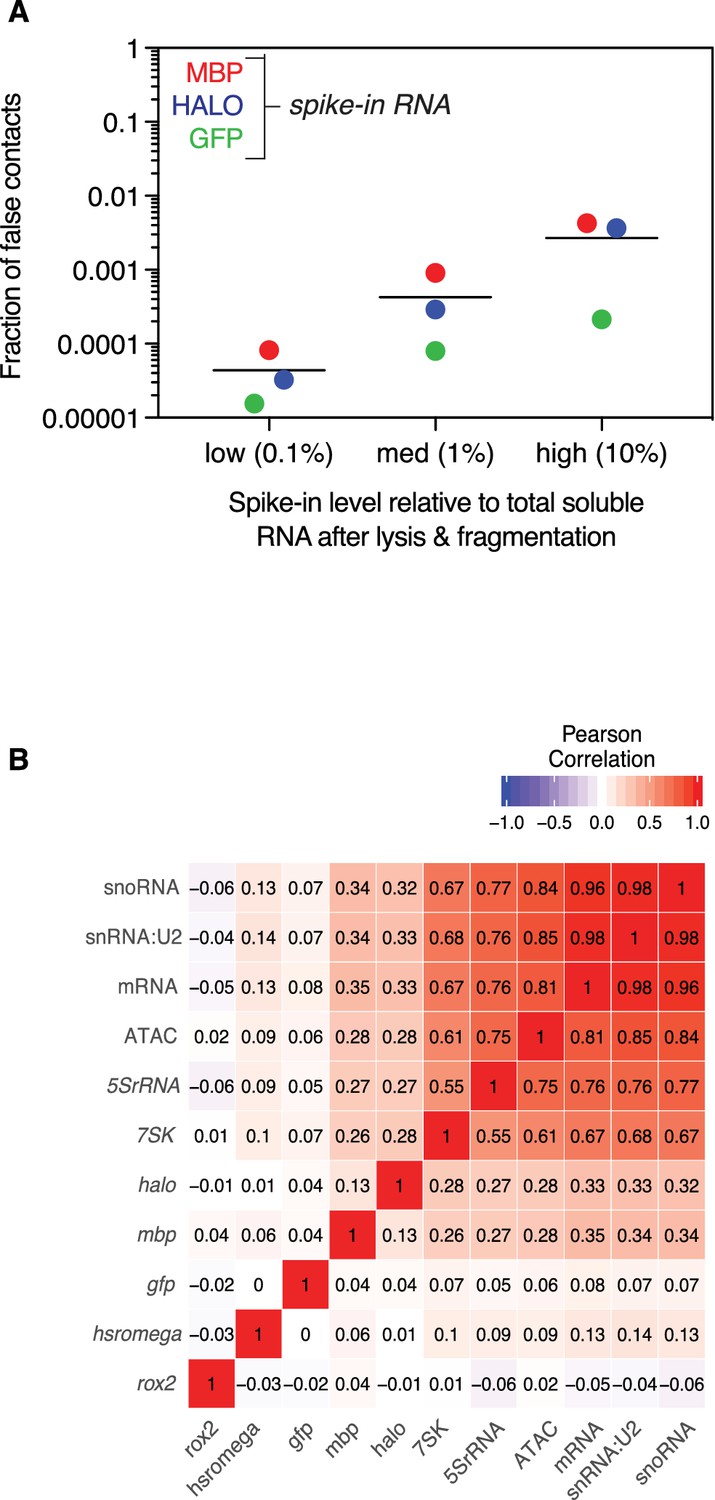
False positive contacts are proportional to RNA spike-in level.
(A) Aligned scatter plot of spike-in level, as percentage of total soluble RNA (x-axis) vs percentage of false contacts (y-axis). MBP (red), Halo (blue), and GFP (green) purified RNA was added at 0.1%, 1%, and 10% of total soluble RNA. Bar indicated mean number of false contacts for all three spike-ins experiments at each concentration. (B) Heatmap of Pearson correlation coefficients at 100 kb bins of example class I (Hsromega), class II (7SK, 5SrRNA, snRNA:U2), and class III RNAs (roX2), aggregated mRNAs and snoRNAs, and ATAC-seq signal, which is indicative of open chromatin, and spike-ins. The genomic associations of spike-ins do not correlate well with each other, transcriptionally associated RNAs, or open chromatin.
Figure 1—figure supplement 7
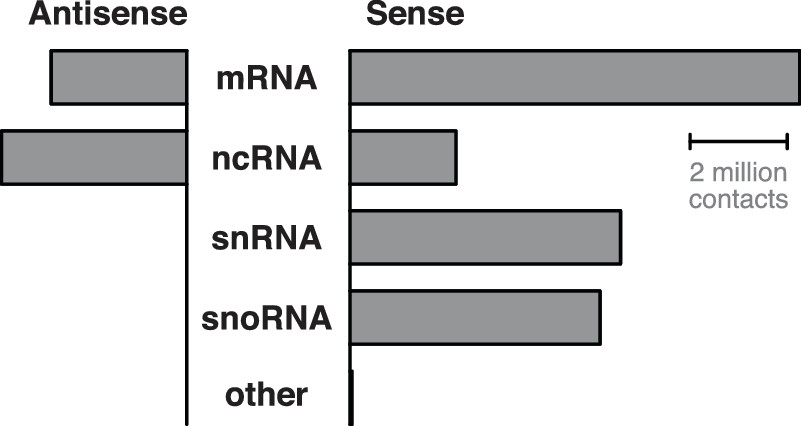
Chromatin-associated RNA alignment by class.
Relative abundance of chromatin-associated RNA by transcriptome classification and strand orientation in Drosophila melanogaster CME-W1-cl8+ (male) wing disc cells.
Figure 1—figure supplement 8
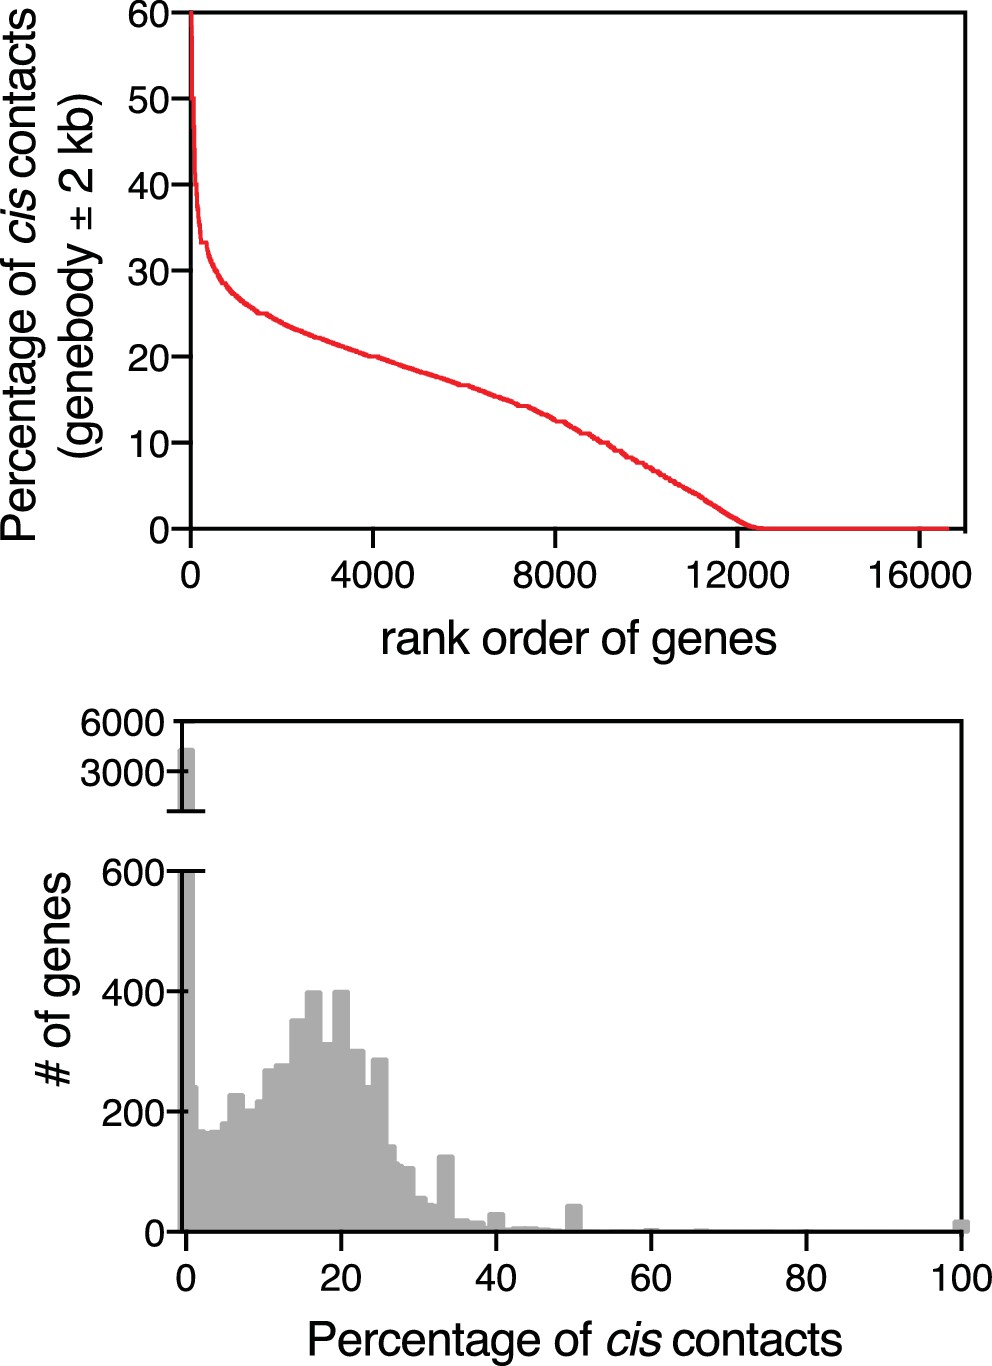
Abundance of cis contacts.
For each gene in our dataset, we functionally defined cis contacts as RNA-to-DNA contacts that lie within the gene body (±2 kb) for a given RNA (i.e., contacts that arise from nascent transcription). We then calculated a cis score, which is equivalent to the percentage of contacts that arise from this region. Upper plot is the per gene rank order analysis based on the cis score for each RNA in our dataset. Lower plot is a histogram of the frequency distribution for each cis score (percentage).
Figure 1—figure supplement 9
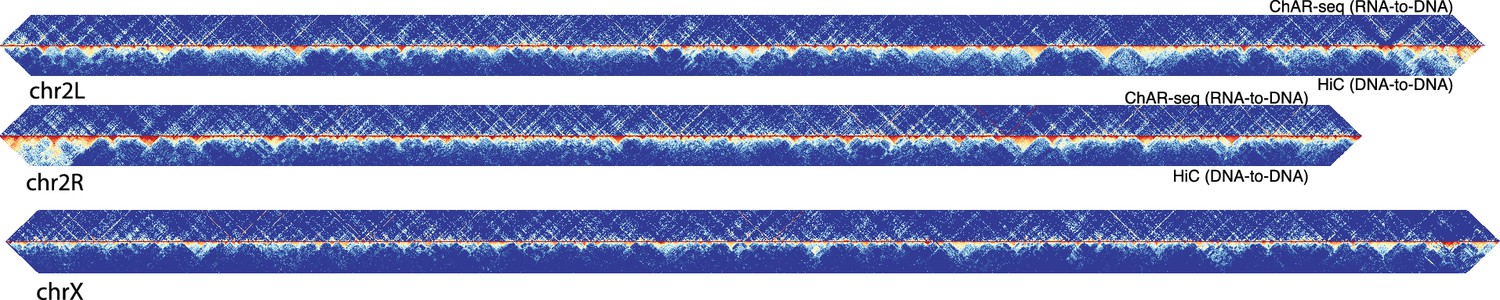
ChAR-seq RNA-DNA contacts are dissimilar to DNA-DNA contacts.
Representative contact matrix plots for chr2L, chr2R and chrX showing RNA-to-RNA contacts (ChAR-seq, top-half), relative to DNA-to-DNA contacts from Hi-C/Mock-ChAR (Hi-C, bottom half).
Figure 1—figure supplement 10
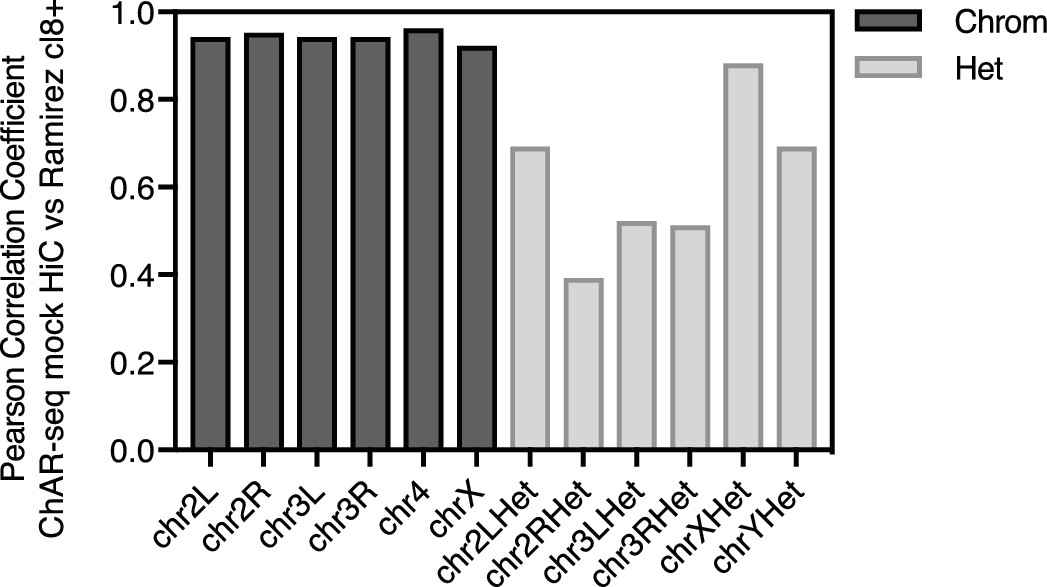
ChAR-seq protocol preserves genome organization.
Bar plot of Pearson correlation coefficients by chromosome calculated by comparing Hi-C data from CME-W1-cl8+ (Ramírez et al., 2015) to our Hi-C/Mock-ChAR libary, where no bridge was added and biotin fill-in was performed following DpnII digestion, but prior to ligation.
Figure 2 with 2 supplements
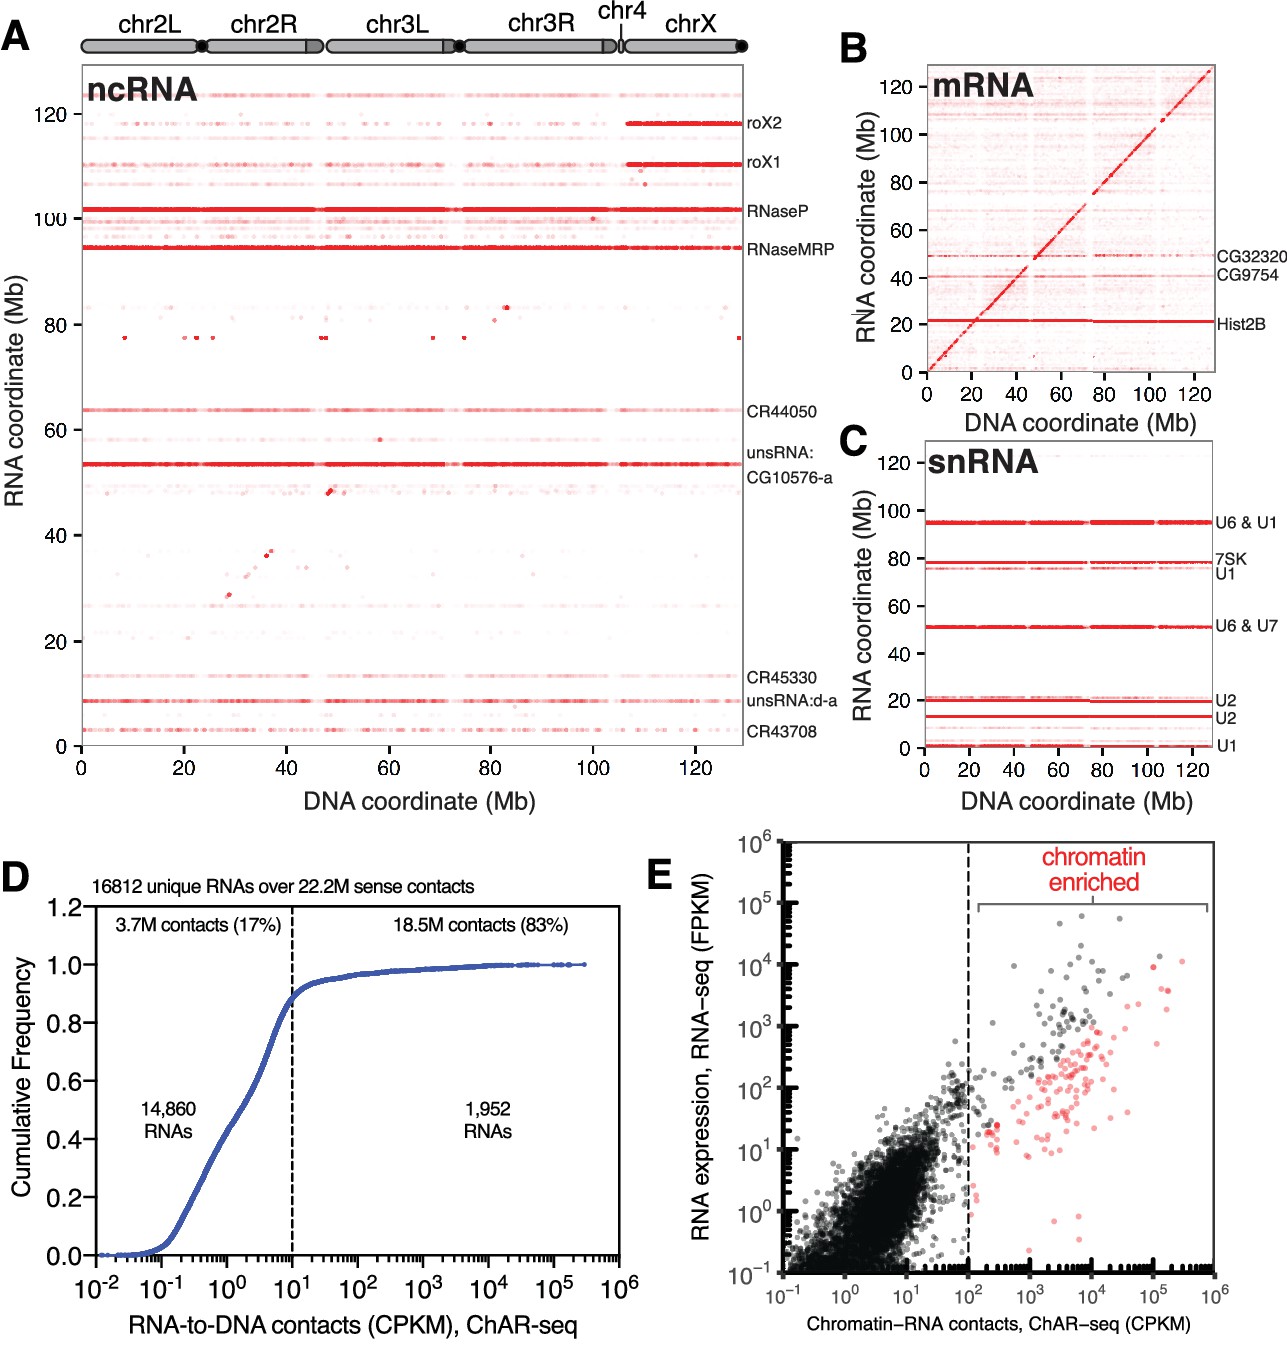
ChAR-seq is an ‘all to all’ RNA-to-DNA proximity ligation method.
(A) Genome-wide plot of RNA to DNA contacts for non-coding RNAs. The y-axis represents the region of the genome from which a given RNA was transcribed and the x-axis represents the region of the genome where each RNA was found to be associated through proximity ligation (i.e., the binding site for each RNA). Genome-wide contact plots generated in the same way for (B) mRNA, and (C) snRNA. (D) Cumulative frequency of length-normalized contacts for 16,812 RNAs identified on the ‘RNA-side’ of chimeric reads. The majority (88%) of RNAs have fewer than 10 contacts per kilobase per million reads (CPKM) in our dataset and were not further analyzed owing to low coverage. The remaining 1952 RNAs account for 18.5 million (83%) of the total RNA-to-DNA contacts. (E) Scatter plot of length normalized chromatin-contacts versus total expression for each RNA. The 138 RNAs that had more than 100 CPKM and were enriched more than ten-fold are highlighted in red.
Figure 2—figure supplement 1
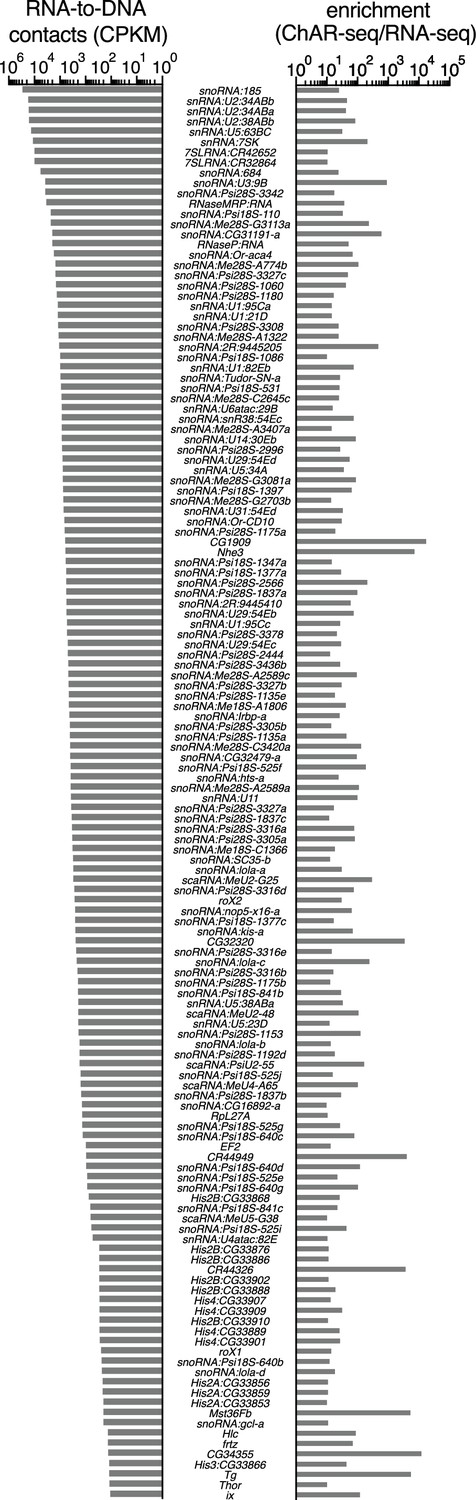
Chromatin-associated RNAs ranked according to CPKM and enrichment in ChAR-seq over RNA-seq.
RNAs are sorted according to the abundance of their genome-wide contacts (CPKM, left bars). Right bars represent the fold-enrichment of each RNA in ChAR-seq over RNA-seq.
Figure 2—figure supplement 2
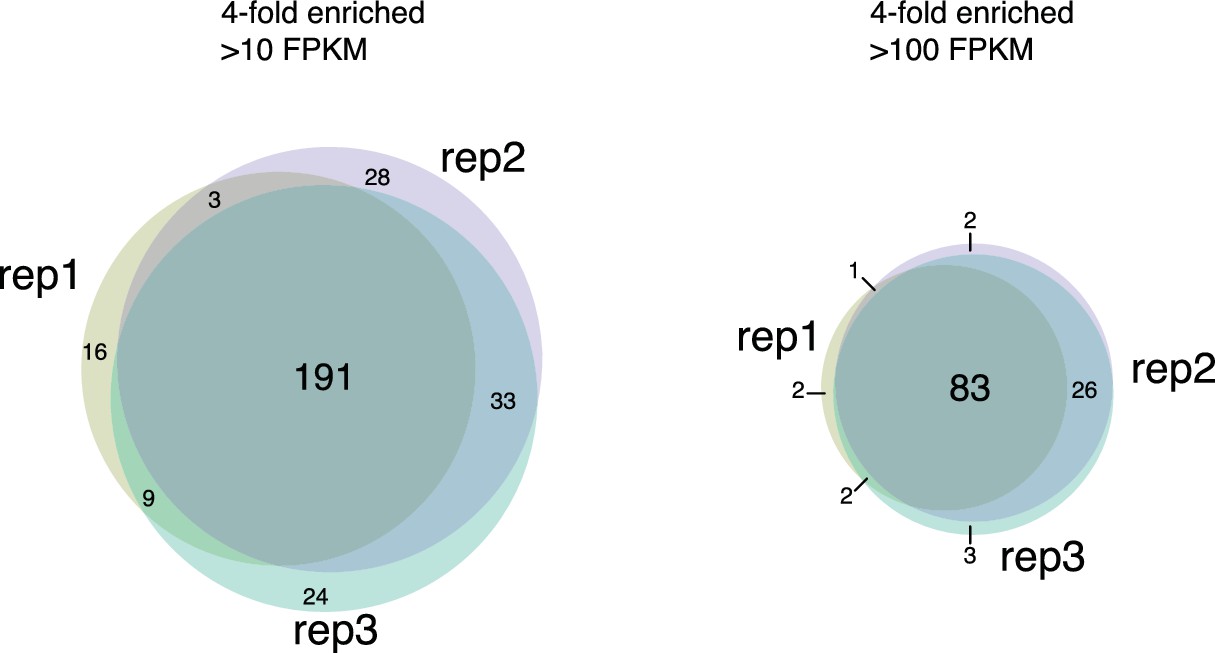
Chromatin associated RNAs identified by ChAR-seq are highly reproducible.
Venn diagrams displaying overlap of chromatin-associated RNAs identified as having contacts more than 4-fold enriched over RNA expression which have more than 10 CPKM (left) or more than 100 CPKM (right) in technical replicates.
Figure 3 with 2 supplements
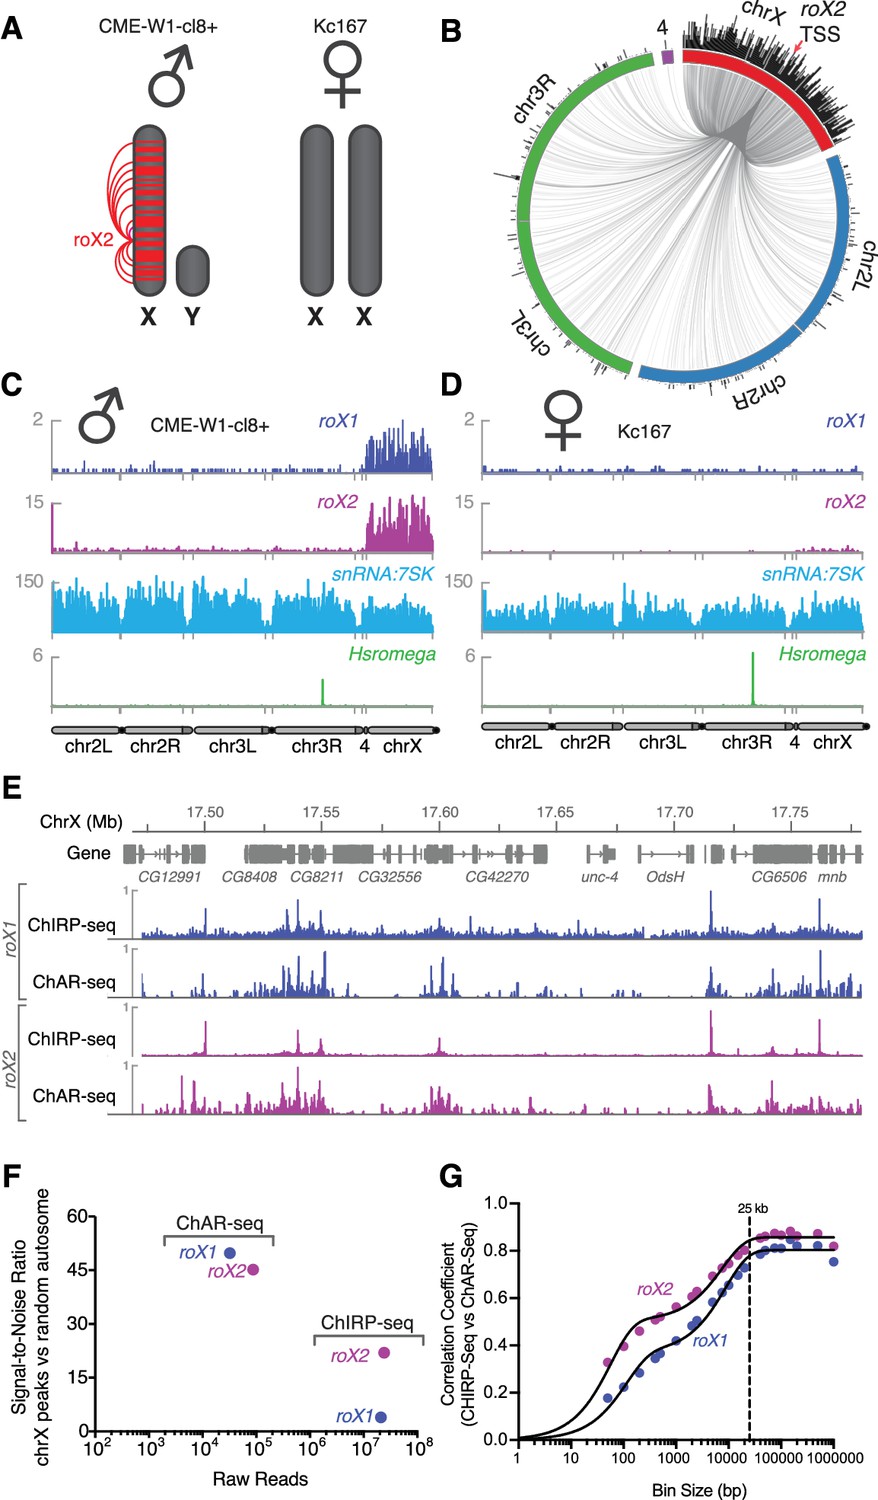
Mapping roX1 and roX2 of the X chromosome dosage compensation complex.
(A) Illustration of the roX1/roX2 spreading across the solitary X chromosome in male flies (CME-W1-cl8+ cell line). In contrast, the female-derived Kc167 cell line expresses significantly lower levels of the MSL2 complex, which mediates the association of roX1 and roX2, which therefore do not coat either of the two X-chromosomes in females. (B) Circos plot showing roX2 spreading from its site of transcription (red arrow) and binding with high density along the X-chromosome but low density binding throughout the genome. (C) Coverage plots of roX1 (blue), roX2 (purple), snRNA:7SK (cyan) and Hsromega (green) in male CME-W1-cl8+ cells. Tracks are DpnII normalized reads. ChAR-seq data were subsampled to match the read depth of the Kc167 sample. (D) Complementary coverage plots generated from female Kc167 cells. (E) Comparison of ChAR-seq (this work) to an alternative RNA-to-chromatin mapping method called ChIRP-seq (data from reference [Quinn et al., 2014]). Tracks for roX1 (upper, blue) and roX2 (lower, purple) were generated from 32308 and 87453 contacts, respectively, from a ChAR-seq dataset containing a total of 22.2 million contacts. For comparison, the roX1 and roX2 tracks derived from ChIRP-seq each represent greater that 20 million reads. To compare tracks at different read depths, the contact number was autoscaled, with the maximum peak height given a value of 1. (F) Comparison of the signal-to-noise ratio (see methods) between ChAR-seq and Chirp-seq for roX genes. ‘Raw reads’ is the number of roX reads present in each data set analyzed. (G) Correlation coefficients were calculated for roX1 and roX2 coverage tracks generated using ChIRP-seq and ChAR-seq and plotted relative to increasing bin size to estimate the resolution of the ChAR-seq assay.
Figure 3—figure supplement 1
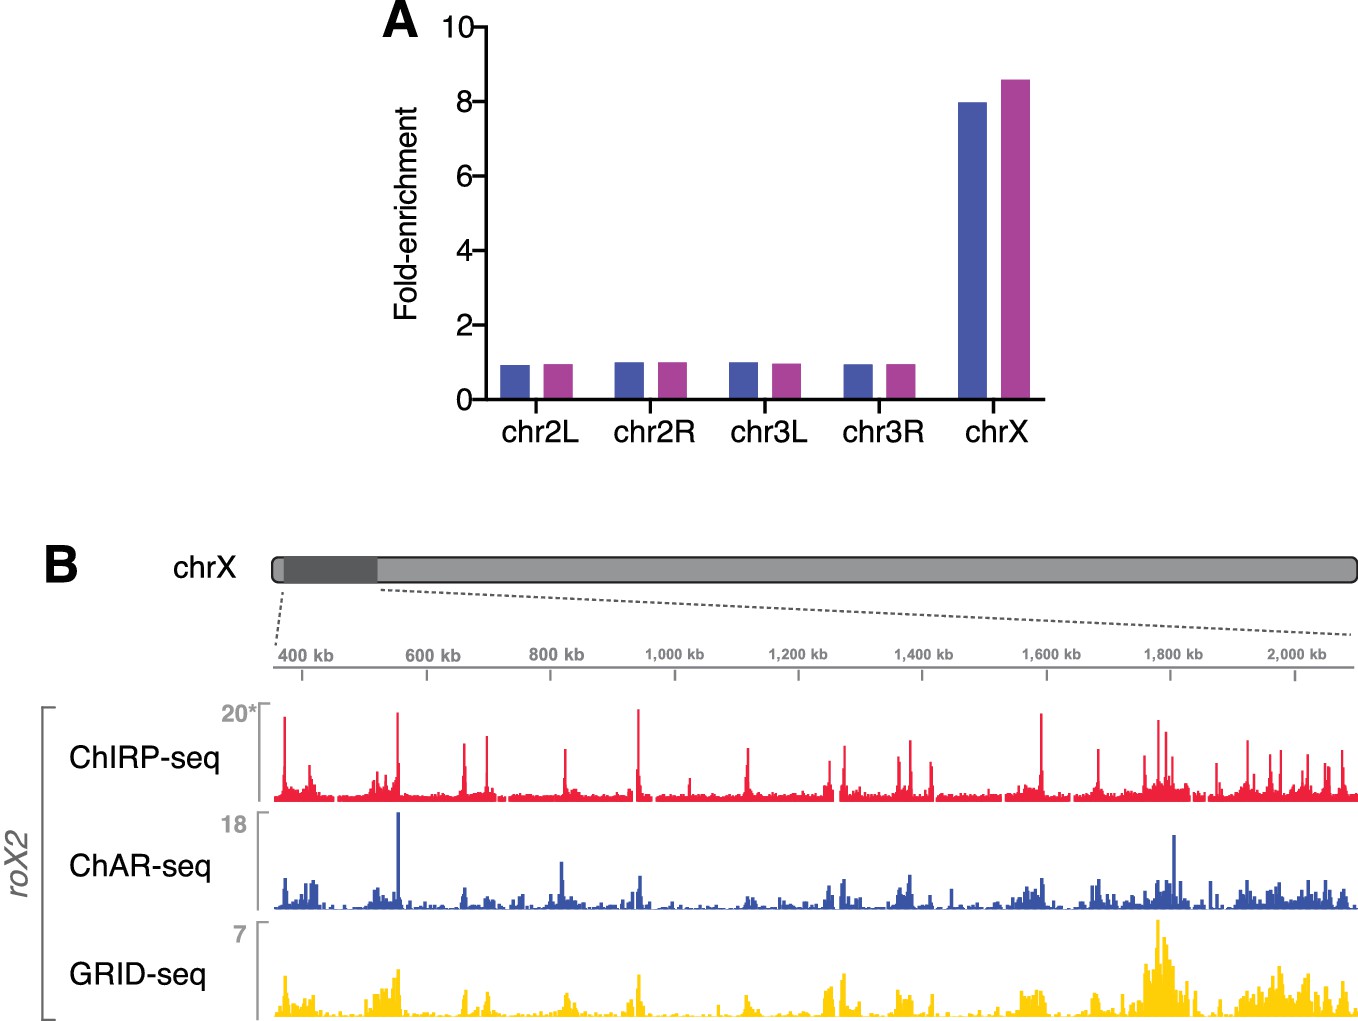
roX RNAs are enriched on the X chromosome.
(A) roX1 and roX2 are ~8 fold enriched on chromosome X as compared to autosomes (autosomal reads normalized to 1). (B) Comparison of ChAR-seq with ChIRP-seq and another recently published RNA-DNA contact identification method, GRID-seq (Li et al., 2017). Genome browser view displays contact signal for ChAR-seq, GRID-seq, and ChIRP-seq roX2 binding in a 1.75 Mb window on chrX. Signal is binned in 2 kb increments. Read density is DpnII or AluI site density normalized for ChAR- and GRID-seq, respectively, and library sized normalized for published ChIRP-seq data (asterisk). See Extended methods for filtering and restriction enzyme density normalization procedures. The Spearman’s rank correlation of signal (over 20 kb bins across chrX) between methods is: ChAR-ChIRP, rho = 0.80, GRID-ChIRP, rho = 0.84, ChAR-GRID, rho = 0.79.
Figure 3—figure supplement 2
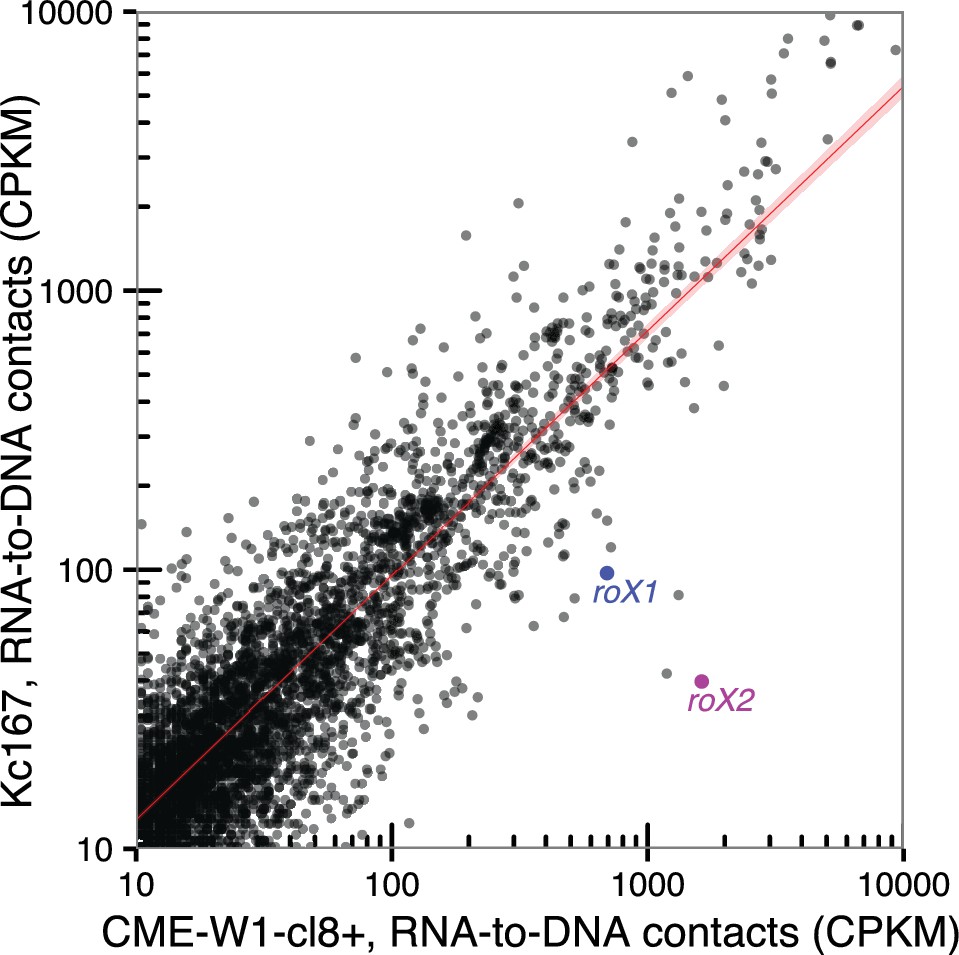
Comparison of RNA-to-DNA contacts between cell type.
Scatter plot of the number of contacts for chromatin-associated RNAs identified in CME-W1-cl8+ (x-axis) and Kc167 (y-axis) cell lines. Location of roX1 and roX2 are indicated in blue and purple respectively. Red line indicates where chromatin-associated RNAs that are not expressed in a cell-type dependent manner are expected to be found.
Figure 4 with 2 supplements
Correlation of chromatin-associated RNAs with genome features.
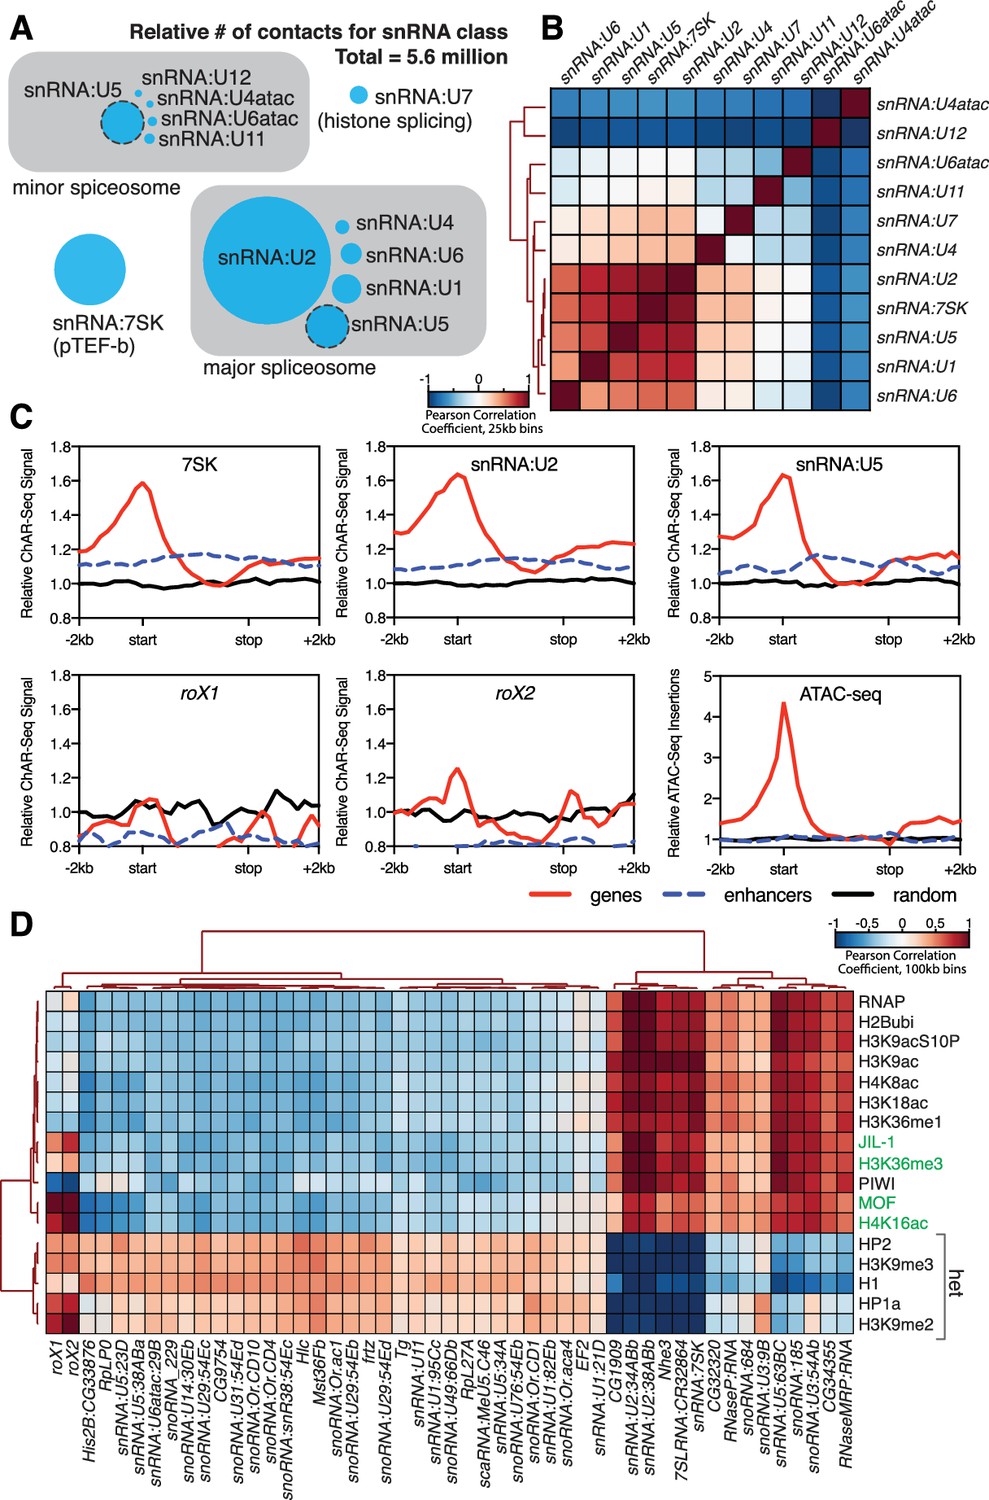
(A) Relative abundance of snRNAs identified by ChAR-seq. The size of the circles is proportional to the abundance of the snRNAs found by ChAR-seq. RNA components of the major and minor spliceosome are bounded by the gray boxes. (B) Cluster analysis of the pairwise correlation between genome-wide tracks of snRNAs. (C) Meta-analysis plots aggregating the signal of snRNA:7SK, snRNA:U2, snRNA:U5, roX1, roX2 and ATAC-seq over gene bodies (red), putative enhancers (blue dashed line) and random regions (black). (D) Hierarchical clustering based on pairwise Pearson correlation between representative ChAR-seq RNA-to-DNA contact coverage tracks (black) and modENCODE datasets available for the WME-C1-cl8 + cell line. Notable associations for the dosage compensation complex (green) and heterochromatin (‘het’) are indicated in the right margin.
Figure 4—figure supplement 1
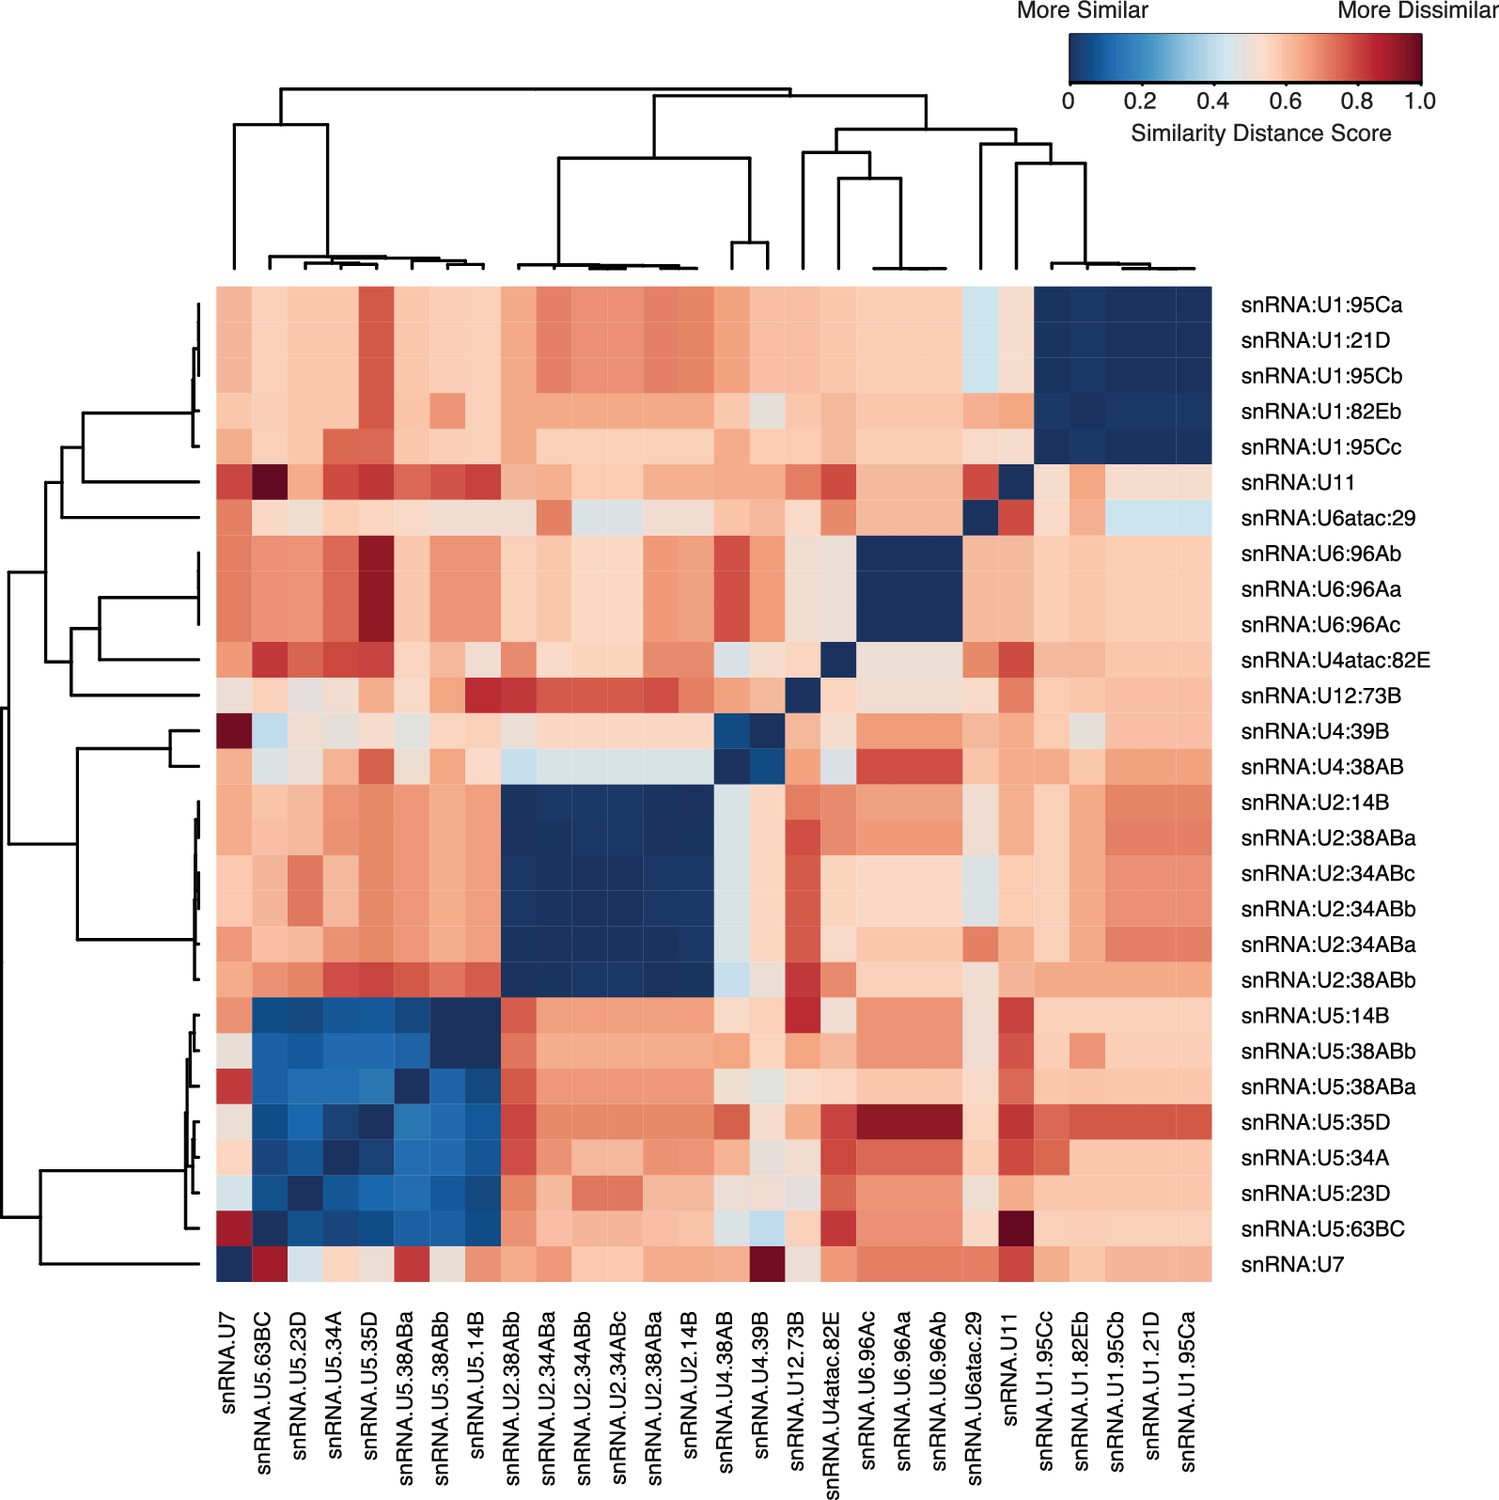
Sequence similarity of snRNAs.
Pairwise alignment of snRNA gene variants annotated in FlyBase was performed using Genious R7 using a global alignment with free-end gaps and a 51% similarity cost matrix and the Tamura-Nei distance model. Distance scores were then clustered using the heatmap module in R. Low scores (blue) represent a high similarity, while a higher score (red) represents higher levels of dissimilarity.
Figure 4—figure supplement 2
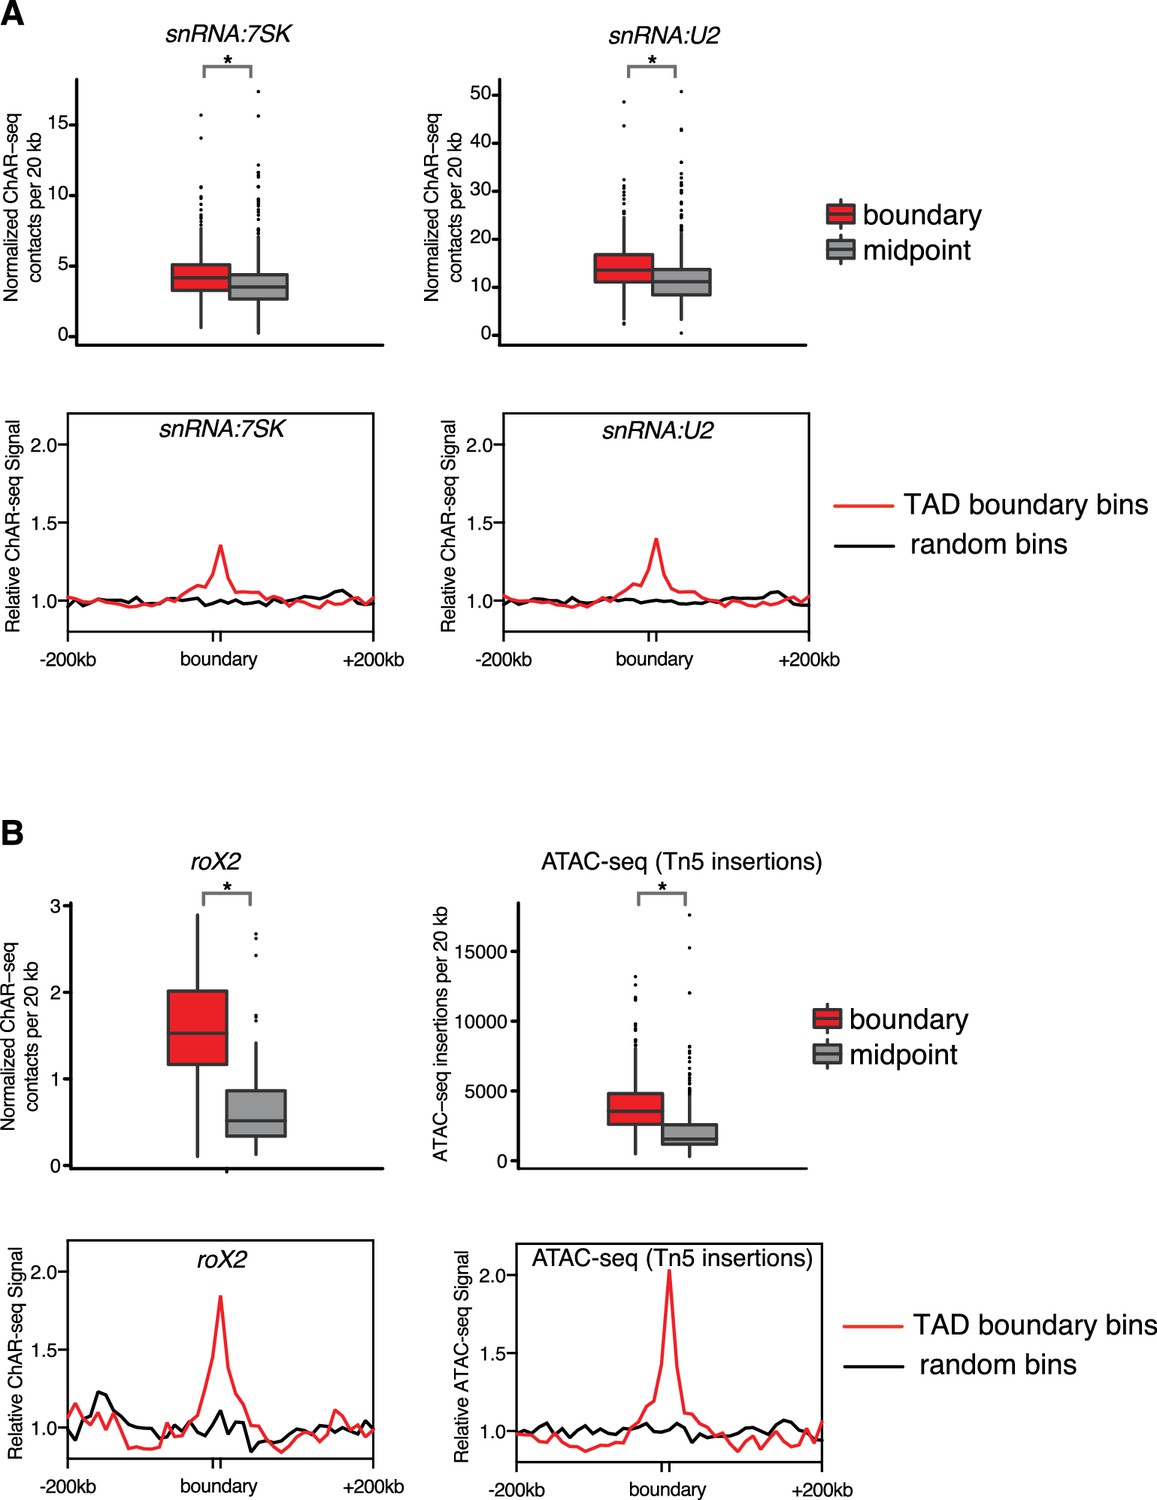
RNA abundance over TAD boundaries and centers.
(A) (top row) Boxplots showing the number of snRNA:7SK and snRNA:U2 ChAR-seq RNA-DNA trans contacts intersecting TAD boundaries (blue) or TAD centers (red) in 20 kb bins centered around the feature. Boxplot contains the median and interquartile range (25th and 75th percentile) for RNA-to-DNA contacts per bin for each RNA type. Bins were matched for repeatmasking and size. Asterisks above each boxplot denote p-values (p<1×10⁻⁹), and were calculated using the Wilcoxon rank-sum test and Bonferonni corrected for the multiple tests (all p-values<1×10⁻⁹). (bottom row) Meta-analysis plots aggregating the signal of snRNA:7SK and snRNA:U2 over TAD boundaries (red) and random regions (black) of matched size. Signal is relative to random background. (B) Similar plots as in (A), but for roX2 and ATAC-seq (i.e., Tn5 insertion signal).
Author response image 1
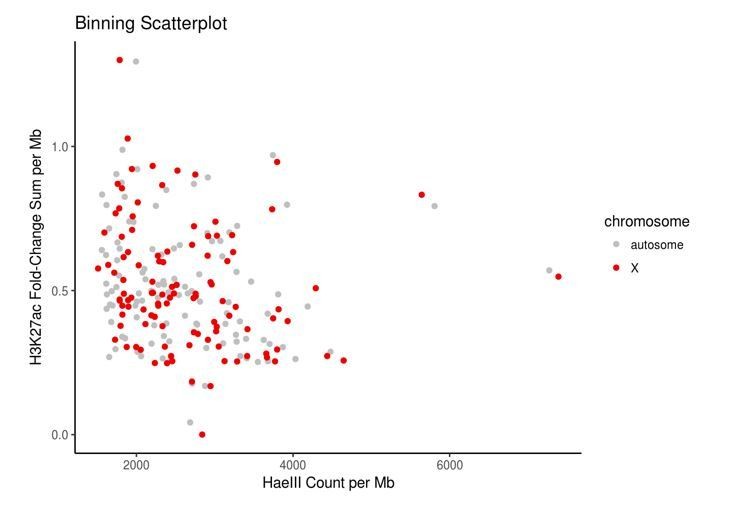
Control bins on autosomes were chosen to match bins on the X chromosome in terms of HaeIII restriction sites and accessible chromatin, here measured using the proxy of H3K27ac data because direct measurements of accessibility such as ATAC-seq or DNase-seq data were not publicly available for HEK293 cells.
https://doi.org/10.7554/eLife.27024.026
Author response image 2
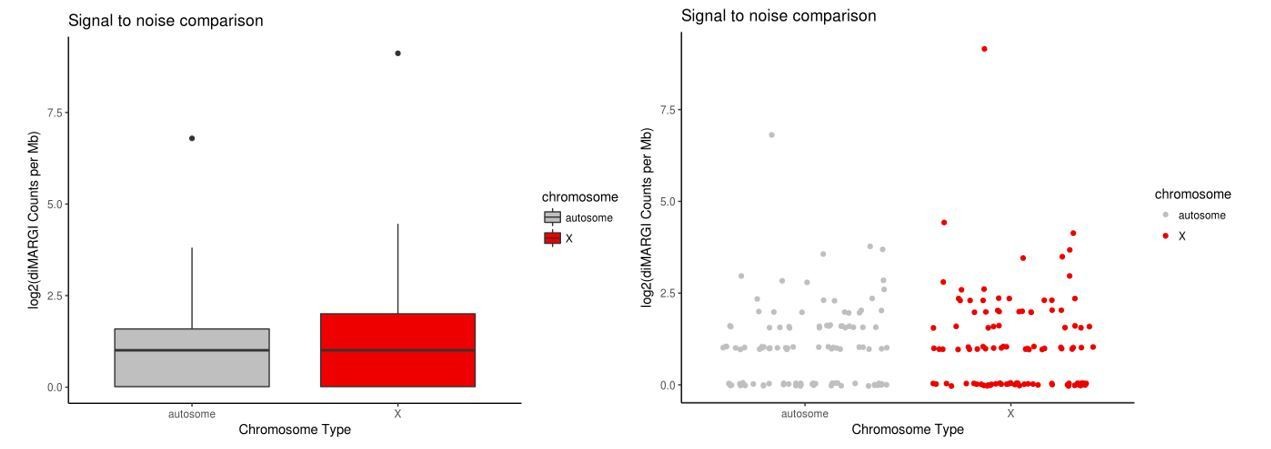
diMARGI signal to noise estimate via X vs. autosome comparison in HEK293 cells.
Plots of log2(diMARGI counts per megabase) for bins spanning the X chromosome and random, accessibility- and restriction site-matched bins on autosomes (left: box pot, right: scatter plot of same data).
Additional files
-
Supplementary file 1
Data table for library sequencing.
Table of read count information on four libraries used for ChAR-Seq analysis, control libraries and spike in controls. Table lists raw read counts and counts after each filtering step.
- https://doi.org/10.7554/eLife.27024.022
-
Supplementary file 2
Table of chromatin interacting RNAs.
Table of 8822 chromatin interacting RNAs. Table lists total number of contacts for each RNA, RNA length, name of the RNA, FlybaseID, normalized RNA-DNA contact frequency (contacts per kilobase million reads, CPKM), RNA-seq expression level in FPKM, and chromatin enrichment (i.e., the ratio of CPKM/FPKM).
- https://doi.org/10.7554/eLife.27024.023
-
Transparent reporting form
- https://doi.org/10.7554/eLife.27024.024
Download links
A two-part list of links to download the article, or parts of the article, in various formats.
Downloads (link to download the article as PDF)
Open citations (links to open the citations from this article in various online reference manager services)
Cite this article (links to download the citations from this article in formats compatible with various reference manager tools)
Chromatin-associated RNA sequencing (ChAR-seq) maps genome-wide RNA-to-DNA contacts
eLife 7:e27024.
https://doi.org/10.7554/eLife.27024


