Acidic C-terminal domains autoregulate the RNA chaperone Hfq
- Johns Hopkins University, United States
Figures
Figure 1 with 3 supplements
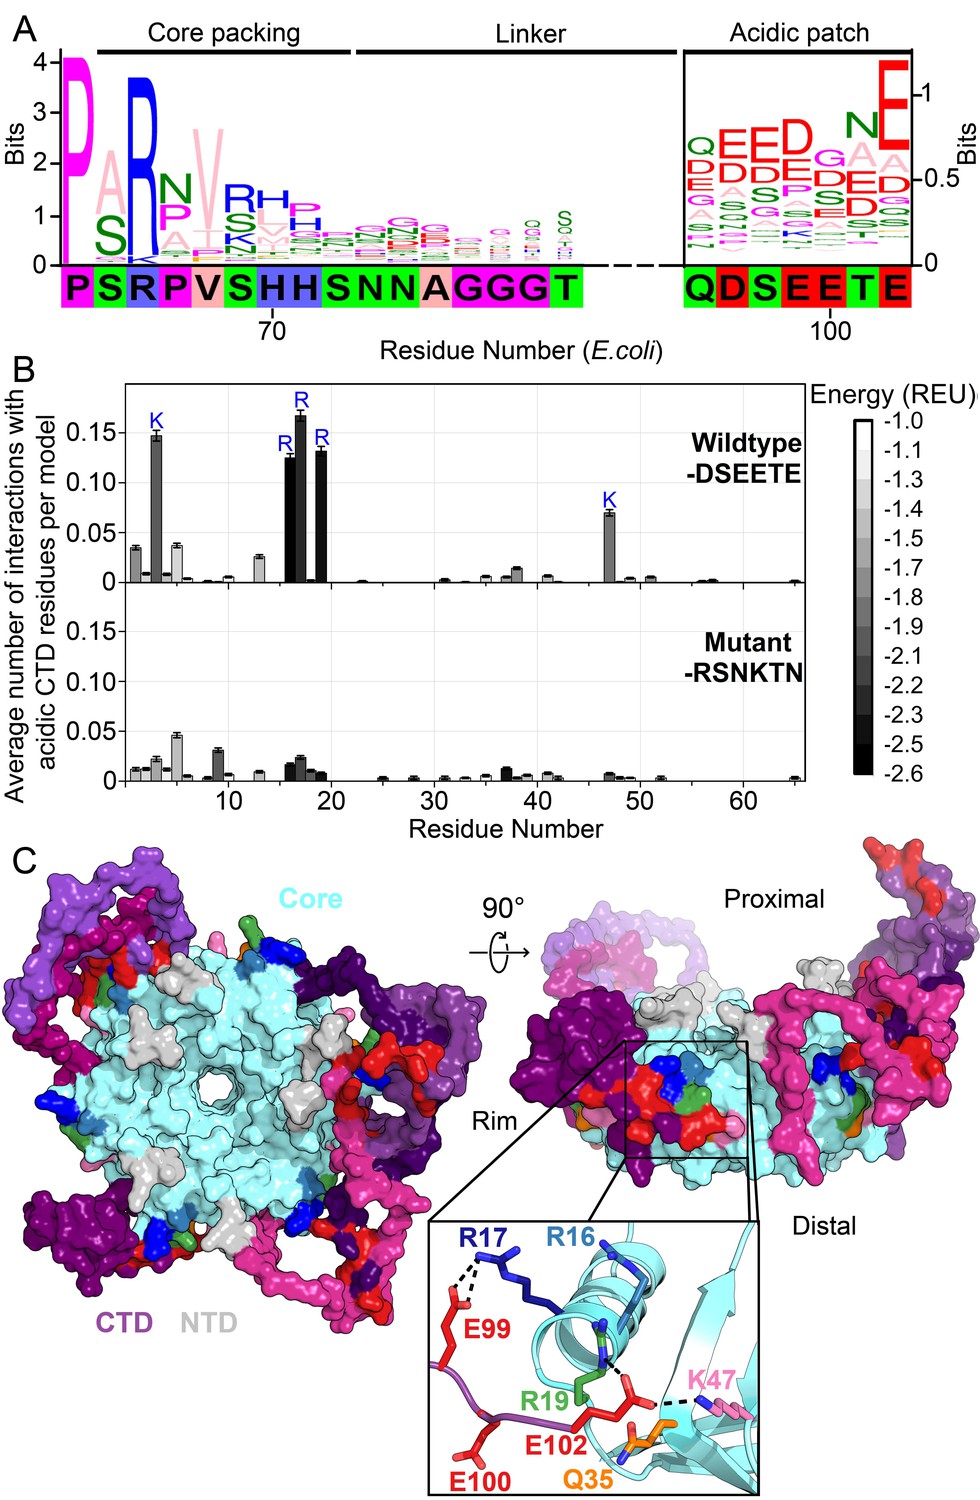
Acidic residues in the Hfq CTD are predicted to bind basic core.
(A) Sequence logo (Crooks et al., 2004) of the CTD generated from gapped alignment of Hfq sequences that clustered with Escherichia coli Hfq (Group 1 in Figure 1—figure supplement 1A,B), numbered according to the E. coli sequence. Regions of interest are denoted above. The gapped E. coli CTD sequence is shown below. Eukaryotic Sm proteins cluster separately (Figure 1—figure supplement 1C). (B) (Top) Average number of times a given core residue favorably interacts (E < −1.0 Rosetta Energy Units) with at least one acidic CTD residue, per low energy model. Acidic CTD residues most frequently interact with basic Hfq core residues. (Bottom) Mutation of acidic CTD residues 97, 99, 100 and 102 to basic or polar residues decreases the number of predicted core interactions. Error bars represent ± 1 s.d. as computed by bootstrap resampling of the computational models (see Methods and Figure 1—figure supplement 2). Of 36 core residues not predicted to interact with the CTD, 14 had accessible surface area < 2.0 A2, computed in PyMOL. (C) (Left) Example low-energy model of wildtype E. coli Hfq; top-down proximal view. Light grey, NTD; cyan, Hfq core; pink-purple, CTD; red, CTD tip. (Center) Side view of rim of the same Hfq model. (Inset) Example hydrogen bonding network at the CTD–core binding interface showing interactions between the acidic CTD residues (red) and core residues as indicated. Additional models in Figure 1—figure supplement 3.
Figure 1—figure supplement 1
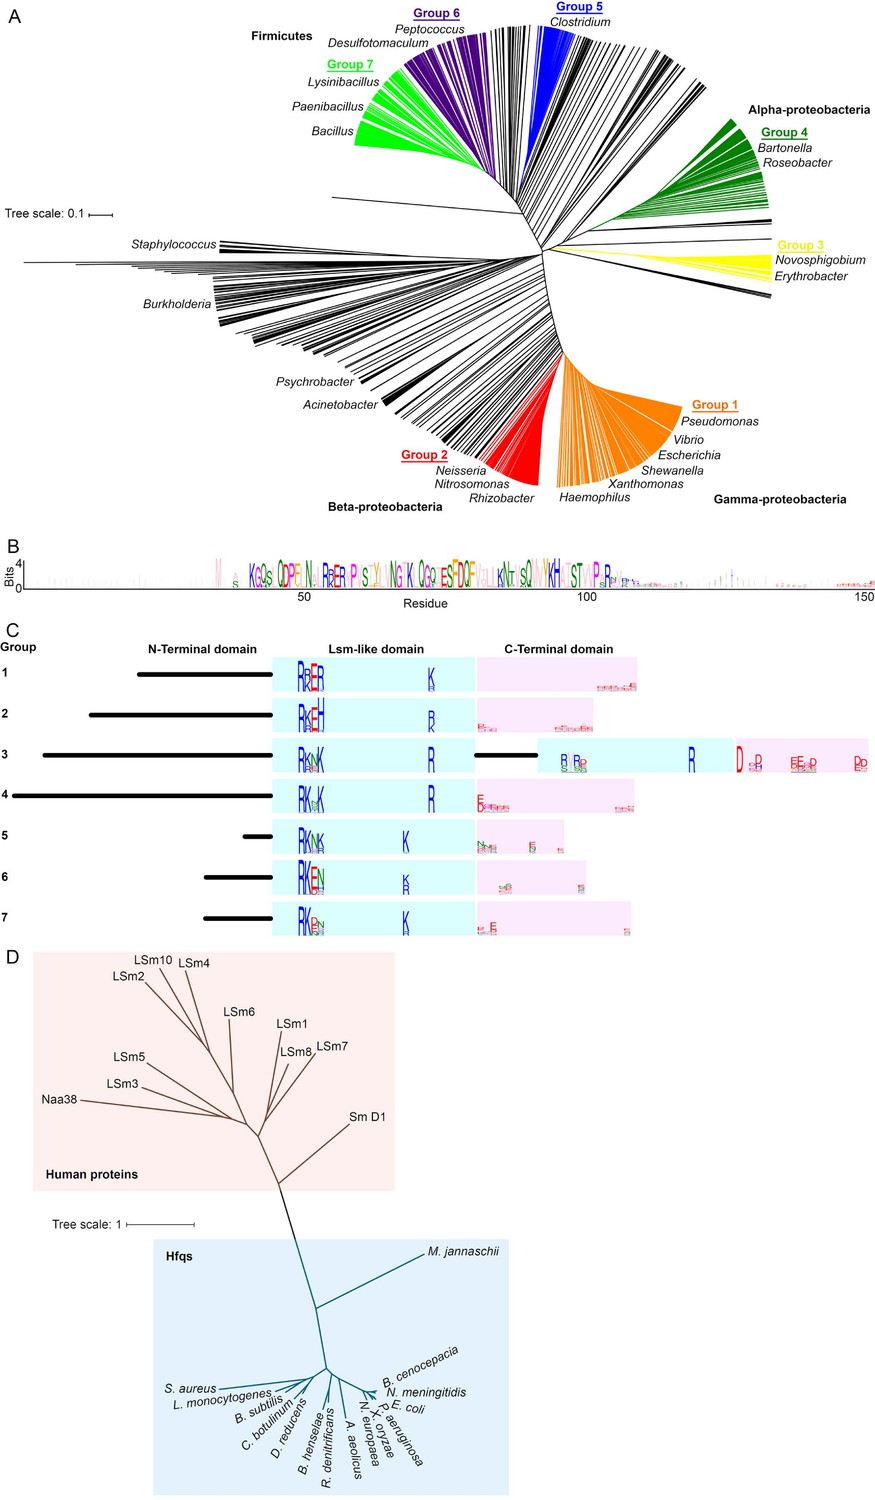
Alignment and clustering of Hfq sequences used in this study.
(A) Neighbor-joining phylogenetic tree of 985 non-redundant, representative Hfq sequences. Tree was visualized using iTOL (Letunic and Bork, 2016). (B) Sequence logo (Crooks et al., 2004) generated for Group 1, containing Pseudomonas, Vibrio, Escherichia, Shewanella, Xanthomonas and Haemophilus species. Residues are colored according to the Zappo coloring scheme. The C-terminal region of this logo is examined in Figure 1A. (C) Schematic of domain structure with logos for basic motifs on the rim of the Like-Sm (Lsm) domain and acidic residues in the C-terminal domain. (D) Neighbour-joining phylogenetic tree of a subset of the bacterial Hfqs, an Archaeal Hfq (Methanoccocus jannaschii) and human proteins containing LSm domains. This phylogenetic relationship is similar to that in Ref. (Mura et al., 2013).
Figure 1—figure supplement 2
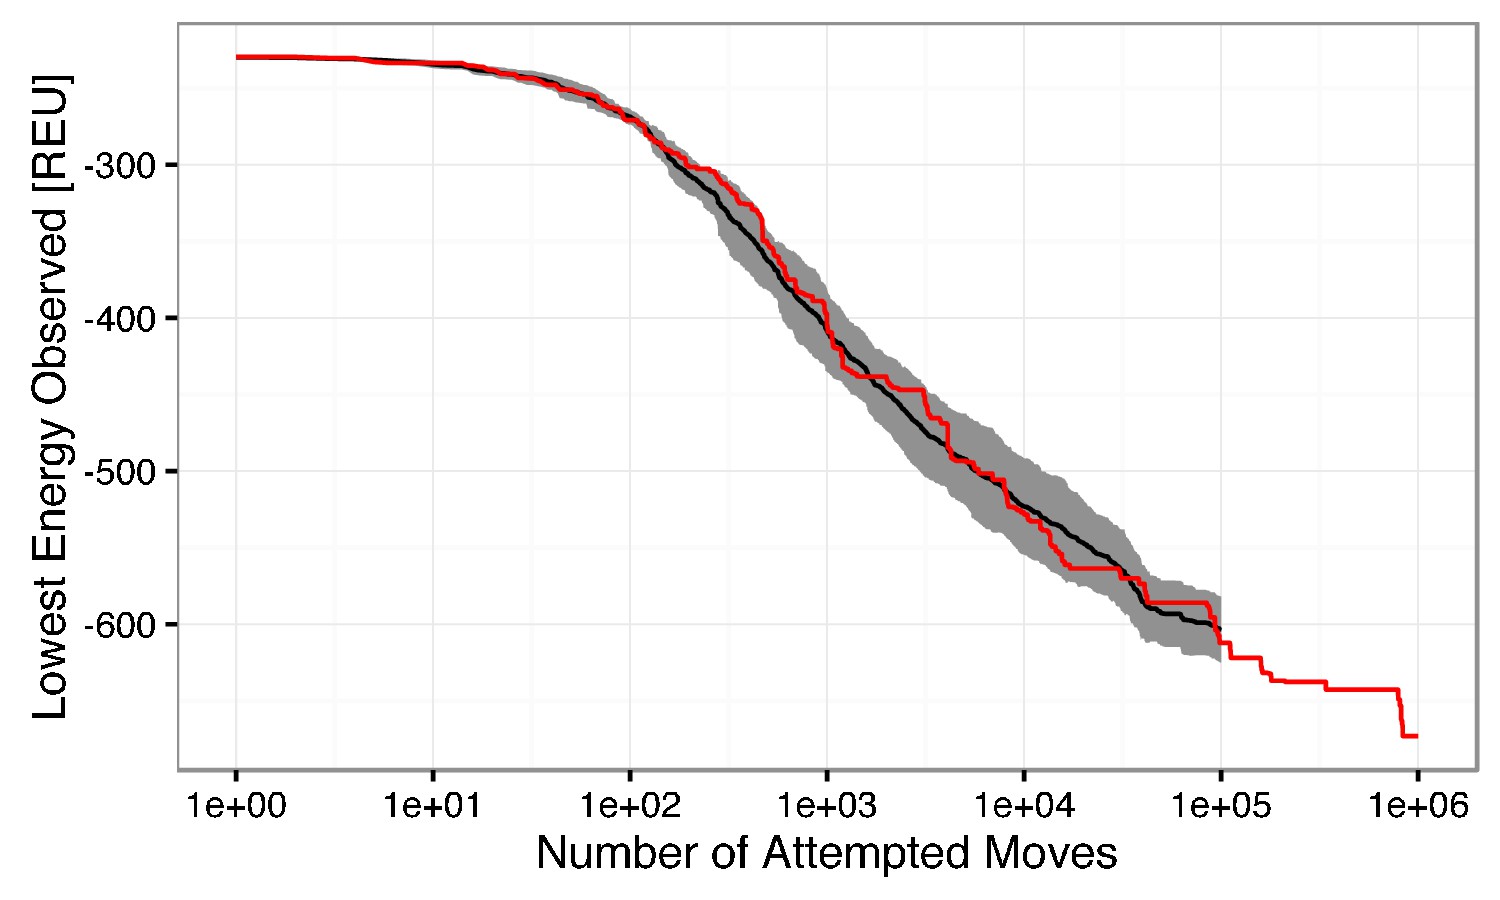
Semi-log plot of the lowest observed energy for a given number of attempted low-resolution backbone moves.
The mean lowest energy observed for ten simulations is shown in black, with ± one standard deviation filled in gray. A single simulation run with 1,000,000 attempted moves is shown in red. The change in energy between 100,000 and 1,000,000 steps is ~ 60 REU, which is marginal in comparison to the ~360 REU change in the first 100,000 attempted moves. The beneficial energy drop beyond 100,000 steps is outweighed by the computational cost. Thus, to generate one model, 100,000 low-resolution moves are attempted.
Figure 1—figure supplement 3
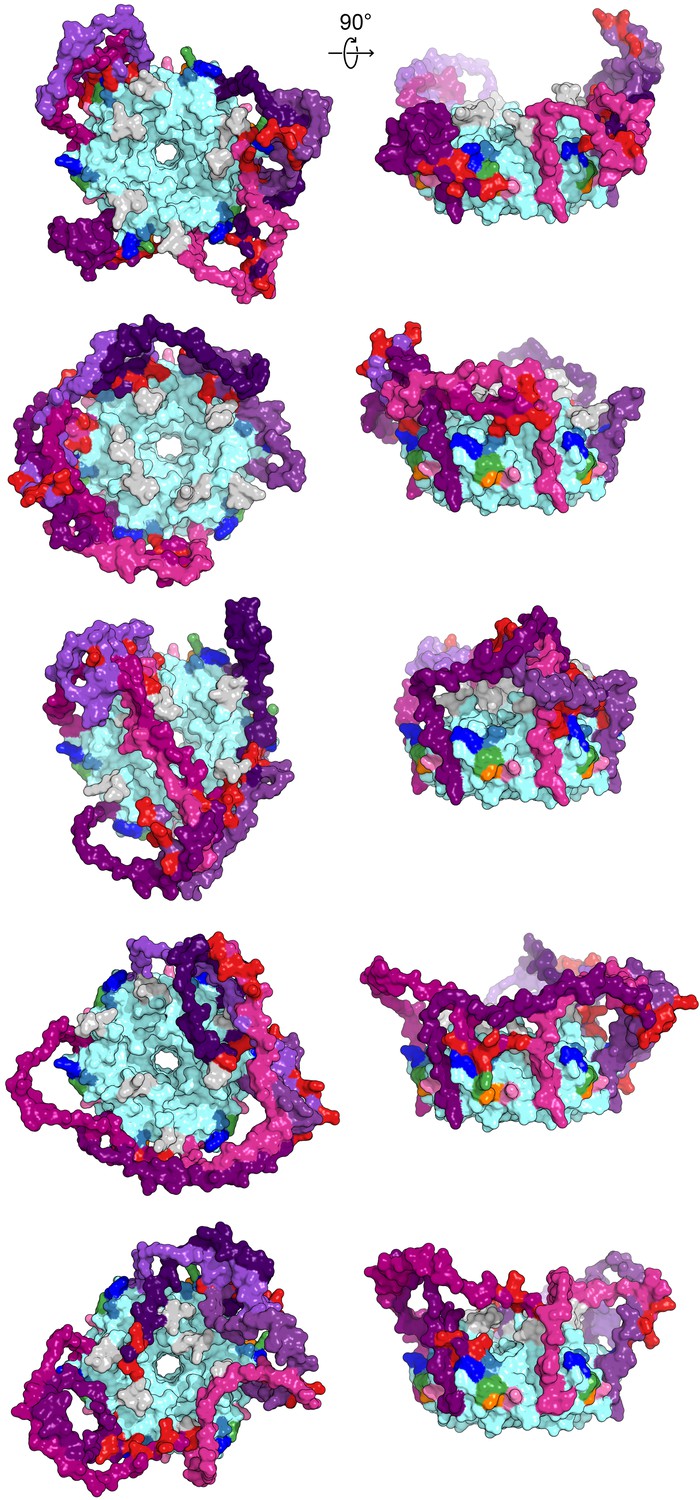
Modelled CTD-core interactions are heterogeneous.
A gallery of additional low-energy E. coli Hfq models from either a top-down view through the proximal pore (right) or side-on view of the rim (left), colored as in Figure 1.
Figure 2 with 3 supplements
CTD and RNA occupy the same rim binding site.
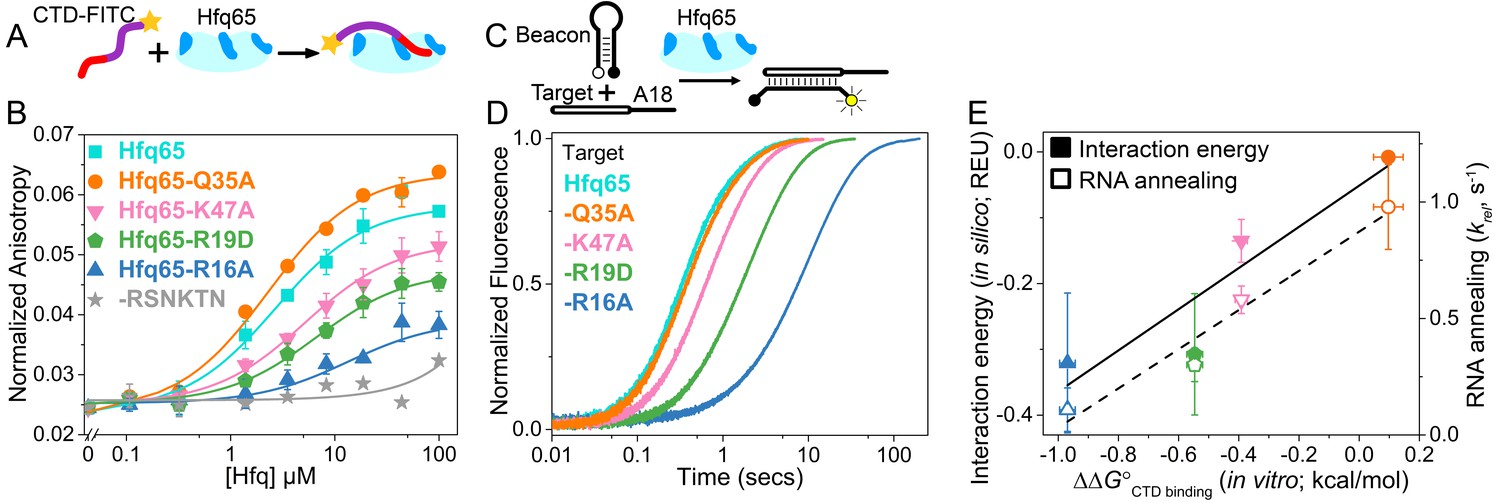
(A) Scheme for in vitro binding of fluorescent CTD-FITC peptide by Hfq core. The CTD linker is shown in purple, the acidic tip in red and the N-terminal FITC as a yellow star. Hfq core is shown in cyan, with basic rim patches in dark blue. (B) Binding of CTD-FITC to variants of Hfq65 core at 30 ˚C. 45 nM CTD-FITC was titrated with 0–100 µM Hfq monomer in duplicate, and the average (±s.d.) was fit to Equation 5 (Materials and methods). (C) Reaction scheme for annealing an RNA molecular beacon to a target RNA (open bar) (Hopkins et al., 2011; Panja et al., 2015). (D) Progress curves for annealing 50 nM molecular beacon and 100 nM Target by 50 nM Hfq65 hexamer at 30°C, measured by stopped-flow fluorescence. See Figure 2—figure supplement 2 for further data. (E) Contribution of core residues to CTD binding. Interaction energy (Expected Energetic Contribution; EEC) in silico for a core residue in the Rosetta models (solid symbols and solid line; adjusted R2 = 0.77) or the average annealing rates for Target and Target-A18 relative to Hfq65 (open symbols and dashed line; adjusted R2 = 0.94) versus experimental CTD binding energy (∆∆G°) for each Hfq65 variant. The binding energy, ∆∆G° = –RTln(KdMUT/Kd), reflects the perturbation to CTD binding by a mutation in Hfq65. The interaction energy in silico or EEC is defined as the average energy of a tail–core interaction multiplied by the average number of tail–core interactions per model (Figure 1B, top and Equation 3). The relative annealing rate for Hfq65 variants, krel = kobsMUT/kobsWT, is <1 if the mutated residue is important for RNA annealing.
Figure 2—figure supplement 1
SDS-PAGE of purified Hfq variants.
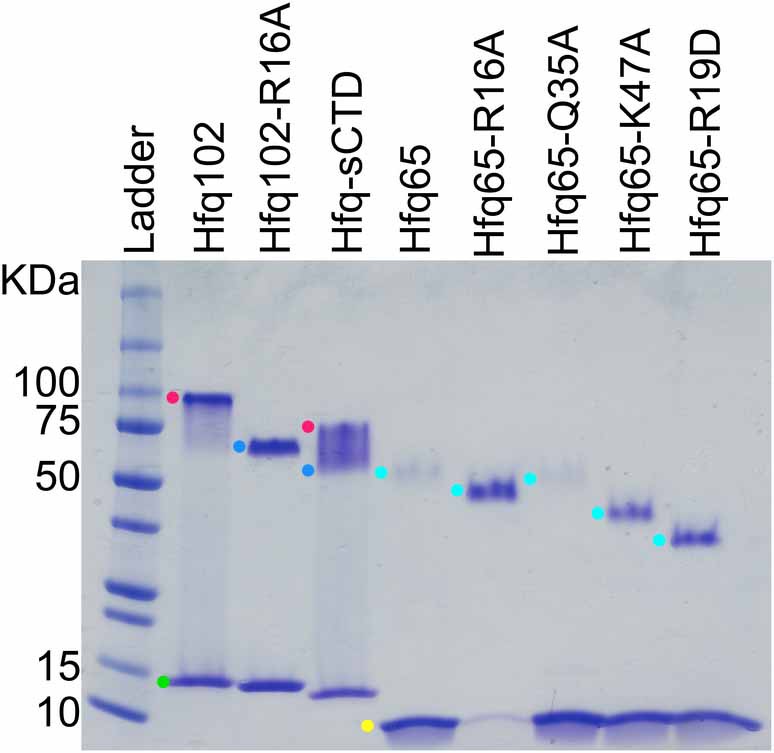
WT Hfq assembles into hexamers and dodecamers that are stable to SDS-PAGE, which can be used to evaluate the oligomerization of Hfq variants. Purified Hfq protein (~2.8 µg) was separated on a 4–20% SDS-PAGE gel and stained with Coomassie blue (lanes 2–6). Samples were prepared in 2% SDS and boiled before loading. Lane 1, Protein standards (10 µL All Blue Precision Plus, NEB). Colored dots mark oligomers: green, blue, red, Hfq102 monomer, hexamer, and dodecamer; yellow and cyan, Hfq65 monomer and hexamer. Under these conditions, Hfq102 migrates as a dodecamer (red dot) and monomer (green dot) with no visible hexamer band. Hfq102-R16A only forms hexamer (blue dot) and monomer, as previously reported (Wang et al., 2011). Hfq-sCTD forms a mixture of dodecamer, hexamer and monomer. Hfq65 and its variants form hexamers with slightly different stabilities that migrate according to the number of charged surface amino acids (Rath et al., 2009; Shi et al., 2012). All of the Hfq variants used in this study were capable of hexamerisation, and none formed oligomers larger than those seen with wildtype Hfq.
Figure 2—figure supplement 2
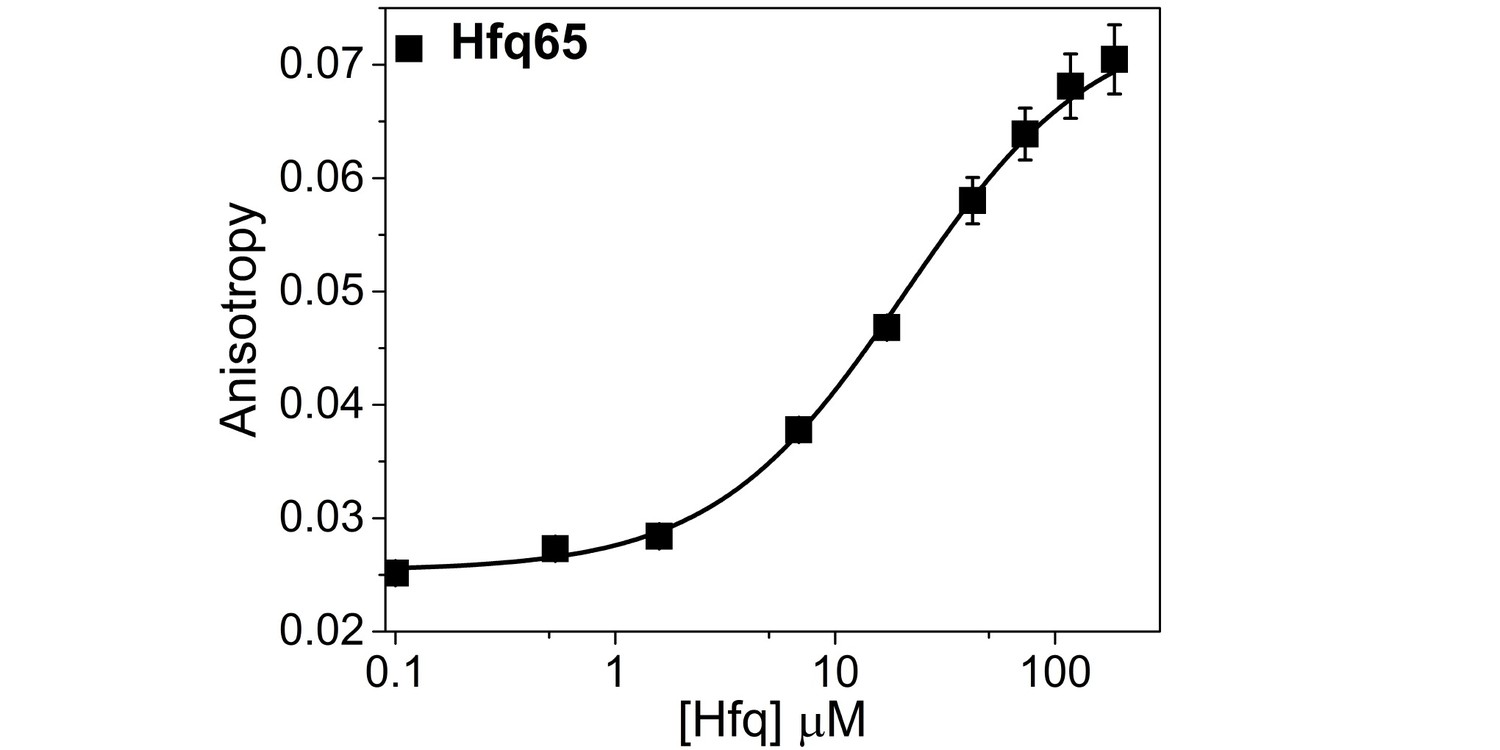
Hfq65 binding to CTD-FITC in a higher salt buffer.
Binding of CTD-FITC to Hfq65 at 30 ˚C, in 10 mM Tris·HCl pH 7.5, 50 mM K-Glutamate. 45 nM CTD-FITC was titrated with 0–190 µM Hfq monomer in duplicate, and the average (±SD) was fit to a binding isotherm (Equation 5; Materials and methods).
Figure 2—figure supplement 3
RNA annealing kinetics by Hfq65 and variants.
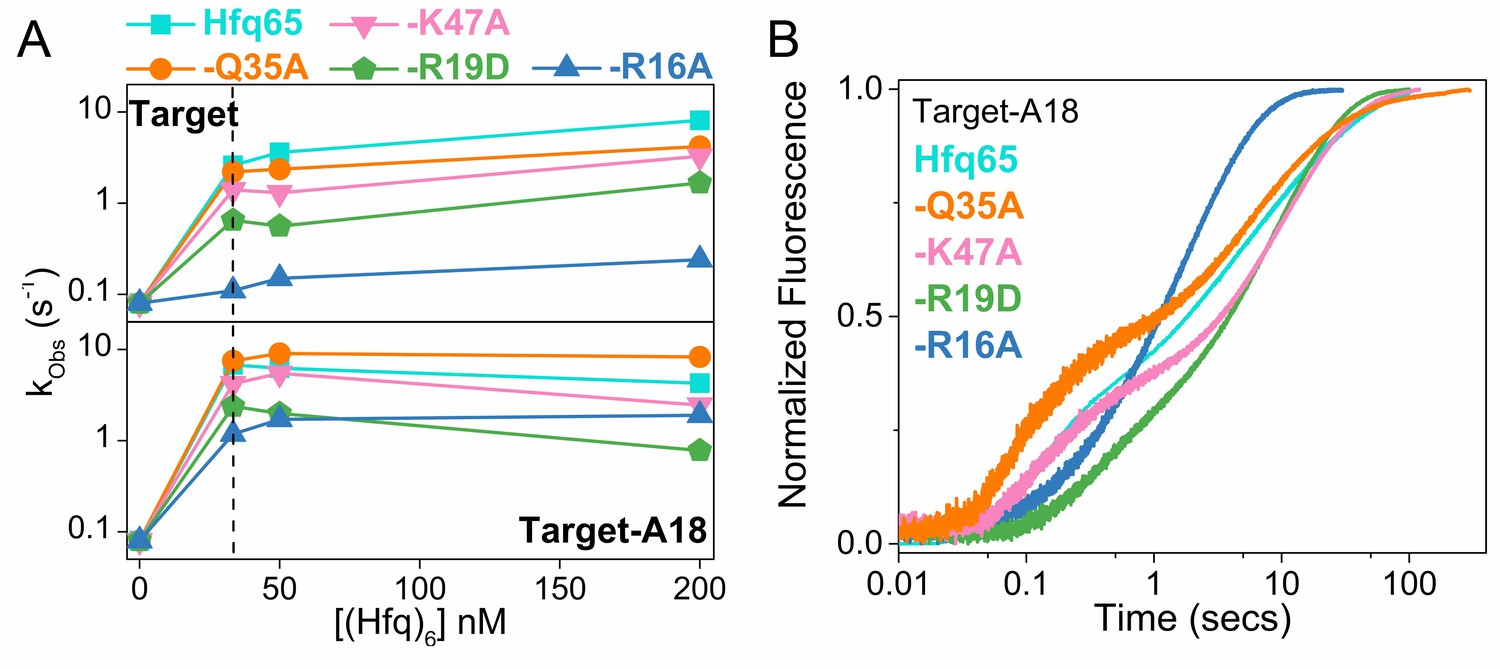
Annealing of 100 nM Target RNA to 50 nM beacon RNA by Hfq65 and Hfq65 variants was measured by stopped flow fluorescence at 30°C in 1 × TNK buffer. (A) Observed annealing constants with 0–200 nM Hfq hexamer. Cyan, Hfq65; orange, Hfq65-Q35A; pink, Hfq65-K47A; green, Hfq65-R19D; steel-blue, Hfq65-R16A. Rate constants are the average of 5 technical replicates with standard deviations less than 5%. The vertical dashed line indicates the Hfq concentration for which annealing progress curves are shown in Figure 2D and Figure 2—figure supplement 3B. The single turnover annealing rate reaches a maximum at equimolar concentrations of (Hfq)6:beacon. Higher Hfq concentrations can inhibit annealing due to random-order binding of RNA substrates and the formation of Hfq12, which is inactive (Sagawa et al., 2015). (B) Target-A18 (distal) annealed by 33 nM Hfq65 hexamer and variants on Hfq65 background. The change in fluorescence emission intensity was normalized to the maximum fluorescence within an experiment. The average of five measurements is shown per progress curve. All progress curves were fitted to single- or double-exponential rate equations to obtain kobs, as previously described (Santiago-Frangos et al., 2016).
Figure 3
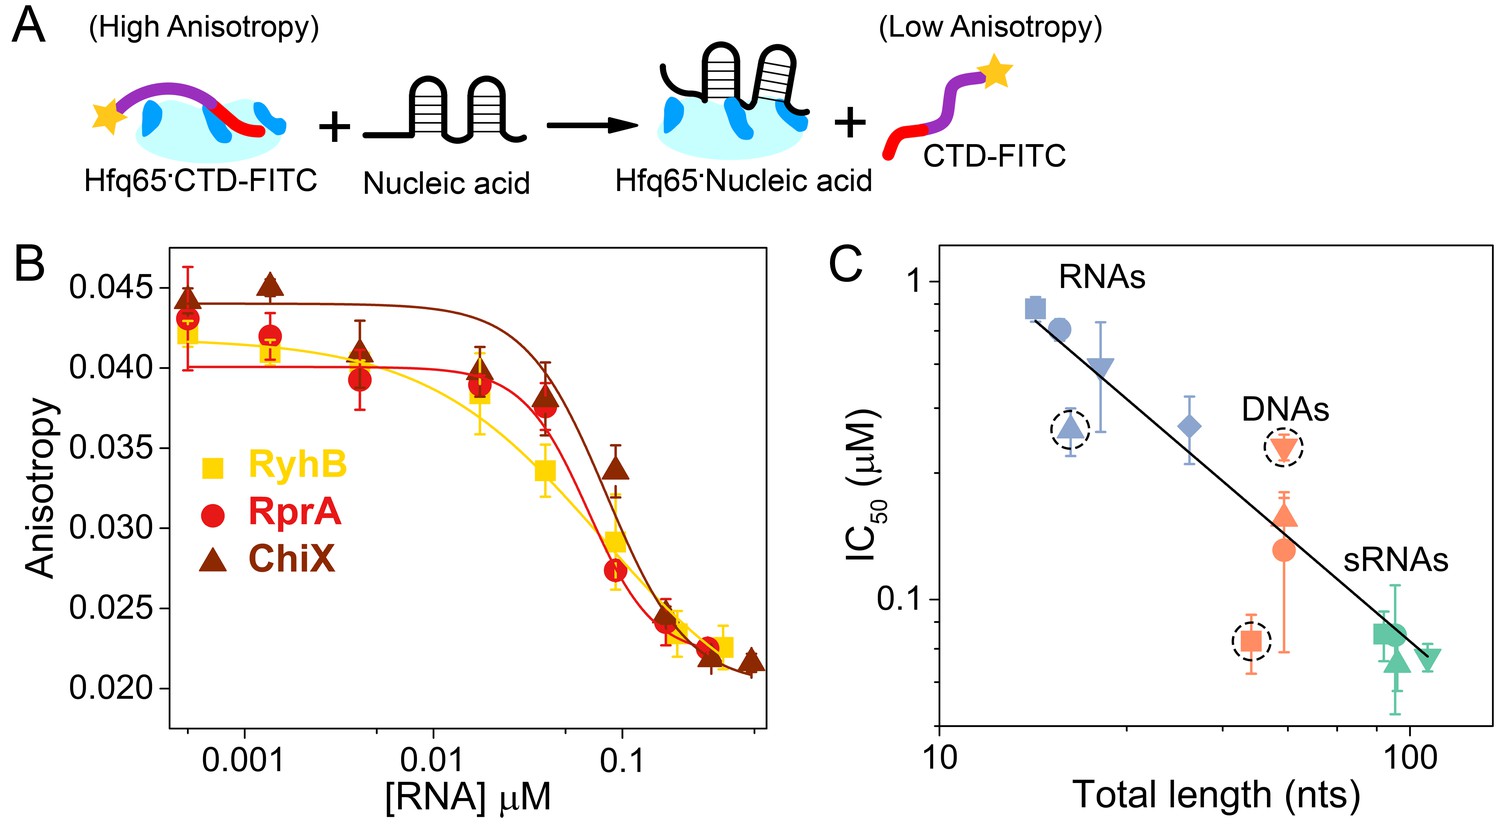
Nucleic acids displace the CTD from the Hfq core.
(A) Scheme for in vitro competition of the CTD-FITC·Hfq65 interaction by nucleic acids. (B) Example titrations of the CTD-FITC·Hfq65 complex with sRNA. Titrations were done in duplicate, and the averages (±s.d.) fit to Equation 6 (Materials and methods) to determine the IC50.(C) IC50 values for nucleic acids of different lengths (blue, RNA oligomers; orange, DNA oligomers; green, sRNAs). From shortest to longest: Target, A18, minRCRB, Target-U6, Target-A18, DNA1, DNA2, DNA2c, dsDNA2, ChiX, RyhB, DsrA, RprA). Dashed circles indicate nucleic acids that deviate from the linear relationship between log IC50 and length (adjusted R2 = 0.85).
Figure 4 with 2 supplements
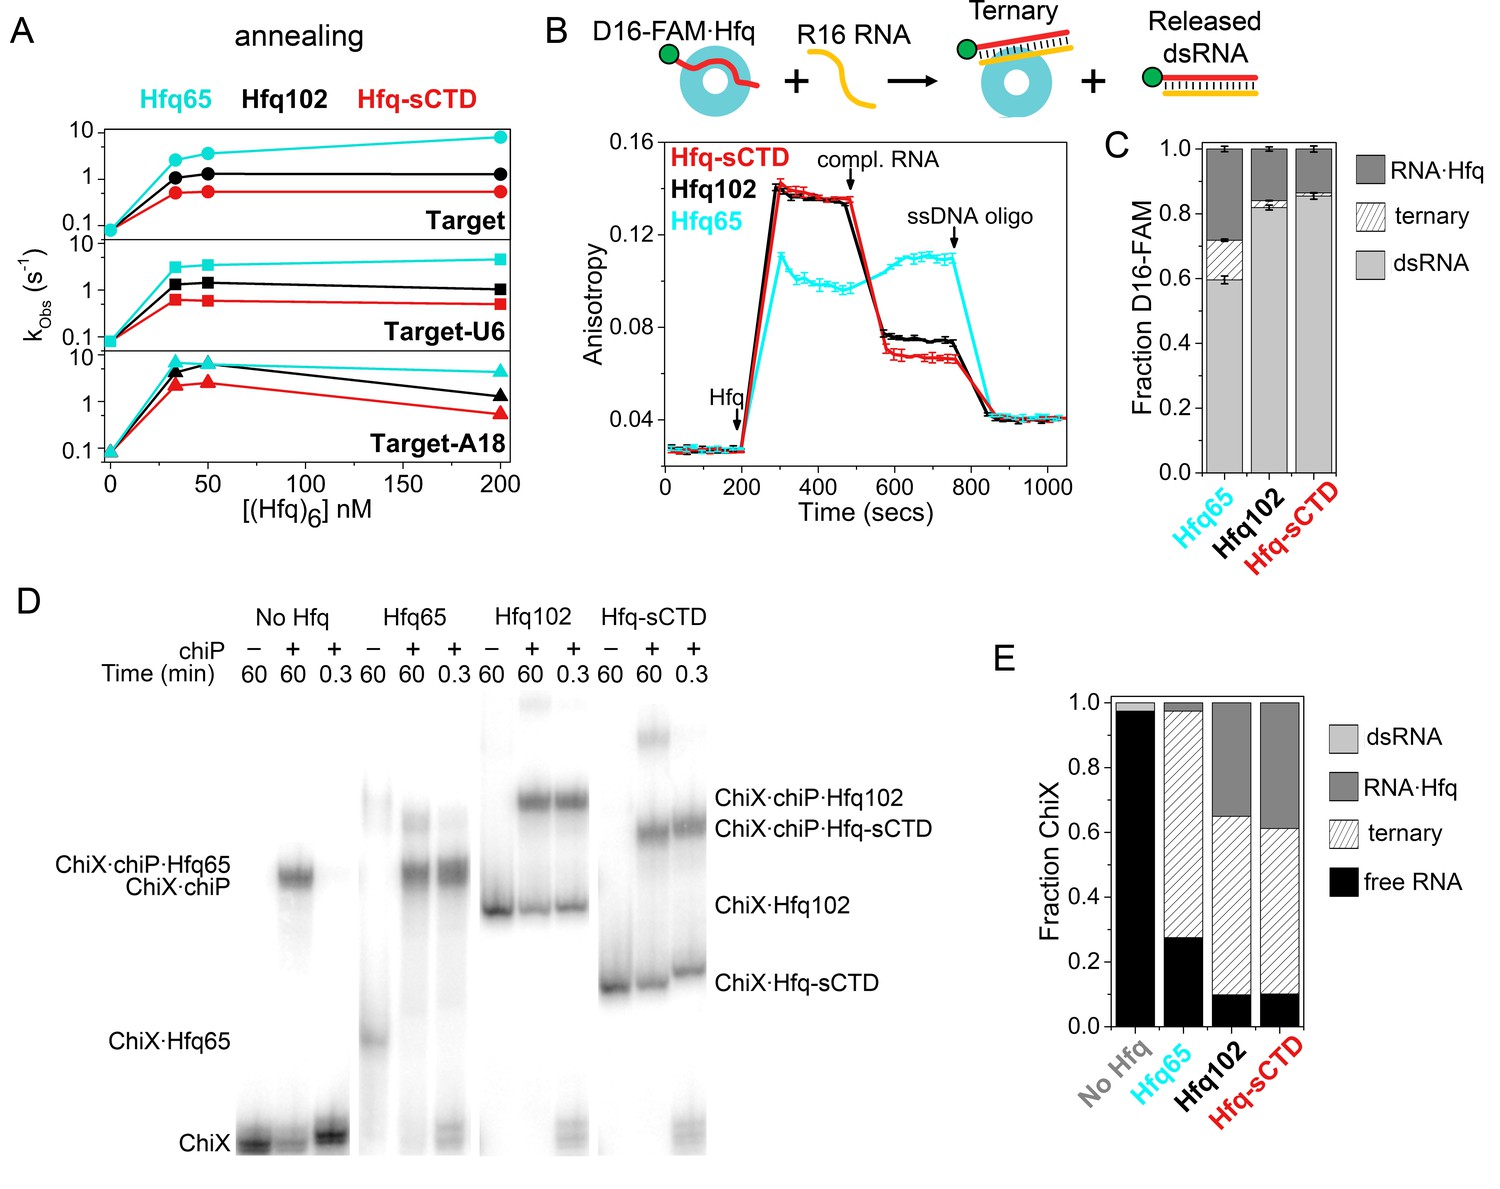
Shortening the CTD increases auto-inhibition by acidic residues.
(A) Observed annealing rate constants for 100 nM target RNA and 50 nM molecular beacon with 0–200 nM Hfq hexamer at 30°C, measured by stopped-flow fluorescence. Black, Hfq102; red, Hfq-sCTD; cyan, Hfq65. (B) Fluorescence anisotropy assay for RNA binding and release. In stopped-flow FRET experiments, the dsRNA is released after pairing with its complementary strand (Panja et al., 2013; Santiago-Frangos et al., 2016). D16-FAM RNA (50 nM) was allowed to bind 50 nM Hfq hexamer. The Hfq·D16-FAM complex was challenged with 50 nM complementary R16 RNA. Most of the D16-FAM·R16 product is released from Hfq102 and Hfq102-sCTD, but not Hfq65. Remaining RNA was displaced from Hfq by excess ssDNA (400 nM DNA2). The averages and standard deviations for three trials are plotted for each Hfq variant. (C) Molar fractions of D16-FAM·R16 product released (light grey), remaining D16-FAM·Hfq·R16 ternary complex (hatched), and Hfq·D16-FAM binary complex (dark grey) calculated from Equation 7 (Materials and methods), based on the anisotropies at the end of the annealing phase and the maximum anisotropies of ternary complexes from equilibrium binding experiments (Table 3). (D) Annealing of 5 nM 32P-ChiX sRNA with 30 nM chiP mRNA without Hfq, or with Hfq65, Hfq102 or Hfq-sCTD, as indicated above each lane. Samples were loaded on a native polyacrylamide gel 60 min or 20 s after the components were mixed. Full gel images are in Figure 4—figure supplement 2. (E) Fractions of free ChiX (black), ChiX·chiP dsRNA (light grey), ChiX·Hfq·chiP ternary complex (hatched) and ChiX·Hfq binary complex (dark grey) after 4 min of annealing, as analyzed by EMSA (Figure 4—figure supplement 2).
Figure 4—figure supplement 1

Effect of CTD length on RNA oligomer annealing kinetics.
Annealing of 100 nM Target RNA to 50 nM beacon RNA by Hfq variants was measured by stopped flow fluorescence at 30°C in 1 × TNK buffer. (A) Target RNA annealed by Hfq65 (no CTD), Hfq102 (complete CTD) or Hfq-sCTD (shortened linker CTD). (B) Target-U6 (proximal) annealed by Hfq65, Hfq102 or Hfq-sCTD. (C) Target-A18 annealed Hfq65, Hfq102 or Hfq-sCTD. The change in fluorescence emission intensity was normalized to the maximum fluorescence within an experiment. The average of five measurements is shown per progress curve. Annealing data were also collected for 0–200 nM Hfq hexamer. All progress curves were fitted to single- or double-exponential rate equations to obtain kobs, as previously described (Santiago-Frangos et al., 2016).
Figure 4—figure supplement 2
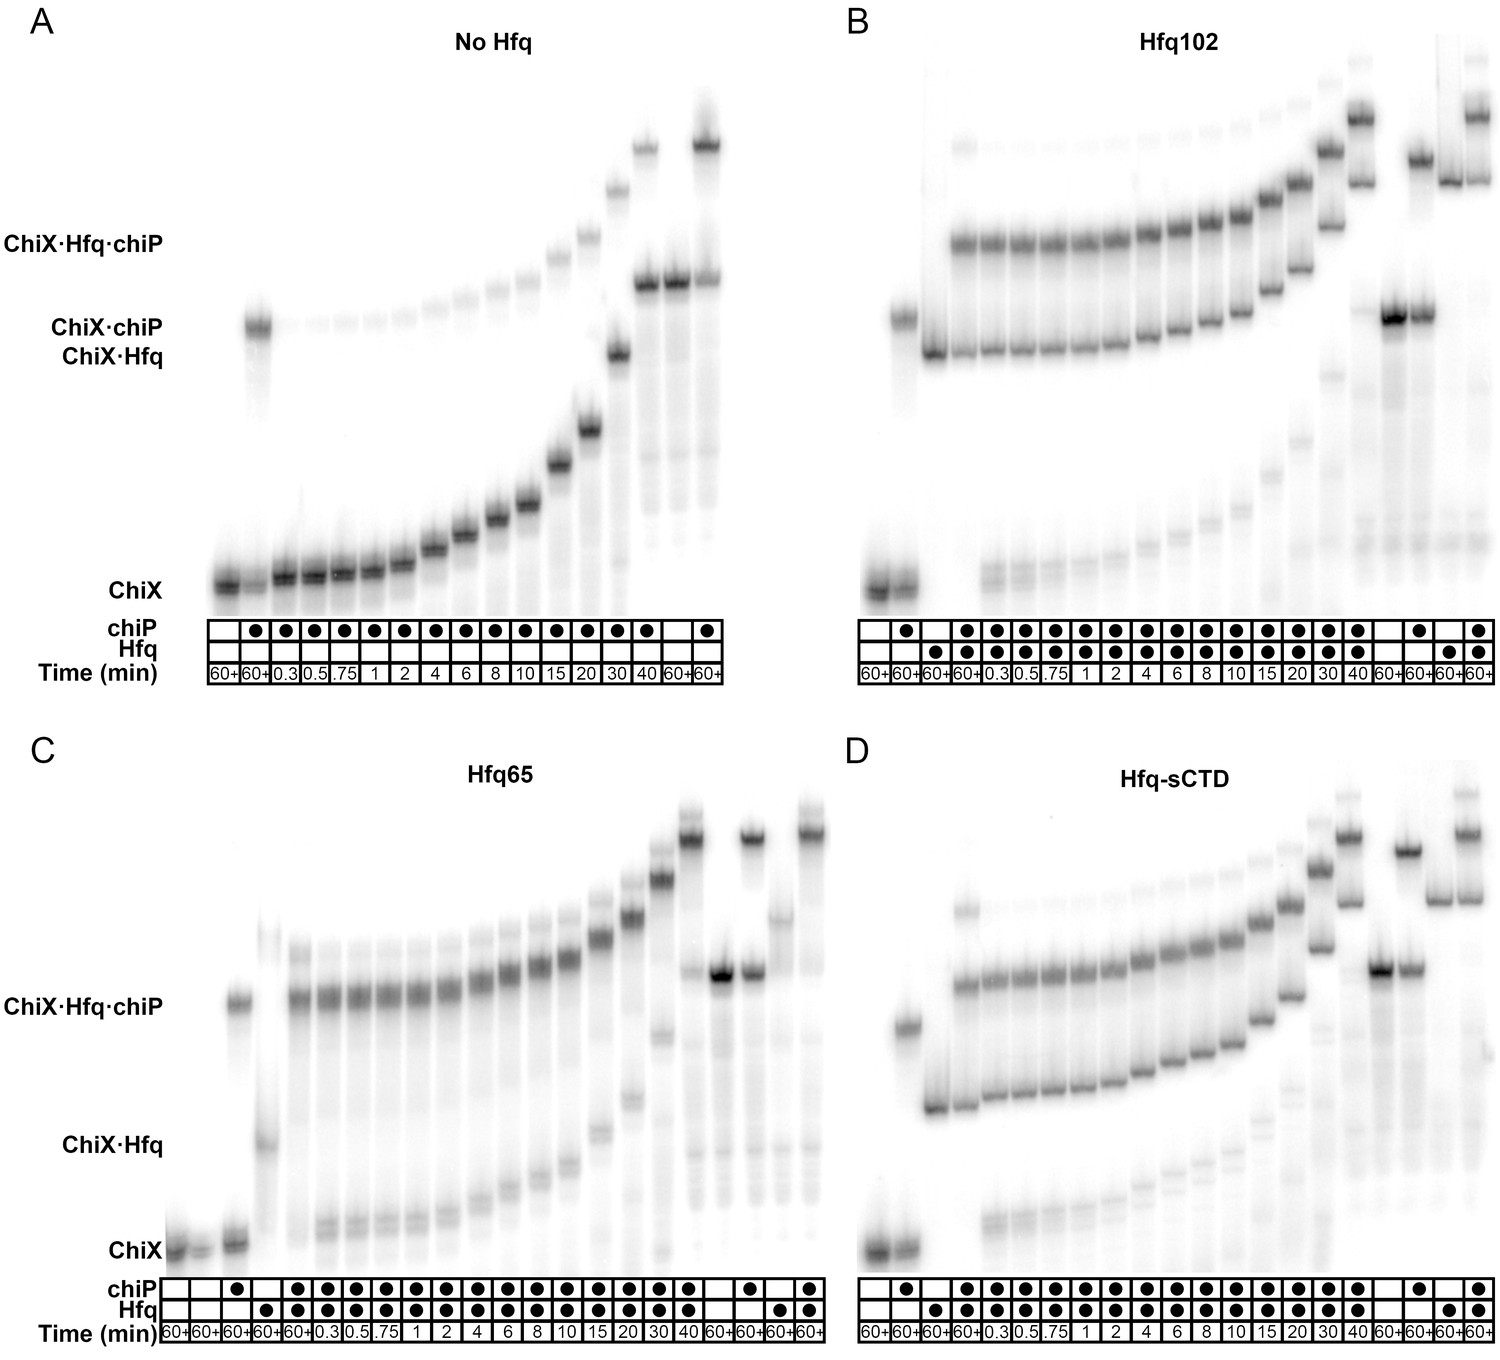
Effect of CTD length on sRNA·mRNA annealing.
EMSAs of the annealing of 5 nM 32P-ChiX to 30 nM chiP (Rasmussen et al., 2009) at 10°C in 1 × TNK buffer. Reactions were done (A) without Hfq, or with 33.3 nM hexamer (B) Hfq102, (C) Hfq65 or (D) Hfq-sCTD, Control reactions with ChiX only, ChiX and chiP mRNA, ChiX and Hfq or three components were loaded at the beginning (left) and end (right) of each time course, as indicated above the lanes. In the absence of Hfq, only 20% of ChiX·chiP annealed after 30 min. In the presence of all Hfq variants, at least 50% ChiX was in a ternary complex containing ChiX·Hfq·chiP within 1 min, and annealing reached a plateau within 2 min. In corroboration with the RNA oligomer annealing data (Figure 4C), the ternary complex was most stable with Hfq65, medium with Hfq102 and least stable with Hfq-sCTD.
Figure 5 with 2 supplements
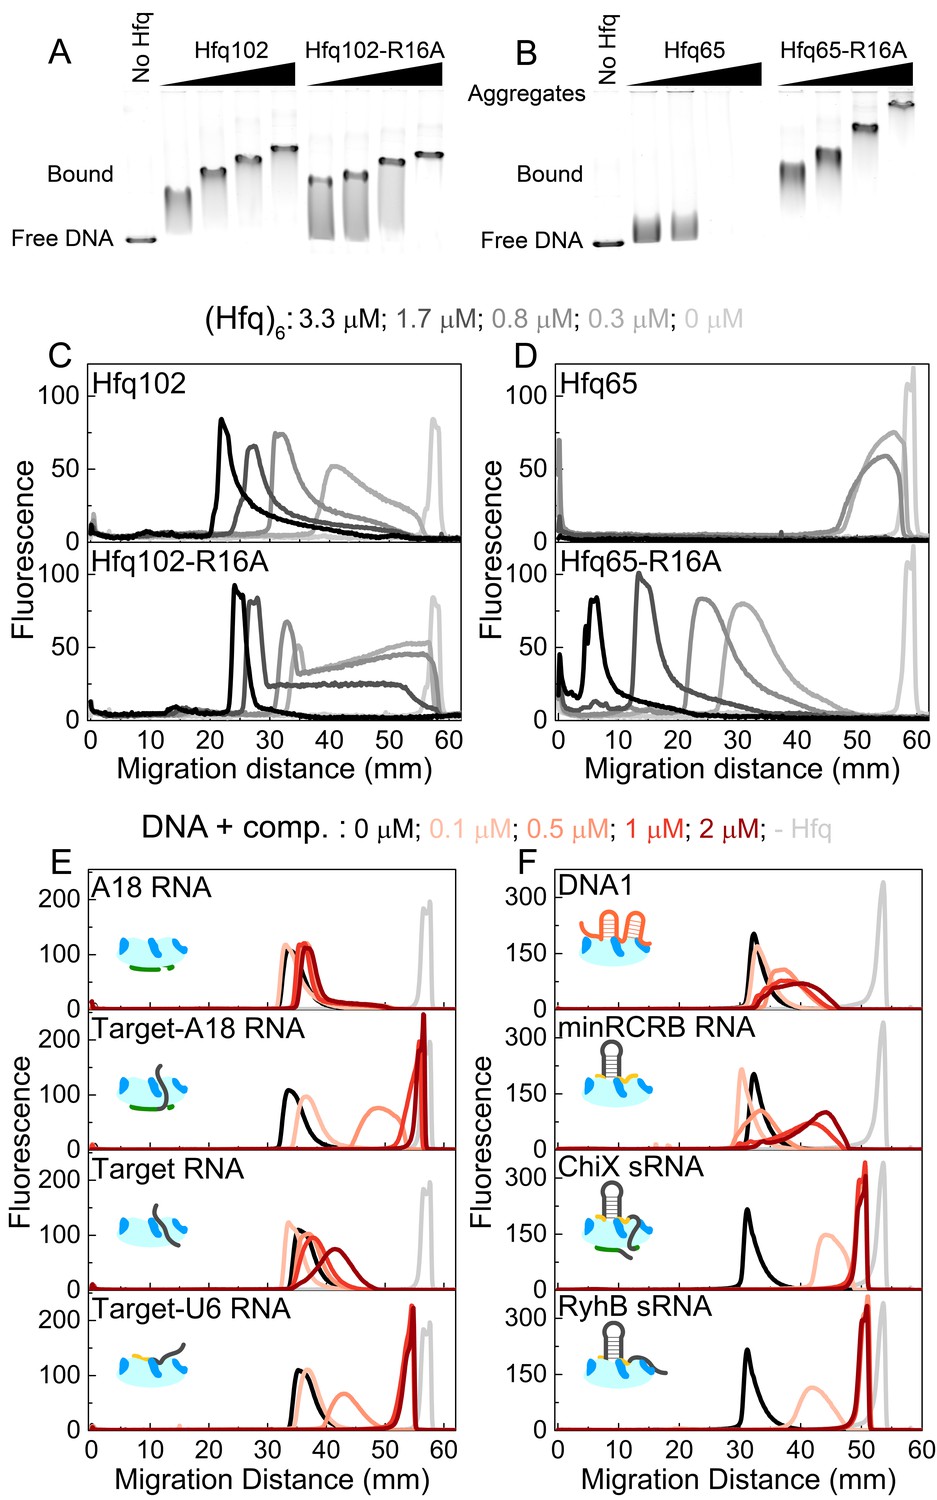
CTD and RNAs inhibit DNA binding to Hfq by obstructing the basic rim patch.
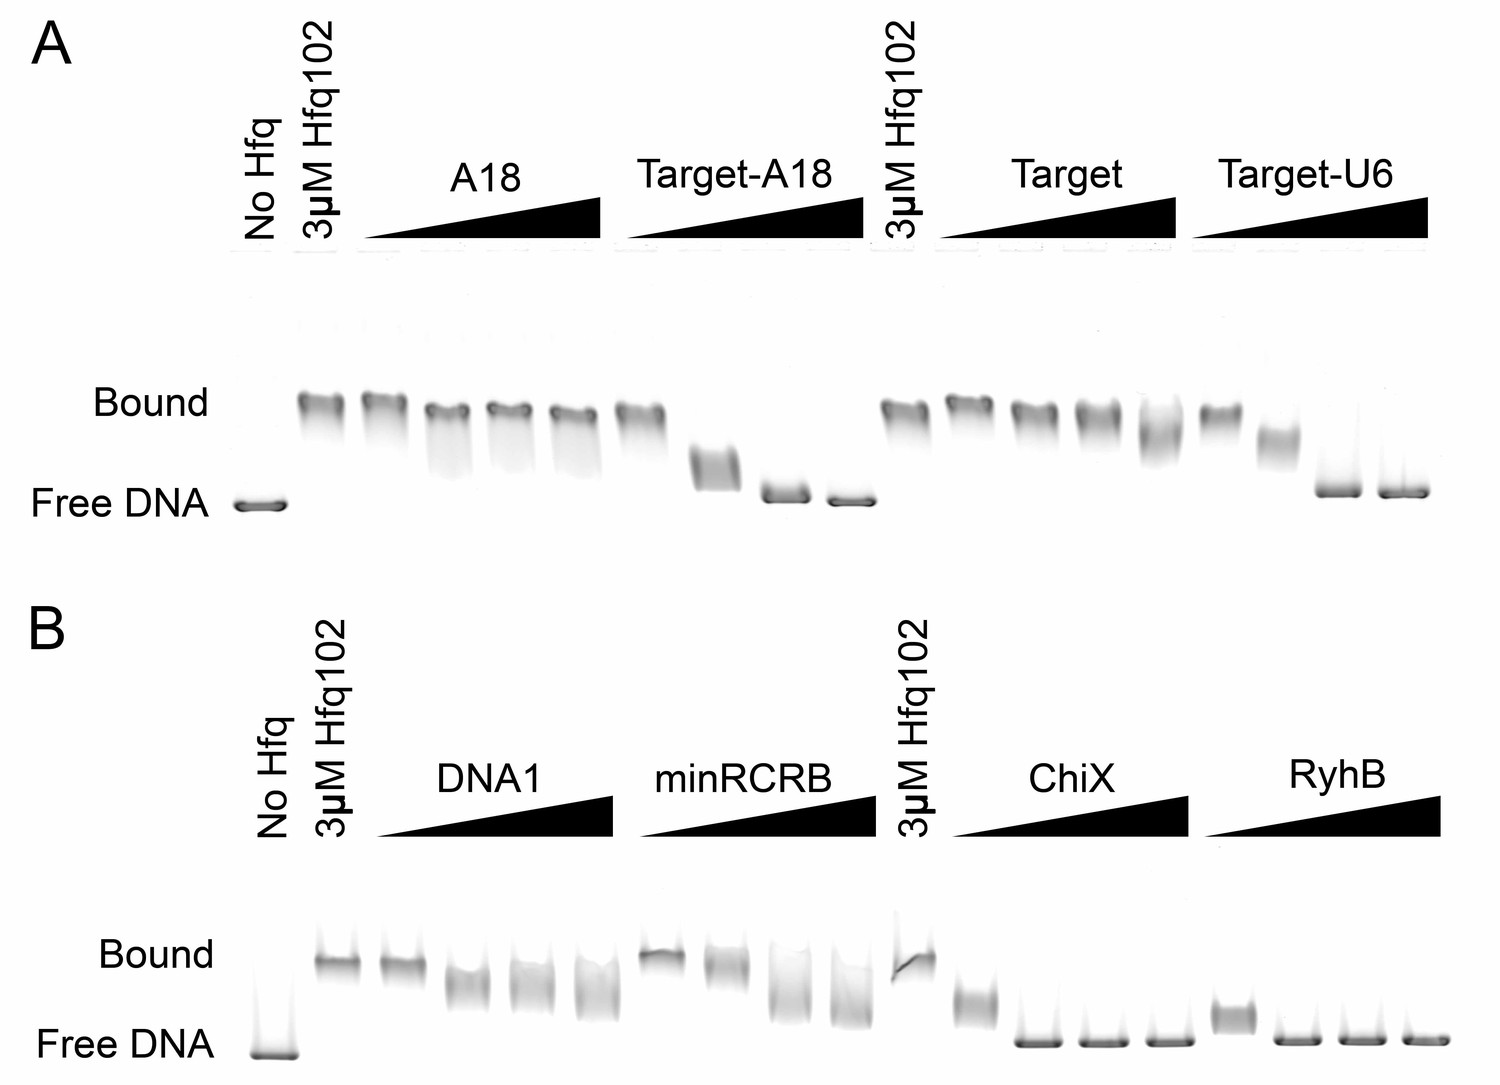
(A, B) Agarose gel electrophoretic mobility shift assays of 0–3.3 μM hexamer Hfq102, Hfq102-R16A, Hfq65 or Hfq65-R16A binding to 6 nM linear pUC19 DNA (2635 nts) at 25°C, stained with SYBR Gold. Hfq65 forms large aggregates that fail to enter the gel (Figure 5—figure supplement 1). (C, D) Line densitometry of DNA migration in (A, B). Free pUC19 (no Hfq) is shown in light grey. Samples with increasing Hfq concentration are shown in darker shades of grey. (E, F) RNA competition. Complexes of 0.5 μM Hfq102 hexamer and 6 nM linear pUC19 (black) were challenged by 0–2 μM RNA or DNA competitor (darker shades of red). pUC19 control in the absence of Hfq is shown in light grey. Icons indicate the binding surface for each competitor. See Figure 5—figure supplement 2 for gel images.
Figure 5—figure supplement 1
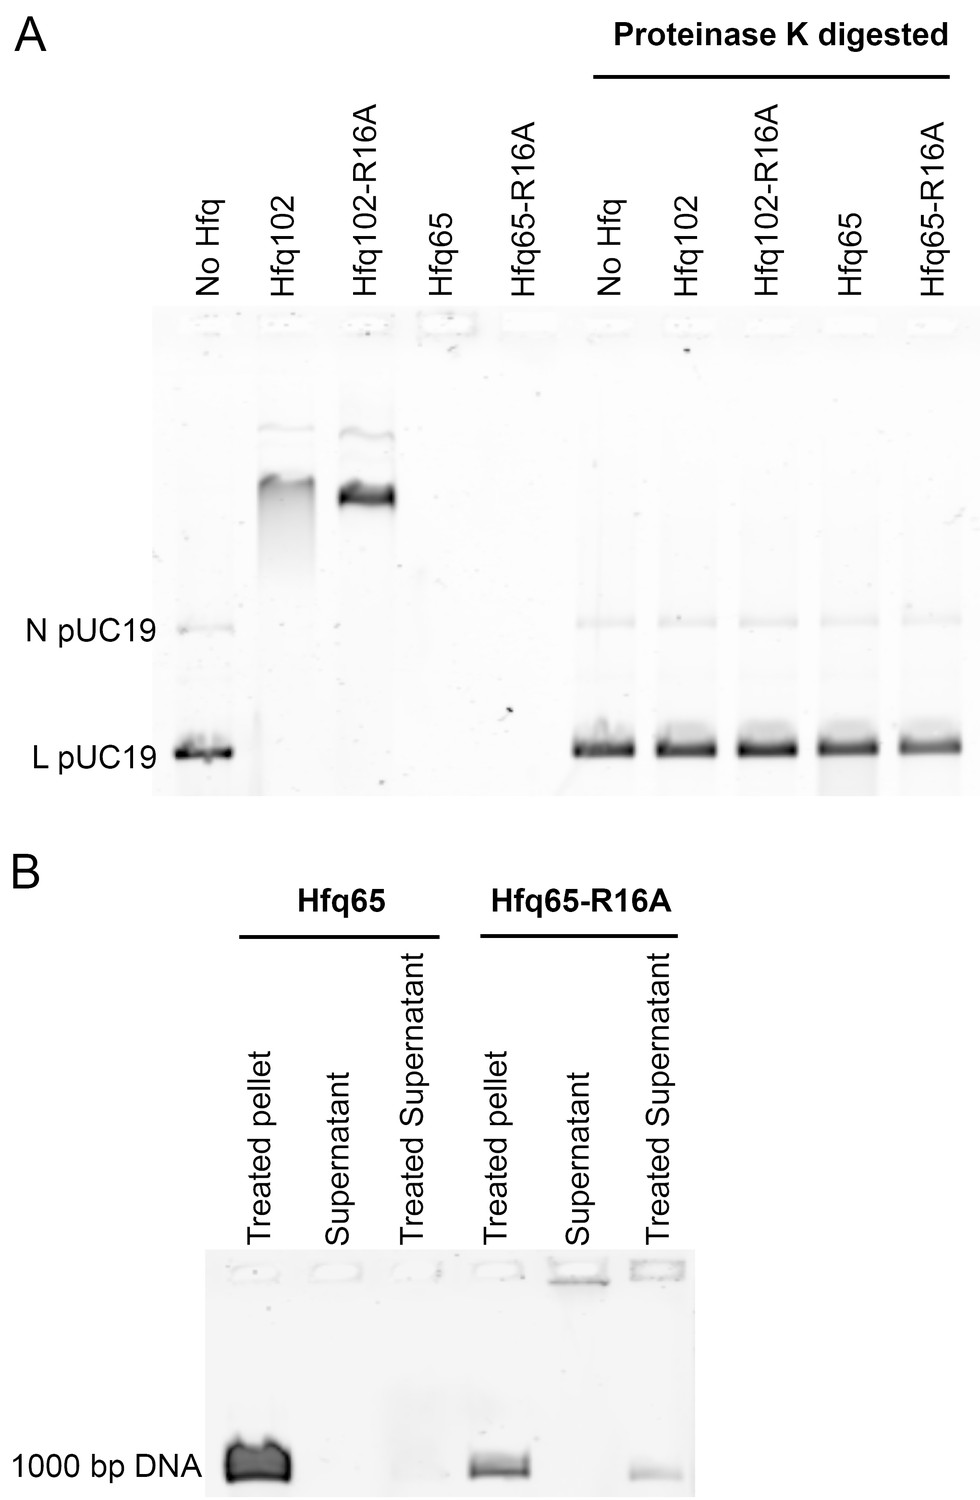
Hfq CTD prevents aggregation with DNA.
(A) Protease assay. 3.5 µM Hfq hexamer incubated with 6 nM linear (L) plus relaxed circular (N) pUC19 DNA at 25°C, for 30 min, in 50 mM Tris-HCl pH 7.5 and 10 mM CaCl2. The samples were divided in two. One set was diluted with a small amount of buffer and incubated at 25°C for an additional 2 hr. The second set was brought to 0.5% SDS, and 0.4 U Proteinase K (NEB) was added, followed by incubation at 50°C for an additional 2 hr. Loading dye was added to all samples just before they were loaded onto a native gel. Under the extended incubation time, both Hfq65 and Hfq65-R16A form insoluble aggregates with DNA which do not enter the gel (lanes 4 and 5). Digestion of Hfq65 and Hfq65-R16A with Proteinase K liberates DNA from Hfq•DNA aggregates, allowing it to be detected (lanes 9 and 10). (B) Pelleting assay. 3.5 µM Hfq hexamer was incubated with 15 nM 1000 bp DNA (Thermo Scientific) at 25°C for 30 min in 50 mM Tris-HCl pH 7.5. Hfq·DNA aggregates were pelleted by centrifugation at 20,000 × g, 4°C, for 30 min. Supernatants were removed and split in two. The pellet and half the supernatant were brought to 1 M NaCl, and the Hfq·DNA aggregates were further disrupted by phenol-chloroform extraction, before all of the samples were loaded on an agarose gel. Nearly all of the Hfq65·DNA complexes were found in the pellet fraction. The small proportion of Hfq65·DNA complexes remaining in the supernatant were only detected in the gel after treatment with salt. Hfq65-R16A·DNA complexes were more evenly distributed between pellet and supernatant fractions, and some untreated Hfq65-R16A·DNA complexes in the supernatant were able to enter the gel.
Figure 5—figure supplement 2
Competition of Hfq-DNA interactions by small RNAs.
EMSAs of 0.5 μM Hfq102 hexamer binding to 6 nM linearized pUC19 plasmid, that were competed with 0.1–2 μM RNAs or DNA at 30°C. Gels were run in a cold room. Signal intensity on a line drawn through the center of each lane was plotted (Figure 5). (A) Competition of Hfq102·pUC19 complexes with A18, Target-A18, Target and Target-U6 RNAs. (B) Competition of Hfq102·pUC19 complexes with DNA oligomer DNA1, RNA oligomer minRCRB, and sRNAs ChiX and RyhB.
Figure 6 with 3 supplements
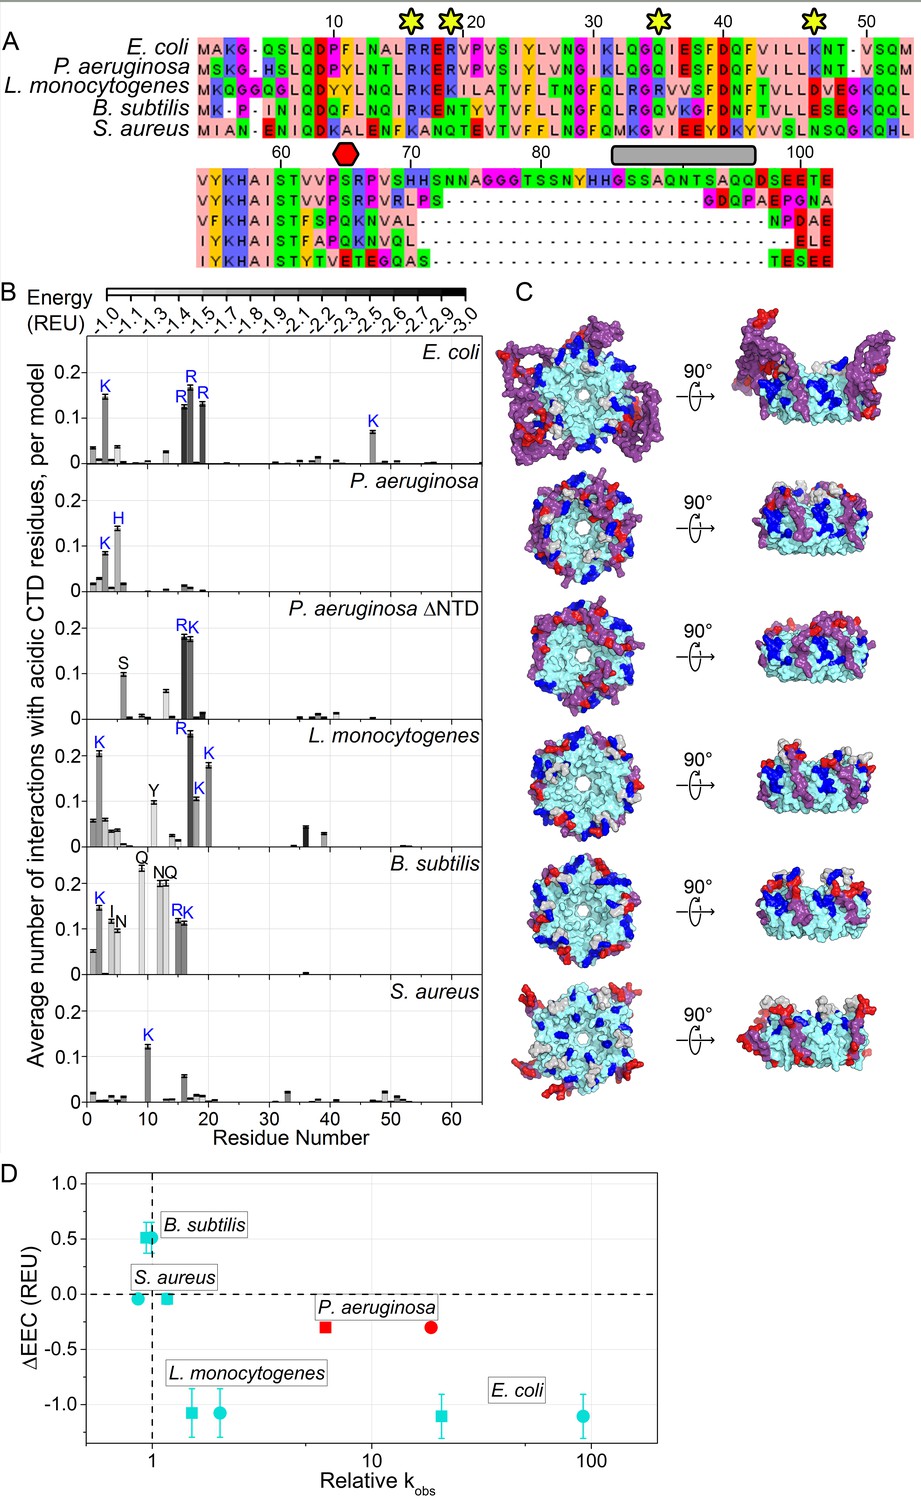
Acidic CTD and basic patch correlate with the chaperone activity of bacterial Hfq’s.
(A) Alignment of modeled Hfq sequences in order of decreasing in vitro RNA annealing activity. Residues are numbered according to the E. coli sequence. Yellow stars, residues mutated in this study; red hexagon, last residue in Hfq65; grey box, linker removed in Hfq-sCTD. (B) Average number of favorable interactions per model for each core residue with at least one acidic CTD residue (Equation 1) in the lowest energy models (≤1%). As in Figure 1B. Number of residues with < 2.0 A2 accessible surface area: P. aeruginosa, 10; L. monocytogenes, 25; B. subtilis, 19; S. aureus, 12. (C) Top-down (proximal face) and side (rim) views of example low-energy models for each Hfq, as in Figure 1C. (D) Relative RNA beacon annealing rate for Target-U6 (boxes) and Target-A18 (circles) in Hfq vs. no Hfq (relative kobs) versus the specificity of predicted CTD–core interactions (∆EEC) for B. subtilis, S. aureus, L. monocytogenes and E. coli Hfq (blue), and P. aeruginosa Hfq, which is more active in vitro than predicted by its ΔEEC (red). Annealing data are from Dimastrogiovanni et al., 2014.
Figure 6—figure supplement 1
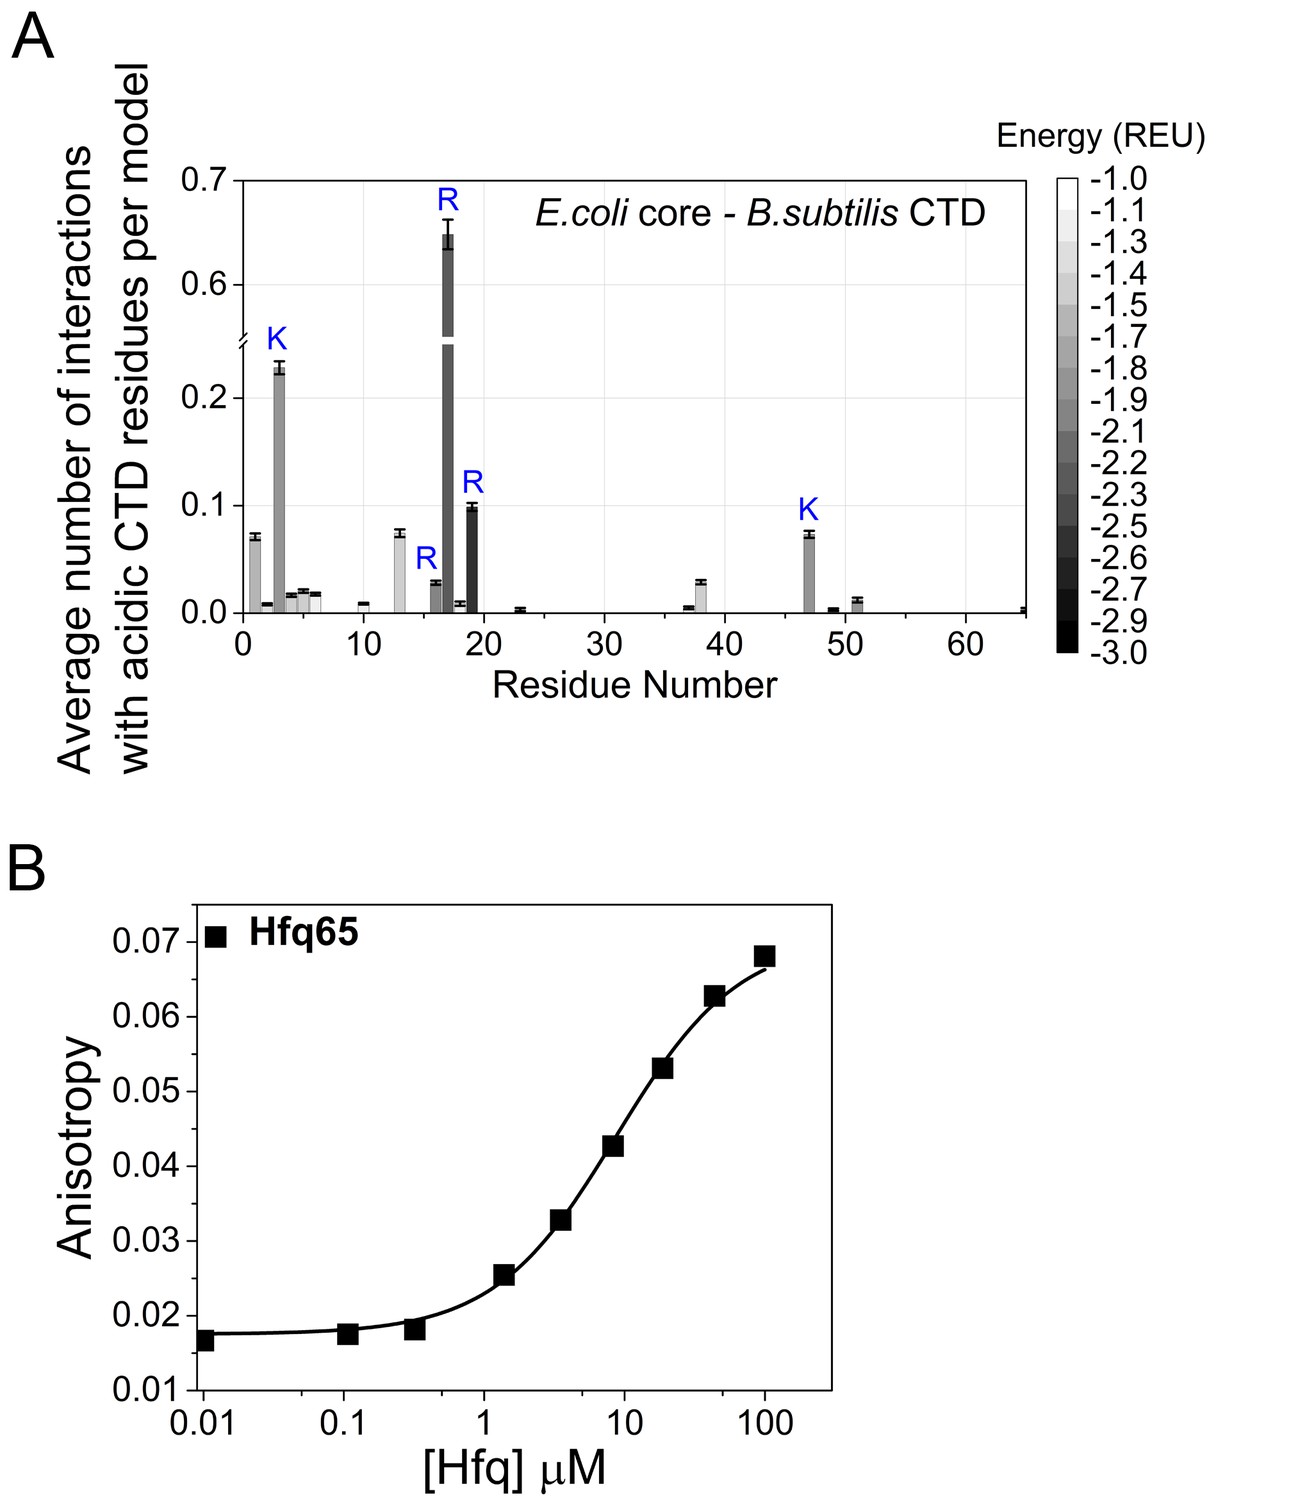
CTD-core interactions in a chimeric Hfq.
A chimera of E. coli Hfq core (residues 1–65 E. coli numbering) and the B. subtilis CTD (residues 66–102 E. coli numbering; Figure 6A) was modeled with Rosetta FloppyTail as in Figure 1. (A) Average number of energetically favorable interactions (E < −1.0 Rosetta Energy Units) with at least one acidic CTD residue, per low energy model as in Figure 1. Error bars (±1 SD) computed by bootstrap resampling. 14 of the core residues not predicted to interact with the CTD were solvent inaccessible. (B) Binding of BsCTD-FITC peptide to E. coli Hfq65 core at 30 ˚C. 45 nM BsCTD-FITC was titrated with 0–100 µM Hfq monomer in duplicate, and the average (±SD) was fit to Equation 5 (Materials and methods) with Kd = 8.7 µM. Although the binding strength is three time weaker than for the E. coli CTD peptide, the rank order for interactions with basic core residues no longer coincides with their relative importance for RNA annealing in vitro (Figure 2E). Therefore, the B. subtilis CTD may not be optimal for auto-regulating the core of E. coli Hfq.
Figure 6—figure supplement 2
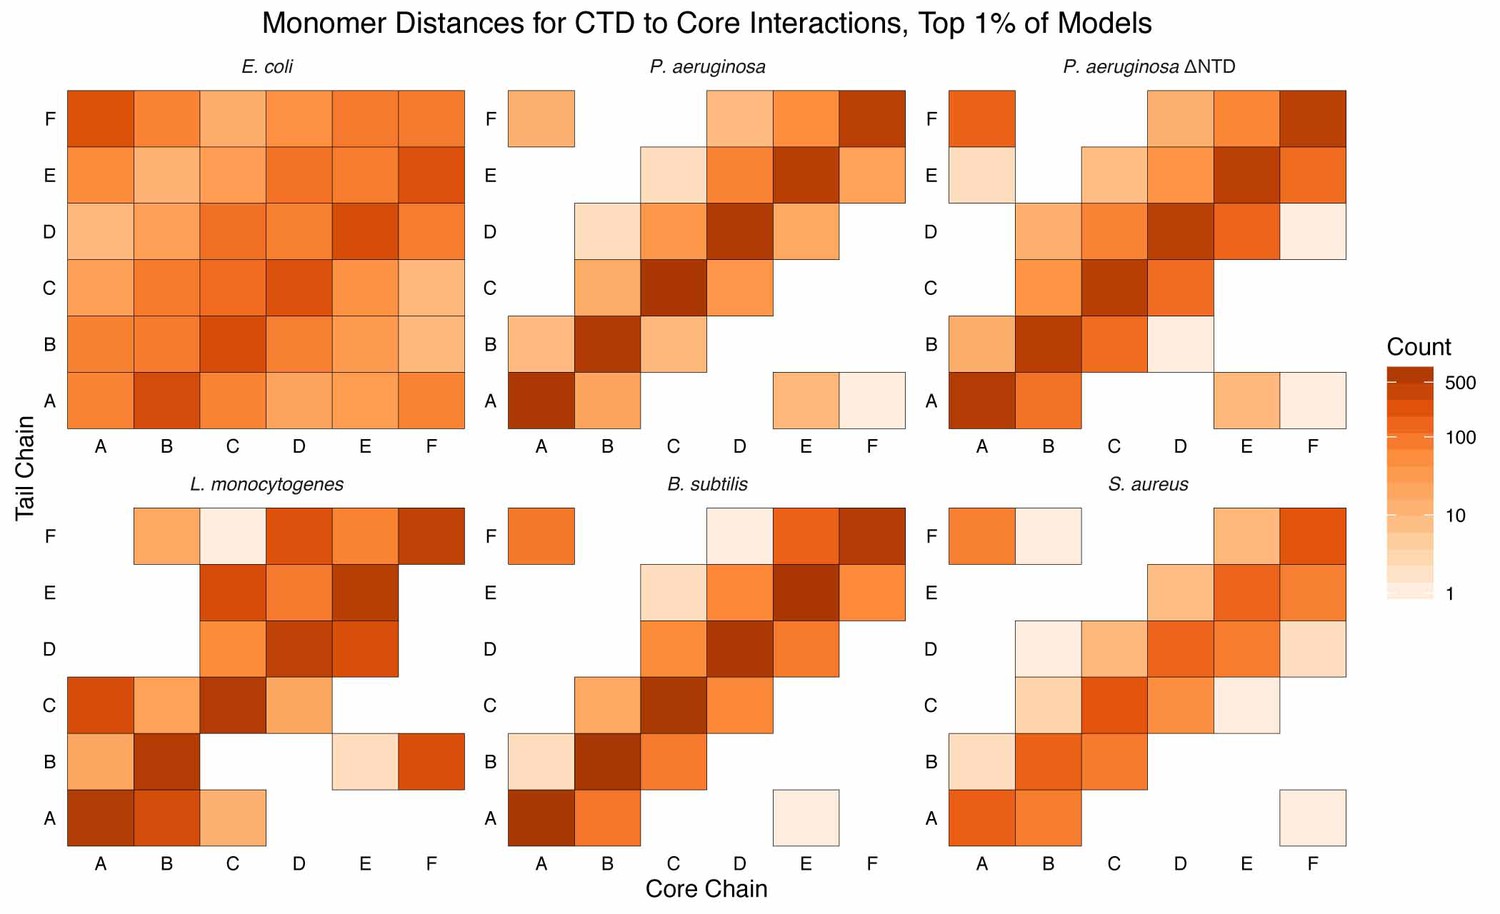
Monomer distances of CTD–core interaction.
Monomer-resolution, log-scale, heat maps of interactions between the CTDs and core residues, in the first percentile of models, sorted by energy, for all species of Hfq. The monomer identities (A, B, C, D, E, and F; corresponding to the chain identities in the input PDB) are specified for the CTD (tail) along the y-axis and the core along the x-axis. Counts are added to each bin if an interaction between a CTD residue and core residue, belonging to the respective monomer, is observed. Longer CTDs (e.g. E. coli) can interact with all monomers, but are not required to do so (e.g. L. monocytogenes).
Figure 6—figure supplement 3
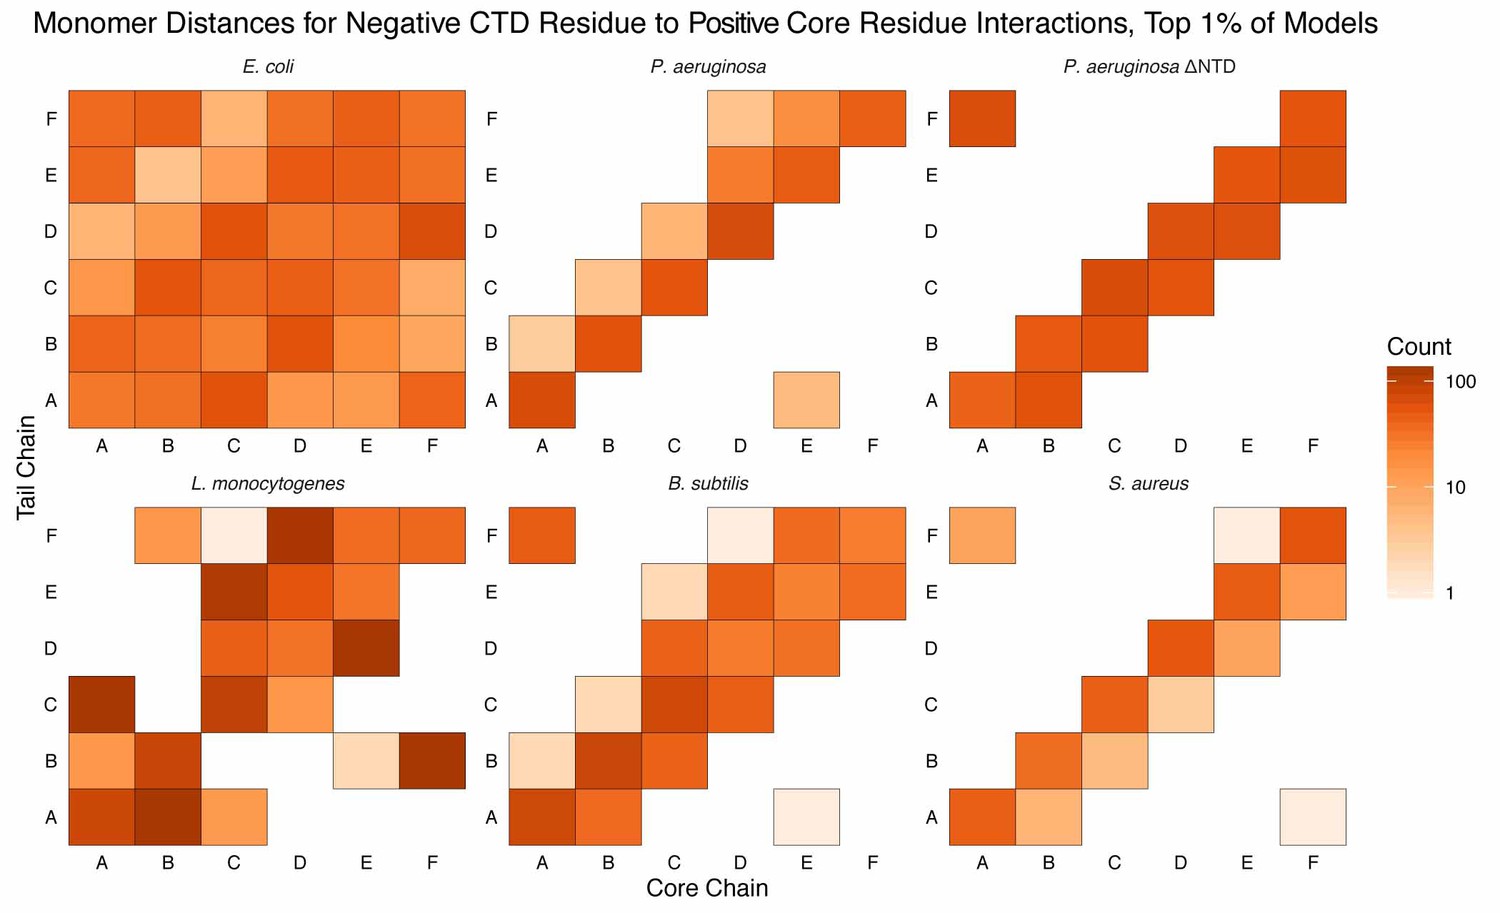
Monomer distances for interactions between acidic CTD residues and basic core residues.
Similar to Figure Supplement 1 except counts are added to each bin if an interaction between an acidic CTD residue and a basic core residue (see Materials and methods for selection definitions), belonging to the respective monomer, is observed. Longer CTDs (e.g. E. coli) can interact with all monomers, but are not required to do so (e.g. L. monocytogenes).
Tables
Table 1
Equilibrium dissociation constants for Hfq.
Values are the mean ± SD of three independent experiments. Kd values were determined by fluorescence anisotropy (see Methods). *Values were previously determined (Sun et al., 2002).
| Kd (nM hexamer) | Hill coefficient | |||||
|---|---|---|---|---|---|---|
| RNA | Hfq102 | Hfq65 | Hfq-sCTD | Hfq102 | Hfq65 | Hfq-sCTD |
| D16-FAM | 15.5 ± 0.9* | 20.0 ± 1.3* | 12.9 ± 2.1 | 0.7 ± 0.1* | 0.6 ± 0.1* | 0.8 ± 0.1 |
| D16-FAM·R16 | 117 ± 12 | 45.5 ± 2.4 | 181 ± 12 | 1.2 ± 0.1 | 1.0 ± 0.1 | 1.0 ± 0.1 |
| minRCRB | 13.9 ± 1.5* | 6.46 ± 0.7* | 20.1 ± 1.9 | 1.4 ± 0.2* | 2.5 ± 0.6* | 1.1 ± 0.1 |
Table 2
Sequences of oligomers and sRNAs.
https://doi.org/10.7554/eLife.27049.022| RNA or DNA oligomers | Sequences (5’ to 3’) |
|---|---|
| Target | GUGGUCAGUCGAGUGG |
| Target-U6 | GUGGUCAGUCGAGUGGUUUUUU |
| Target-A18 | GUGGUCAGUCGAGUGGAAAAAAAAAAAAAAAAAA |
| A18 | AAAAAAAAAAAAAAAAAA |
| R16 | GCACUUAAAAAAUUCG |
| Molecular beacon | FAM-GGUCCCCCACUCGACUCACCACCGGACC-DABCYL |
| D16-FAM | FAM-CGAAUUUUUUAAGUGC |
| minRCRB | Thiol-C6-CUUCCGUCCAUUUCGGACG |
| DNA1 | TATCCGTATGACGTTCCGGACTATGCGGCTAAGGGGCAATCTTTAC |
| DNA2 | TTTTTCAAACTGCGGATGAGACCACATATGTATATCTCCTTCTTAAAGTTAAAC |
| DNA2c | CAAATTGAAATTCTTCCTCTATATGTATACACCAGAGTAGGCGTCAAACTTTTT |
| Transcribed RNAs | |
|---|---|
| RprA | gggACGGUUAUAAAUCAACAUAUUGAUUUAUAAGCAUGGAAAUC CCCUGAGUGAAACAACGAAUUGCUGUGUGUAGUCUUUGCCCAU CUCCCACGAUGGGCUUUUUUUU |
| DsrA | gggAACACAUCAGAUUUCCUGGUGUAACGAAUUUU UUAAGUGCUUCUUGCUUAAGCAAGUUUCAUCCCGA CCCCCUCAGGGUCGGGAUUUUUUU |
| RyhB | ggGCGAUCAGGAAGACCCUCGAGGAGAACCUGAAAGCA CGACAUUGCUCACAUUGCUUCCAGUAUUACUU AGCCAGCCGGGUGCUGGCUUUUU |
| ChiX | gggACACCGUCGCUUAAAGUGACGGCAUAAUA AUAAAAAAAUGAAAUUCCUCUUUGACGGGC CAAUAGCGAUAUUGGCCAUUUUUUU |
| chiP | GUAGUCAGCGAGACUUUUCUCAACGCUACUU UUUUAAUUUUUAUUUUUUCGCUGUUCACCUUUG GUGCAGCAAUUUAUACGUCAAAGAGG AUUAACCCAUGCGUACGUUUAGUGGC |
| Peptides | |
|---|---|
| CTD-FITC | FITC-Ahx-NNAGGGTSSNYHHGSSAQNTSAQQDSEETE-COOH |
| CTDpos-FITC | FITC-Ahx-NNAGGGTSSNYHHGSSAQNTSAQQRSNKTN-COOH |
| BsCTD-FITC | FITC-Ahx-QLELE-COOH |
Table 3
Parameters used to calculate molar fractions of D16-FAM complexes.
Values are the mean of at least two independent experiments determined by fluorescence anisotropy. A further description of the parameters and their usage is provided in the Methods.
| Parameter | Anisotropy | Complex/complexes |
|---|---|---|
| rMdr | 0.0400 | [D16-FAM·R16] |
| Hfq102 rMhdr | 0.2227 | [Hfq102·D16-FAM·R16] |
| Hfq-sCTD rMhdr | 0.2203 | [HfqsCTD·D16-FAM·R16] |
| Hfq65 rMhdr | 0.2161 | [Hfq65·D16-FAM·R16] |
| Hfq102 rAP | 0.0732 | [Hfq102·D16-FAM·R16] + [D16-FAM·R16] + [Hfq102·D16-FAM] |
| Hfq-sCTD rAP | 0.0663 | [Hfq-sCTD·D16-FAM·R16] + [D16-FAM·R16] + [Hfq-sCTD·D16-FAM] |
| Hfq65 rAP | 0.1099 | [Hfq65·D16-FAM·R16] + [D16-FAM·R16] + [Hfq65·D16-FAM] |
| Hfq102 rMhd | 0.2195 | [Hfq102·D16-FAM] |
| Hfq-sCTD rMhd | 0.1985 | [Hfq-sCTD·D16-FAM] |
| Hfq65 rMhd | 0.1935 | [Hfq65·D16-FAM] |
| Hfq102 rhd | 0.1332 | [Hfq102·D16-FAM] |
| Hfq-sCTD rhd | 0.1353 | [Hfq-sCTD·D16-FAM] |
| Hfq65 rhd | 0.0969 | [Hfq65·D16-FAM] |
Additional files
-
Supplementary file 1
Rosetta FloppyTail Protocol.
Step-by-step description of FloppyTail simulations, with a fully worked example on E. coli Hfq.
- https://doi.org/10.7554/eLife.27049.024
-
Transparent reporting form
- https://doi.org/10.7554/eLife.27049.025
Download links
A two-part list of links to download the article, or parts of the article, in various formats.
Downloads (link to download the article as PDF)
Open citations (links to open the citations from this article in various online reference manager services)
Cite this article (links to download the citations from this article in formats compatible with various reference manager tools)
Acidic C-terminal domains autoregulate the RNA chaperone Hfq
eLife 6:e27049.
https://doi.org/10.7554/eLife.27049


