Magnetothermal genetic deep brain stimulation of motor behaviors in awake, freely moving mice
- University at Buffalo, United States
- Philipps University Marburg, Germany
- CIC biomaGUNE, Paseo Miramón 182, Spain
Figures
Figure 1 with 4 supplements
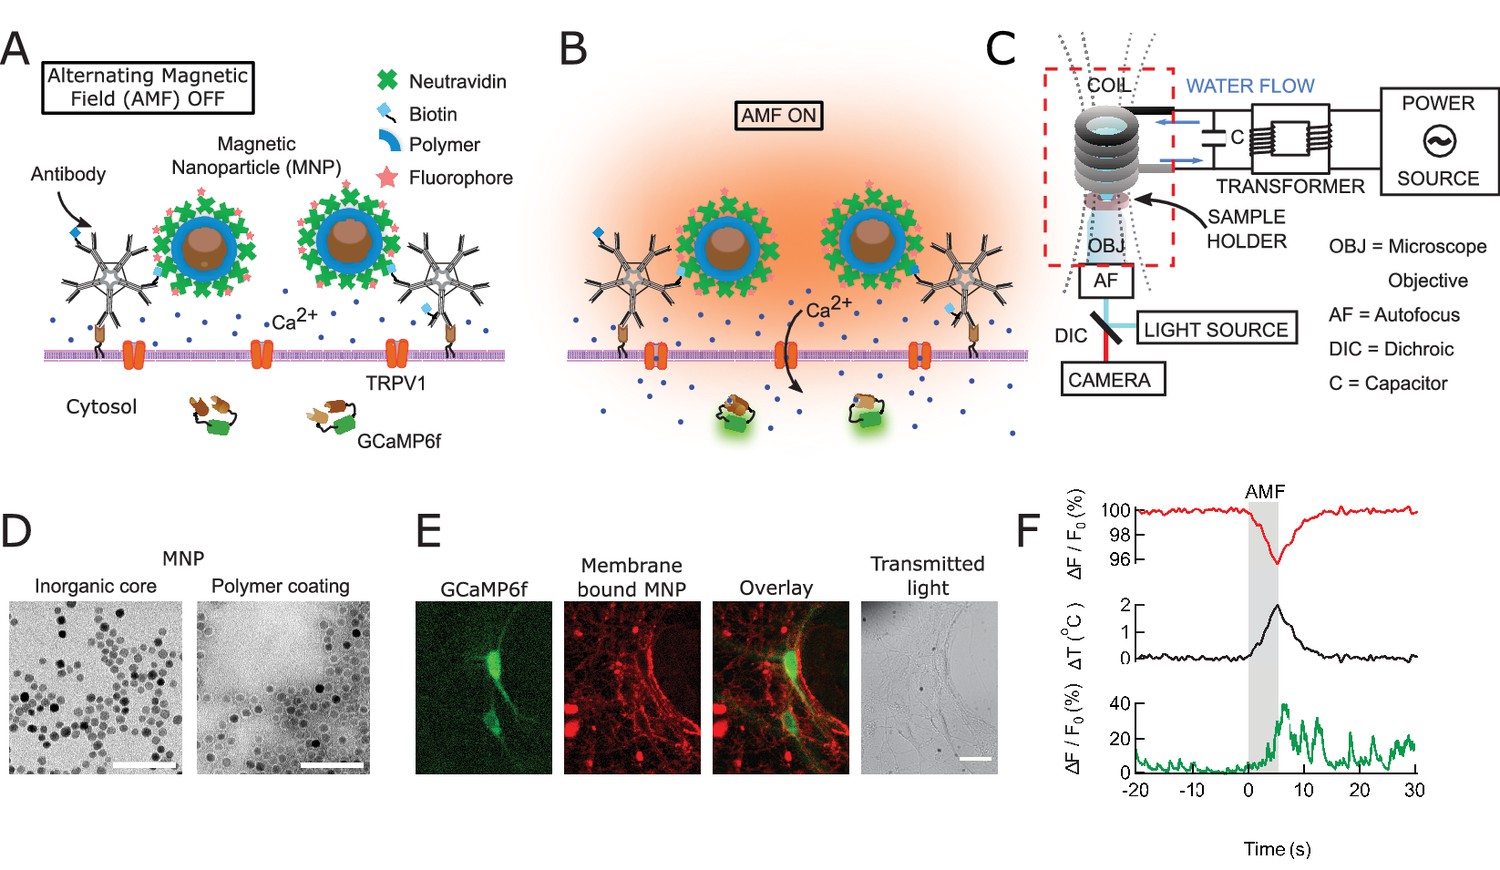
Magnetothermal genetic neurostimulation activates TPRV1 channels by heating membrane-bound magnetic nanoparticles using an alternating magnetic field.
(A) Magnetic nanoparticles (MNPs) (brown), encapsulated in PMA polymer (blue ring) are functionalized with NeutrAvidin (green), conjugated with Dylight550 fluorophores (red stars), and attached to the neuronal membrane via biotinylated antibodies targeting membrane proteins. The neurons are transfected to express temperature-sensitive TRVP1 channels and the calcium indicator GCaMP6f. (B) Applying an alternating magnetic field (‘AMF on’) heats the membrane-bound MNPs. This heat dissipates, raising the temperature locally near the membrane, which activates the TRPV1 channels. The resulting calcium influx depolarizes the neurons and is measured as a transient intensity increase of the GCaMP6f fluorescence. (C) The experimental setup combining the alternating magnetic field (AMF) application with fluorescence microscopy for in-vitro studies. The AMF (dotted lines) is produced by a five turn, continuously water cooled coil made of copper pipe. The coil and capacitor C form an electrical resonator that is driven by a 7.5 kW alternating power source. Neurons grown on cover glass are placed directly underneath the coil in a non-metallic sample holder. The AMF causes eddy currents in metal parts, including the microscope objective (OBJ). Any focus drifts are compensated by a fast laser autofocus (AF) (also see Figure 1—figure supplement 4). Components within the red, dashed box are to scale. (D) Transmission electron micrographs showing 12.5 ± 1.2 nm core-shell MNPs. (Left) MNPs as synthesized. (Right) Negative staining visualizes the PMA polymer shell encapsulating the dark inorganic nanoparticles. Scale bar is 100 nm long. (E) From left to right: fluorescence micrographs of GCaMP6f+ (green) neuron; labeled with MNPs (red); overlay of the GCaMP6f (green) and MNP (red) signals; and transmitted light image of the same neurons. Scale bar 10 µm (See also Figure 1—figure supplement 2A). (F) (Top) Local heating of MNPs during AMF application measured as a dip in DyLight 550 fluorescence intensity (red trace), which drops linearly with increasing temperature. The grey bar indicates the application of the AMF (22.4 kA/m, 412.5 kHz). (Middle) Temperature change near MNPs, as calculated from the fluorescence data using the calibration shown in Figure 1—figure supplement 3 (black trace). (Bottom) The GCaMP6f fluorescence signal recorded in the neuron decorated with nanoparticles shows a Calcium transient after 5 s of AMF when the membrane temperature increased by 2°C. Temperature decreased after the AMF was removed and the Calcium transients slowly subsided again.
Figure 1—figure supplement 1
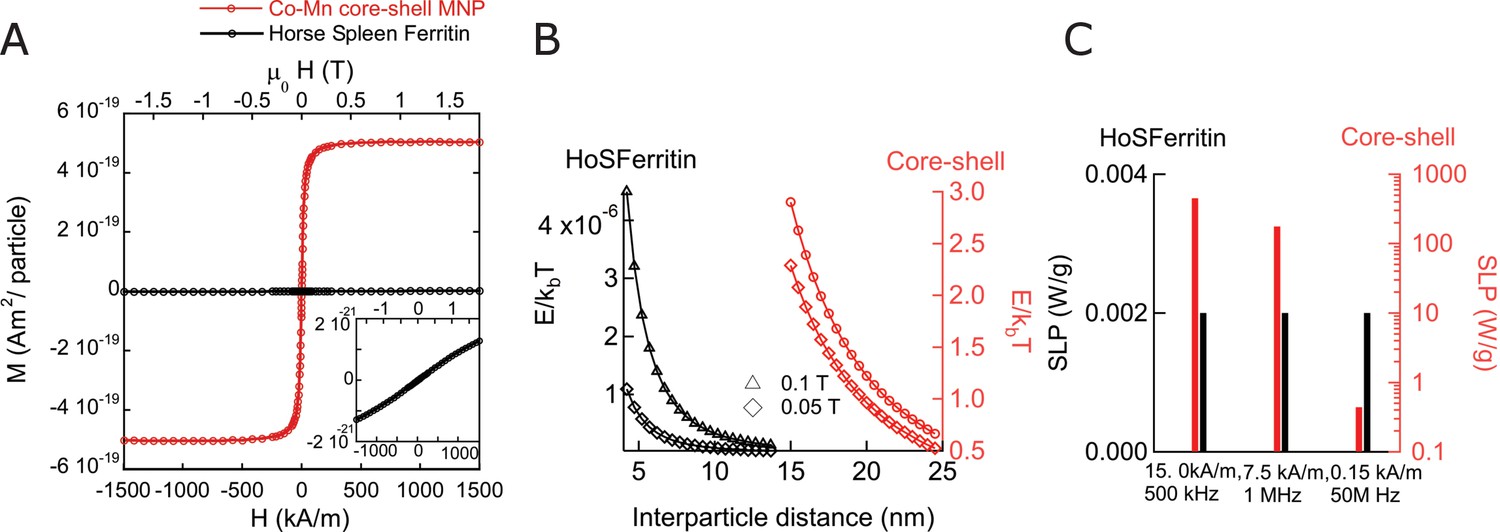
Magnetic properties of nanoparticles and ferritin.
(A) Magnetization as function of external field at 37°C per particle, comparing horse spleen ferritin (Data credit in Supplemental methods section) to the exchange coupled core-shell MNPs used in our work. The magnetization per particle for ferritin is considerably smaller than that of the synthesized particles. (B) Magnetic dipole-dipole interaction energy as function of center-center separation between two MNP, comparing horse spleen ferritin (HoSF) particles to core-shell (Cobalt Ferrite/Manganese Ferrite) particles. Magnetization per particle was calculated using the indicated magnetic field strengths at 37°C. The lower bound of x axis for each particle type coincides with the minimum distance of separation, when neighboring particles physically touch each other. As is evident, the interaction energy between ferritin particles are 6–7 orders lower than the thermal energy. (C) Comparison of SLPs of core-shell MNPs and horse spleen ferritin particles at various frequencies. The magnetic field strength chosen are obtained from the limiting cases of biomedical applications, at these frequencies. 5 log units lower SLP values are seen at frequencies under 1 MHz.
Figure 1—figure supplement 2
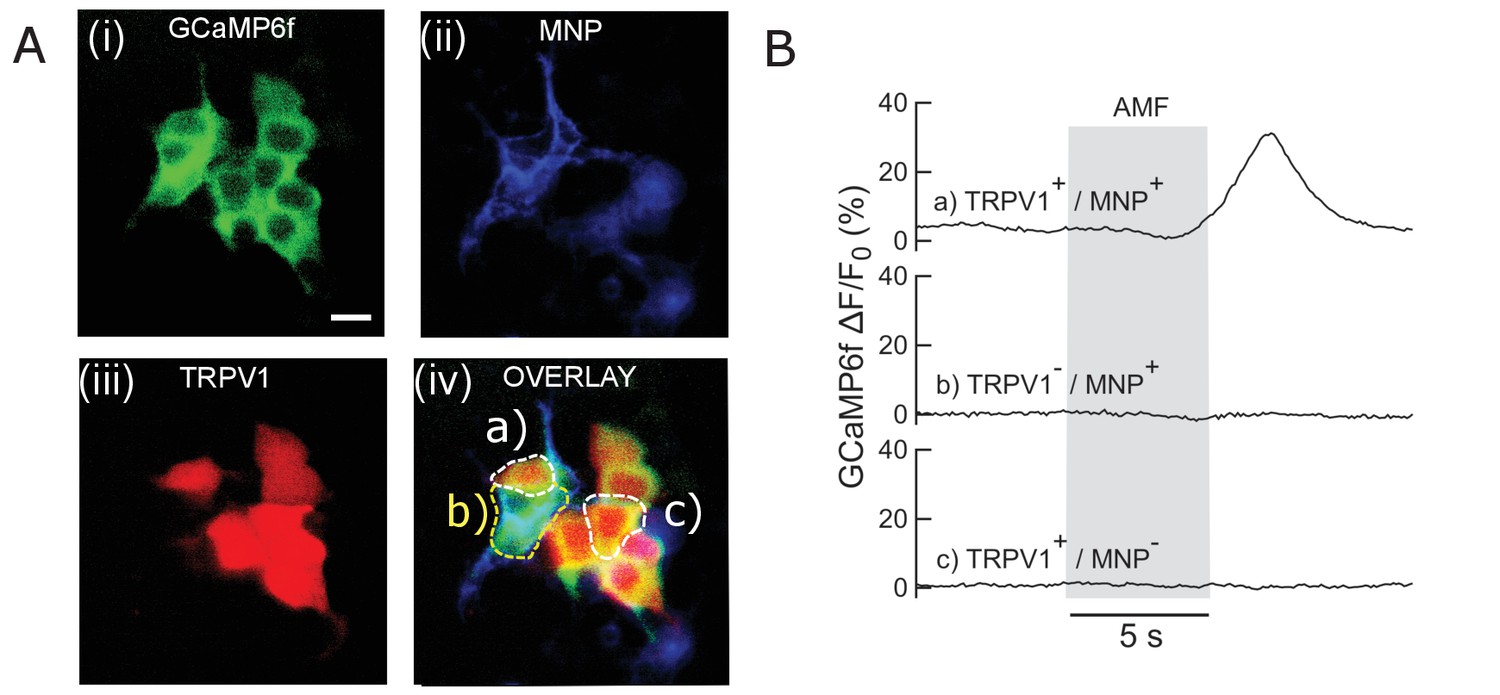
Control experiments in HEK293T cells.
(A) Faux color micrograph showing a group of HEK293T cells showing in the same dish various control and experimental conditions. Cells co-transfected with (i) GCaMP6f only; (ii) GCaMP6f + AP CFP-TM; (iii) GCaMP6f + TRPV1; (iv) GCaMP6f + TRPV1+AP CFP-TM were cultured in the same dish. The field of view contains cells with all four transfection conditions. MNPs only bound to the membrane (via biotinylated antibodies) of the AP-CFP-TM cells (conditions, ii and iv). Thus, we could obtain all the conditions, e.g. (a) TRPV1+ /MNP+; (b) TRPV1- /MNP+; (c) TRPV1+/MNP- in the same field of view. Representative cells are marked in the micrograph. Top left shows the fluorescence micrographs taken through the GFP channel. All cells expressing GCaMP6f are visible here. Top right shows TRPV1 expression via the fluorescence of DsRed markers, in the same field of view. MNP fluorescence is shown through Alexa 647 channel (bottom left). Overlay of all three channels is shown in bottom right. (B) GCaMP6f signal change recorded from the culture (snapped in B). Only a) TRPV1+/MNP+ cells show Calcium influx with AMF application (grey bar; 22.4 kA/m, 412.5 kHz). Conditions b) TRPV1- /MNP+; (c) TRPV1+/MNP- showed no change in baseline GCaMP6f fluorescence intensity. This shows that TRPV1+/MNP+ is the necessary and sufficient condition to evoke calcium influx with AMF.
Figure 1—figure supplement 3
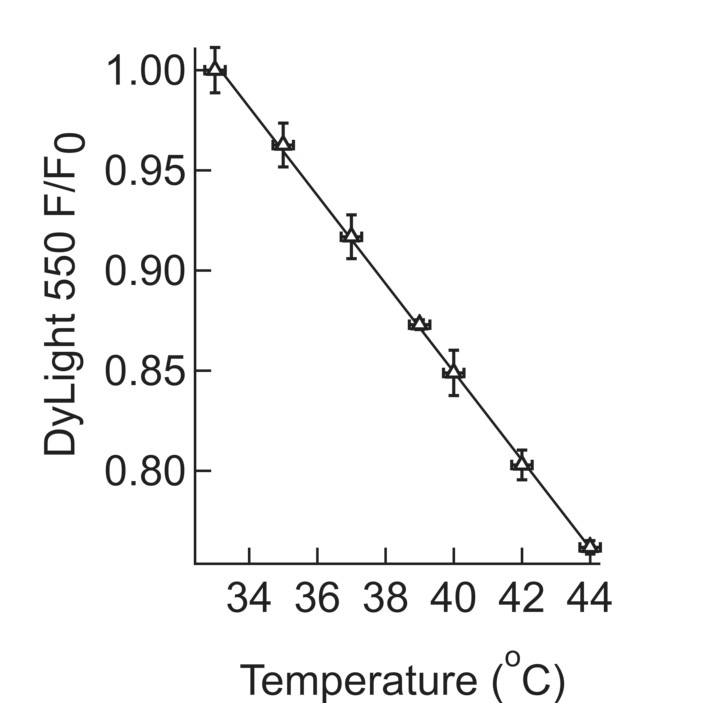
Calibration for in-situ temperature measurements.
Calibration of the temperature dependence of the fluorescence intensity of DyLight 550. A suspension of MNPs coated with NeutrAvidin - DyLight 550 was slowly heated to 44°C, while recording the fluorescence intensity. At each temperature point, multiple measurements were taken, which were then averaged and the s.e.m calculated.
Figure 1—figure supplement 4
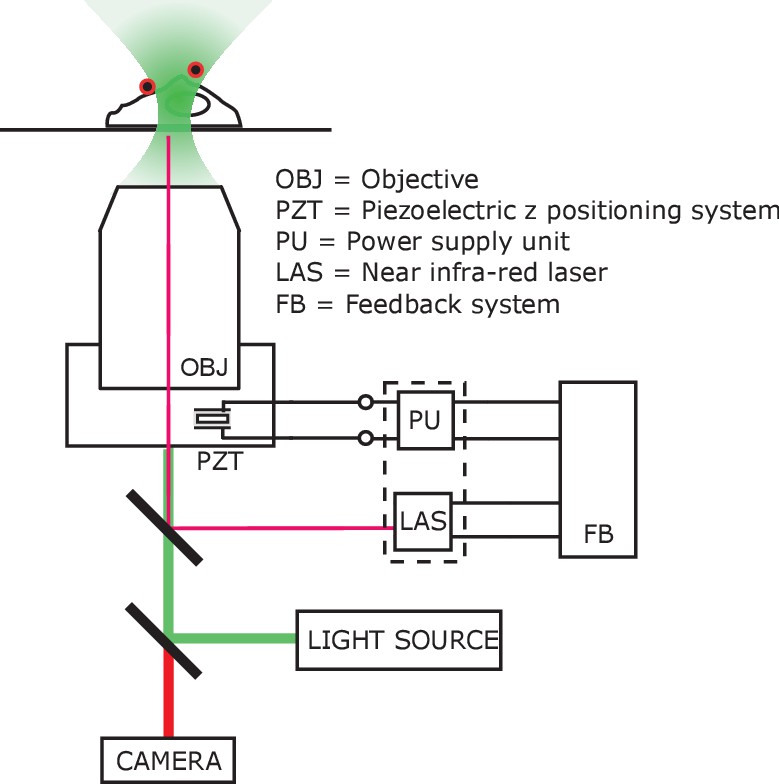
Imaging set-up compatible with AMF heating.
Schematic of the autofocus setup, compensating any optical aberrations and z-shift caused by eddy current heating of the objective lens. The microscope objective (OBJ) was mounted on an adapter, controlled by piezo-electric z positioning system (PZT). The piezo-electric crystal was powered (−30V – 130V) by a supply unit (PU) which was controlled by the feedback system (FB). The feedback system adjusted the piezo power in accordance with the transduced signal from the laser unit (LAS), which monitored the relative position of the glass coverslip with respect to the objective lens. Faux color micrograph showing a group of HEK293T cells showing in the same dish various control and experimental conditions. Cells co-transfected with (i) GCaMP6f only; (ii) GCaMP6f + AP CFP-TM; (iii) GCaMP6f + TRPV1; (iv) GCaMP6f + TRPV1+AP CFP-TM were cultured in the same dish. The field of view contains cells with all four transfection conditions. MNPs only bound to the membrane (via biotinylated antibodies) of the AP-CFP-TM cells (conditions, ii and iv). Thus, we could obtain all the conditions, e.g. (a) TRPV1+ /MNP+; (b) TRPV1- /MNP+; (c) TRPV1+/MNP- in the same field of view. Representative cells are marked in the micrograph. Top left shows the fluorescence micrographs taken through the GFP channel. All cells expressing GCaMP6f are visible here. Top right shows TRPV1 expression via the fluorescence of DsRed markers, in the same field of view. MNP fluorescence is shown through Alexa 647 channel (bottom left). Overlay of all three channels is shown in bottom right.
Figure 2 with 1 supplement
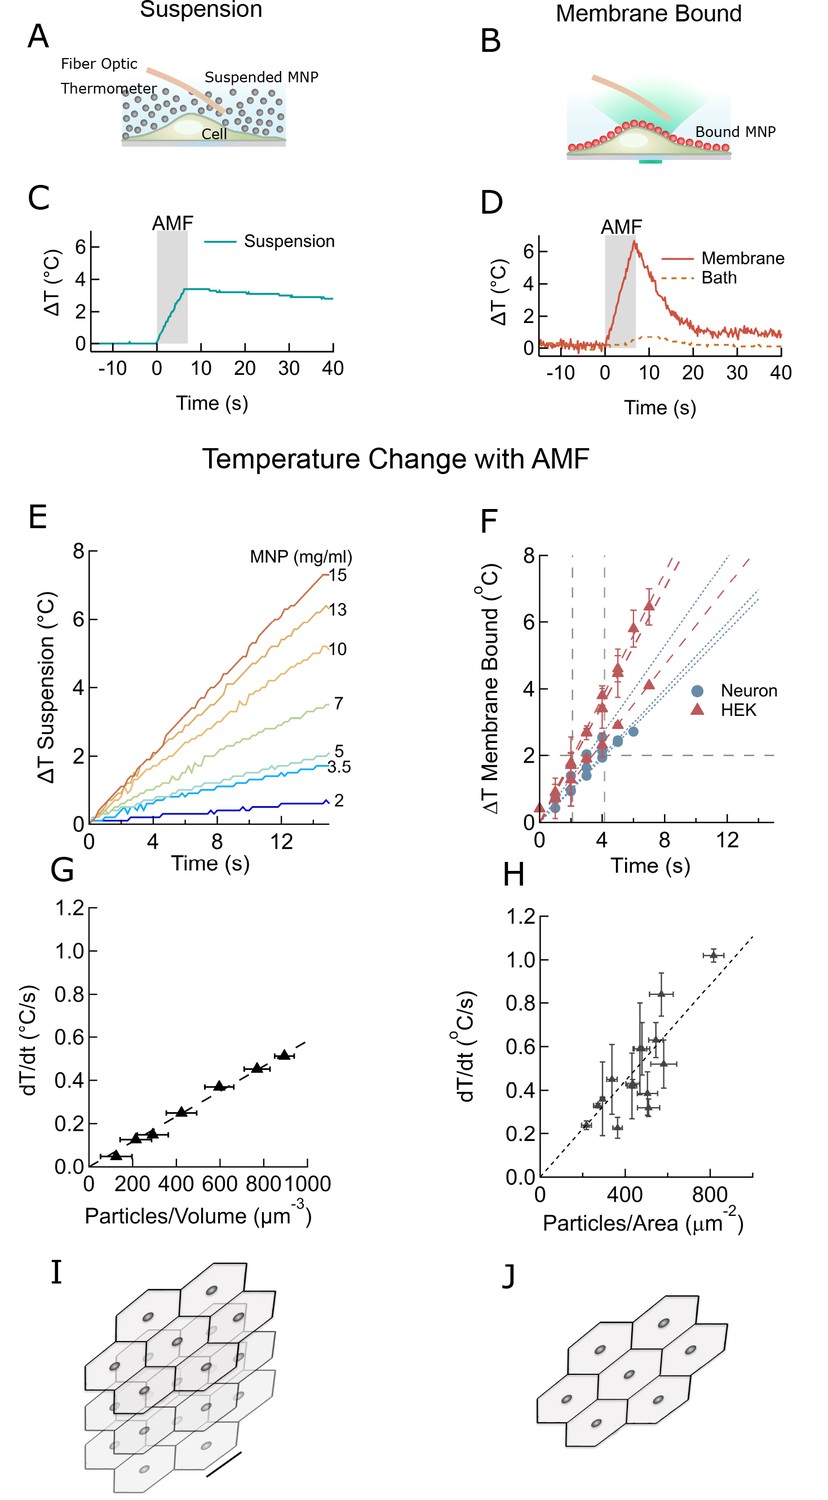
Membrane-bound MNPs heat the membrane locally without bath heating, cool quickly to turn signal off, and can heat more efficiently than MNP suspensions.
(A) Illustration showing MNP suspension in the bath above cells. During the AMF application the MNPs heated, raising the temperature of the entire bath volume, as measured by the fiber optic thermometer. The entire left column of this figure focuses on heating of a MNP suspension, while the right column compares this to heating the same MNPs when membrane bound. Not to scale. (B) Illustration showing MNPs bound via antibodies to the cell membrane. MNPs form a two-dimensional sheet along the contour of the cell membrane. AMF nanoparticle heating is limited only to the immediate vicinity of the cell membrane. DyLight fluorophores were attached to the MNPs (orange MNPs) to measure the local temperature changes near the membrane-bound MNPs via fluorescence microscopy. The bath temperature was monitored using the optic fiber thermometer. Not to scale. (C) Temperature rise and subsequent cooling during a 7 s AMF (22.4 kA/m at 412.5 kHz) application in a MNP suspension (10 mg/ml) above the cells (blue). (D) Temperature rise and subsequent cooling during a 7 s AMF (22.4 kA/m at 412.5 kHz) application on cell-membrane-bound MNPs (orange solid, recorded via fluorescence). Simultaneous recording of the bath temperature ((no perfusion, orange dashed line) confirmed that the MNP heating remains confined near the cell membrane. This is unlike the suspension heating of MNPs, where the entire bath heats uniformly. Another contrasting feature of membrane-bound MNP heating seen here is the rapid cooling. (E) Temperature rise in suspensions of CoFe2O4 – MnFe2O4 core-shell MNPs at various concentrations plotted versus time. Numbers to the right indicate MNP concentration in mg/ml (AMF in all cases 22.4 kA/m at 412.5 kHz). (F) Heating rates of bound MNPs are dependent on the area density on the membrane. Temperatures recorded at various time points are linearly fitted (dashed lines). Blue markers indicate data collected from neurons, using biotinylated anti-A2B5 for particle binding. Red markers indicate data collected from HEK293T cells with MNP attached to enzymatically biotinylated surface proteins. Error bars incorporate measurement errors and error associated with temperature calibration from fluorescence measurement. (see also Figure 1C). (G) Rate of temperature rise plotted as a function of density of MNPs in suspension. Error bars indicate error in estimation of concentration. Y errors are smaller than the marker size. Dashed line shows the linear fit. (H) Temperature rise around MNPs bound to cell membranes plotted against the mean area density of the MNP distribution. X error bars indicate the error in estimation of MNP density and Y errors are obtained as mentioned in (F). (I) Stacked sheets of isotropically distributed nanoparticles. Scale bar is 100 nm long. The nanoparticle density shown, corresponds to that required for 0.5 °C/s rise in suspension temperature. (J) Individual sheets from (I). Same scale. The density is enough to heat the membrane by 0.5 °C/s.
Figure 2—figure supplement 1
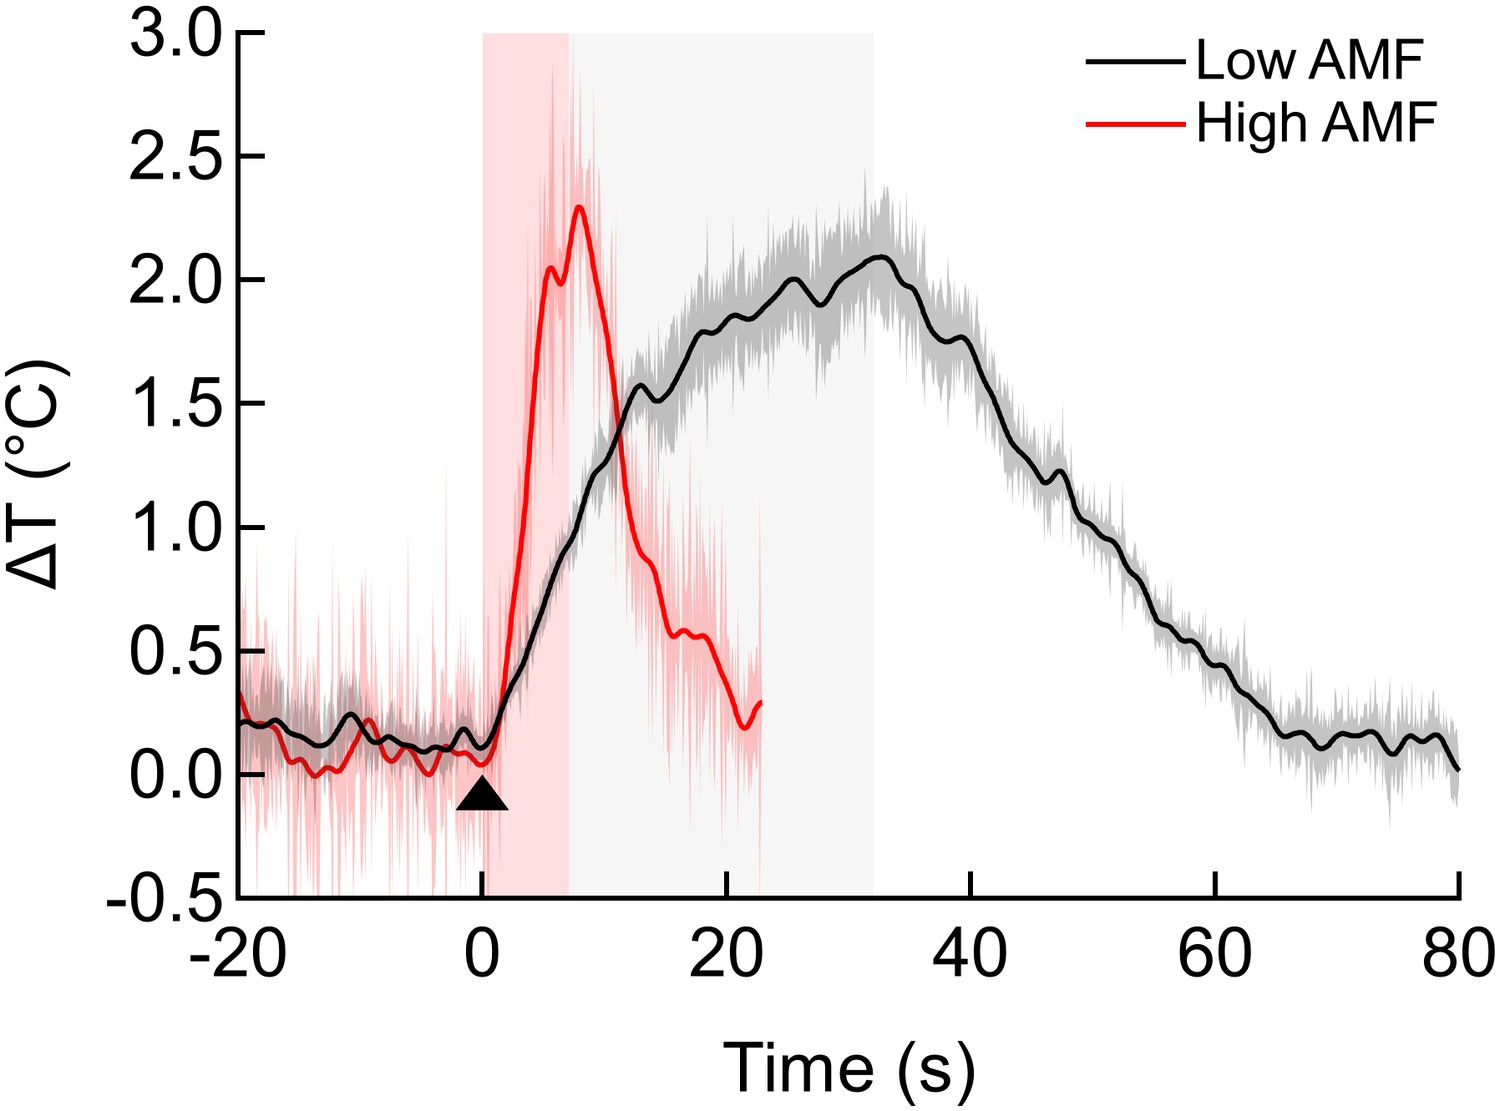
Effect of AMF strength on local heating.
Local temperature increase on HEK cells decorated with MNPs for two different AMF field strengths and durations: Black = low AMF (12 kA/m, 412 kHz), 30 s duration; Red = high AMF (30 kA/m, 412 kHz), 5 s duration; (sem shown as shading, n = 3). Note the asymptotic nature of temperature evolution in the low AMF case: as the rate of heat dissipation to the bath approaches that of heat generation rate of the MNPs, the rate of temperature increase decreases. Still, in both cases, the membrane is heated by more than 2°C.
Figure 3 with 2 supplements
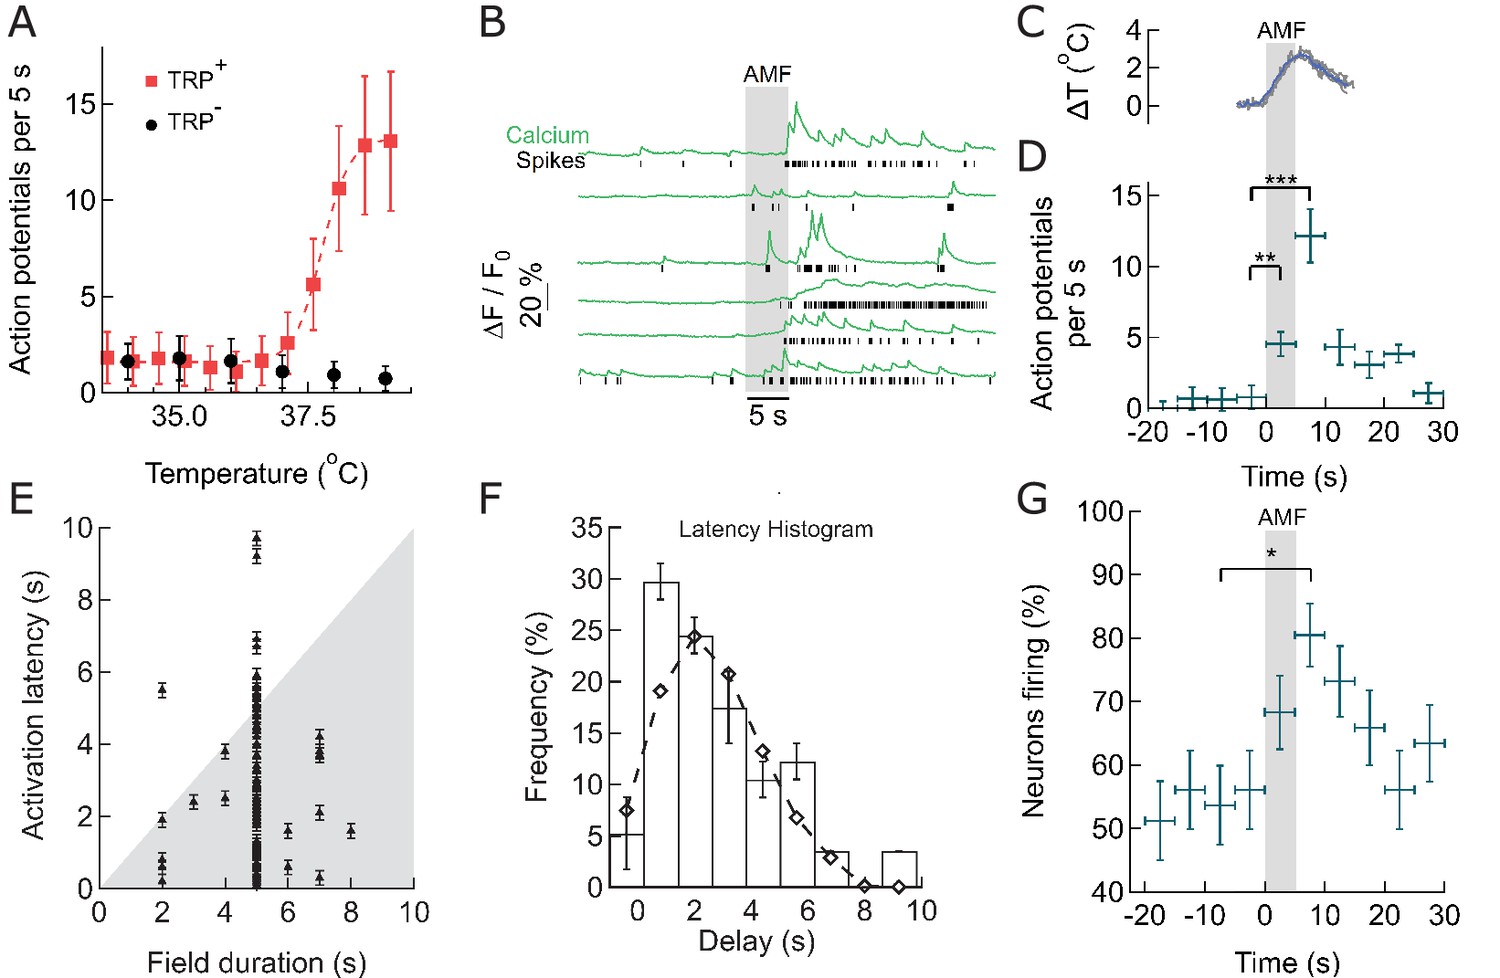
Within seconds of AMF application, membrane-targeted MNP stimulate magnetothermally TPRV1+ neurons in culture.
(A) Rate of Action Potential firing as a function of bath temperature, recorded from GCaMP6f transients observed in TRPV1 expressing hippocampal neurons (red) and wild-type neurons (control, black) when perfused with pre-heated buffer. The Ca2+ transients are modeled by a spike train (see Figure 3—figure supplement 1). The data points are fitted with Hill equation, giving a midpoint of 37.7 ± 0.06°C, which corresponds to half maximal firing rate (dashed curve). (B) GCaMP6f fluorescence intensity changes (green, Ca2+) in different TPRV1 +neurons decorated with MNP (5 s field, 22.4 kA/m at 412.5 kHz, in gray). Calculated spike events (black) are indicated under each Ca2+ trace (see Figure 3—figure supplement 2). (C) Change of cell surface temperature as measured by DyLight550 fluorescence (average of three experiments). (D) GCaMP6f signal recorded from nanoparticle-coated TRPV1 +neurons binned in 5 s intervals, indicated by x error bar (mean ±s.e.m, 13 neurons). The spiking frequency increased from 1.8 ± 0.6 per 5 s, before AMF (field 0 to 5 s), to 4.5 ± 1.2 per 5 s, during the AMF (n = 13, **p=0.0028, unpaired T-test), and 12.1 ± 2.0 per 5 s immediately following the AMF (n = 13, ***p=0.0002, unpaired T-test, 95% confidence intervals [1.5,2.23] and [10.8,13.3]) (Supplement 2). (E) Plot of activation latency, time interval between onset of field stimulation and first AP detect versus field duration. All data points lying on the gray background indicate that the first spike was detected while the field was still on (87% of events, n = 79, six cultures). Error bars indicate the temporal measurement uncertainty. (F) Percentage of neurons firing their first AP after field onset in the time interval indicated (subset of 41 cells from A which were stimulated for 5 s). The histogram was fitted (no weighting) with a Poisson curve (λ = 2.18 ± 0.17 s). Error bars are obtained as difference in population between bins shifted to left and right, following temporal uncertainty as indicated in (E). (G) Percentage of active neurons in each time interval (Alternating magnetic field applied 0–5 s). Error bars: x indicate 5 s time bin, y as in (F). A five-second AMF application increased the active population from 53.7 1.6% to 80.5 5.1% of neurons, *p=0.032, unpaired T-test, (n = 41, same as in (F)).
Figure 3—figure supplement 1
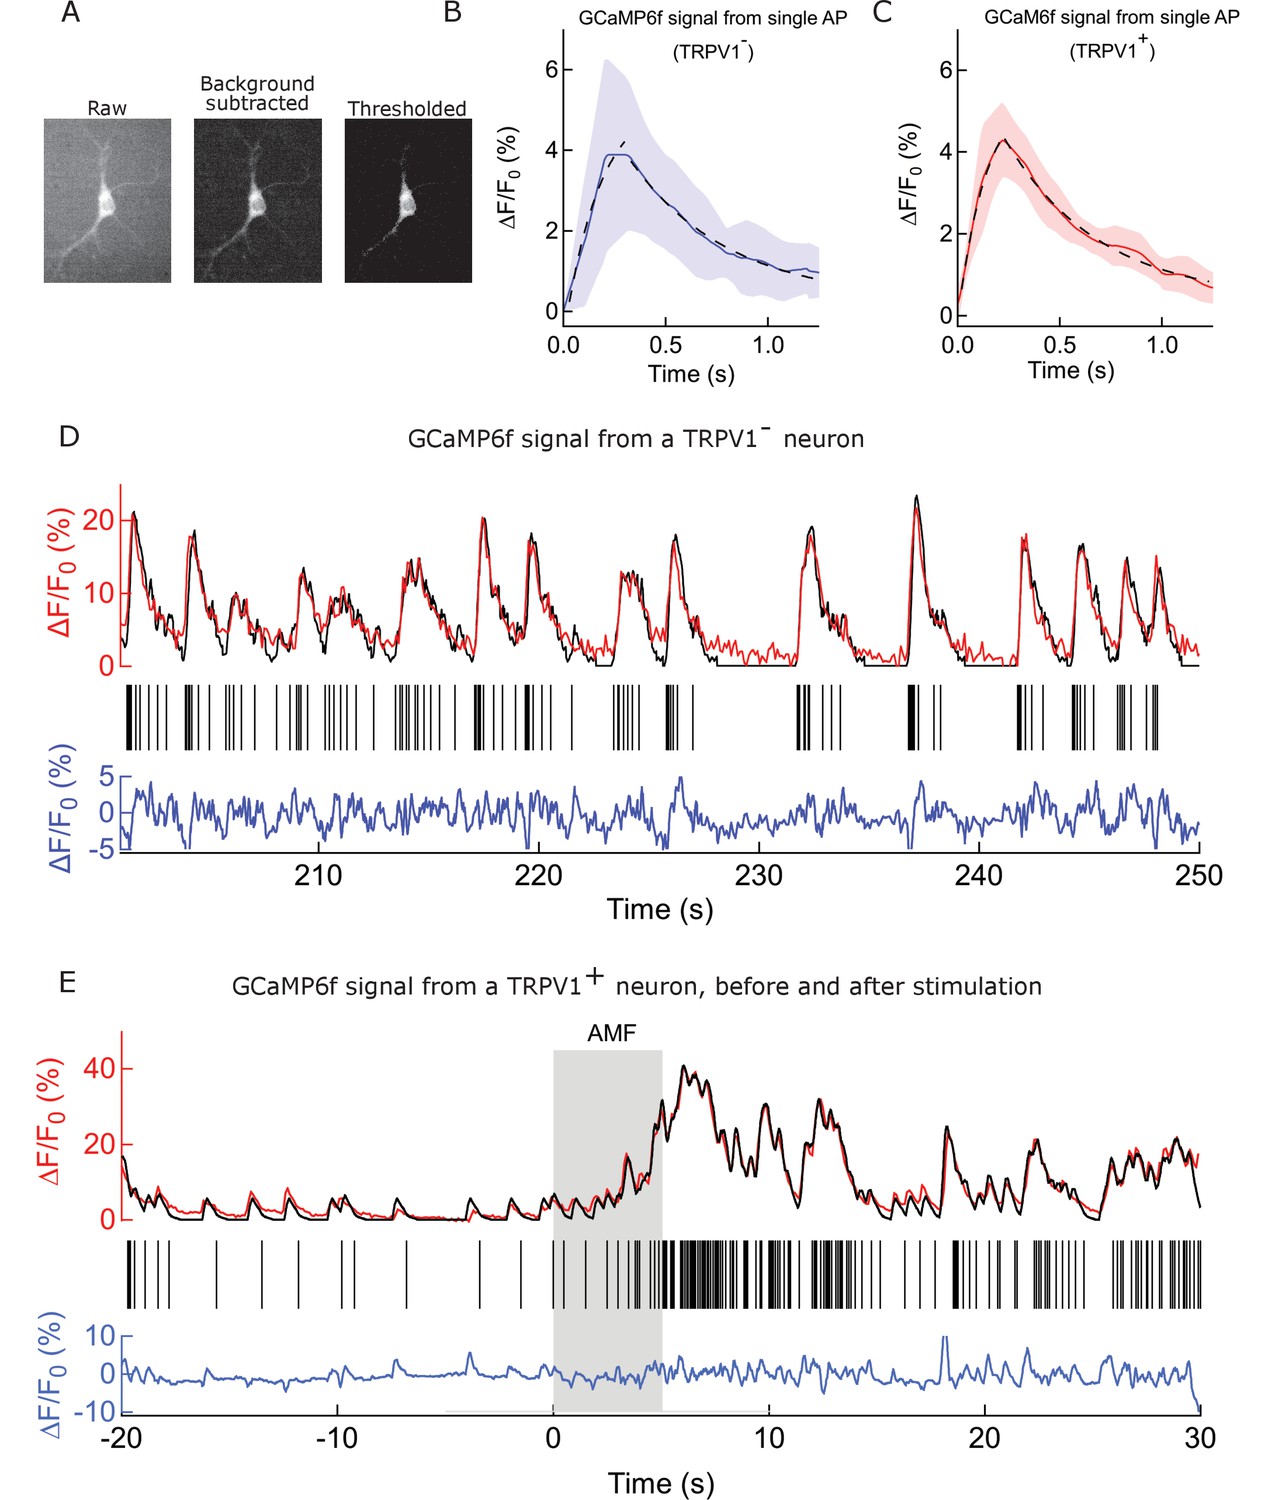
Procedure and controls to deduce spike train from GCaMP signal.
(A) Fluorescence micrographs of a GCaMP6f expressing neuron. (Left to right) raw image, as recorded; background subtracted with 50 pixel rolling ball on the same ROI; image after turning grey values of all pixels under a particular threshold intensity value to Not a Number (NaN). This operation removes noise and extracts pixels corresponding to soma for each frame of a video. (B) Mean and SEM of Calcium peaks corresponding to single action potential events (see Supplemental methods), recorded from 5 somas of WT rat hippocampal neurons expressing GCaMP6f. Data from each soma is the mean of 3 smallest calcium transients (kernel function). The average rise time is 232.2 ms and the t1/2 of decay is 335.5 ms. The peaks resulted from spontaneous firing and were recorded over a temperature range of 32–40°C. Black dashed curve shows exponential fits corresponding to the rise and fall phases. (C) Mean and sem of Calcium peaks corresponding to single action potential events, recorded from 6 somas of rat hippocampal neurons expressing GCaMP6f and TRPV1 channels. Data from each soma is the mean of 3 smallest calcium transients (kernel function) (recored over 32–39°C). The average rise time is 220.0 ms and the t1/2 of decay is 320.2 ms, showing no significant deviation from the peaks resulting from spontaneous firing. Black dashed curve shows exponential fits corresponding to the rise and fall phases. (D) Analysis of time course GCaMP6f fluorescence intensity change from the soma of a WT rat hippocampal neuron. (Top) Time course recording of GCaMP6f signal from the same soma (red) after exponential bleach correction. Overlaid in black is the reconstructed signal obtained by convolving the kernel function with binary action potential events. (Middle) Calculated action potentials (black sticks). (Bottom) Residual between the reconstructed waveform and the normalized signal is shown in blue. The scale indicates percentage change with respect to the signal baseline. (E) Analysis of time course GCaMP6f fluorescence intensity change from the soma of a rat hippocampal neuron expressing TRPV1 channels and decorated with nanoparticles on the membrane. (Top) Time course recording of GCaMP6f signal from the same soma (red) after exponential bleach correction. Overlaid in black is the reconstructed signal obtained by convolving the kernel function with binary action potential events. An increased firing rate is observed during AMF application (Grey bar) (Middle) Calculated action potentials (black sticks). (Bottom) Residual between the reconstructed waveform and the normalized signal is shown in blue. The scale indicates percentage change with respect to the signal baselin.
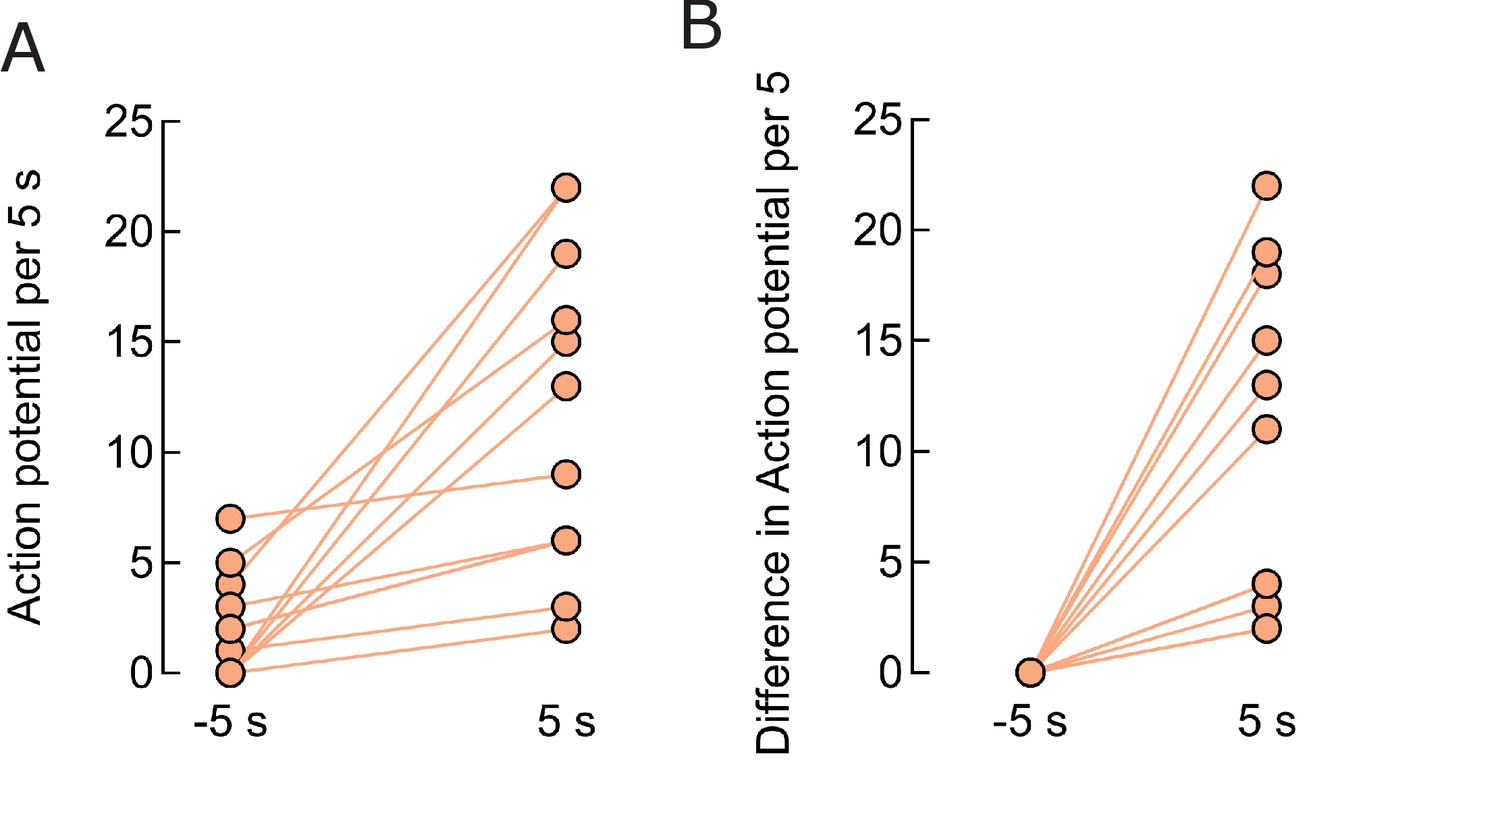
Figure 3—figure supplement 2
Firing rate enhancement in individual neurons.
(A) Comparison of firing 5 s before, 1.80.6 APs, and after the field start, 12.12.0 APs (p=0.0002, n = 13). (B) Difference in the firing rate during the 5 s period before and the same period after field application, average 10.22.1 APs (p=0.0004, n = 13).
Figure 4 with 5 supplements
Magnetothermal neurostimulation in the motor cortex elicits fast scurries around the arena.
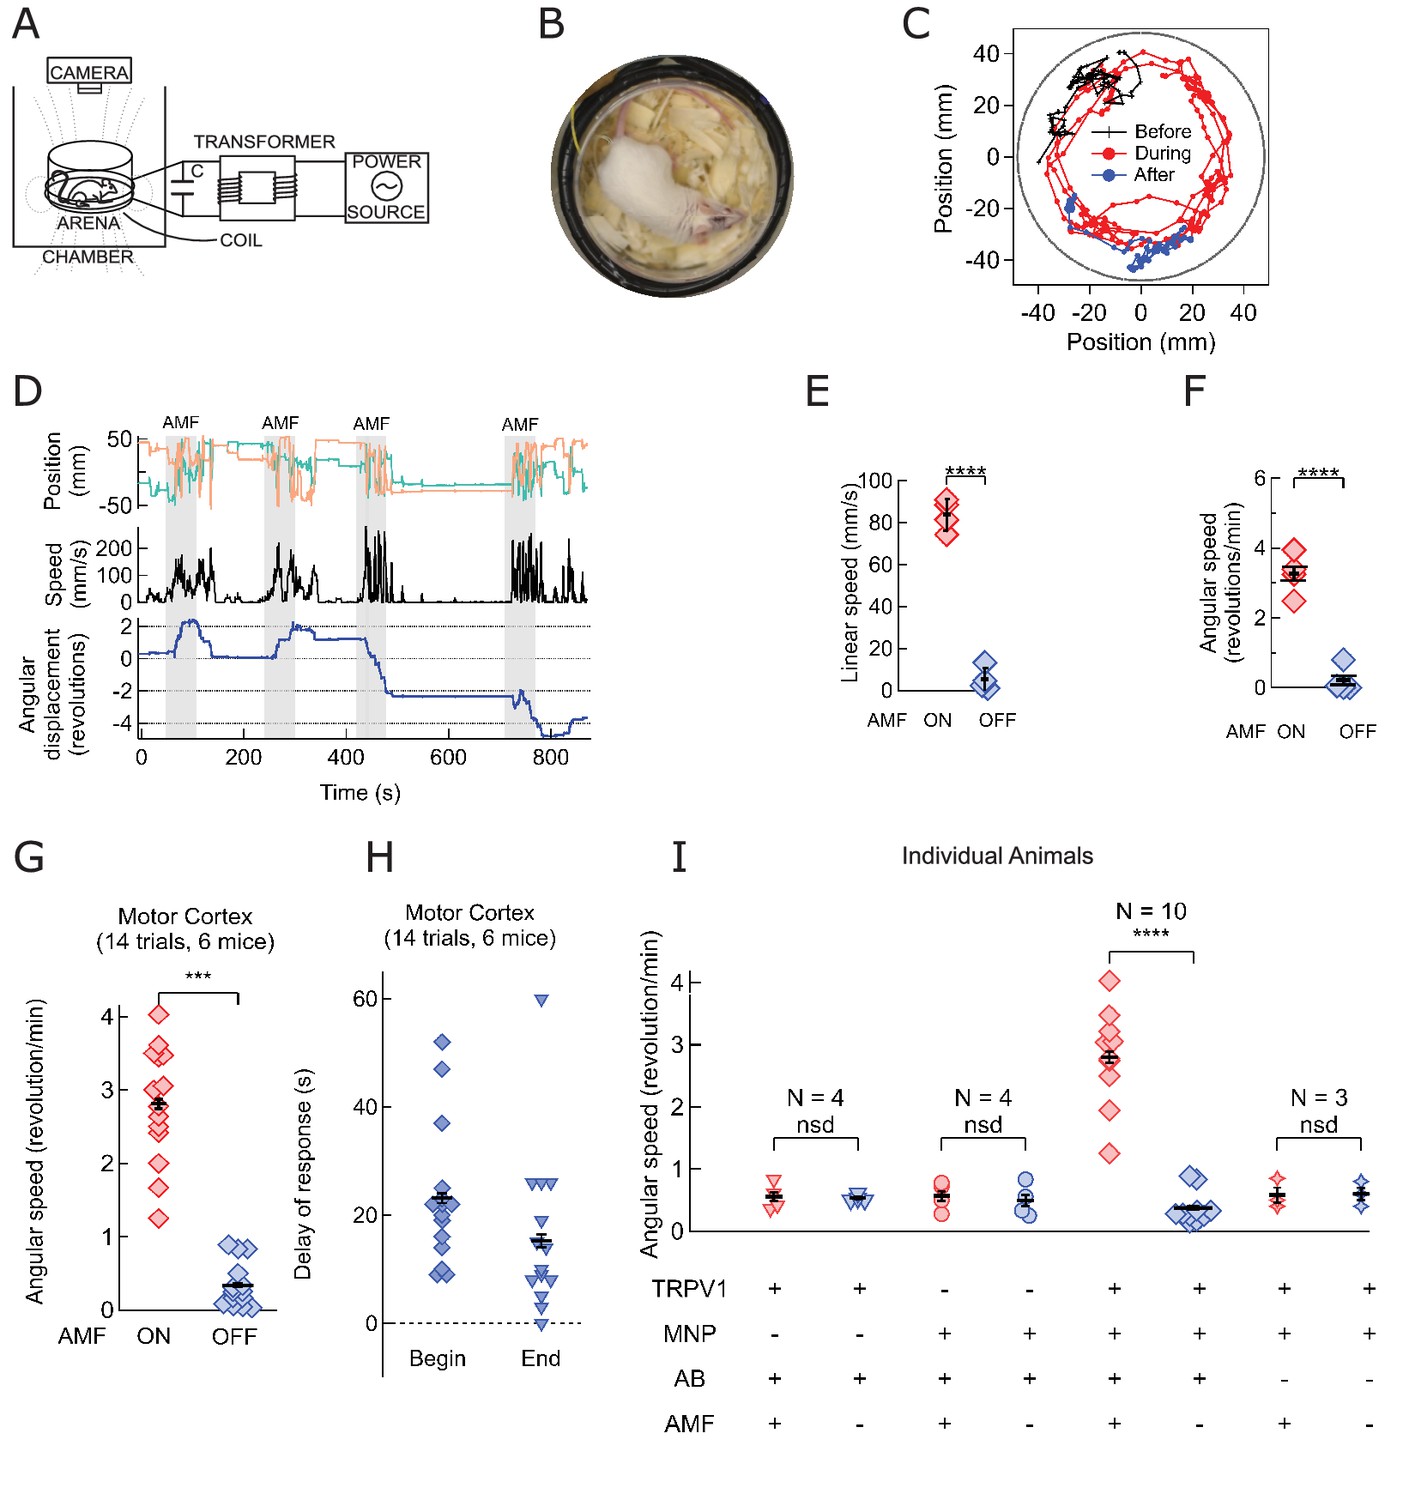
(A) Experimental set-up for in vivo magnetothermal stimulation of motor behavior in awake mice. A water-cooled two-turn coil around the arena generated the AMF. The AMF in the coil was powered by the same system as for the in vitro experiments. An overhead camera was used to record the mouse’s behavior in the arena. (B) Photograph of mouse in the observation arena; two-turn water-cooled coil visible as black ring. (C) Representative trajectory recorded from a mouse stimulated in the motor cortex before (black), during (red), and after (blue) field application (each 1 min long). The black circular border denotes the actual boundary of the chamber. (Also see Figure 4—figure supplement 1 for injection locations; and Videos 1 and 2). (D) (Top) Position of the mouse’s head, (x green; y orange) measured taking the center of the arena to be the origin. (Middle) Black trace shows the linear speeds of the mouse. Speed markedly increases during all AMF applications (Grey bars). After each AMF application, the mouse slows down regular exploratory motion (Bottom). Total turns made by the mouse was tracked versus time. Counter-clockwise angular changes were counted as a positive change in angles. During AMF application, the mouse turned unilaterally significantly more than between the AMF applications. (E) Comparison of linear speed of this TRPV1+ / MNP+ mouse, injected in the motor cortex, with and without AMF. The average linear speed increased 16-fold after AMF application, from 5.3 ± 2.75 mm/s, before AMF, to 83.8 ± 3.75 mm/s, during AMF (one mouse, four trials, the error bars are smaller than the symbols; p=5.9·10−6, 95% confidence intervals [0.9, 9.7] and [77.8, 89.8] mm/s). (F) Comparison of the angular speed from the same mouse as in (E). The angular speed during the AMF was 3.27 ± 0.30 rev/min versus 0.21 ± 0.19 rev/min between the AMF applications (one mouse, four trials, error bars are smaller than symbols; p=0.0003, 95% confidence intervals [−0.10, 0.53] and [2.78, 3.74] rev/min). (G) Comparison of angular velocity, or speed of circling the arena, measured for all TRPV1+ / MNP+ mice, injected in the motor cortex, with or without AMF. The speed of circling the arena in revolutions per minute increased 8-fold with AMF, from to 0.34 ± 0.08 rev/min to 2.81 ± 0.20 rev/min (6 mice, 14 trials; p=5.2·10−9; 95% confidence intervals [0.29, 0.39] and [2.69, 2.93] rev/min). (H) Latency of behavioral response onset and end after turning field on and off, respectively (n = 21). (I) Speed of rotation for control and experiment animals (independent mice): Control1: PBS instead of MNP injected (TRPV1+ / MNP-, n = 4; Video 3 ); Control2: PBS instead of virus injected (TRPV1- / MNP+, n = 4; Video 4); and Experiment (TRPV1+ / MNP+). There was no significant difference in the observed speeds with or without AMF (AMF+ and AMF-, respectively) in the control cases. With TRPV1+ / MNP+, the mice exhibited a highly significant increase in speed with AMF, 3.17 ± 0.17 rev/min, as compared to the mice without AMF application, 0.42 ± 0.07 rev/min (n = 10, p=1.1·10−5; unpaired T-test; 95% confidence intervals [0.32, 0.52] and [2.94, 3.40] rev/min). In the experiments and controls 1 and 2 and MNP were injected with A2B5 antibody (AB). Control3: MNP without antibody injected (TRPV1+ / MNP+, AB-, n = 3).
Figure 4—figure supplement 1
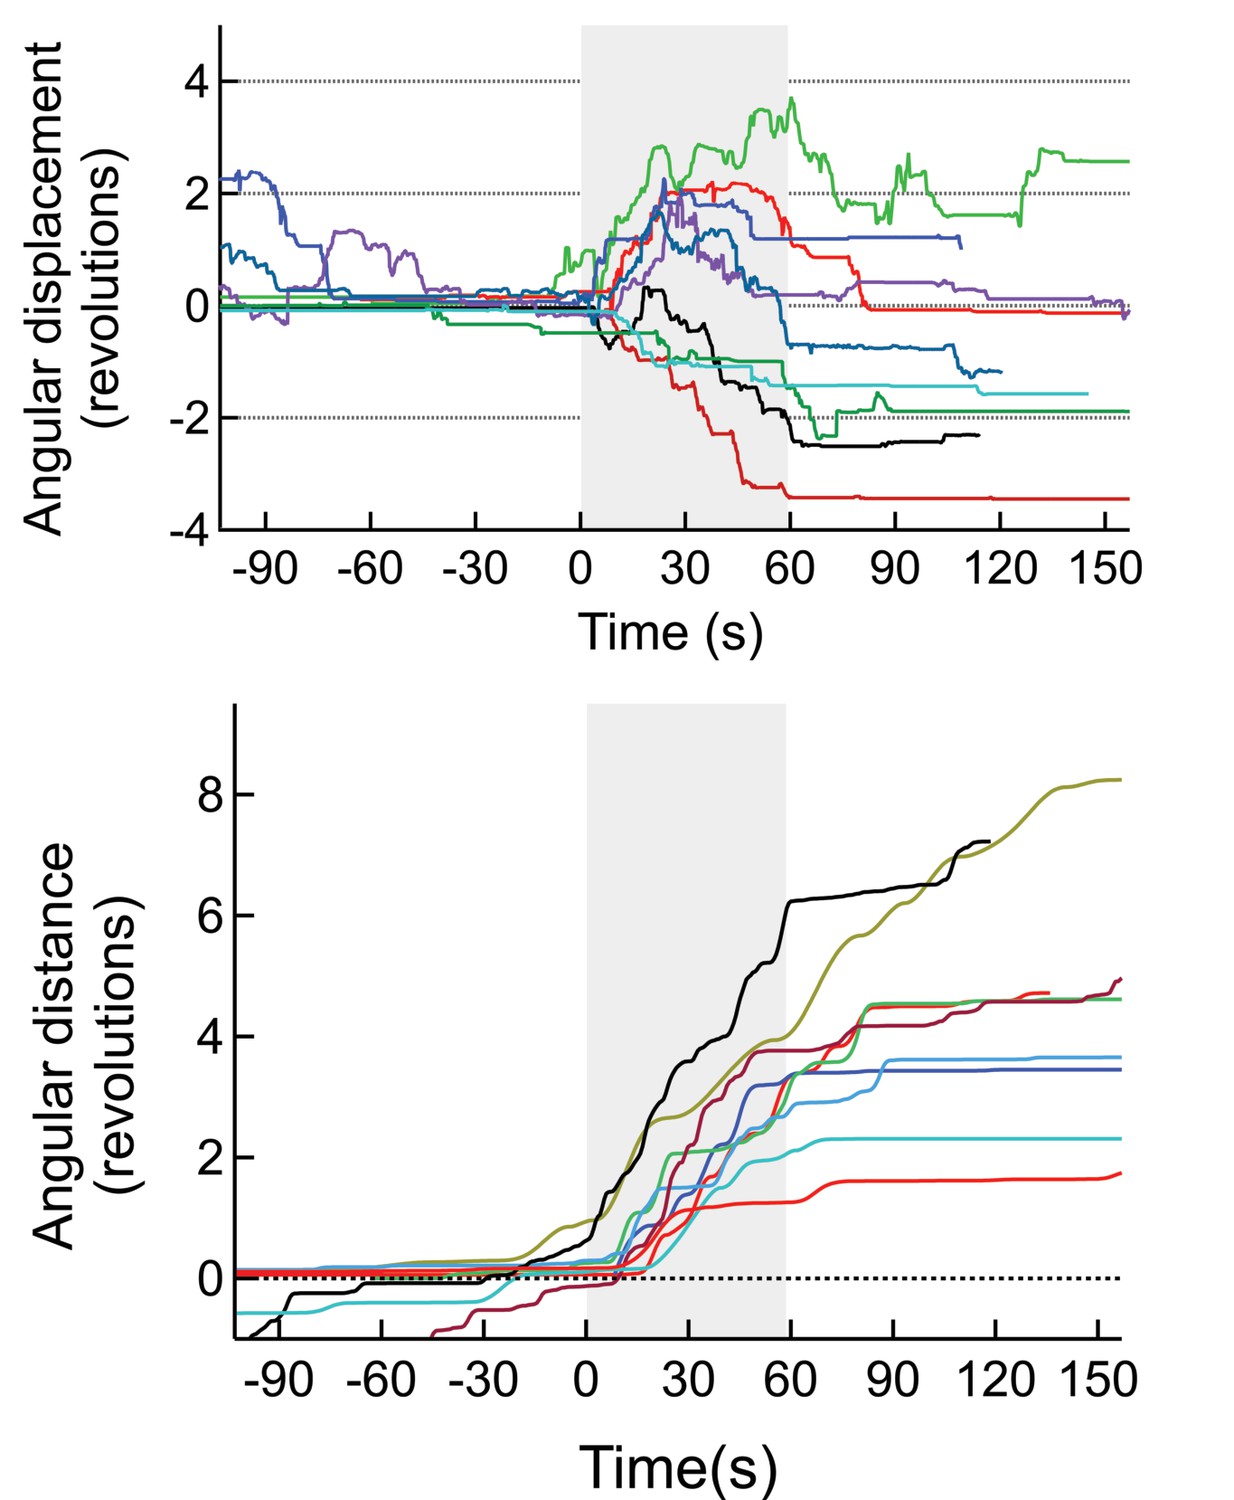
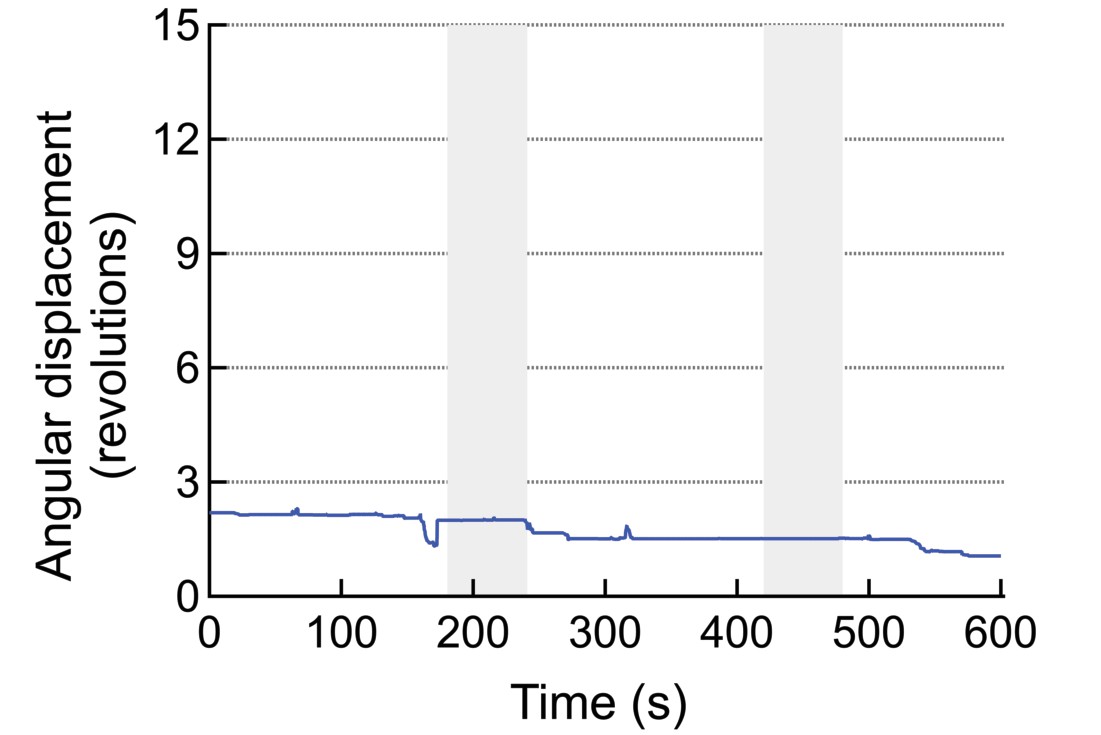
(Top) Angular displacement (negative CW, positive CCW) of mice stimulated magnetothermally in the motor cortex (7 trials, 3 mice).
(Bottom) As the mice change direction during the runs we also plotted the total angular distance travelled.
Figure 4—figure supplement 2
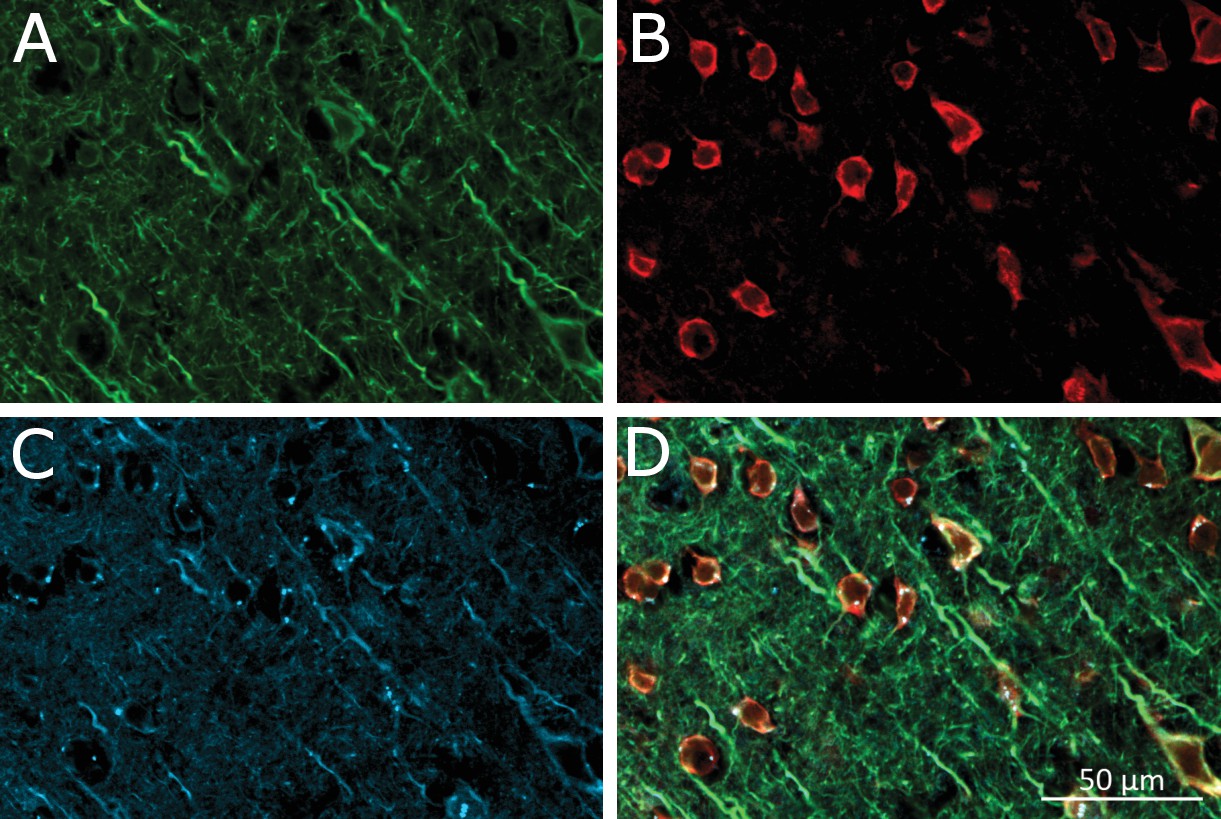
Virus-induced TRPV1 over-expression and membrane-bound MNP labeling of neurons in the Motor Cortex.
(A) Laser confocal image of soma and dendrites of neurons labeled by anti-microtubule-associated-protein (MAP2) antibody. (B) Anti-TRPV1 antibody shown TRPV1 expression on the membrane. Same ROI as A. TRPV1 overexpression was achieved through AAV5-hSyn-TRPV1 viral infection. (C) MNPs labeling membrane of neurons in the motor cortex. Same ROI as in panel A. The MNPs were co-injected with A2B5 antibodies. (D) Overlay of the panels MAP2 (green), anti-TRPV1 (red) and MNP (blue).
Figure 4—figure supplement 3
An example for a mouse injected with virus and MNPs but without the anti-A2B5 antibody.
These animals do not respond to the AMF application.
Figure 4—figure supplement 4
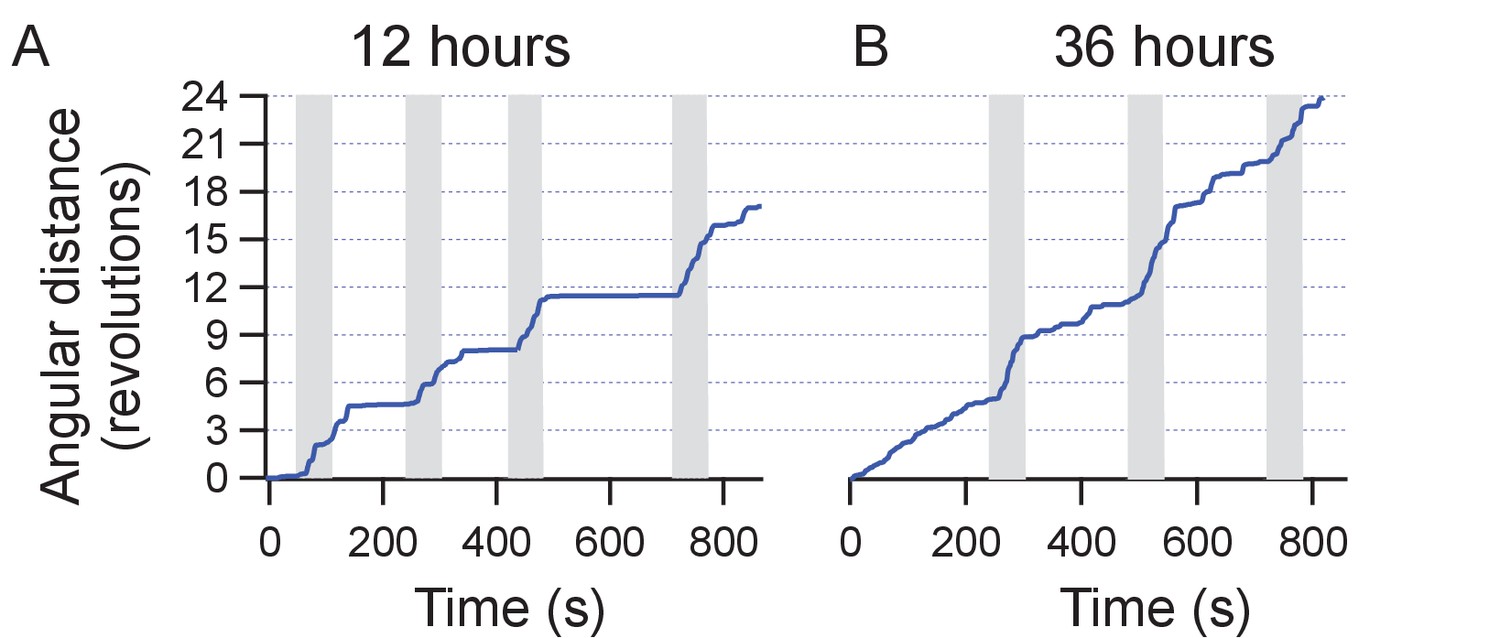
Repeatability of stimulation in motor cortex.
The figure shows two sessions of trials performed on the same mouse over a course of 2 days (12 hr and 36 hr post injection of MNPs). The animals position is recorded from the video and the cumulative angular distance travelled plotted. Four weeks earlier, the animal was injected with TRPV1+ and MNP+ (with AB) in the motor cortex.
Figure 4—figure supplement 5
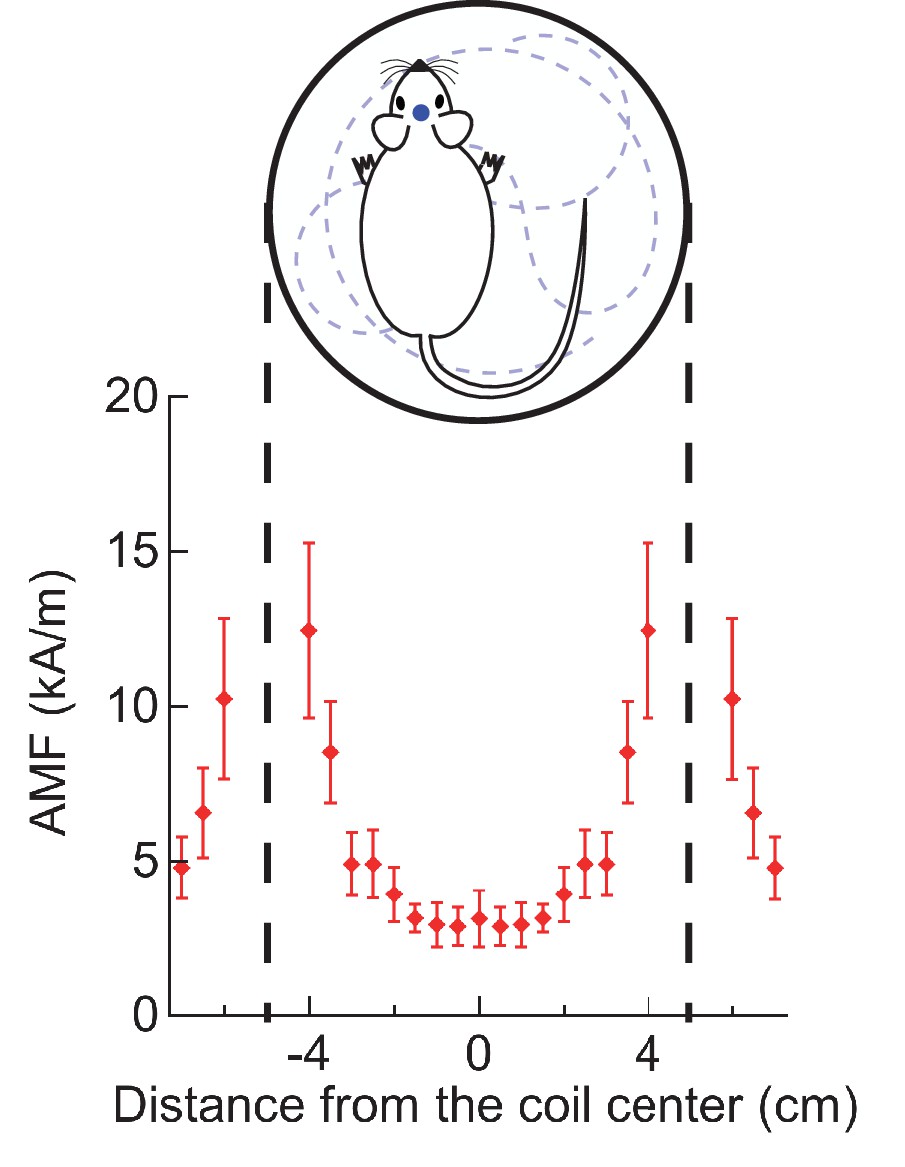
Magnetic field distribution across experimental arena.
Root-mean square magnetic field strengths were measured by a Fluxtrol alternating field probe. The plot shows the magnetic field profile of a 100 mm diameter two-turn coil resonating at 570 kHz. Measurements were done along a coil diameter, lying on a plane midway between the two turns. The error bars show bounds of variation in field strength over cycles. All in vivo stimulations were carried out in a circular arena bounded by the coil.
Figure 5 with 11 supplements
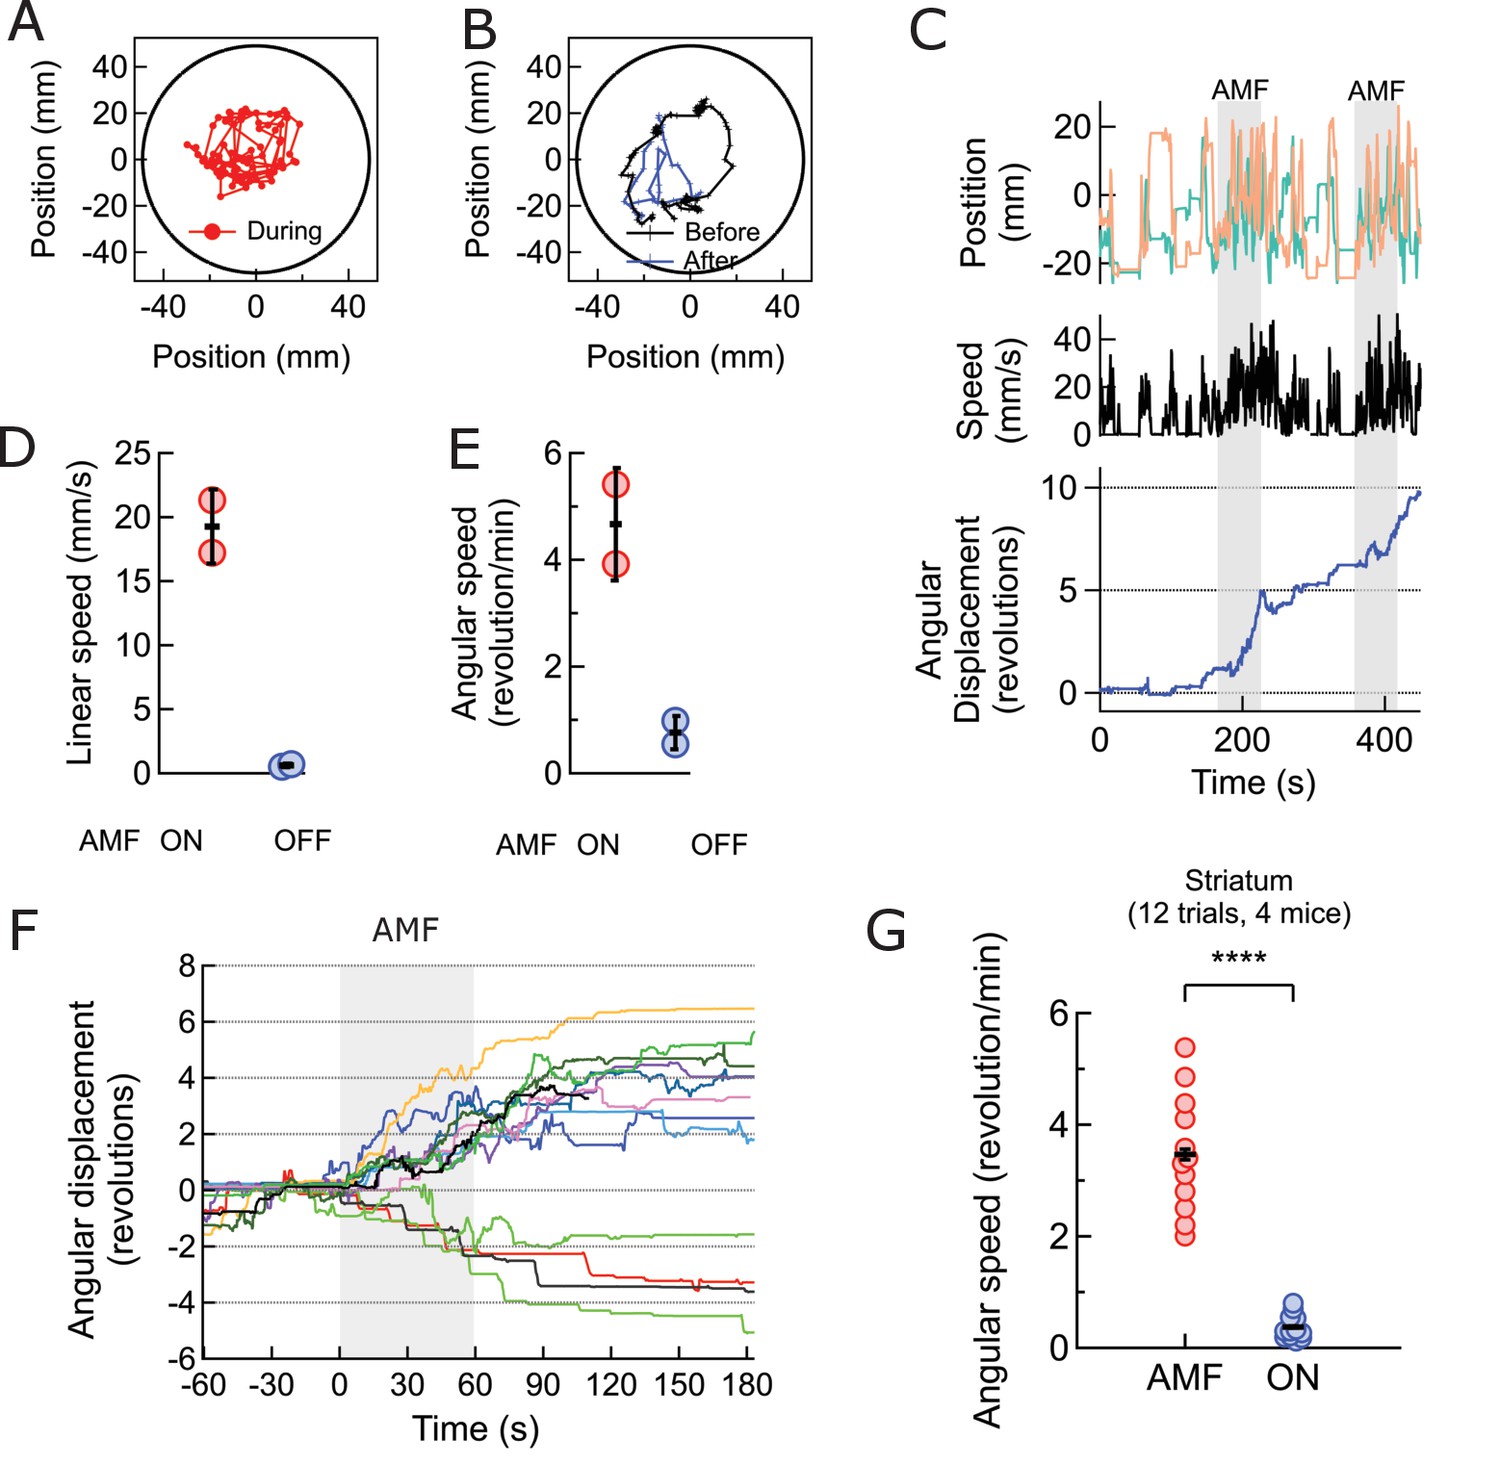
Magnetothermal neurostimulation in the striatum elicits rapid rotations around body axis.
(A) Trajectory of a representative TRPV1+/MNP+ mouse, injected in the striatum, during AMF application (1 min long). The mouse remained near the center of the arena, as it turned unilaterally around its body axis (in contrast with the motor cortex injected mouse). Black circle represents the actual arena boundary. (B) Two one-minute trajectories of the same mouse without AMF (black: before AMF application, blue: after AMF application). The mouse carried out regular resting/exploratory activities, turning five times less than that with AMF (Also see Video 6). (C) (Top) Trajectory (x,y positions, x green; y orange) of the mouse shown in part (A) and in Video 5. One minute long AMF was applied twice (gray bar). (Middle) Linear speed in mm/s of the same mouse calculated from the trajectory. (Bottom) Plot of the angular displacement, in revolutions, calculated from the trajectory. The mouse turns unilaterally counterclockwise (to the left) during the AMF applications. (D) , (E) Comparison between linear and angular speeds of the same mouse with (red) and without (blue) AMF. (F) Records of 12 stimulation trials in four mice. The motion is tracked and the angular displacement recorded (negative angular displacement is CW, while positive is CCW). In AMF application, the mouse only turns in one direction, typically for 3 to 4 turns, and in 11 out of 12 cases it turns contra-lateral to the injected brain half. (G) Comparison of angular velocity, or turning speed, in revolutions per minute measured for all TRPV1+/MNP + mice, injected in the striatum: angular speed during AMF, 3.46 ± 1.04 rev/min, was 5.8-fold the angular speed without AMF, 0.37 ± 0.22 rev/min (4 mice, 12 trials, p=3.74·10−7; unpaired T-test; 95% confidence intervals [0.33, 0.41] and [3.27, 3.65] rev/min, mean ± s.d.).
Figure 5—figure supplement 1
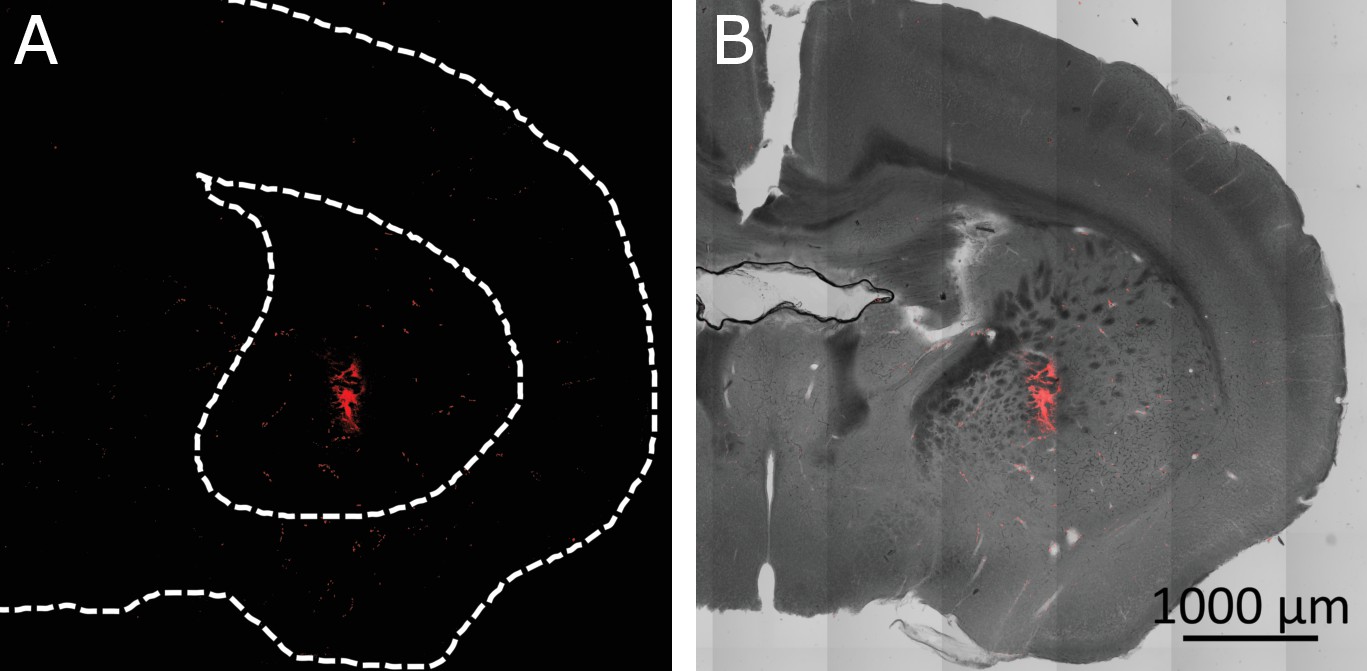
Confirmation of targeted region in the Striatum.
(A) MNPs covered cells in the target volume in the striatum seen through Alexa 647 attached to the MNPs. (Dashed lines are added for visual anatomical guidance). (B) MNPs (re. (C) d) overlaid on transmitted light image of the brain section.
Figure 5—figure supplement 2
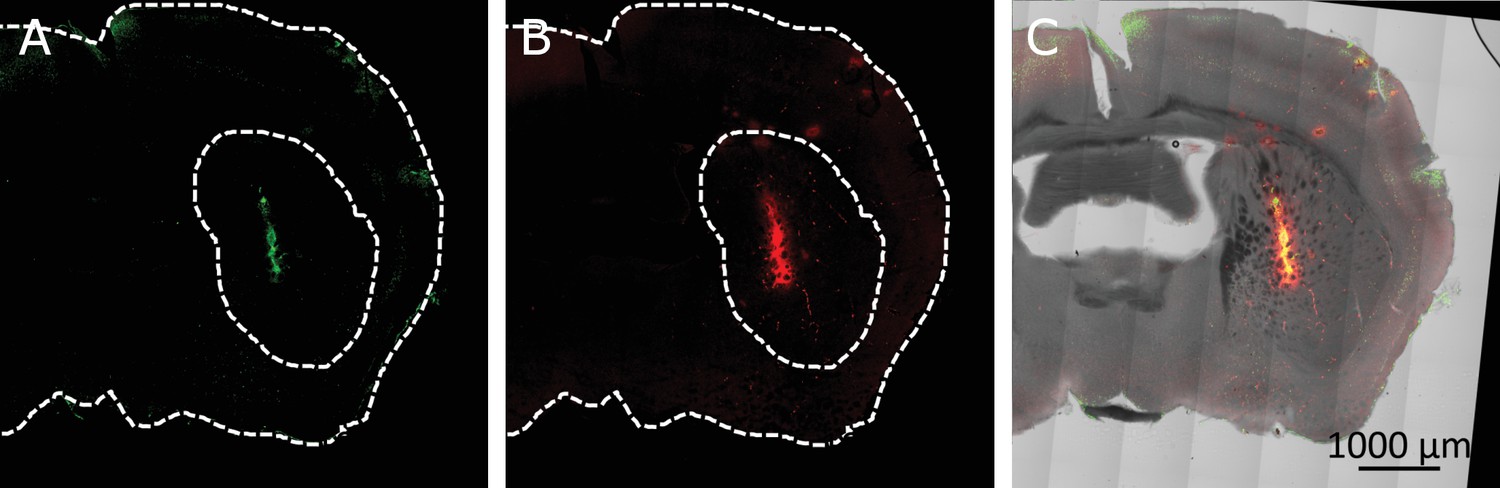
Co-localization of virus induced channel expression and MNP binding in the striatum.
(A) Immunostaining TRPV1 expressing cells, infected with AAV5-hSyn-TRPV1. The TRPV1 is labeled using anti-TRPV1 antibody (Abcam) with secondary antibody. (B) MNPs tagged with fluorescent marker (Alexa 647), injected in the same location 4 weeks after the virus injection. (C) An Overlay of TRPV1 expression (green), MNPs (red) and the transmitted light image (grayscale).
Figure 5—figure supplement 3
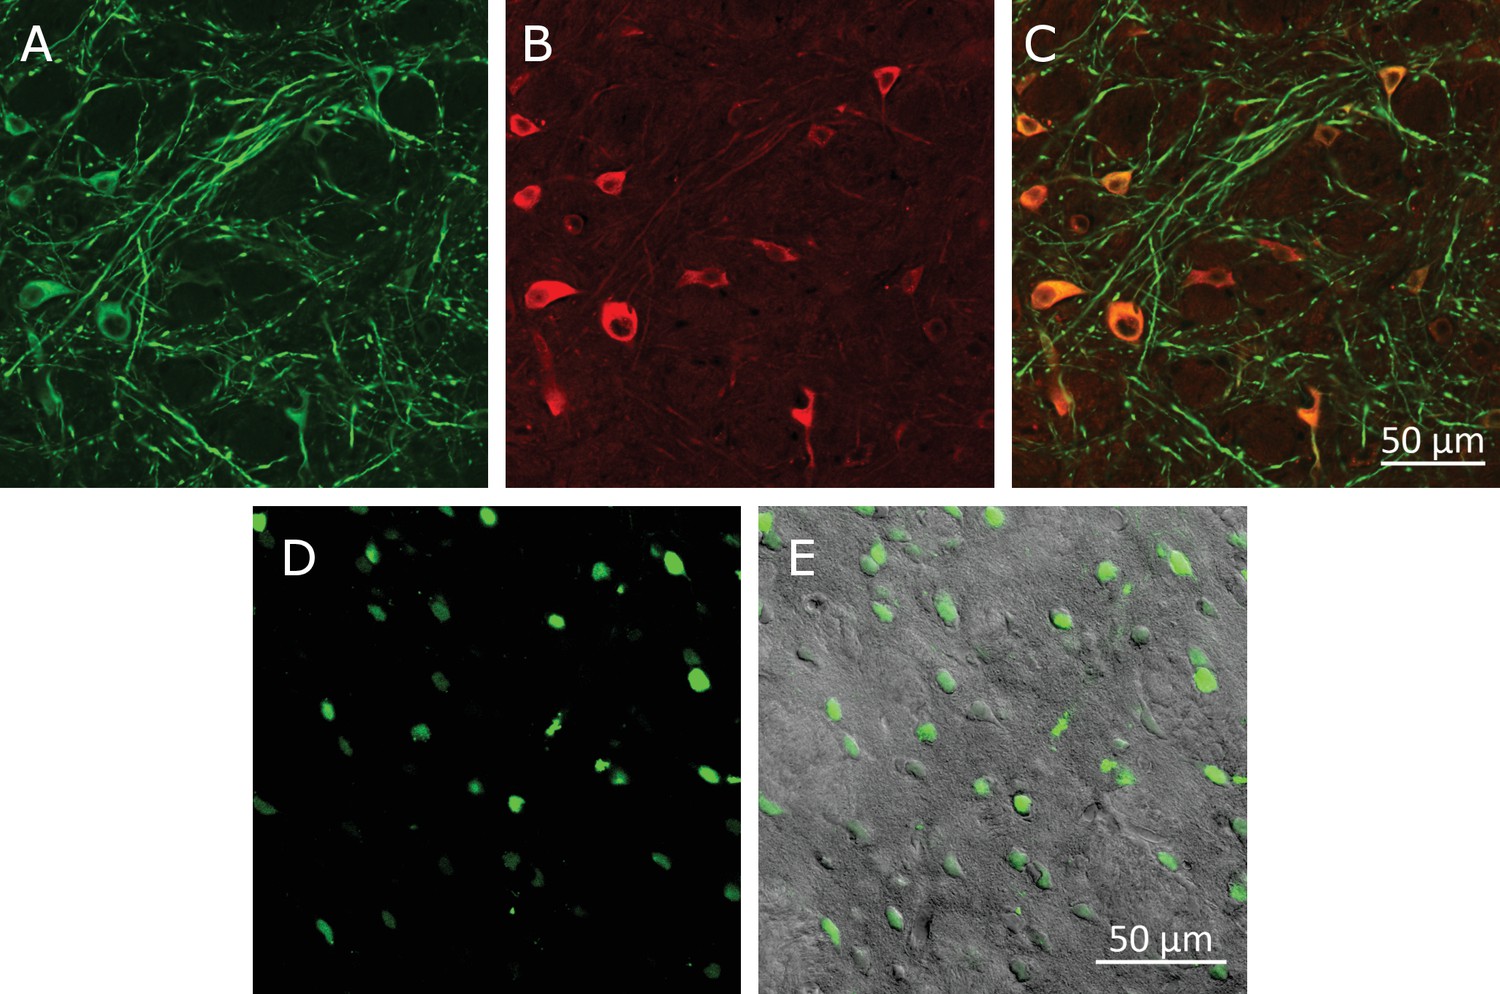
Virus-induced TRPV1 over-expression in the Striatum.
(A) Laser confocal image of soma and dendrites of neurons labeled by anti microtubule-associated-protein (MAP2) antibody. (B) TRPV1 overexpressed through AAV5-hsyn-TRPV1 viral infection, visualized using anti-TRPV1 antibody (Abcam) with Alexa-647-tagged secondary antibody. (C) Overlay of MAP2 (green) and TRPV1 (red) labels. (A) Lentivirus-induced TRPV1 overexpressing cells in striatum visualized by imaging the NLS-mCherry nuclear marker encoded in the lentivirus. (B) Overlay of the NLS-mCherry (viral infection marker, green) and a transmitted light image (gray scale).
Figure 5—figure supplement 4
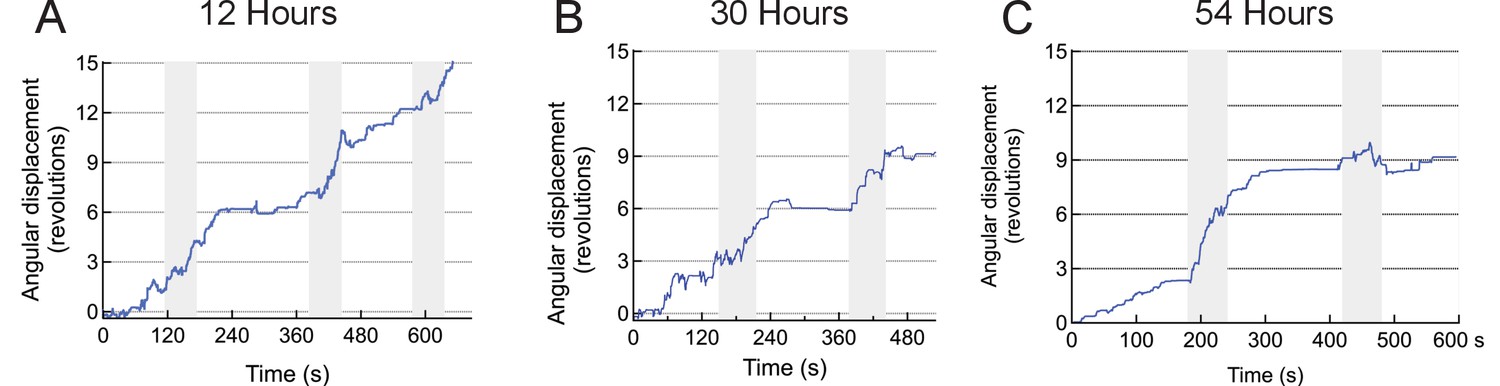
Repeatability of stimulation in striatum.
The figure shows three sessions of trials performed on the same mouse over a course of 2.5 days (time points are indicated above each plot, gray shaded areas are the AMF applications). The animal was injected with TRPV1+ and MNP+ (with AB) in the striatum.
Figure 5—figure supplement 5
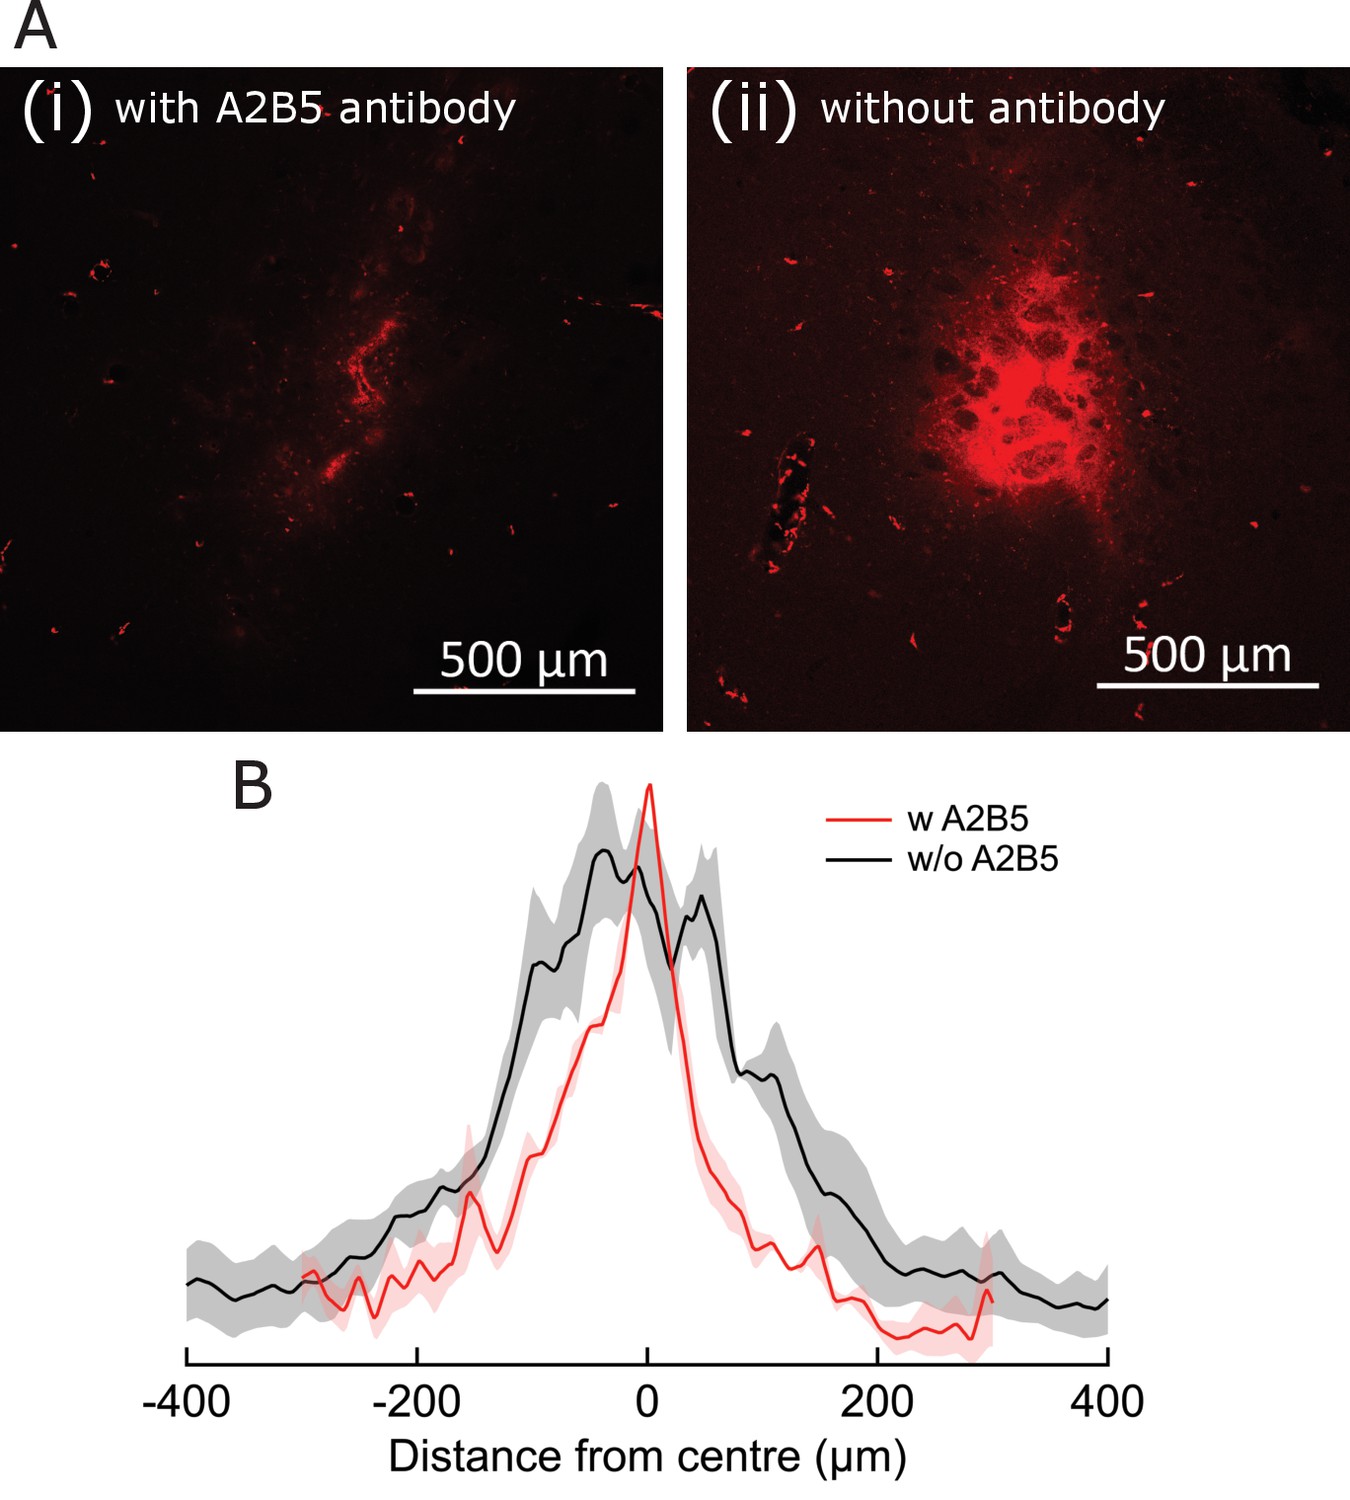
Antibody-assisted targeting confines MNP spread.
(A) Fluorescence micrographs, showing MNP spread around the delivery location, when introduced with (i) and without (ii) A2B5 antibodies. Alexa-647-tagged MNP are visualized as red stains in both cases. Relative fluorescence is not normalized for (i) and (ii). (B) Fluorescence intensity plots comparing spread of MNPs around the delivery location, when introduced with (red) and without (black) A2B5 antibodies. Shading indicates SEM (three brain sections from three animals). Spread FWHM was 106.0 ± 0.8 µm and 251.3 ± 4.8 µm for the with and without A2B5 antibody cases, respectively.
Figure 5—figure supplement 6
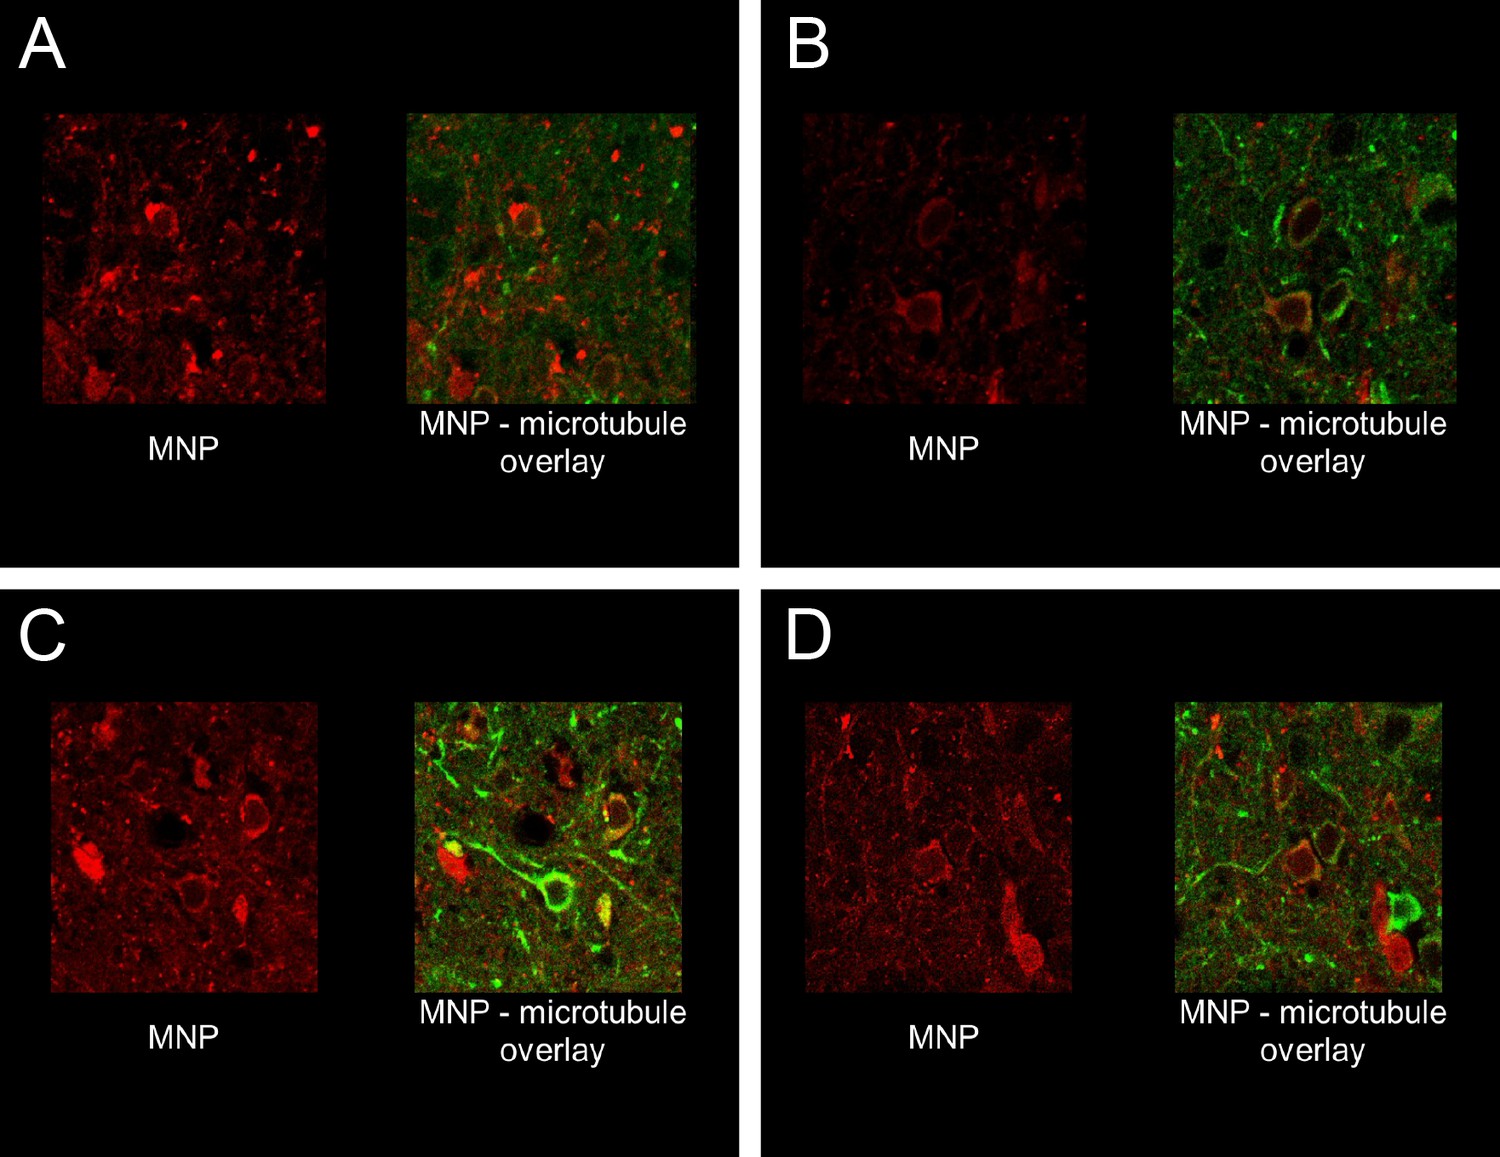
Antibody enhances membrane targeting of MNPs.
Four videos showing MNP labeling on cells, imaged as confocal sections at cellular resolution. In all cases green indicate MAP2 staining in the striatum, while MNP labeling is shown in red. In all cases, MNP was co-delivered with A2B5 antibodies (1:1 particle: antibody molecule ratio). Left panel in each movie shows MNP labeling, while the right panel is an overlay of the same roi, showing MAP2 and MNP channels. Brain sections from two animals have been showcased here. Both animals were sacrificed and perfusion fixed, 24 hr after the MNP delivery procedure. Associated video-animations.
Figure 5—figure supplement 7
Neuronal cells health after multiple AMF exposures.
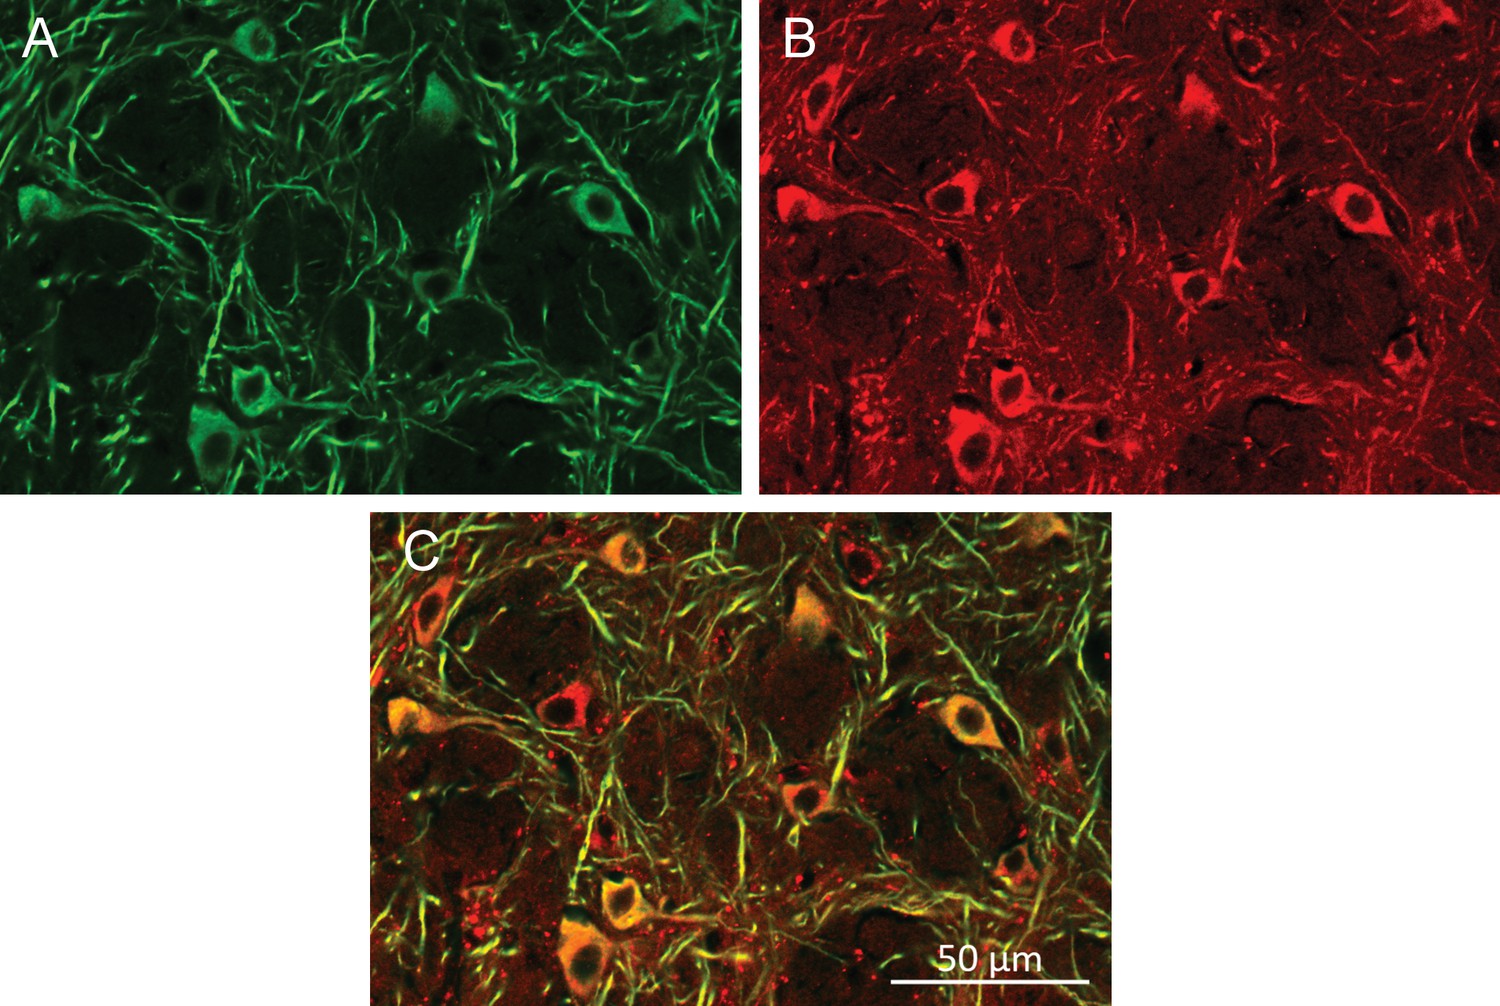
Histology of MNPs decorated neurons after the awake, behaving animal was exposed to 20-times one-minute AMFs applications over the course of three sessions over a 24-hr period. (A) Neurons labeled using anti-MAP2 antibody. (B) MNPs labeled by attached Alexa-647 dye. (C) Overlay of MAP2 (green) and MNPs (red).
Figure 5—video 1
Cellular resolution confocal z-sections of MNP with anti-A2B5 antibodies binding neurons in the brain. (example 1)
Related to Figure 5—figure supplement 6.
Figure 5—video 2
Cellular resolution confocal z-sections of MNP with anti-A2B5 antibodies binding neurons in the brain. (example 2)
Related to Figure 5—figure supplement 6.
Figure 5—video 3
Cellular resolution confocal z-sections of MNP with anti-A2B5 antibodies binding neurons in the brain (example 3).
Related to Figure 5—figure supplement 6 .
Figure 5—video 4
Cellular resolution confocal z-sections of MNP with anti-A2B5 antibodies binding neurons in the brain (example 4).
Related to Figure 5—figure supplement 6 .
Figure 6 with 2 supplements
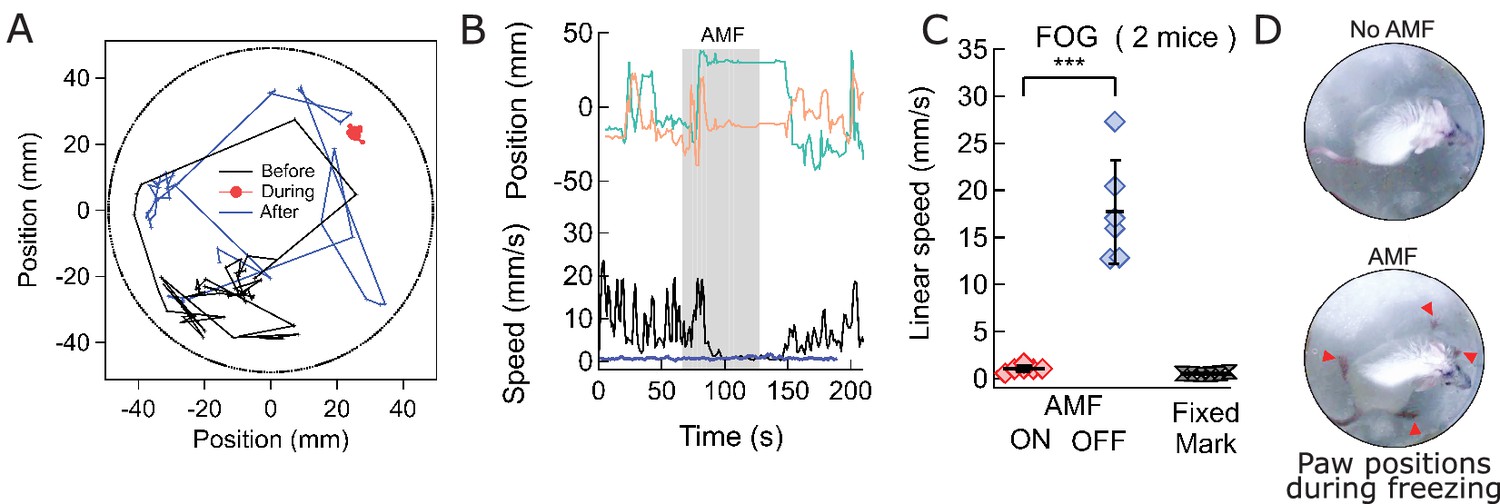
Magnetothermal stimulation near the ridge between ventral and dorsal striatum caused freezing of gait (FOG).
(A) Track of mouse stimulated in deep striatum before (black), during (red), and after (blue) AMF application (each 1 min (Also see Figure 6—figure supplement 2, Videos 4 and 5). (B) X,Y-position and linear speed of same animal tracked at the neck. The speed is compared to a fixed reference point in the sample chamber (blue line; Grey bar indicates the field duration). (C) Scatter plot, showing the response of two mice with AMF. The average speed without AMF (17.7 ± 2.2 mm/s) was significantly faster than that with AMF (1.04 ± 0.13 mm/s) (two mice, six trials; p=0.0006; unpaired T-test; 95% confidence intervals [15.4, 20.1] and [0.90, 1.18] mm/s). The speed during AMF was very similar to the speed of fixed reference marker (0.52 ± 0.11 mm/s). (D) Still picture of same before (top) and during (bottom) field. The red arrowheads indicate paw position during stimulated freezing of gait (FOG). During the AMF, the mouse is able to move its head but not control the limbs which end up stretching farther apart than normal and are unable to follow the head’s motion. In the absence of AMF, ambulation is normal and front paws are positioned to both sides of the head positon and hind paws underneath the animal’s body.
Figure 6—figure supplement 1
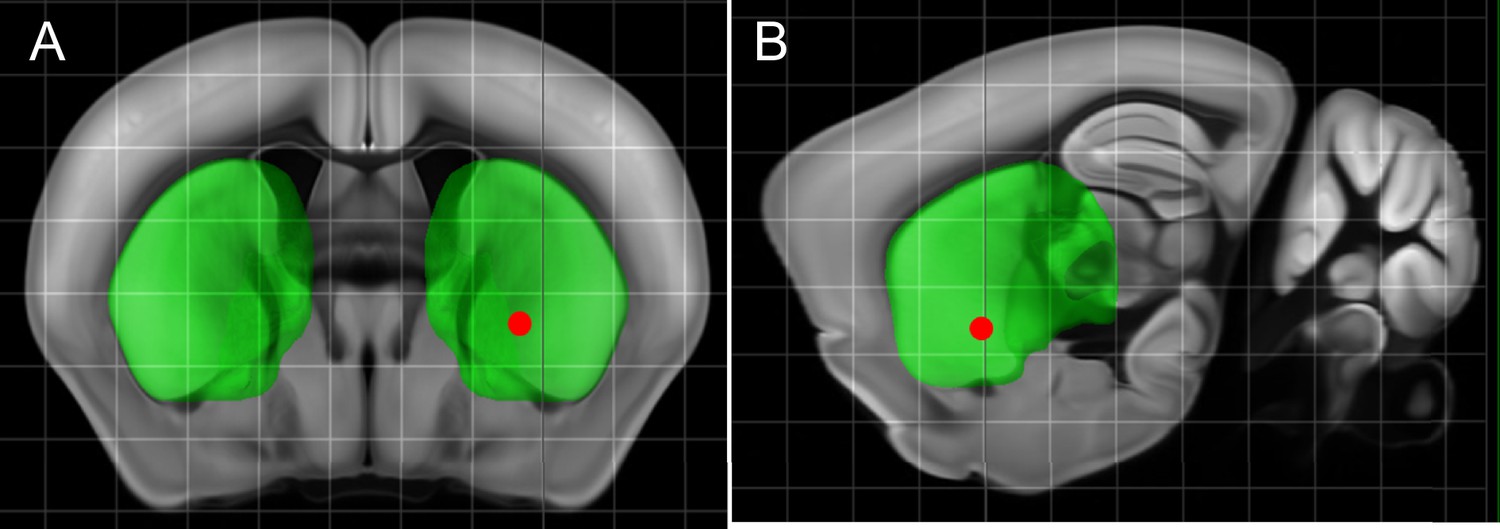
Targeted Region in the Striatum.
(A) Coronal Rostral to caudal section of the deep striatum where virus and then two weeks later MNP were injected near the ridge between Dorsal and Ventral striatum (AP = 0.01, ML = 2.3, DV = 4.1) (Red dot, all in mm). (B) Sagittal view.
Figure 6—figure supplement 2
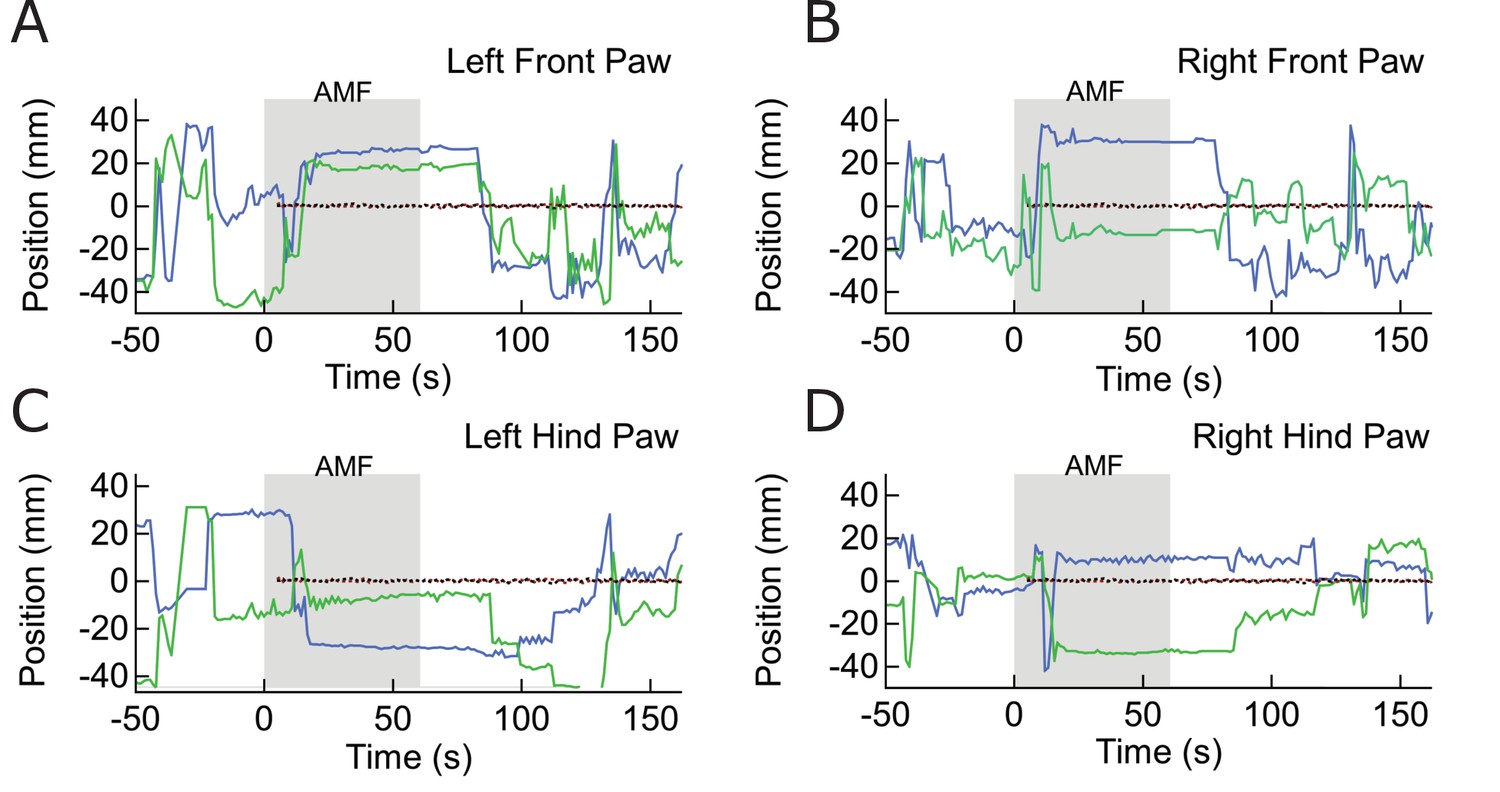
Paw Location Data for Freezing of Gait Response.
(E) - – (H) Paw Location Data for Freezing of Gait Response. Tracking data (X, blue; Y, green) of the four paws, before, during, and after field application. The field is applied from 0 s to 60 s. The red and black traces are the X, Y coordinates of a fixed reference marker.
Videos
Video 1
Ambulatory response generated by secondary motor cortex stimulation.
Unilateral stimulation in the motor cortex evokes running with some delay. The ambulatory response persists during the 60 s long field application and the stimulation can be repeated within minutes. The video shows one continuous experiment with four field, which each lead to a long run, typically 3–4 times around the arena. Video speed is 3x accelerated, MNP injection and application of the field marked within the video frames.
Video 2
Control video of the same mouse without any field application.
https://doi.org/10.7554/eLife.27069.013
Video 3
Control video of a mouse injected with virus but not MNP.
https://doi.org/10.7554/eLife.27069.020
Video 4
Control video of a mouse injected with MNP but no virus.
https://doi.org/10.7554/eLife.27069.021
Video 5
Body-axis turning caused by local stimulation in the dorsal striatum.
The video shows the mouse’s response to field, resulting from stimulation of striatum. The response is repeatable, as shown here in one continuous recoding with two trials. The mouse makes two complete and uninterrupted ipsilateral turns during the first field application and one complete ipsi - and contra - lateral turn each during the second field. The turn radii are not limited by the arena boundary. Video playback speed 3X; injection site and field times are shown as overlays.
Video 6
Freezing of gait caused by local stimulation in the deep striatum.
The mouse was injected 4.1 mm deep in the striatum, near the ridge between Dorsal and Ventral striatum. Upon field application, the limbs and tail of the mouse are rendered motionless, while the rest of the body, including the neck retains normal mobility. Sometime past the stimulation, the mouse regains control over the limbs and moves freely again. Video playback speed in 3X the recording speed. Injection site in the brain and field times are shown as overlays.
Video 7
Control video of Freezing of gait.
https://doi.org/10.7554/eLife.27069.036Additional files
-
Transparent reporting form
- https://doi.org/10.7554/eLife.27069.040
Download links
A two-part list of links to download the article, or parts of the article, in various formats.
Downloads (link to download the article as PDF)
Open citations (links to open the citations from this article in various online reference manager services)
Cite this article (links to download the citations from this article in formats compatible with various reference manager tools)
Magnetothermal genetic deep brain stimulation of motor behaviors in awake, freely moving mice
eLife 6:e27069.
https://doi.org/10.7554/eLife.27069


