RNA polymerase II stalling at pre-mRNA splice sites is enforced by ubiquitination of the catalytic subunit
- University of Edinburgh, Scotland
- Friedrich Miescher Institute for Biomedical Research, Switzerland
- Technische Universität Berlin, Germany
Figures
Figure 1 with 2 supplements
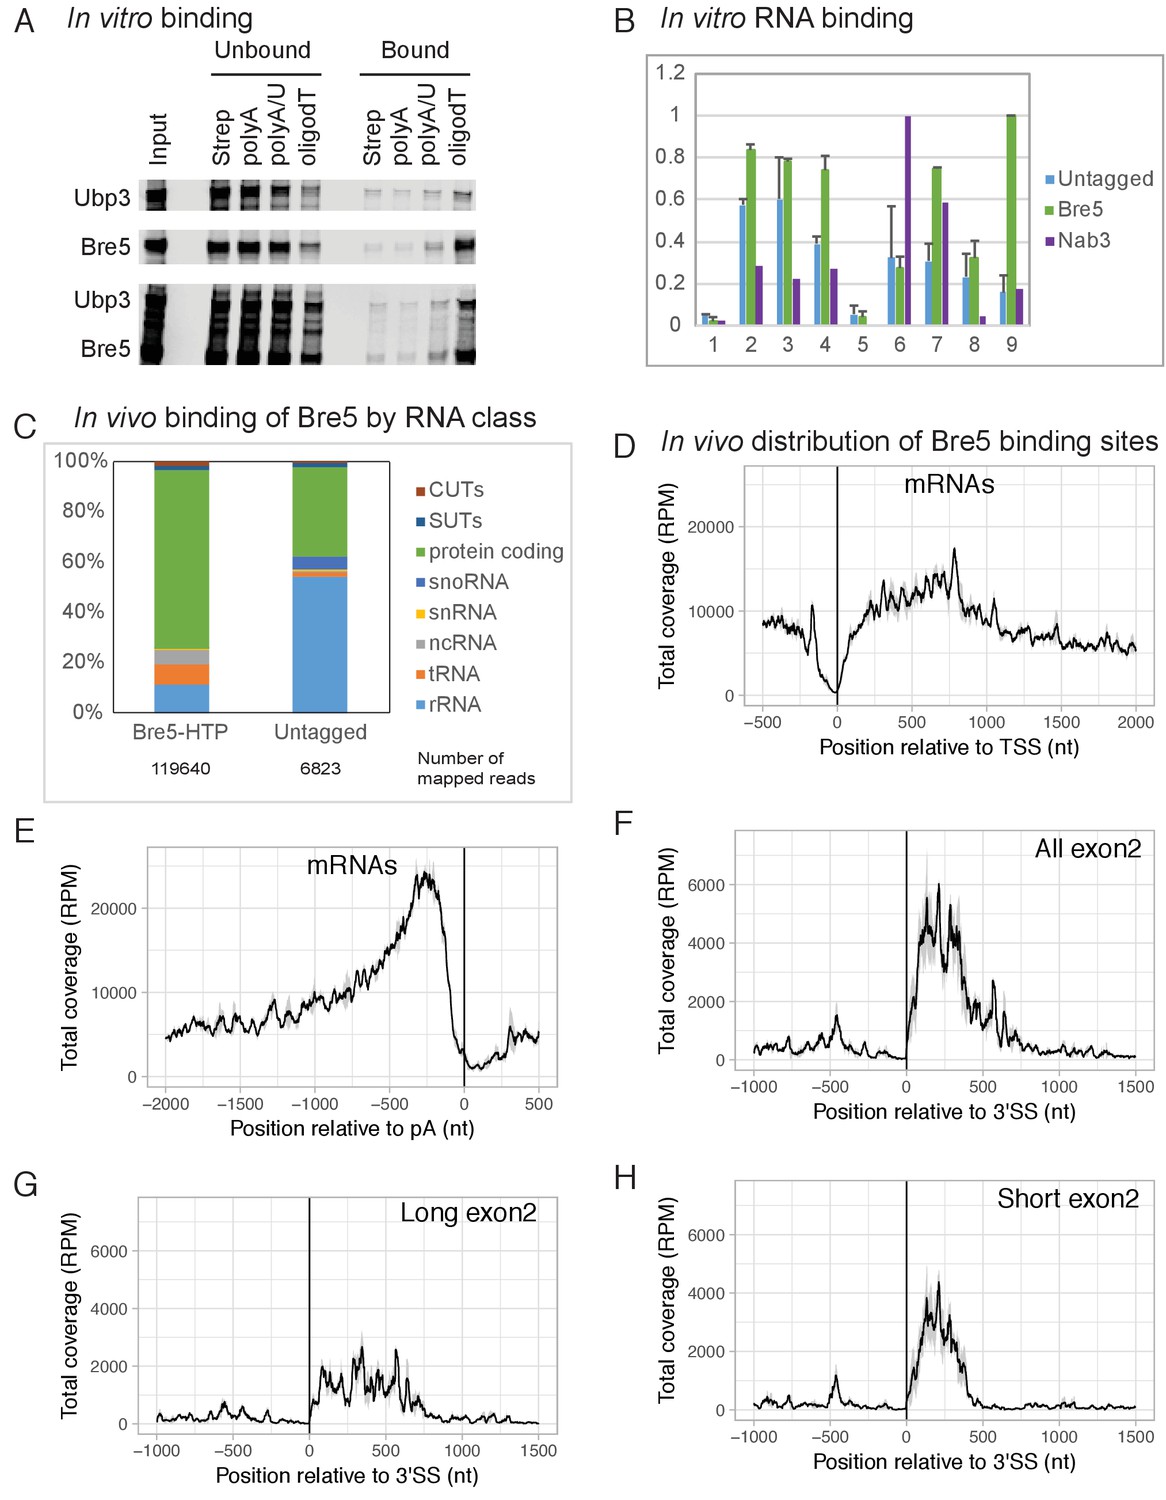
Bre5 binds RNA in vitro and in vivo.
(A) Bre5 and Ubp3 plus Bre5 bind RNA in vitro. Recombinant Bre5 and Ubp3 were expressed in E.coli individually and in combination, and bound to the biotinylated oligonucleotides indicated, which were immobilized on streptavidin agarose columns. (B) Tagged Bre5 and Nab3 were purified from yeast, along with a mock-purified, untagged control, and assayed for binding to labeled RNA oligonucleotides. 1: polyA (AAAAAAAAAAAAAAAAAAAAAAAAA),. 2: polyG (GGGGGGGGGGAGGGGGGGGGGAGGGGG). 3: polyU (UUUUUUUUUUUUUUUUUUUUUUUUU),. 4: polyC (CCCCCCCCCCACCCCCCCCCCACCCCC),. 5: polyA/U (AUAUAUAUAUAUAUAUAUAUAUAU),. 6: Nab3-A (AAAAAUCUUAAAUCUUAAAUCUUAAAAA),. 7 Nab3-U (UUUUUUCUUUUUUCUUUUUUCUUUUUUU),. 8: Bre5-A (AAAAAUUUGAAAUUUGAAAUUUGAAAAA),. 9: Bre5-U (UUUUUUUUGUUUUUUGUUUUUUGUUUUU). The y axis represents the signal quantified from the bound oligos (arbitrary units), the error bars are the standard deviation from three biological replicates. See also Figure 1—figure supplement 1A–C. (C) Distribution of RNA sequences recovered with Bre5-HTP and the untagged control across different RNA classes. 15-fold fewer reads were recovered with the control (Supplementary file 1, Table S2) and numbers of mapped reads are indicated below the bar graphs. (D) Metagene analysis of the distribution of RNA sequences recovered with Bre5 across protein coding transcripts (5171 features) (Xu et al., 2009), in reads per million (RPM). Sequences were aligned relative to the transcription start site (TSS). The average of 2 Bre5 CRAC replicates is shown. The standard deviation appears as a grey shadow. (E) As D, but sequences were aligned relative to the poly(A) site (pA). (F) Metagene analysis of the distribution of RNA sequences recovered with Bre5 across intron containing, protein coding transcripts (288 features), in RPM. Sequences were aligned relative to the 3’ splice site (3’SS). The average of 2 Bre5 CRAC replicates is shown. The standard deviation appears as a grey shadow. (G) As F, but data were filtered to show only genes with long exon2 regions (above 600 nt, 145 features). (H) As F, but data were filtered to show only genes with short exon2 regions (below 600 nt, 143 features).
-
Figure 1—source data 1
Source data for Figure 1B.
- https://doi.org/10.7554/eLife.27082.005
Figure 1—figure supplement 1

Bre5 binding to RNA is independent of Ubp3 or the ubiquitin ligase Rsp5.
(A) Related to Figure 1A. Labeled oligonucleotides were incubated with purified Bre5-HTP, Nab3-HTP or a mock-purified untagged control. Following washing, oligos were eluted and recovery was analyzed by polyacrylamide gel separation and autoradiography. Oligonucleotides used were. 1: polyA (AAAAAAAAAAAAAAAAAAAAAAAAA),. 2: polyG (GGGGGGGGGGAGGGGGGGGGGAGGGGG). 3: polyU (UUUUUUUUUUUUUUUUUUUUUUUUU),. 4: polyC (CCCCCCCCCCACCCCCCCCCCACCCCC),. 5: polyA/U (AUAUAUAUAUAUAUAUAUAUAUAU),. 6: Nab3-A (AAAAAUCUUAAAUCUUAAAUCUUAAAAA),. 7 Nab3-U (UUUUUUCUUUUUUCUUUUUUCUUUUUUU),. 8: Bre5-A (AAAAAUUUGAAAUUUGAAAUUUGAAAAA),. 9: Bre5-U (UUUUUUUUGUUUUUUGUUUUUUGUUUUU). (B) Preferred Bre5 binding motif derived from Bre5-HTP bound sequences in CRAC, generated using the MEME suite. (C) SDS = PAGE analysis showing purification of Bre5-HTP (lanes 2, 5 and 7) or Nab3 (lane 3) used for the RNA-binding assay shown in panel A. (D) Bre5 binding across protein-coding transcripts relative to the TSS in wild type cells (grey line) and cells lacking Ubp3 (green lines). (E) Bre5 binding across protein-coding transcripts relative to the pAS in wild type cells (grey line) and cells lacking Ubp3 (green lines). (F) Bre5 binding across protein-coding transcripts relative to the 3’SS in wild type cells (grey line) and cells lacking Ubp3 (green lines). (G) Bre5 binding across protein-coding transcripts relative to the TSS in wild type cells (blue line) and cells carrying a temperature sensitive allele of Rsp5 (green line) at non-permissive temperature. (H) Bre5 binding across protein-coding transcripts relative to the pAS in wild type cells (blue line) and cells carrying a temperature sensitive allele of Rsp5 (green line) at non-permissive temperature. (I) Bre5 binding across protein-coding transcripts relative to the TSS in wild type cells (blue line) and cells carrying a temperature sensitive allele of Rsp5 (green line) at non-permissive temperature.
Figure 1—figure supplement 2

Distribution of Bre5 across individual genes.
(A) Distribution of Bre5 across individual mRNAs in reads per million. Transcripts are aligned to the TSS (left) and to the pA site (middle). Intron containing mRNAs are aligned to the 3’SS (right). Distances are indicated in nucleotides. The corresponding total coverages are shown in Figure 1D–F. The average of 2 Bre5 CRAC replicates is shown. (B) Bre5 coverage, in reads per million, for selected individual protein-coding genes. Transcription units are represented above the plots with thicker boxes correspond to coding sequences. The average of 2 Bre5 CRAC replicates is shown.
Figure 2 with 1 supplement
Analysis of ribosys reporter induction.
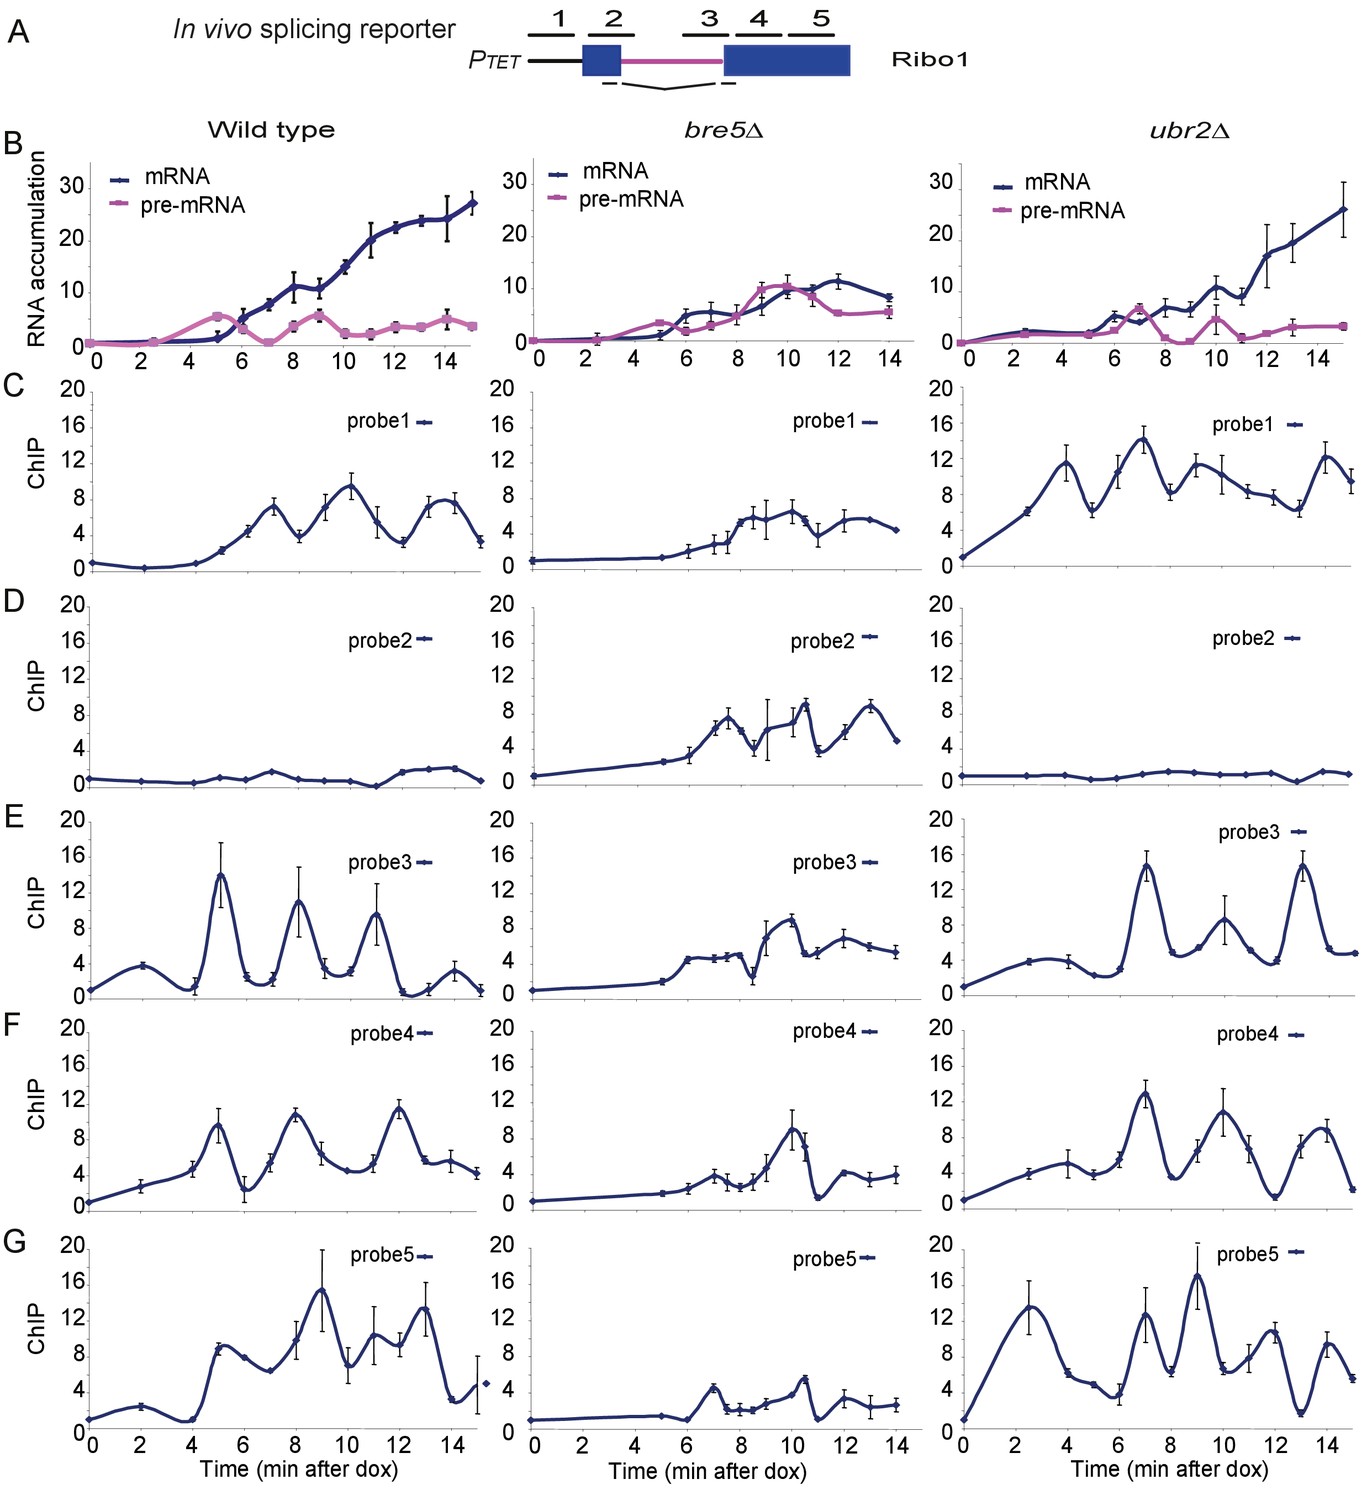
(A) Diagram of theRibo1 gene. Exons are represented by rectangles, and the intron by a line with sequences at the ends. The reporter genes are based on previously described ACT1-PGK1 constructs (Alexander et al., 2010b; Hilleren and Parker, 2003) expressed under control of a tetO7-CYC1-UAS promoter (Bellí et al., 1998). The lines above indicate amplicons analyzed in ChIP analyses: 1, 2, 3, 4, and 5 correspond to the promoter, the 5′SS, the 3′SS, the 5′ end of exon 2 and the 3′ end of exon 2, respectively. The lines below indicate the primers used in RT-qPCR to amplify the spliced RNA products. Unspliced pre-rRNA was detected using primer pair 3 over the 3’ SS. (B) RT-qPCR analysis of the accumulation of pre-mRNA and mRNA species during a time course (min) following doxycyclin addition (T0). Analyses were performed on the wild-type, bre5∆ and ubr2∆ strains as indicated. (C, D, E, F, G) ChIP analyses to detect RNAPII at the promoter (probe 1), the 5′SS (probe 2), the 3′SS (probe 3), the 5′ end of exon 2 (probe 4) and the 3′ end of exon 2 (probe 5). Data are presented as percentage of input relative to the uninduced level at T0. Cultures were as for B. All analyses were performed in biological triplicates. The qualitative results were consistent between replicates, however, slight differences in induction kinetics makes it difficult to combine these for statistical analyses. The graphs therefore show single experiments with technical replicates.
-
Figure 2—source data 1
Source data for Figure 2.
- https://doi.org/10.7554/eLife.27082.013
-
Figure 2—source data 2
Replicates source data.
- https://doi.org/10.7554/eLife.27082.014
Figure 2—figure supplement 1
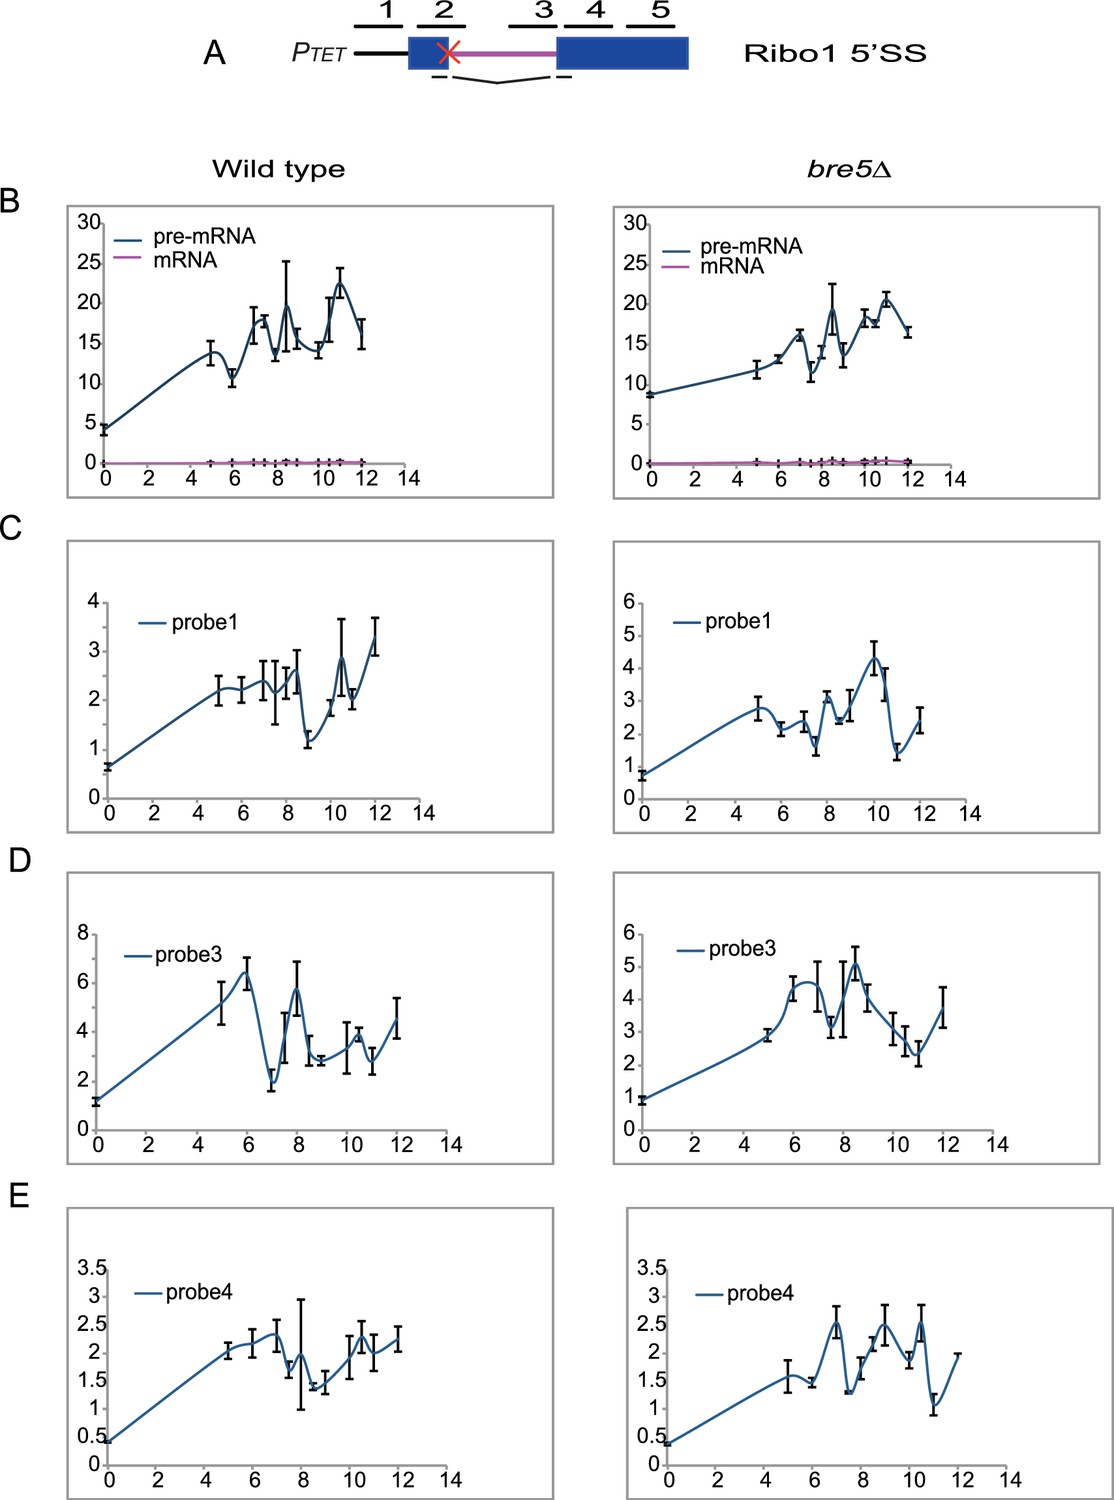
Effects of Bre5 loss on the Ribosys reporter is splicing dependent.
(A) Diagram of the Ribo1 5’SS gene. Exons are represented by rectangles, and the intron by a line with sequences at the ends. The red cross indicates a mutation at the 5’SS which abolishes splicing. The lines above indicate amplicons analyzed in RT-qPCR or ChIP analyses: 1, 2, 3, 4, and 5 correspond to the promoter, the 5′SS, the 3′SS, the 5′ end of exon 2 and the 3′ end of exon 2, respectively. (B) RT-qPCR analysis of accumulation of pre-mRNA and mRNA species showing the increase compared to time of doxycyclin addition (T0) in the wild-type strain (panel on the left) and in a strain lacking Bre5 (right panel). (C, D, E, F, G) ChIP analysis (presented as percentage of input relative to uninduced level at T0) to detect RNAPII at the promoter, the 5′SS, the 3′SS, the 5′ end of exon 2 and the 3′ end of exon 2, respectively, with the same cultures as above.
-
Figure 2—figure supplement 1—source data 1
ChIP1 source data.
- https://doi.org/10.7554/eLife.27082.008
-
Figure 2—figure supplement 1—source data 2
ChIP2 source data.
- https://doi.org/10.7554/eLife.27082.009
-
Figure 2—figure supplement 1—source data 3
ChIP3 source data.
- https://doi.org/10.7554/eLife.27082.010
-
Figure 2—figure supplement 1—source data 4
RT1 source data.
- https://doi.org/10.7554/eLife.27082.011
-
Figure 2—figure supplement 1—source data 5
RT2 and RT3 source data.
- https://doi.org/10.7554/eLife.27082.012
Figure 3
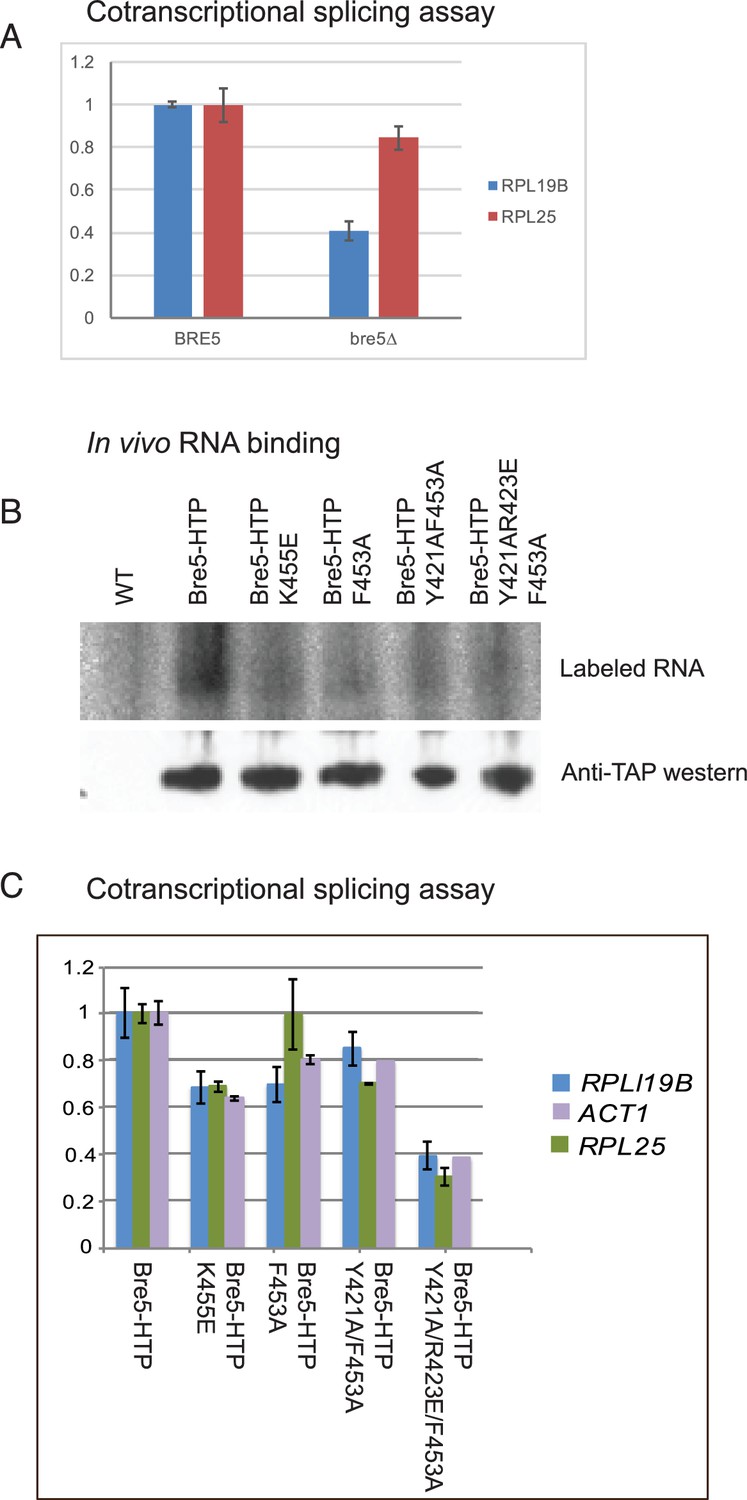
Strains lacking functional Bre5 show decreased co-transcriptional splicing.
(A) RT-qPCR analysis of endogenous, polyadenylated and intron-containing transcripts using primer pairs over the 3’ splice site expressed relative to non-intron-containing PGI1 mRNA, in a wild type strain and in a strain lacking Bre5. The histogram shows the mean of three replicates with standard error, with the value in the BRE5 strain set to 1. The reduced level of unspliced poly(A)+ shows increased efficiency of cotranscriptional splicing associated with RNAPII that has reached the 3’ end of the transcription unit. (B) Analysis of in-vivo RNA- binding activity of Bre5 with point mutants in the RRM. The top panel shows the recovery of radio-labelled RNA that was bound to Bre5 following in vivo crosslinking and multi-step, denaturing purification and separation by SDS-PAGE as described for CRAC analyses. The lower panel shows a western blot using an anti-TAP antibody against the tagged Bre5. (C) RT-qPCR analysis of endogenous unspliced, polyadenylated transcripts using primer pairs over the 3’ splice site expressed relative to non-intron-containing PGI1 mRNA. The histogram in a wild type HTP-tagged Bre5 strain and in strains carrying the point mutations in the RRM. The histogram shows the mean of three experiments with standard error, with the value in the strain expressing wild type Bre5 set to 1. The reduced level of unspliced, poly(A)+ RNA in the mutant strains is interpreted as showing a requirement for a functional RRM in Bre5.
-
Figure 3—source data 1
Source data for Figure 3A.
- https://doi.org/10.7554/eLife.27082.016
-
Figure 3—source data 2
Source data for Figure 3C.
- https://doi.org/10.7554/eLife.27082.017
Figure 4 with 1 supplement
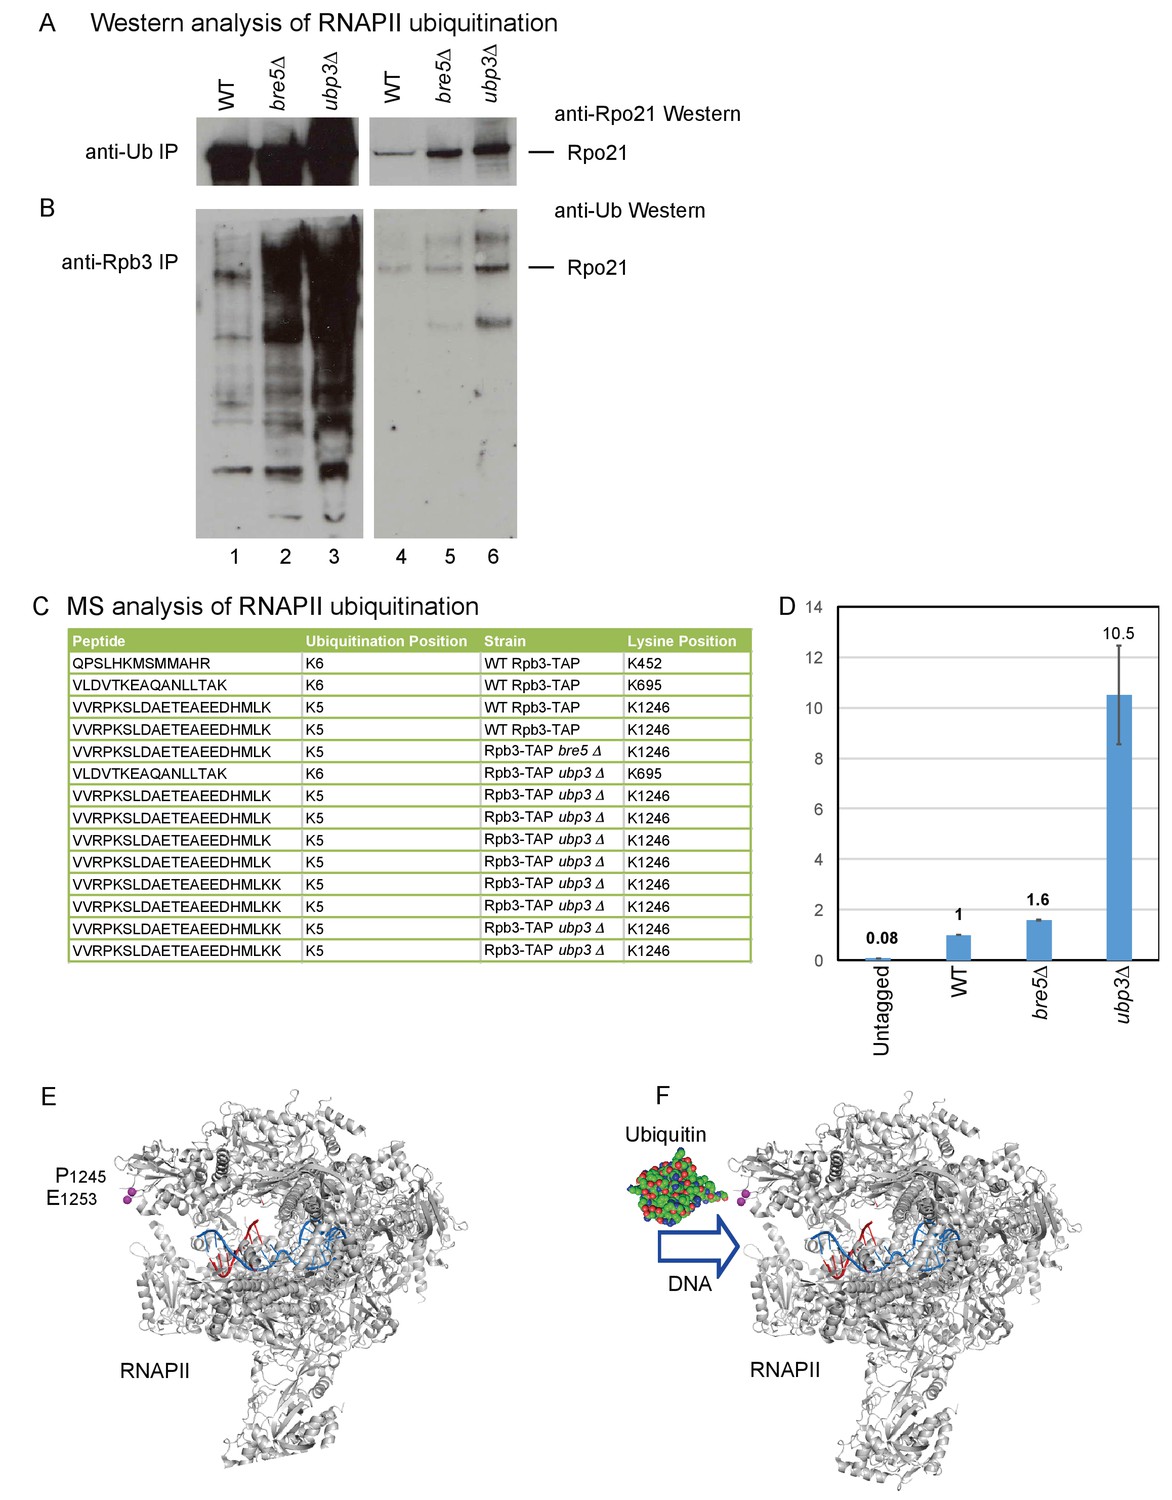
Identification of ubiquitination sites in RNAPII.
(A) Analysis of Rpo21 immunoprecipitated from wild type cells, cells lacking Bre5 and cells lacking Ubp3 using an anti-ubiquitin antibody followed by Western blotting using an antibody against Rpo21. (B) Analysis of Rpo21 immunoprecipitated from wild type cells, cells lacking Bre5 and cells lacking Ubp3 using an anti-Rpb3 antibody followed by western blotting using an anti-ubiquitin antibody. (C) Table showing the ubiquitinated Rpo21 peptides from wild type cells, cells lacking Bre5 and cells lacking Ubp3, identified by mass spectrometry. (D) Quantitation of modified and unmodified peptides derived from the region surrounding Rpo21 K1246. (D) PRM-based quantitation of peptide harboring Rpo21 K1246-Ub. The sum of XICs (extracted ion chromatogram) corresponding to the four most intense ions was used to calculate the total area under curve and taken as a value representing recovery of Rpo21 K1246-Ub. The abundance of Rpo21 K1246-Ub in the wild type sample was used for normalization. Ratios of Rpo21 K1246-Ub identified in untagged, bre5Δ and ubp3Δ strains are shown relative to the wild type. (E) The structure of RNAPII was taken from PDB: 4bbs (Sainsbury et al., 2013) and kindly prepared by Altanta Cook (Edinburgh University). Protein residues are shown in gray, with the single stranded DNA template in red and the RNA transcript in blue. The ubiquitation site in Rpo21 at K1246 is not visible in the crystal structure, but the neighboring sites at P1245 and E1253 are shown in magenta. (F) As panel D but with ubiquitin drawn in the approximate position of the crosslink and at a similar scale.
-
Figure 4—source data 1
Source data for Figure 4D.
- https://doi.org/10.7554/eLife.27082.020
Figure 4—figure supplement 1
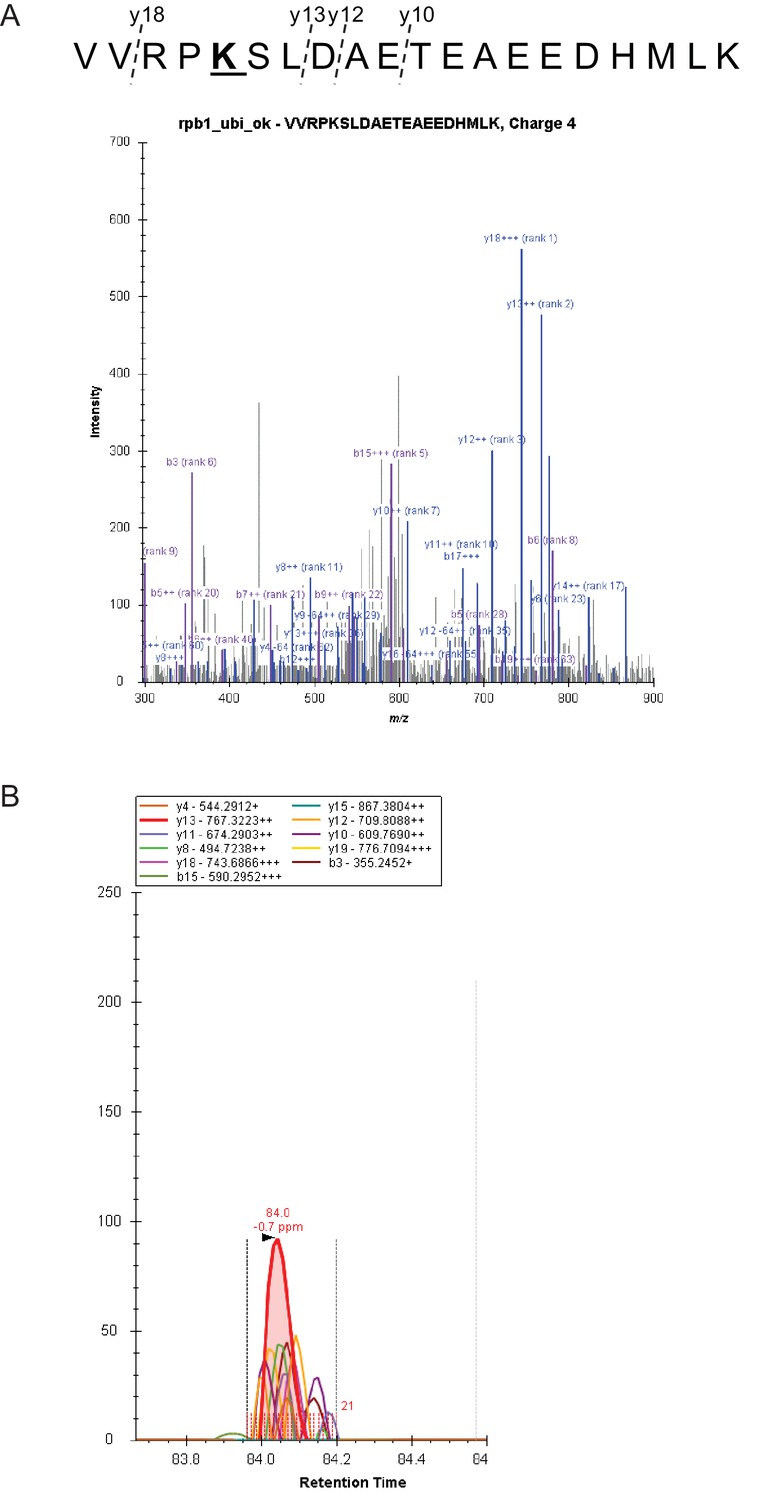
Quantitative MS analyses.
(A) Fragmentation and spectral library match of peptide harboring Rpo21 K1246 modification. (B) Example of extracted ion chromatograms (XIC) of y18-y10 ions used for quantification of the modified peptide. Area under curve of all co-eluting transitions within mass error of 4ppm was considered.
Figure 5 with 1 supplement

Transcriptome wide distribution of ubiquitinated Rpo21 by m-CRAC.
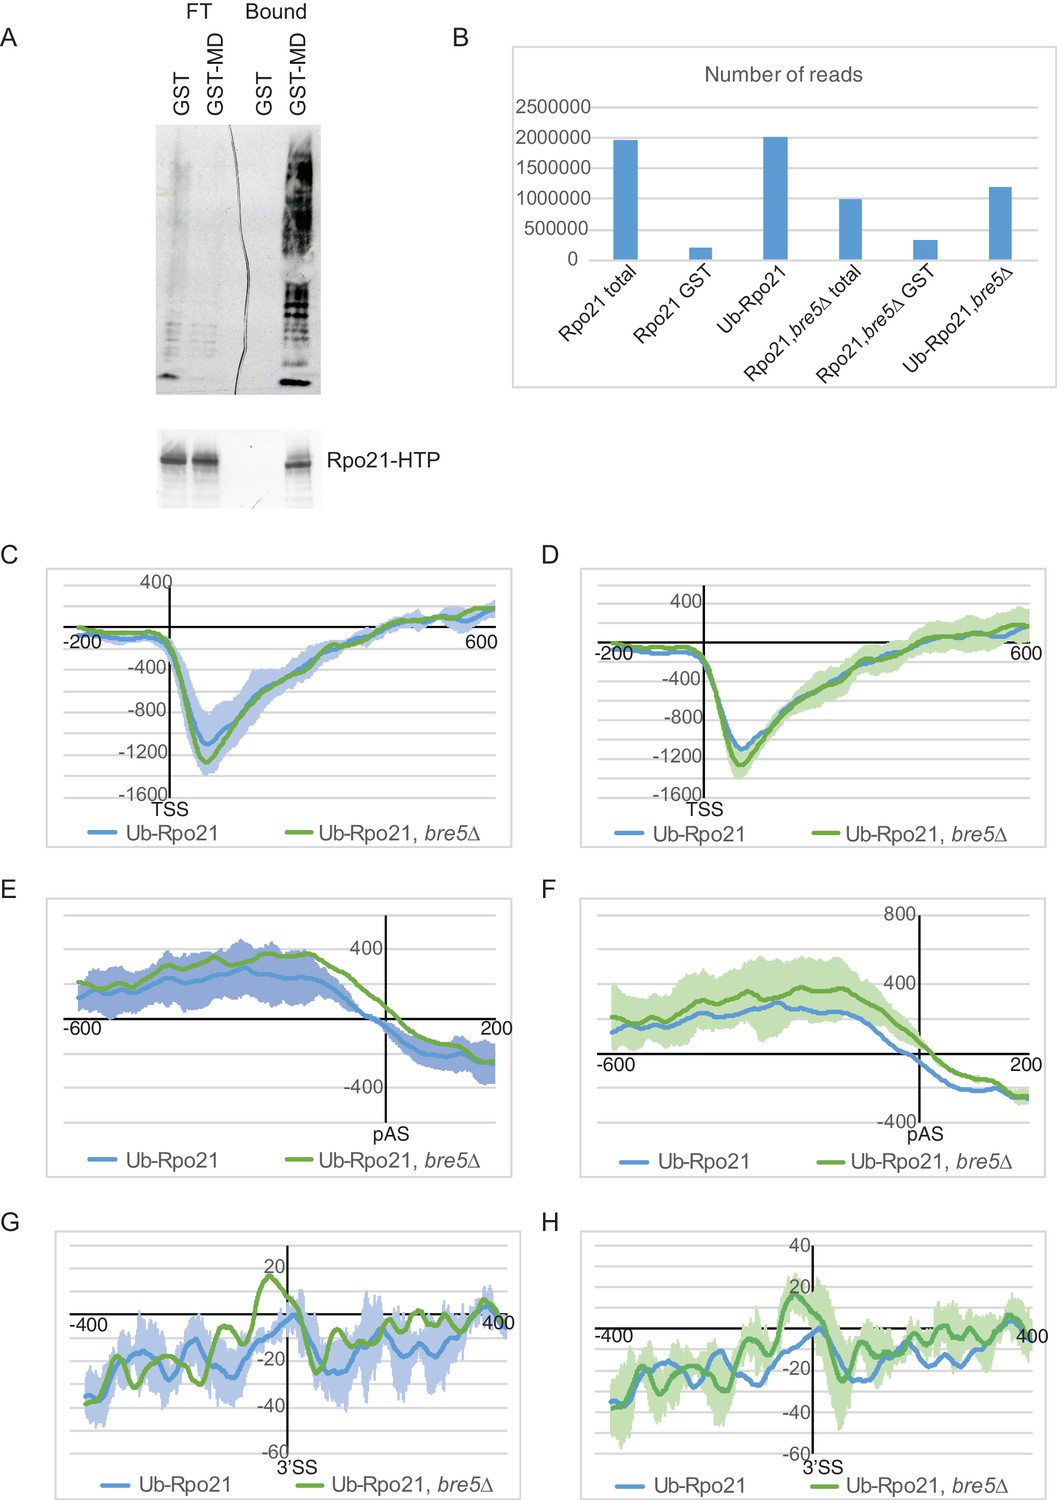
(A) Outline of the m-CRAC procedure. Actively growing cells expressing Rpo21-HTP (His6 -TEV cleavage site – 2 copies of the Z domain of protein A) were UV-crosslinked at 254 nm for 1 min. Following lysis, Rpo21-HTP was affinity purified on an IgG column and released by TEV cleavage. Ubiquinated proteins were enriched on a GST-MultiDsk column (GST-MD) or mock enriched over GST alone. Associated RNA was partially denatured by RNase treatment, followed by protein denaturation by addition of guanidinium HCl to 4M. Denatured Rpo-21-His was bound to a nickel column in the same buffer. Following washing, bound RNAs were 5’ labeled with [32P], and linkers were added to both ends. Proteins were eluted with imidazole and separated by SDS-PAGE. Rpo21-RNA complexes were localized by autoradiography, excised from the gel and digested with proteinase K. RNAs released by this treatment were amplified by RT-PCR and identified by illumina sequencing. (B) Autoradiograph of labeled RNA bound to Rpo21 and purified by mCRAC. The top panel shows Rpo21 from wild type cells and the bottom panel from cells lacking Bre5. (C) Bar chart showing ubiquitinated Rpo21 binding to different RNA classes. (D) Metagene analysis of the distribution of ubiquitinated Rpo21 enrichment relative to total Rpo21, across protein-coding transcripts (5171 features) (Xu et al., 2009) aligned to the TSS in wild type cells (blue line) and cells lacking Bre5 (green line). The x axis shows the relative position in nt. The average of 2 m-CRAC replicates is shown, the standard deviation is shown in Figure 5—figure supplement 1. (E) As D, but transcripts were aligned to the pA sites. (F) Metagene analysis of the distribution of ubiquitinated Rpo21 enrichment relative to total Rpo21, across intron-containing transcripts (288 features) relative to the 3’SS in wild type cells (blue line) and cells lacking Bre5 (green line). The x axis shows the relative position in nt. The average of 2 m-CRAC replicates is shown. The standard deviation is shown in Figure 4—figure supplement 1.
Figure 5—figure supplement 1
Analysis of transcriptome wide distribution of ubiquitinated Rpo21 by mCRAC.
(A) Western blot analysis of protein purified from Rpo21-HTP cell extracts using the MultiDsk column (lane 4) or GST alone (lane 3). 6% of the flow through from these columns was loaded in lanes 1 and 2. The top panel shows a western with an anti-ubiquitin antibody, the bottom one with an anti-TAP antibody. (B) Histogram showing the number of unique reads recovered by illumina sequencing. (C) As Figure 5D showing the standard error from the triplicate experiments for the wild type strain. (D) As Figure 5D showing the standard error from the triplicate experiments for the strain deleted for Bre5. (E) As Figure 5E but showing the standard error from the triplicate experiments for the wild type strain. (F) As Figure 5E but showing the standard error from the triplicate experiments for the strain deleted for Bre5. (G) As Figure 5F but showing the standard error from the triplicate experiments for the wild type strain. (H) As Figure 5F but showing the standard error from the triplicate experiments for the strain deleted for Bre5.
Figure 6 with 1 supplement
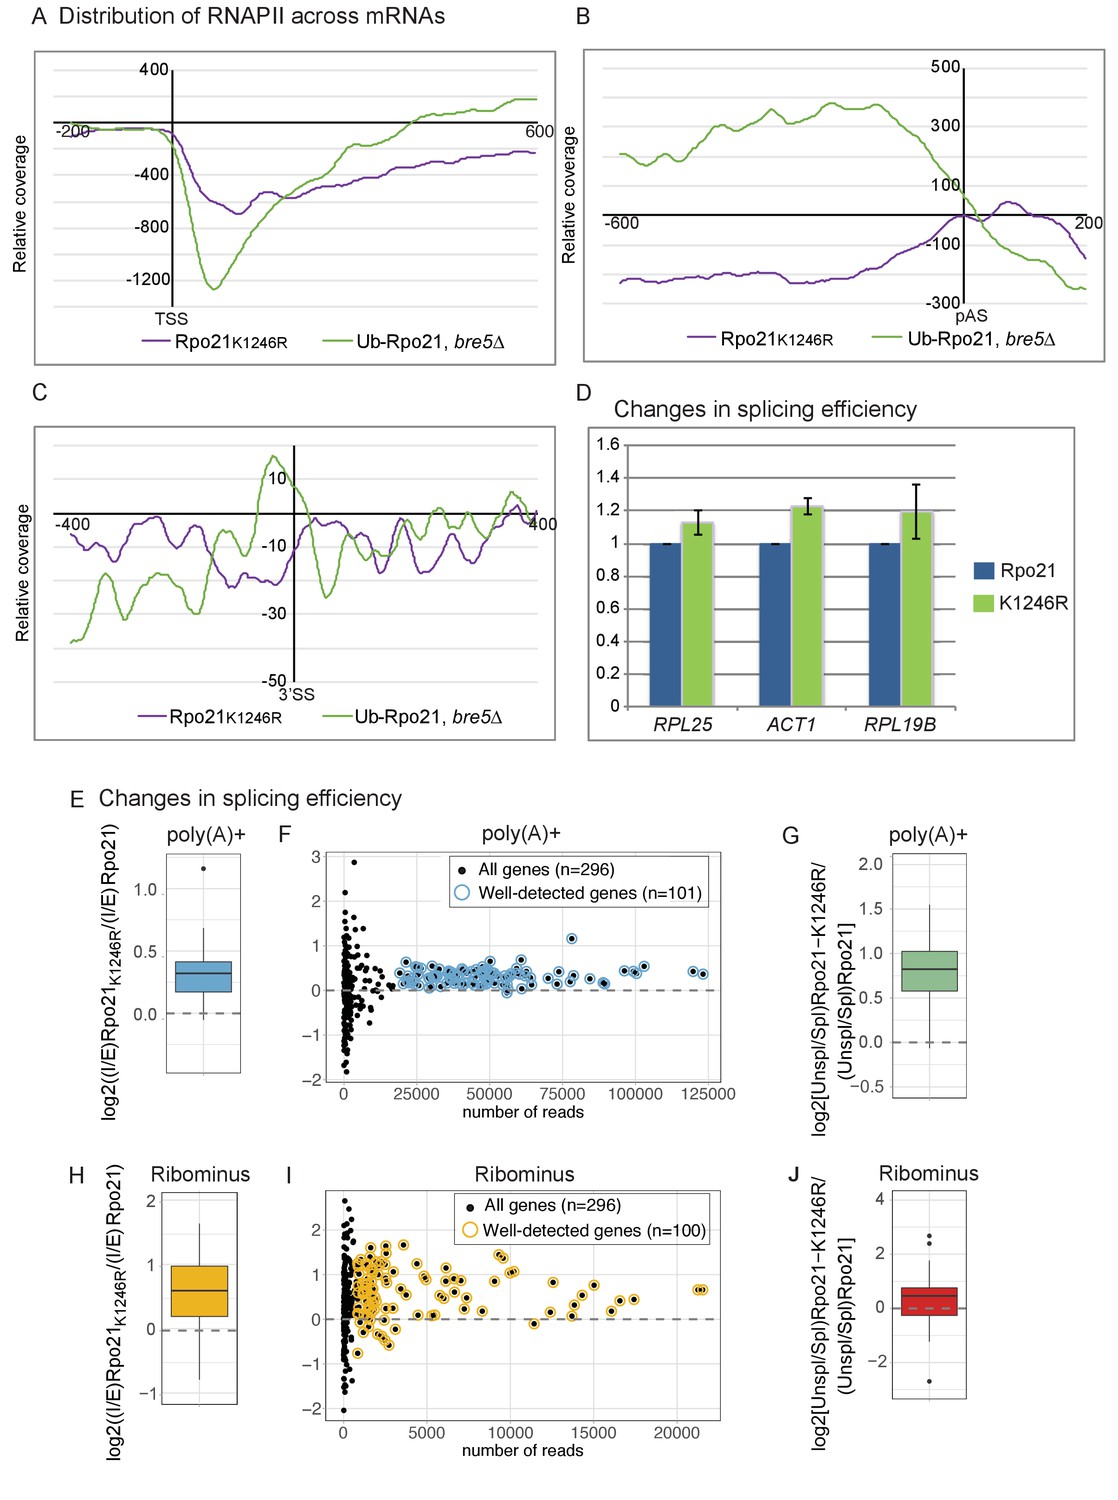
Loss of RNAPII ubiquitation is associated with reduced pausing and co-transcriptional splicing.
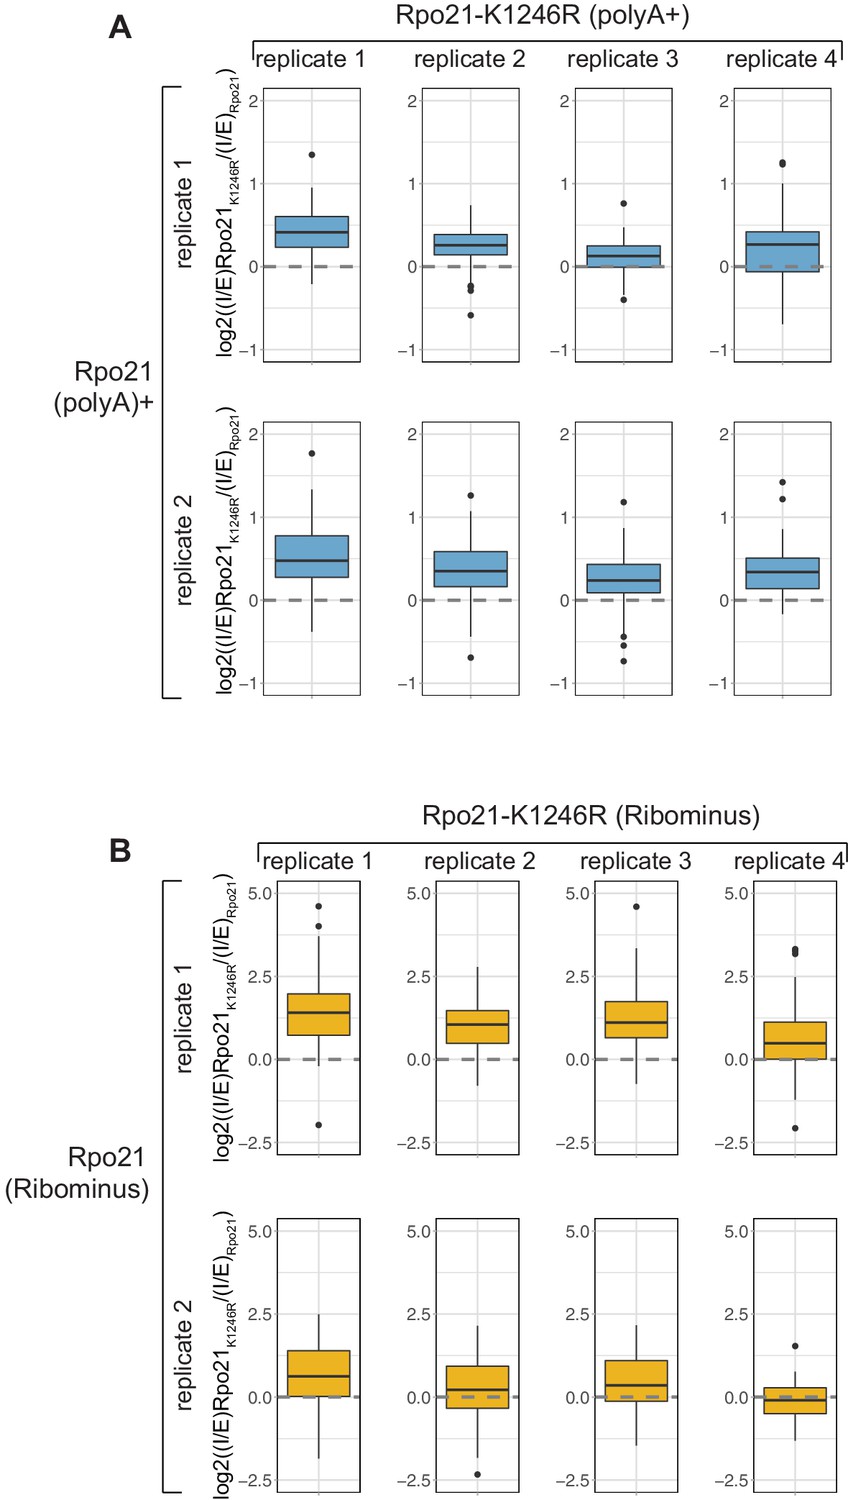
(A) Metagene analysis of the distribution of Rpo21K1246R relative to wild-type Rpo21 (purple line) and ubiquitinated Rpo21 relative to total Rpo21 in strains lacking Bre5 (green line) across protein-coding transcripts relative to the TSS. The x axis shows the relative position in nt. The average of 2 replicates is shown. (B) As A, but transcripts were aligned to the pA sites. (C) Metagene analysis of the distribution of Rpo21K1246R relative to wild-type Rpo21 (purple line) and ubiquitinated Rpo21 relative to total Rpo21 in strains lacking Bre5 (green line) across intron-containing transcripts relative to the 3’ SS. The x axis shows the relative position in nt. The average of 2 replicates is shown. (D) Quantitation of selected intron-containing transcripts by qPCR on oligo(dT) primed cDNAs, in a strain expressing Rpo21-HTP (blue bars) or Rpo21K1246R-HTP (green bars). The histogram shows the mean of three replicates with standard error. (E) Reads mapping to introns and exons were quantified in RNA-seq libraries prepared from poly(A)+ RNA and the average intron/exon ratio (I/E) was calculated. The boxplot shows the distribution of log2((I/E)Rpo21-K1246R/(I/E)Rpo21) values for the top represented, intron-containing mRNAs (n = 101). The data indicate higher intron recovery in poly(A)+ RNAs in the Rpo21-K1246R mutant. (F) For each intron-containing gene (n = 296), the log2((I/E)Rpo21-K1246R/(I/E)Rpo21) from poly(A)+ reads is plotted against the number of reads mapped to this gene. Almost all genes with enough coverage to be confidently analyzed (well-detected genes). (have a positive ratio, showing that cotranscriptional splicing efficiency was reduced in the Rpo21-K1246R strain compared to wild-type. Confidently detected genes (n = 101) used for Figure 6E and Figure 6—figure supplement 1A are highlighted. (G) The relative recovery of unspliced pre-mRNA versus spliced mRNA (Unspl/Spl) was expressed as the ratio of reads spanning (exon-intron plus intron-exon) to exon–exon junctions in the poly(A)+ RNA-seq libraries. For most mRNAs with sufficient coverage at the splice junctions (n = 85), the log2 ratio of (Unsp/Spl) of Rpo21-K1246R to Rpo21 was positive, indicating increased recovery of unspliced, polyadenylated pre-mRNAs. (H) As panel E, but using RNA depleted for rRNA (Ribominus) with confidently detected genes (n = 100). (I) As panel F, but using RNA depleted for rRNA (Ribominus). Confidently detected genes (n = 100) used for Figure 6G and Figure 6—figure supplement 1B are highlighted. (J) As panel (G). Relative recovery of unspliced versus spliced RNA (Unspl/Spl) was expressed as the ratio of reads spanning (exon–intron plus intron–exon) to exon–exon junctions recovered in total RNA depleted for rRNAs (n = 49).
-
Figure 6—source data 1
Source data for Figure 6D.
- https://doi.org/10.7554/eLife.27082.025
Figure 6—figure supplement 1
Strains carrying a point mutation in the ubiquitinated LK1246 residue show loss of pausing at the 3’ splice site and a reduction in co-transcriptional splicing.
(A) As Figure 6F but showing comparisons of individual replicates instead of using the average I/E. In all cases, the log2((I/E)Rpo21-K1246R/(I/E)Rpo21) values for the top represented intron-containing mRNAs (n = 101) is positive, indicating a relative higher recovery of unspliced mRNAs in the Rpo21K1246R mutant compared to the wild type. (B) As Figure 6I but showing comparisons of individual replicates instead of using the average (n = 100).
Figure 7

Model for splicing-linked RNAPII ubiquitination and de-ubiquitination.
(A) Transcription on intron-containing gene. Exon 1 (E1), intron (I), exon2 (E2) and the C-terminal domain (CTD) of RNA polymerase II (RNAPII) are indicated. (B) Assembly of the spliceosome provokes RNAPII ubiquinitation and slowed elongation. (C) Bre5-Ubp3 is recruited to the nascent transcripts following splicing. (D) De-ubiquinitation by Ubp3 allows elongation to resume.
Additional files
-
Supplementary file 1
The file contains Supplementary Tables S1-S4.
- https://doi.org/10.7554/eLife.27082.027
-
Transparent reporting form
- https://doi.org/10.7554/eLife.27082.028
Download links
A two-part list of links to download the article, or parts of the article, in various formats.
Downloads (link to download the article as PDF)
Open citations (links to open the citations from this article in various online reference manager services)
Cite this article (links to download the citations from this article in formats compatible with various reference manager tools)
RNA polymerase II stalling at pre-mRNA splice sites is enforced by ubiquitination of the catalytic subunit
eLife 6:e27082.
https://doi.org/10.7554/eLife.27082


