The physical dimensions of amyloid aggregates control their infective potential as prion particles
- University of Kent, United Kingdom
Figures
Figure 1

The prion lifecycle.
The de novo formation of a prion involves reversible protein misfolding and consequential formation of amyloid conformers, which can assemble into small oligomeric species. Once this assembly reaches a critical size (i.e. the nucleus size), further polymerisation is favoured and fibrils grow by addition of protein monomer to their ends. This process can be accelerated by fibril fragmentation which increases the number of fibril ends to which monomer can be added. In the yeast Saccharomyces cerevisiae this is accomplished by the molecular chaperone Hsp104 and its co-chaperones and is essential to ensure a suitable number of prion particles (propagons) of the appropriate size is generated, ensuring their transmission during cell division. The process of fragmenting and transmitting prion particles is usually referred to as propagation.
Figure 2
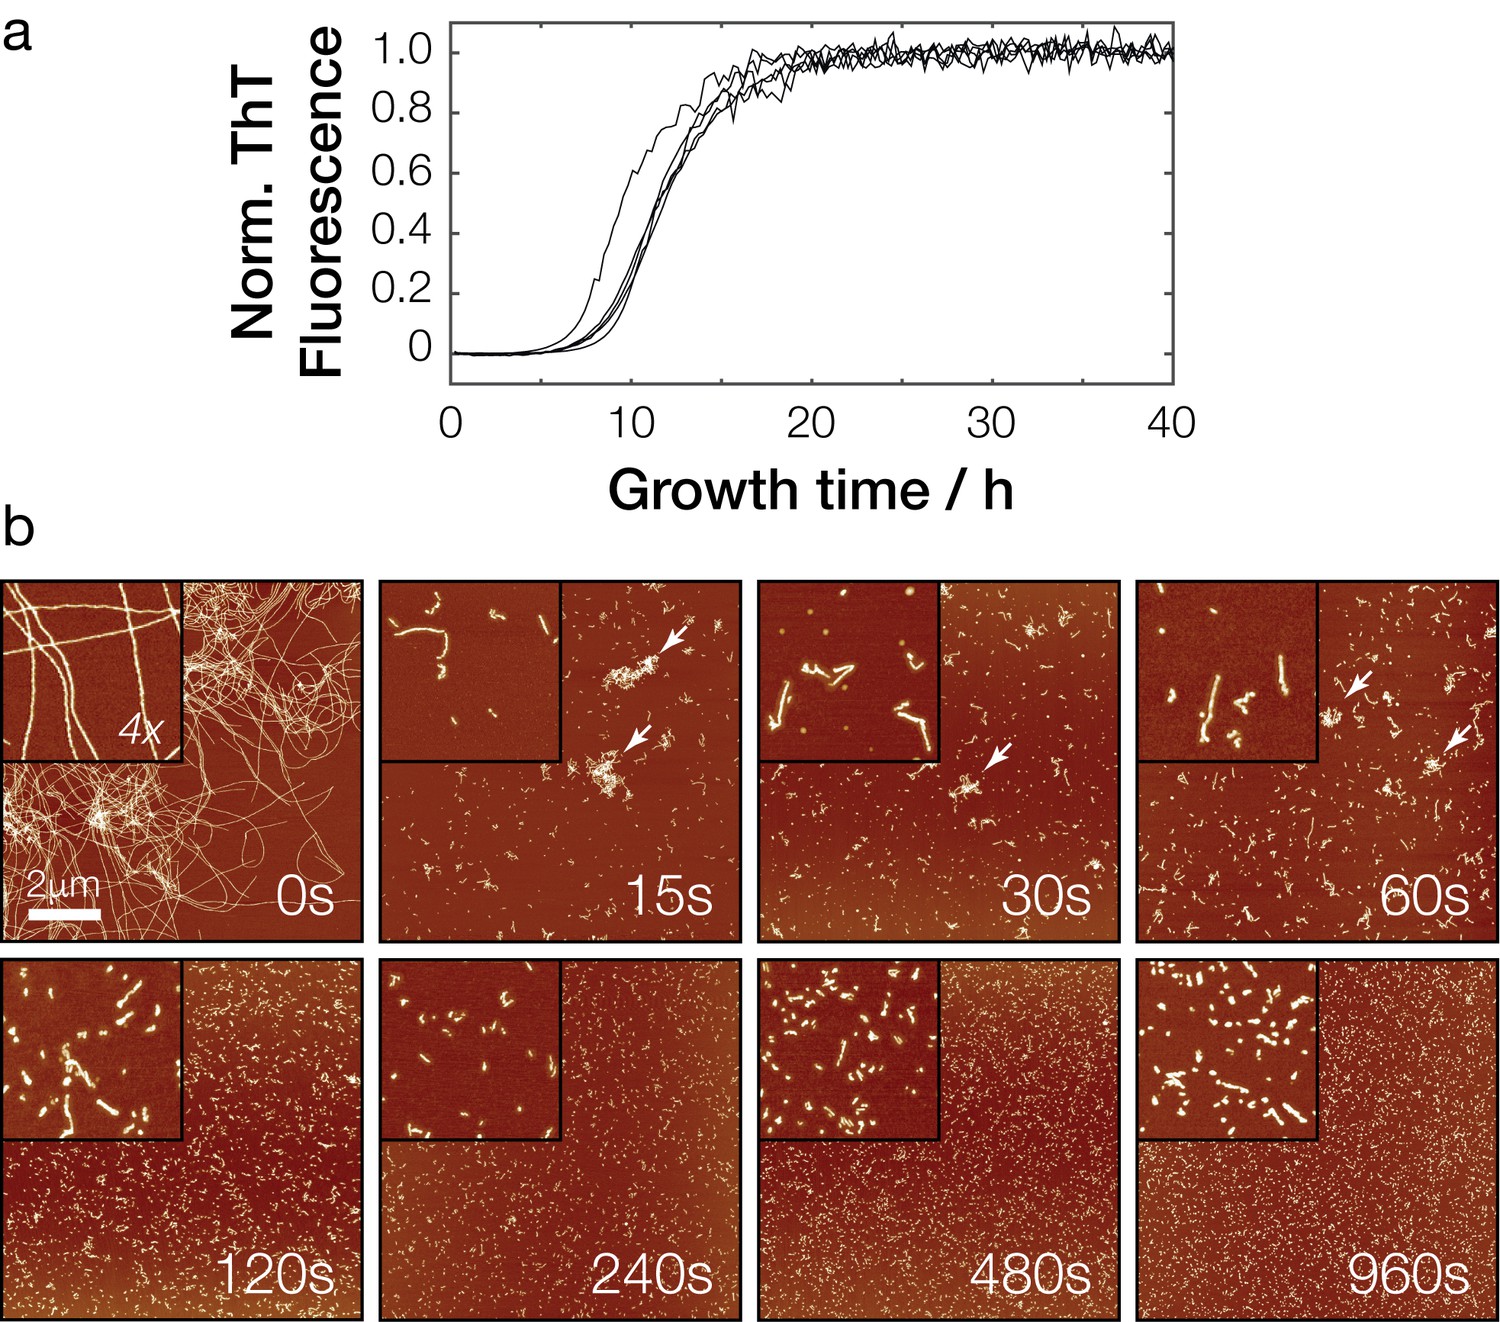
In vitro polymerization and fragmentation of Sup35NM prion fibrils.
(a) Sup35NM polymerization monitored using the amyloid-binding dye Thioflavin T. Five experimental replicates are plotted, with curves normalized to their upper baseline. (b) Representative atomic force microscopy images of Sup35NM amyloid fibrils before (0 s) and after sonication. Samples were diluted 1:300 prior to deposition on the mica surface except for the 0 s sample. Images of 10 μm x 10 μm in scan size are shown together with 4 x further magnified views. The scale bar represents the length of 2 μm in all images and arrows show examples of clusters of fibril particles.
Figure 3 with 1 supplement
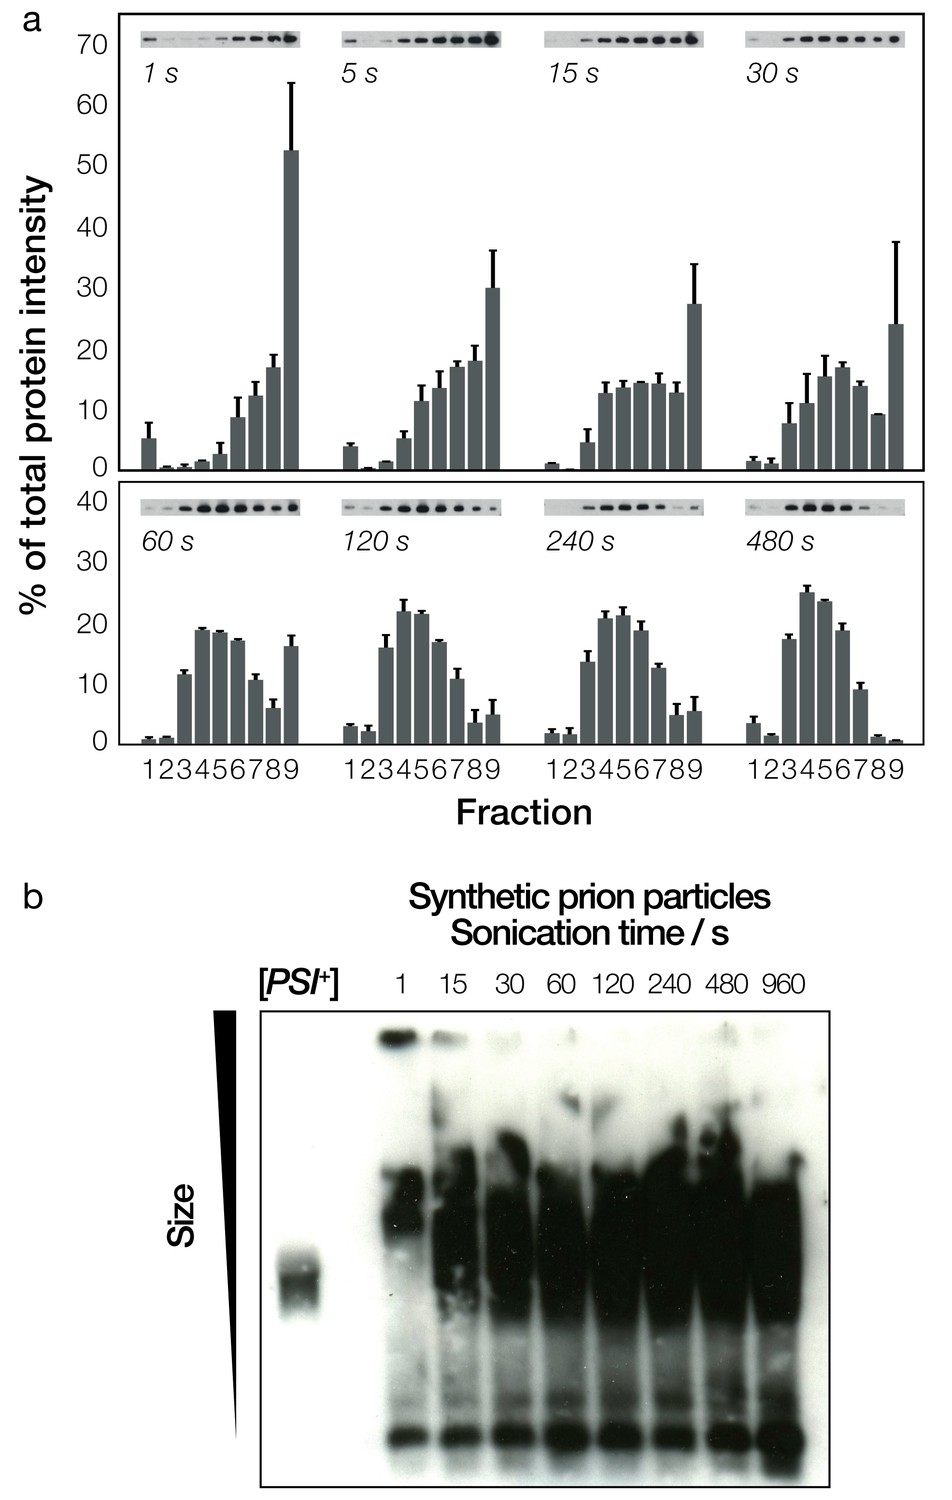
Biochemical analysis of fragmented Sup35NM fibrils and their sizes.
(a) Native sucrose density gradient analysis of sonicated Sup35NM fibrils. Each group of bars corresponds to one time-point, showing the percentage of total protein present in each of the nine gradient fractions. For each time point, three independent replicates were averaged. Error bars represent standard error of the mean. A representative Western blot for each of the time points is also shown. (b) SDD-AGE analysis, followed by immunoblotting, of the Sup35NM fibril samples. Samples sonicated for different periods of time are shown in each lane. A cell extract of [PSI+] cells is shown on the left most lane for comparison.
Figure 3—figure supplement 1
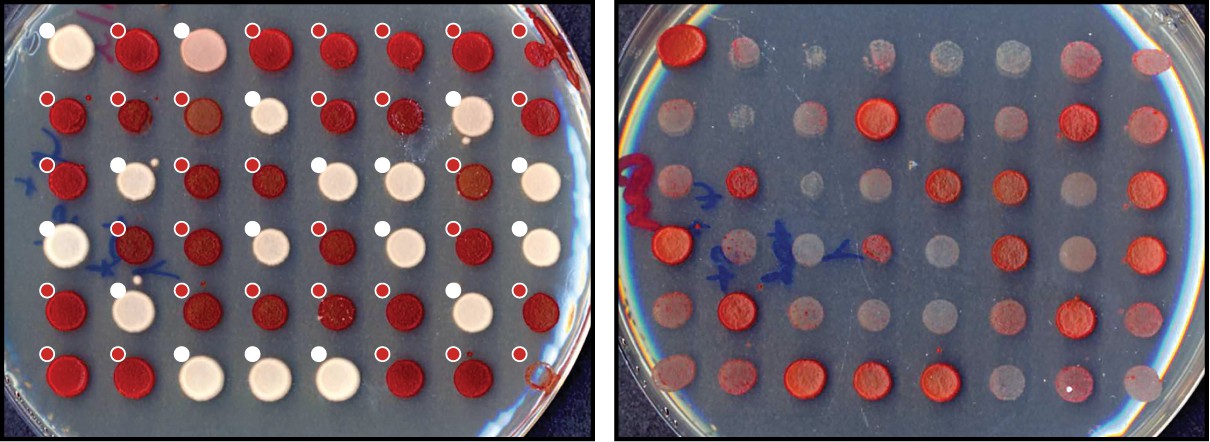
Prion transfection efficiency of [PSI+] cell extract.
To induce the [PSI+] prion state by yeast extract, a sample of total [PSI+] cell extract sample was used to transfect [psi-] yeast cells. Protoplasts were recovered on SD -URA plates (see Materials and methods) and randomly selected yeast colonies were scored for their phenotypes. Individual colonies were scored as [PSI+] (white dots) or [psi-] (red dots) based on their color in ¼ YEPD (left) and curability in ¼ YEPD supplemented with 3 mM GdnHCl (right).
Figure 4 with 1 supplement
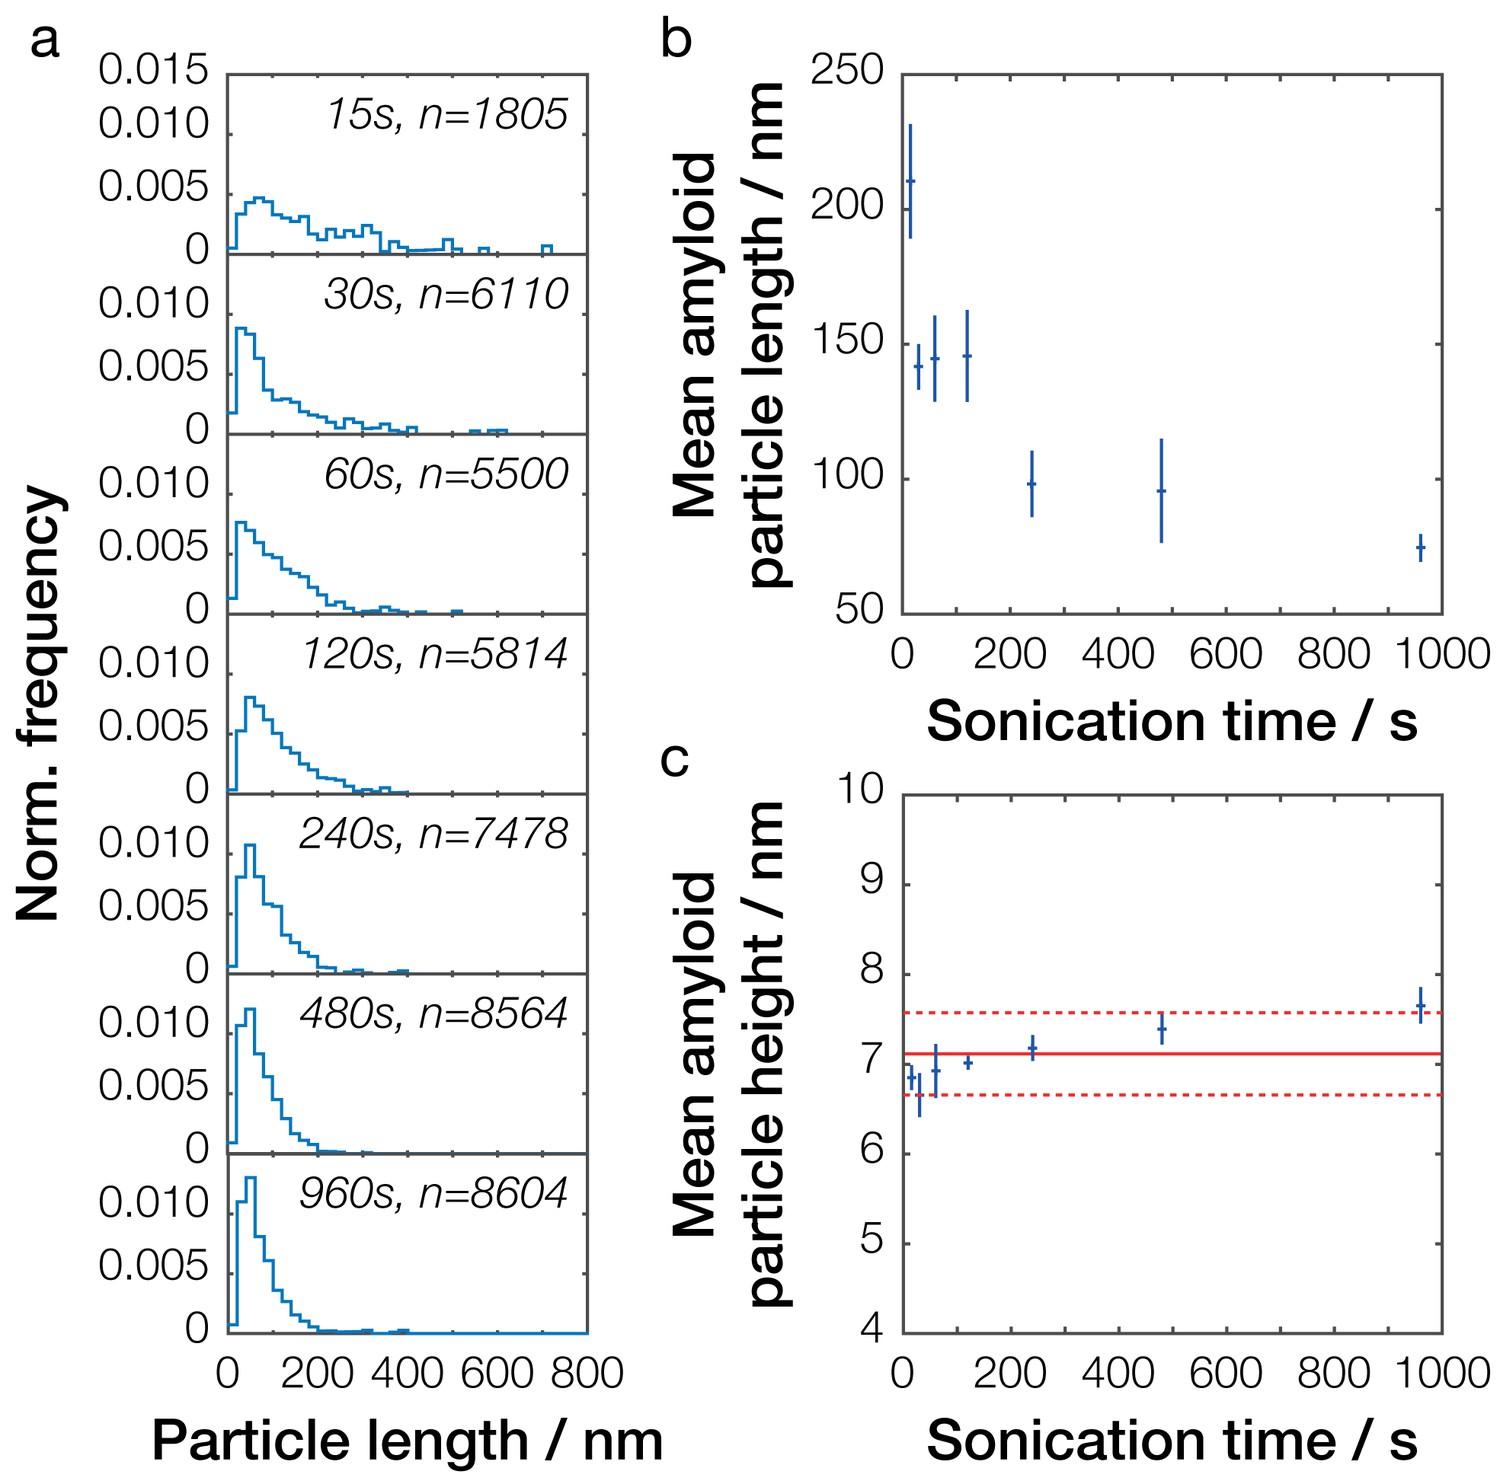
Single-particle analysis of Sup35NM fibril length distribution after controlled sonication.
(a) Particle size distributions for seven representative Sup35NM samples sonicated for different times. The occurrence of different particle sizes was normalized against the total number of particles traced for each individual sample and plotted against particle length (blue lines). Sonication time and the number of fibrils analyzed for each sample are displayed in each plot. (b) Relationship between mean particle length and sonication time. Each data point represents the mean of all individual samples analyzed for a given time point. Error bars represent the standard error of the mean. (c) Relationship between mean particle height, representing the width of the fibril particles, and sonication time. Each data point represents the mean of all individual samples analyzed for a given time point. Error bars represent the standard error of the mean. The mean height of all values is represented by the solid red line, with its standard error represented by the dotted red lines.
Figure 4—figure supplement 1

Particle length distributions for individual Sup35NM samples analyzed by AFM image analysis.
A total of 26 samples were characterized by AFM and the particle length distributions quantified by single particle measurements using automated fibril tracing scripts written in Matlab. A number of images were collected for each sample (see statistics in Table 1), with a representative image of each sample shown here. Normalized particle length distributions for each individual sample are shown below the images together with their average lengths.
Figure 5 with 3 supplements
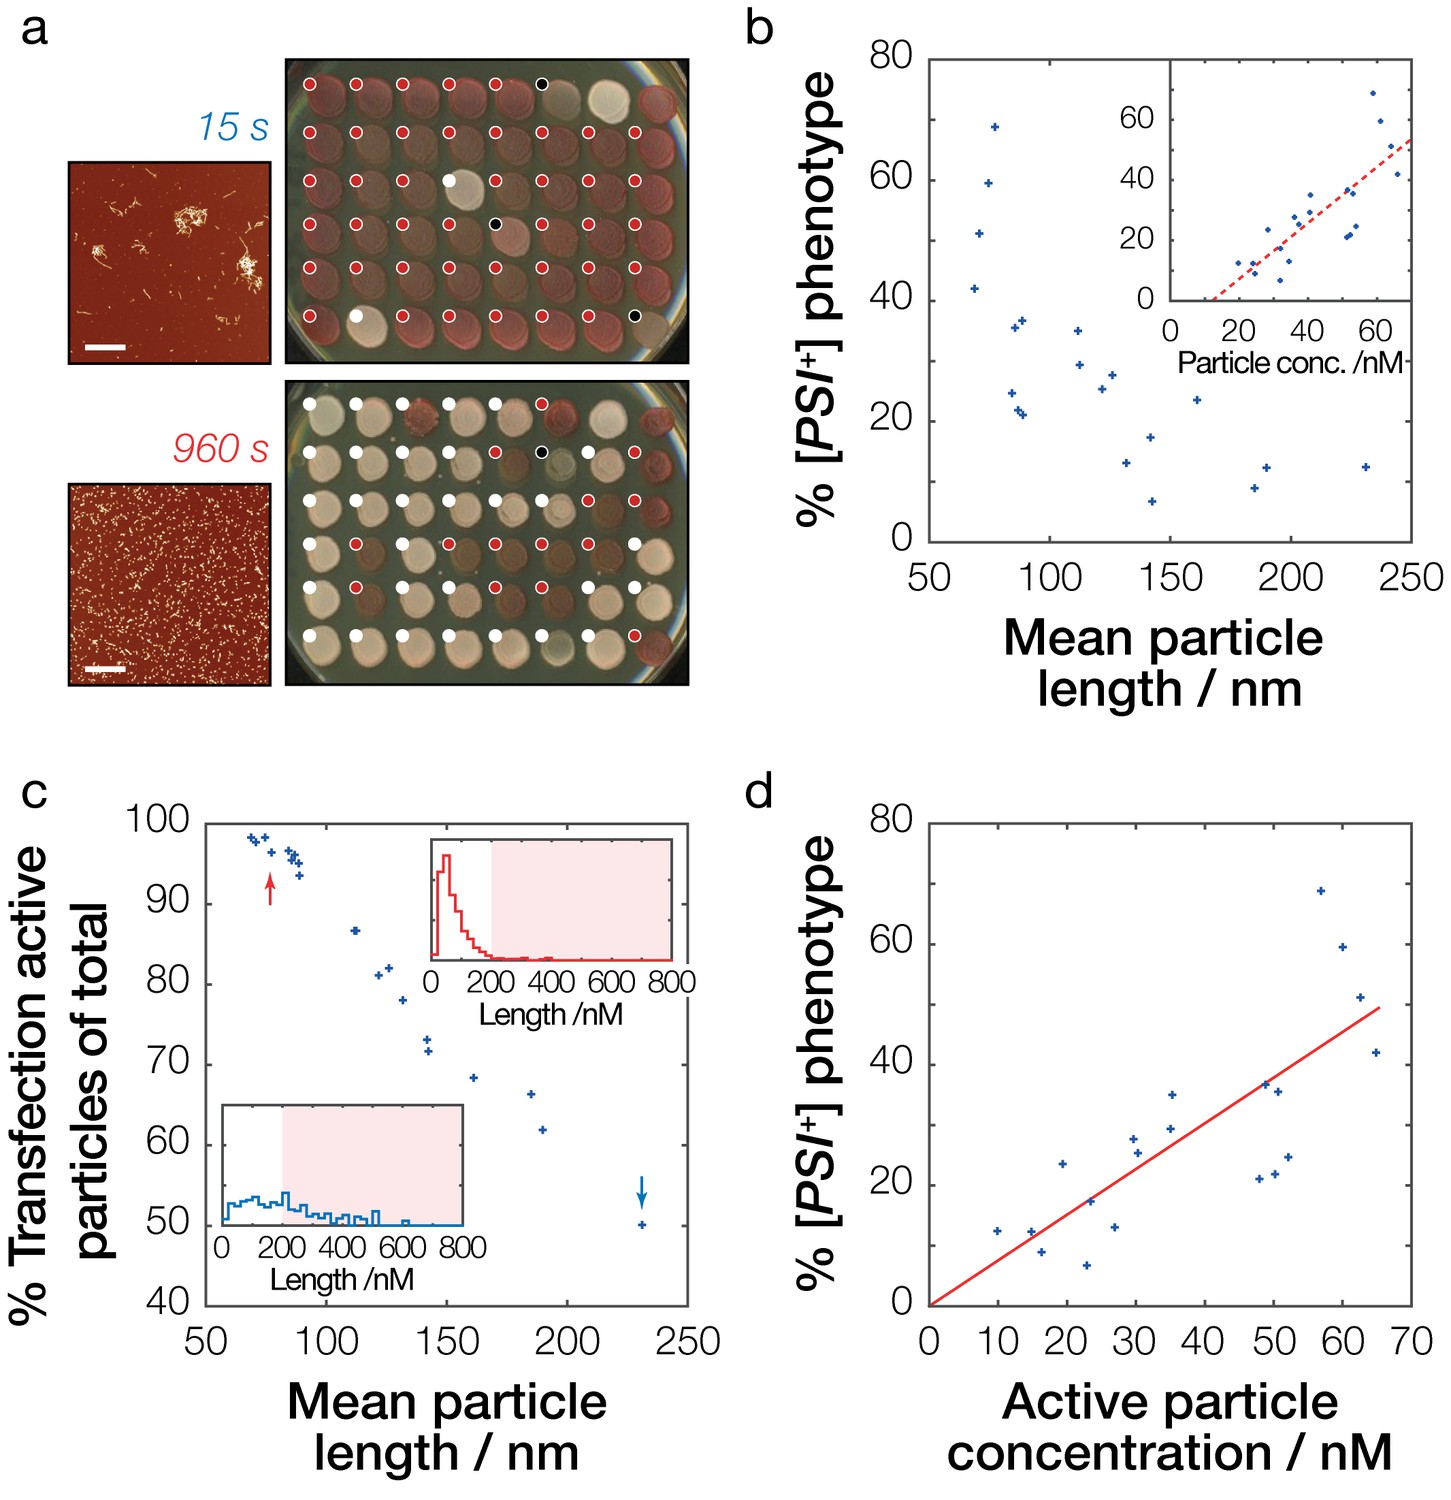
Prion infective potential depends on particle size, concentration and activity.
(a) Analysis of prion transfection efficiency. AFM images of representative Sup35NM fibrils samples sonicated for 15 s (upper) and 960 s (lower) are shown together with plates containing yeast colonies grown from protoplasts transfected with the Sup35NM fibrils samples, indicating the sample’s ability to infect yeast cells and to induce [PSI+] phenotype in vivo. Scale bars indicate the length of 1 μm. Individual yeast colonies were scored as [PSI+] (white dots) or [psi-] (red dots) based on their colour in ¼ YEPD and curability in ¼ YEPD supplemented with 3 mM GdnHCl (Figure 5—figure supplement 1). Colonies that showed poor growth or unrecognisable colour differentiation were omitted (black dots). On each plate, control [PSI+] (white) and [psi-] (red) colonies are present at the upper right corners for comparison. See Figure 5—figure supplement 1 for the full data set. (b) Dependency of prion transfection efficiency on particle size. Mean fibril length for each of the 20 samples analysed is plotted against the percentage of S. cerevisiae [PSI+] colonies obtained after prion transfection. Inset show dependency of prion transfection efficiency on particle concentration calculated from the length distribution of the samples. The dashed red line denotes best fit linear model with the slope of 9.3·108 M−1 and the intercept of −11.3% with 95% confidence interval for the intercept between −26.0% to −0.7%, demonstrating that this linear model is not the correct model to describe the transfection efficiency as function of particle length or particle concentration. (c) Transfection activity of the Sup35NM fibrils samples estimated as the percentage of fibril particles less than 200 nm long show against the average particle length of each fibril sample. Insets show representative particle length distributions of the fibril samples shown in (a) sonicated for 15 s (blue distribution/arrow) and 960 s (red distribution/arrow), with shaded areas denoting particles larger than 200 nm long. (d) Dependency of prion infective potential on active particle concentration consisting of fibril particles less than 200 nm long. The red line denotes best-fit linear model with the slope of 7.6·108 M−1.
Figure 5—figure supplement 1
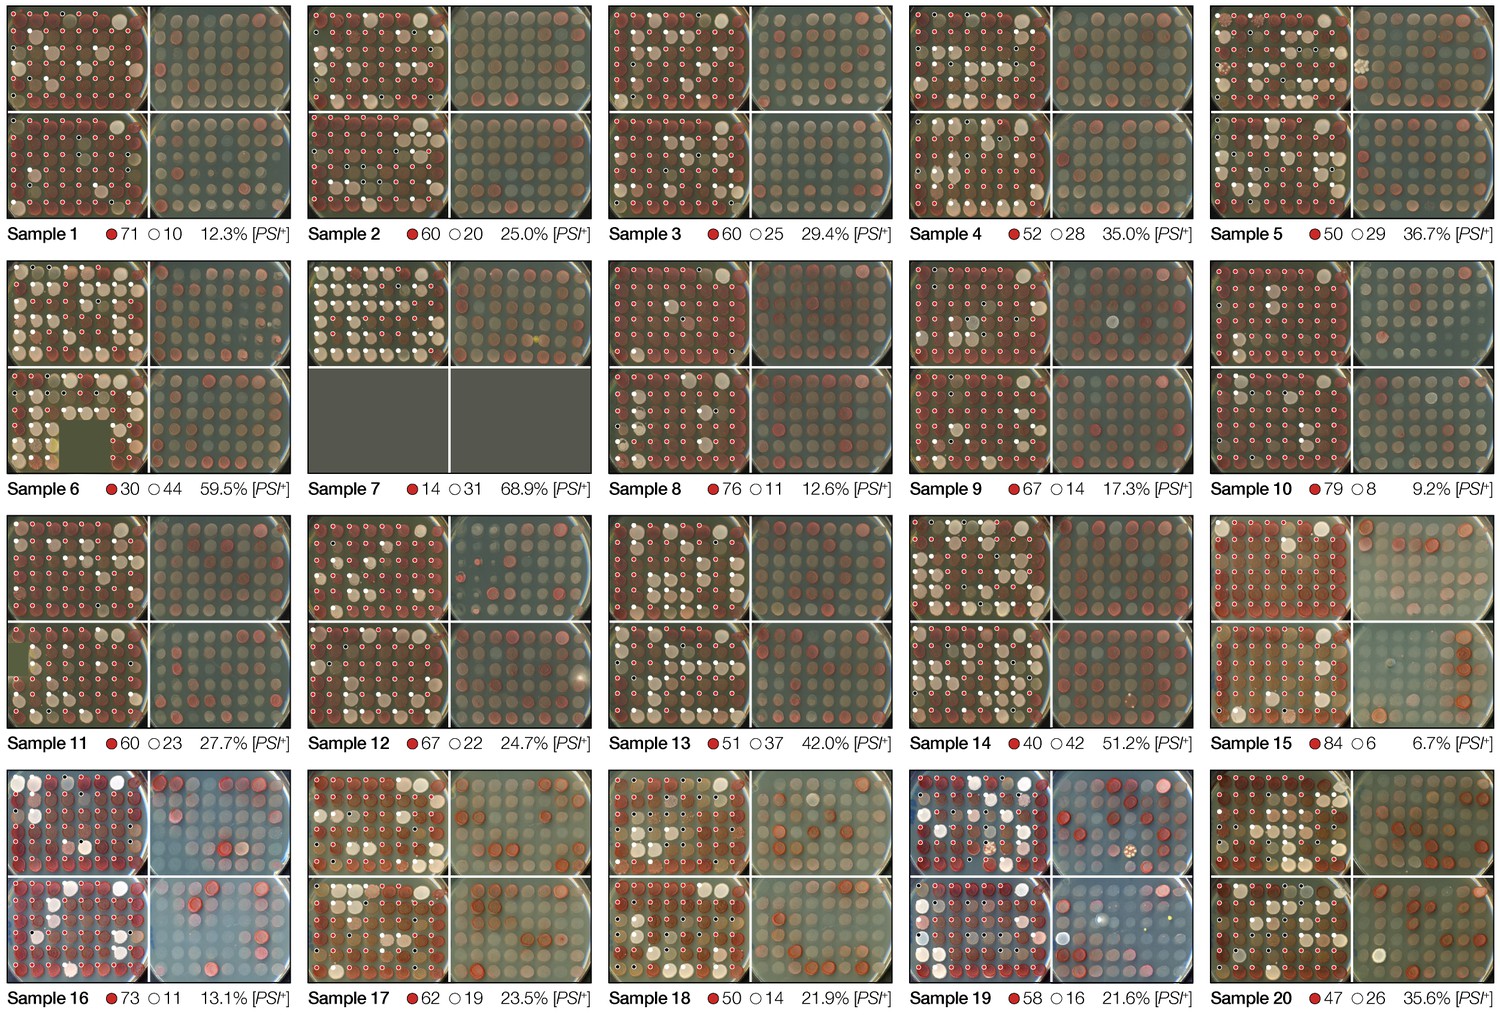
Prion transfection efficiency of Sup35NM amyloid fibrils samples.
For each Sup35NM fibril sample (Table 1), scoring of the samples’ ability to infect yeast cells and to induce [PSI+] phenotype in yeast colonies grown from protoplasts incubated with the Sup35NM fibrils samples is indicated with colored dots shown on each colony. Individual yeast colonies were scored as [PSI+] (white dots) or [psi-] (red dots) based on their color in ¼ YEPD (left) and curability in ¼ YEPD supplemented with 3 mM GdnHCl (right). Colonies that showed poor growth or unrecognizable color differentiation were omitted (black dots). On each plate, control [PSI+] (white) and [psi-] (red) colonies are present at the upper right corners for comparison. The number of colonies scored and the percentage of [PSI+] colonies obtained are shown below each image.
Figure 5—figure supplement 2
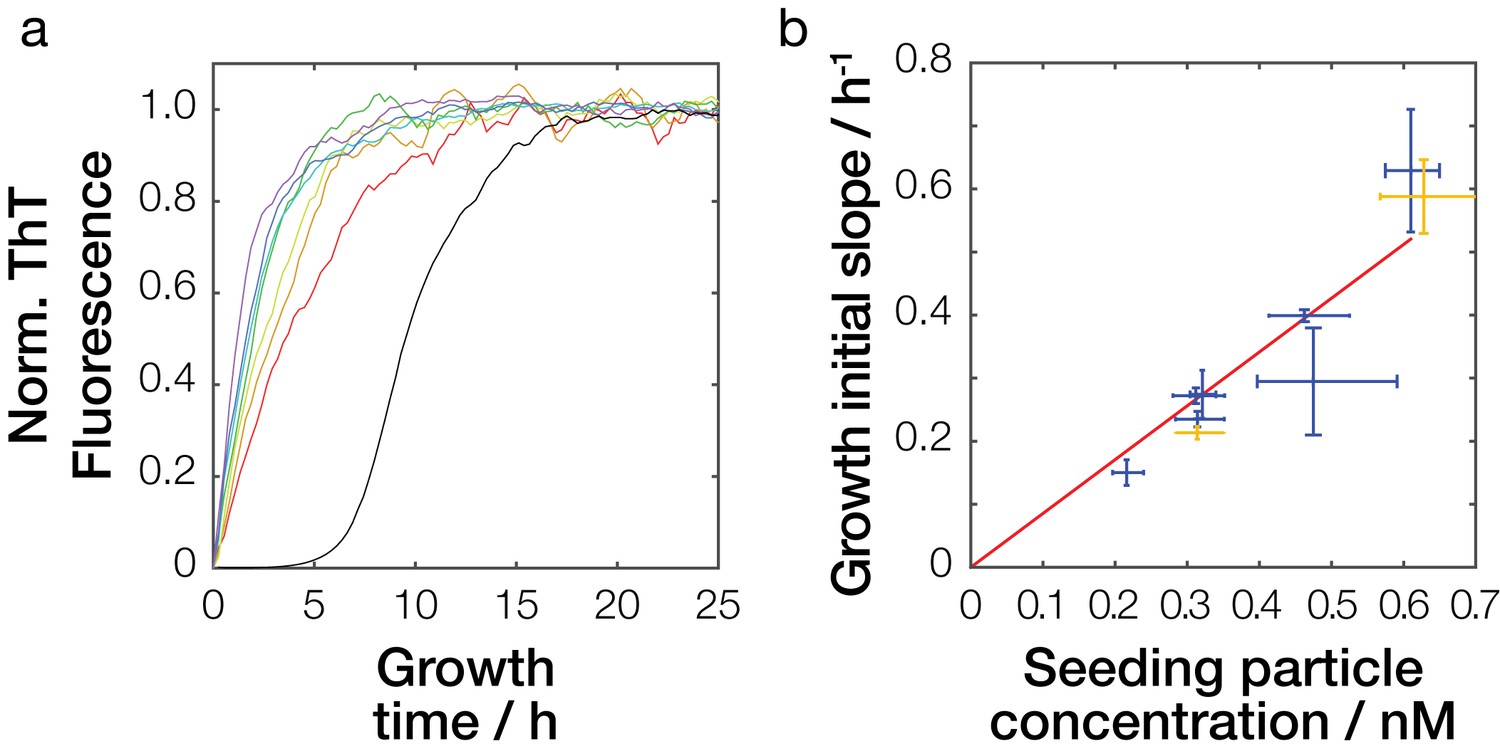
Seeding efficiency of Sup35NM amyloid fibrils samples.
(a) Seeded amyloid growth monitored by Thioflavin T fluorescence in reactions seeded by fibril samples sonicated for different amounts of time. For clarity, one replicate curve (out of three) for each seed sample (red: 15 s, orange: 30 s, yellow: 60 s, green: 120 s, cyan 240 s, blue: 480 s, and purple: 960 s of sonication) is show together with one unseeded growth curve (black). (b) Dependency of seeding potential on particle concentration. Mean initial slope of seeded growth is plotted against the particle concentrations of the seed samples calculated from their length distribution (blue cross). The red line denotes best-fit linear model with the slope of 8.5·108 h−1M−1. Yellow cross denotes seeding efficiency of an independent sample sonicated for 60 s, left yellow cross shows seeding efficiency at addition of 1% seeds, and upper right yellow cross shows seeding efficiency at addition of 2% seeds predicted to have the same seeding efficiency as the sample sonicated for 960 s represented by the right most blue cross.
Figure 5—figure supplement 3
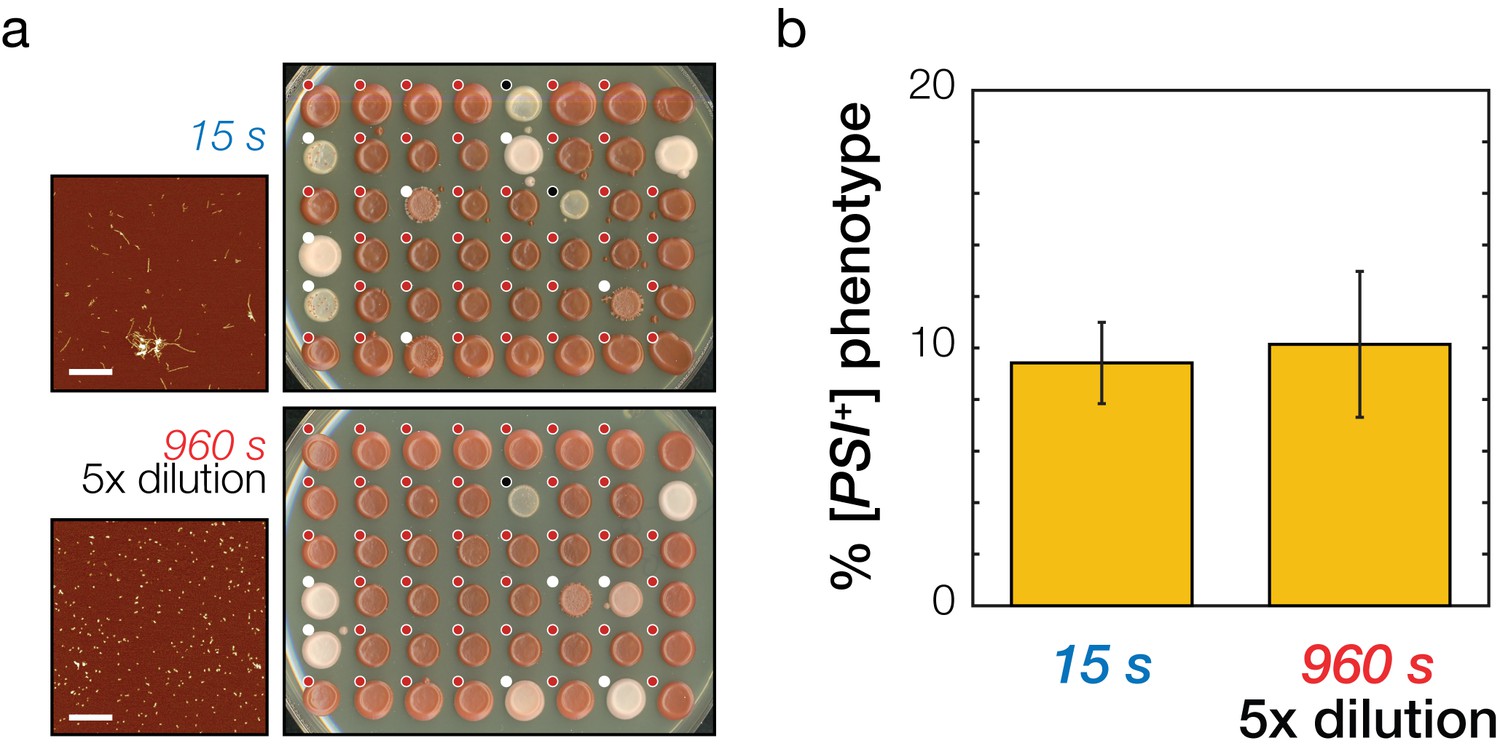
Testing model predictions on the prion transfection efficiency of Sup35NM amyloid fibrils samples of different length but the same active concentration.
(a) Analysis of prion transfection efficiency. AFM images of representative independent Sup35NM fibrils samples sonicated for 15 s (upper) and 960 s (lower) are shown together with plates containing yeast colonies grown from protoplasts transfected with the 15 s sonicated and five fold dilution of 960 s sonicated samples of Sup35NM fibrils, respectively. Scale bars indicate the length of 1 μm. Individual yeast colonies were scored as [PSI+] (white dots) or [psi-] (red dots) based on their colour in ¼ YEPD and curability in ¼ YEPD supplemented with 3 mM GdnHCl. Colonies that showed poor growth or unrecognisable colour differentiation were omitted (black dots). On each plate, control [PSI+] (white) and [psi-] (red) colonies are present at the upper right corners for comparison. (b) Transfection efficiency of the sample sonicated for 15 s and a five times diluted sample sonicated for 960 s. The two cases have the same predicted active particle concentration and consequently are predicted to be equally able to induce the [PSI+] prion phenotype in yeast. Error bars represent the standard error of the mean of three independent samples with total of 276 replicates scored.
Figure 6

The physical dimensions of prion particles modulate their suprastructure and their infective potential.
The length of individual Sup35NM amyloid fibrils modulate whether they are active prion particles that can infect cells and induce the [PSI+] prion phenotype or form inactive suprastructures in the form of fibril clusters and networks. Thus, the infective potential of prion samples may be represented in terms of an average per particle activity (top sliding bar). Here, the active Sup35NM yeast prion population is represented by an active population of particles less than ~200 nm long, which are able to cross the membranes of yeast protoplasts and enter the prion lifecycle in the cells. Particle sizes larger than 200 nm are non-infectious, most likely because they cannot cross the cell membrane, but this may also be due to the possibilities that they cannot interact with or are actively sequestered away from the propagation machinery due to their aggregate size.
Tables
Table 1
Quantitative analysis of Sup35NM amyloid fibril samples.
Sample and image analysis statistics for characterized Sup35NM amyloid fibril samples.
| Sample | Fragmentation | AFM image analysis | Prion transfection | ||||
|---|---|---|---|---|---|---|---|
| Sonication time/s | Number of images | Mean particle length/nm | Number of fibril particles | Mean particle height/nm | Number of pixels | [PSI+] transfection efficiency / % | |
| 1 | 15 | 5 | 189.7 | 1805 | 7.0 | 27965 | 12.3 |
| 2 | 30 | 5 | 121.9 | 6110 | 6.1 | 64381 | 25.0 |
| 3 | 60 | 2 | 112.3 | 5500 | 6.2 | 63114 | 29.4 |
| 4 | 120 | 2 | 111.7 | 5814 | 6.9 | 79594 | 35.0 |
| 5 | 240 | 2 | 88.4 | 7478 | 7.2 | 88175 | 36.7 |
| 6 | 480 | 2 | 74.5 | 8564 | 7.8 | 91816 | 59.5 |
| 7 | 960 | 2 | 77.2 | 8604 | 8.1 | 92713 | 68.9 |
| 8 | 15 | 4 | 231.1 | 1560 | 6.7 | 24809 | 12.6 |
| 9 | 30 | 4 | 141.8 | 2699 | 6.5 | 33303 | 17.3 |
| 10 | 60 | 2 | 184.8 | 2003 | 7.2 | 31931 | 9.2 |
| 11 | 120 | 2 | 125.9 | 4562 | 7.1 | 63937 | 27.7 |
| 12 | 240 | 2 | 84.3 | 4169 | 7.0 | 48486 | 24.7 |
| 13 | 480 | 2 | 68.9 | 5662 | 7.5 | 57393 | 42.0 |
| 14 | 960 | 2 | 70.9 | 5717 | 7.8 | 62894 | 51.2 |
| 15 | 30 | 4 | 142.3 | 675 | 7.1 | 9353 | 6.7 |
| 16 | 60 | 3 | 131.8 | 1937 | 6.8 | 24348 | 13.1 |
| 17 | 120 | 2 | 161.0 | 1909 | 7.1 | 27013 | 23.5 |
| 18 | 240 | 2 | 87.0 | 4269 | 7.0 | 49000 | 21.9 |
| 19 | 480 | 3 | 88.8 | 2938 | 7.0 | 33342 | 21.6 |
| 20 | 960 | 2 | 85.7 | 4687 | 7.4 | 56457 | 35.6 |
| 21 | 30 | 6 | 160.5 | 3306 | 6.9 | 47476 | - |
| 22 | 60 | 4 | 150.0 | 3523 | 7.5 | 47590 | - |
| 23 | 120 | 2 | 184.2 | 2198 | 7.0 | 32565 | - |
| 24 | 240 | 2 | 133.3 | 1803 | 7.5 | 24158 | - |
| 25 | 480 | 2 | 150.6 | 1455 | 7.3 | 21163 | - |
| 26 | 960 | 2 | 64.3 | 8000 | 7.3 | 77914 | - |
Additional files
-
Transparent reporting form
- https://doi.org/10.7554/eLife.27109.014
Download links
A two-part list of links to download the article, or parts of the article, in various formats.
Downloads (link to download the article as PDF)
Open citations (links to open the citations from this article in various online reference manager services)
Cite this article (links to download the citations from this article in formats compatible with various reference manager tools)
The physical dimensions of amyloid aggregates control their infective potential as prion particles
eLife 6:e27109.
https://doi.org/10.7554/eLife.27109


