Development of Bag-1L as a therapeutic target in androgen receptor-dependent prostate cancer
- Dana-Farber Cancer Institute and Harvard Medical School, United States
- Dana-Farber Cancer Institute, United States
- Karlsruhe Institute of Technology, Germany
- Institute of Cancer Research and The Royal Marsden NHS Foundation Trust, United Kingdom
- The Barcelona Institute of Science and Technology, Spain
- PRP-ENV/SERIS/LECO, France
- Institute of Cancer Research, United Kingdom
- Innsbruck Medical University, Austria
- University of Illinois at Urbana-Champaign, United States
- The Institute of Cancer Research, United Kingdom
- Passeig Lluís Companys, Spain
Figures
Figure 1 with 3 supplements

Loss of Bag-1L inhibits PCa cell growth and reduces the AR cistrome and transcriptome.
(A) Schematic of the TALEN approach to knockout Bag-1L expression. The TALEN target sequences are highlighted in grey and the start codon (CTG) of Bag-1L is highlighted in yellow. Note, the start codons for the other Bag-1 isoforms remain intact. The resulting coding sequence, which is missing the Bag-1L start codon and flanking regions, is shown in red. (B) Western blot of nuclear extracts from hormone-deprived control (Ctr) and Bag-1L KO (KO) cells treated with vehicle (ETOH) or 10 nM DHT for 4 hr. Protein levels of Bag-1 isoforms (Bag-1L, −1S and −1, but not −1M) and AR are shown. The expression of the nuclear protein Lamin B1 was used for equal protein loading. (C) Western blot of Bag-1L and AR levels in control, Bag-1L KO and Bag-1L KO rescue cell lines, as indicated. β-actin was probed to ensure equal protein loading. (D) Proliferation assay of indicated cell lines grown in complete media and counting on days 0 and 5. Data are the averages of three independent experiments ± SEM, normalized to day 0. p-values were calculated using standard t test; *p≤0.05; ***p≤0.001; ****p≤0.0001. (E) Venn diagram of AR cistromes from replicate ChIP-seq experiments in hormone-depleted control (red) and Bag-1L KO (blue) cells treated for 4 hr with DHT. The union of binding sites is indicated. (F) Signal profiles and heatmaps of AR ChIP-seq data (centered on the AR peaks) from indicated cell lines. Signals are shown for sites with an AR peak in one or more cell lines. Cells were starved of hormone and treated with 10 nM DHT for 4 hr prior to the experiment. (G) Top, fluorescence images of CFP-AR-YFP-expressing hormone-depleted control or Bag-1L KO cells, treated with ETOH or 10 nM DHT for 2 hr. The FRET channel, which is corrected by 17% of ICFP, is shown in red, the raw CFP in blue, and the YFP, under direct excitation at 488 nm, in yellow. Results are from two independent experiments with more than 10 images. Scale bar: 10 µm. A schematic representation of the CFP-AR-YFP construct is shown below. Bottom, Quantification of CFP-AR-YPF FRET. IFRET/(IFRET +IDonor) ratios in the nucleus are shown. Data is the result of readings from more than 25 cells per sample and is presented as mean ±SD. ****p≤0.0001.
-
Figure 1—source data 1
Direct AR-target genes in TALEN control compared with Bag-1L KO cell lines.
- https://doi.org/10.7554/eLife.27159.007
Figure 1—figure supplement 1
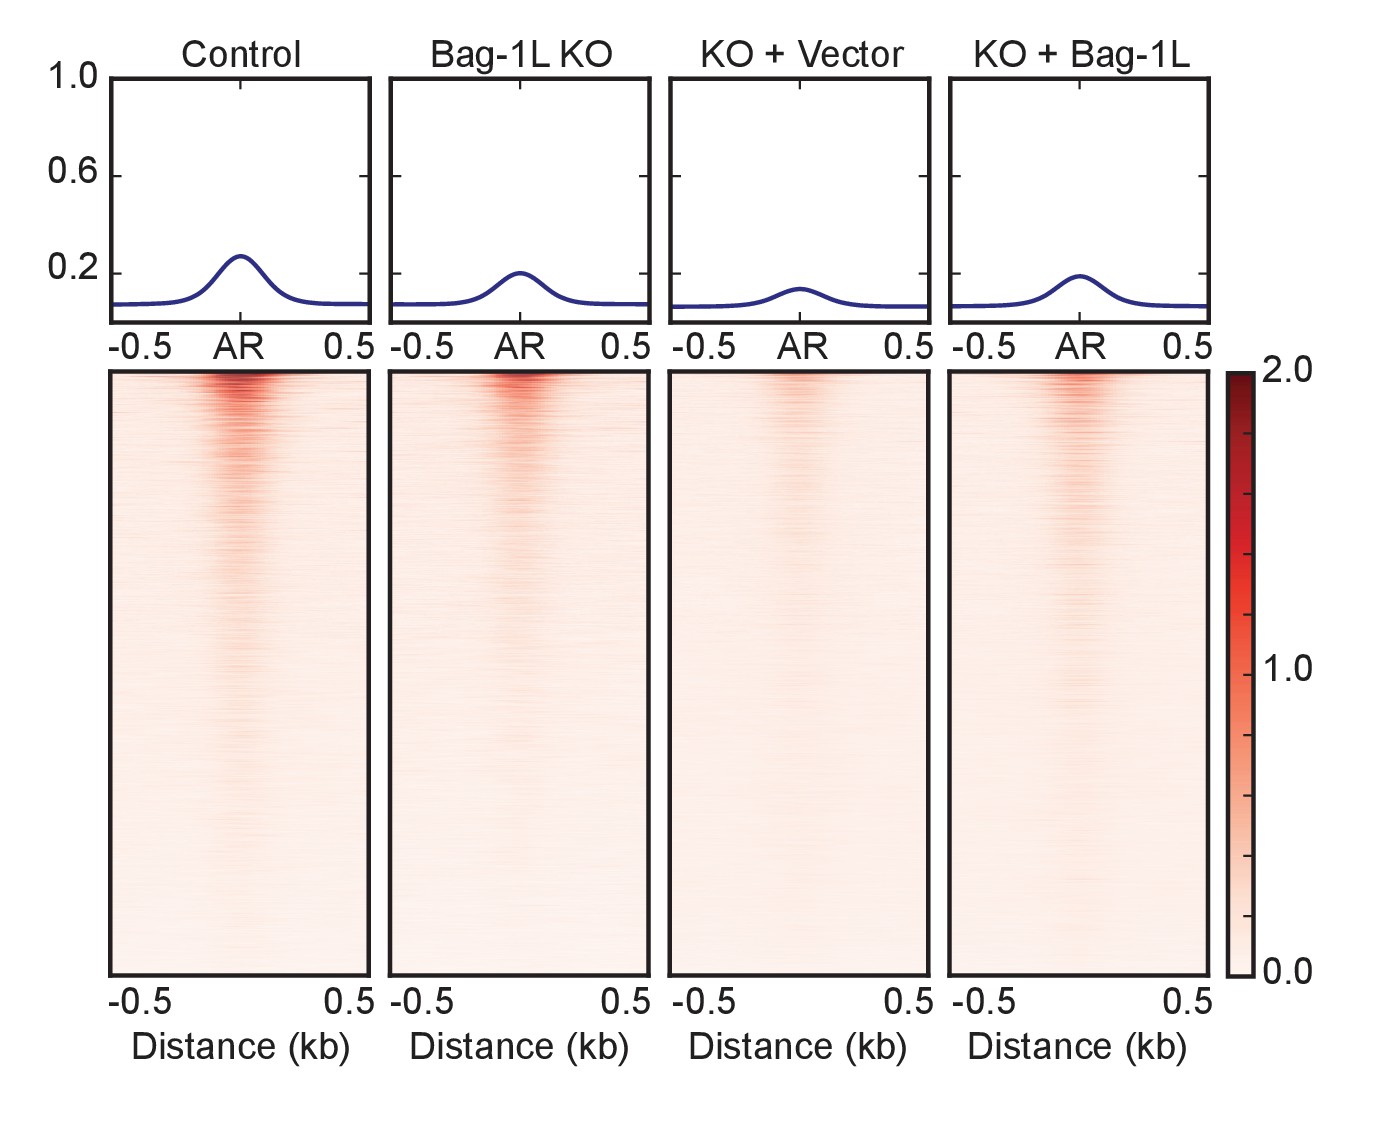
Signal profiles and heatmaps of AR ChIP-seq data in Bag-1L control, KO and rescue cell lines in the presence of vehicle.
Signals are shown for sites with an AR peak in one or more cell lines. Cells were treated with vehicle (ETOH) for 4 hr prior to ChIP-seq.
Figure 1—figure supplement 2
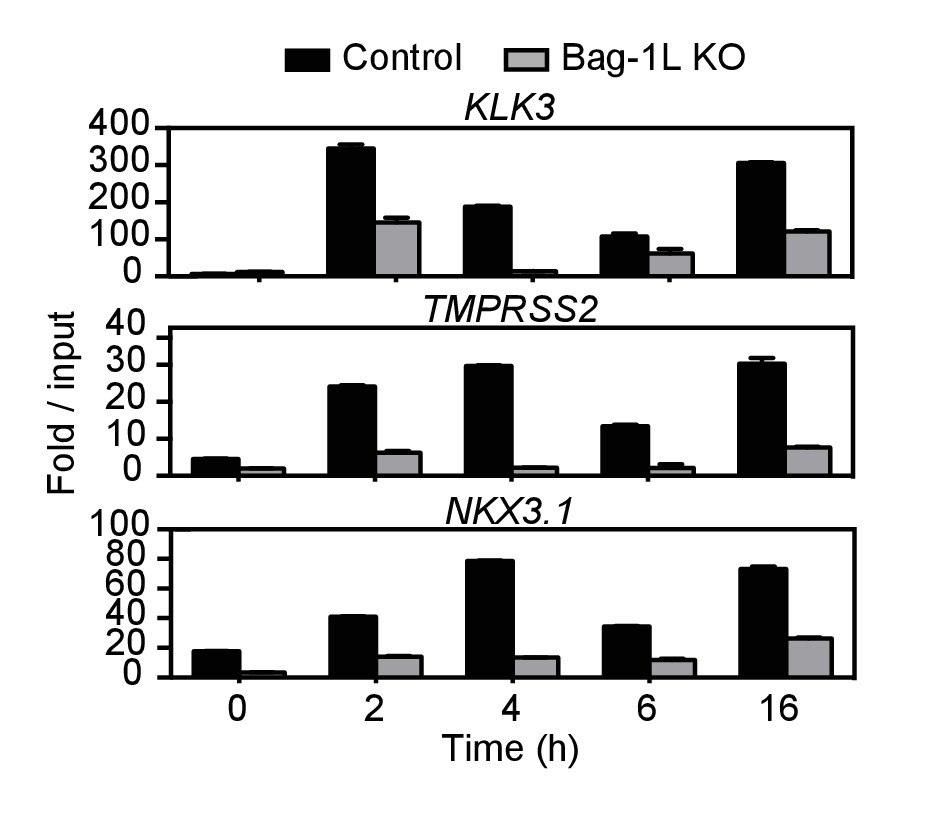
ChIP qPCR validation of three AR enhancer sites in Bag-1L control and KO cells.
Directed AR qPCR for indicated gene targets in hormone-depleted control (black) and Bag-1L KO (grey) LNCaP cells treated with 10 nM DHT for indicated times. Results are presented as the mean of triplicate experiments ± SD.
Figure 1—figure supplement 3
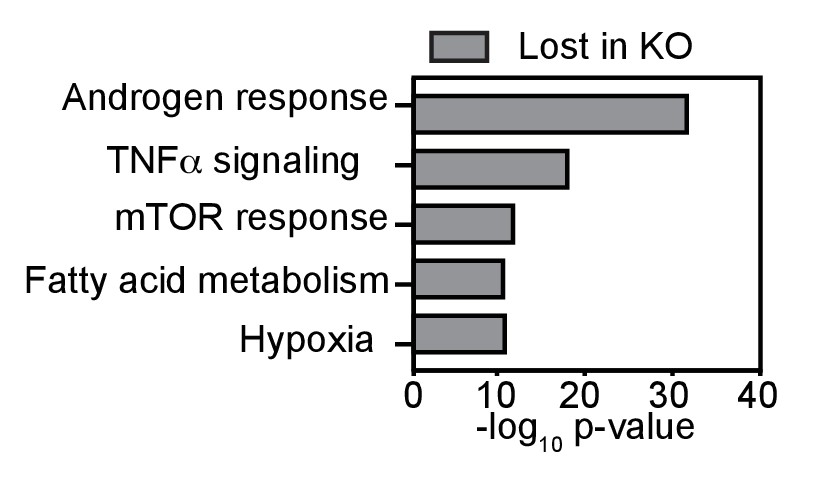
Top five HALLMARK terms (GSEA) associated with direct AR-target genes lost in Bag-1L KO compared to control cells.
Direct AR-target genes were defined as genes with DHT-induced differential expression (p≤0.05, fold change ≥1.5) that harbor a DHT-responsive AR binding site within 50 kb of the TSS of said gene.
Figure 2 with 6 supplements

The Bag-1L:AR interaction is mediated by K231/232/279 in the BAG domain of Bag-1L.
(A, B) Mammalian one-hybrid assay in HeLa cells transfected with indicated AR domains linked to Gal4 DBD, subjected to increasing concentration of Bag-1L. The results are the mean of three independent experiments ± SEM, relative to the empty Bag-1L expression vector. Schematic representations of the AR domains are shown below. AF-1: Activation function-1; H: Hinge; DBD: DNA-binding domain; LBD: Ligand-binding domain. (C) GST pull-down with GST-Bag-1L fusion proteins harboring point mutations (as indicated) in their BAG domain and lysates from LNCaP cells. Shown below is a schematic structure of Bag-1L with the triple mutations in the BAG domain, which abolish the interaction with the AR (but have no effect on Hsp70 binding). NLS: Nuclear localization sequence; UBQ: Ubiquitin-like domain; BAG: BAG domain. (D) Co-immunoprecipitation of Bag-1L and AR in LNCaP cells stably overexpressing FLAG-, HA-tagged wild-type (WT) or BAG domain mutant Bag-1L (CMut). The IP was performed using an anti-HA-tag antibody against Bag-1L and an antibody against AR and Hsp70 to evaluate binding of these proteins to Bag-1L. Equal protein loading was confirmed by probing for expression of Bag-1L, AR, Hsp70 and β-actin.. (E) Mammalian one-hybrid assay in HeLa cells transfected with pG5ΔE4-38 luciferase, TK Renilla luciferase, pM-AR AF-1 and different Bag-1L constructs harboring a wild-type or mutant BAG domain (as indicated). The results are the mean of three independent experiments ± SEM, relative to the empty Bag-1L expression vector. (F) Mammalian two-hybrid assay in HeLa cells transfected with Gal4 DBD-AR LBD and VP16-AR-AF-1 and increasing amounts of wild-type (WT) or K231/232/279A mutant Bag-1L (CMut). The results are the mean of three independent experiments ± SEM, relative to the control Renilla luciferase. (G) Log-log plot of intensities for proteins detected in forward and reverse SILAC RIME analyses of Bag-1L WT and CMut cells, targeting BAG-1L (dark blue) or IgG (light blue). Black lines represent median IgG-RIME ratios ± 2 standard deviations. Bag-1L, Hsp70 (HSPA1) and AR are indicated in yellow and red, respectively.
-
Figure 2—source data 1
List of Bag-1L interactors altered by the BAG domain mutation (≥2 standard deviations of Bag-1L/IgG control RIME).
- https://doi.org/10.7554/eLife.27159.015
-
Figure 2—source data 2
Associated functions (FuncAssociate) of Bag-1L interactors altered by the BAG domain mutation.
- https://doi.org/10.7554/eLife.27159.016
Figure 2—figure supplement 1
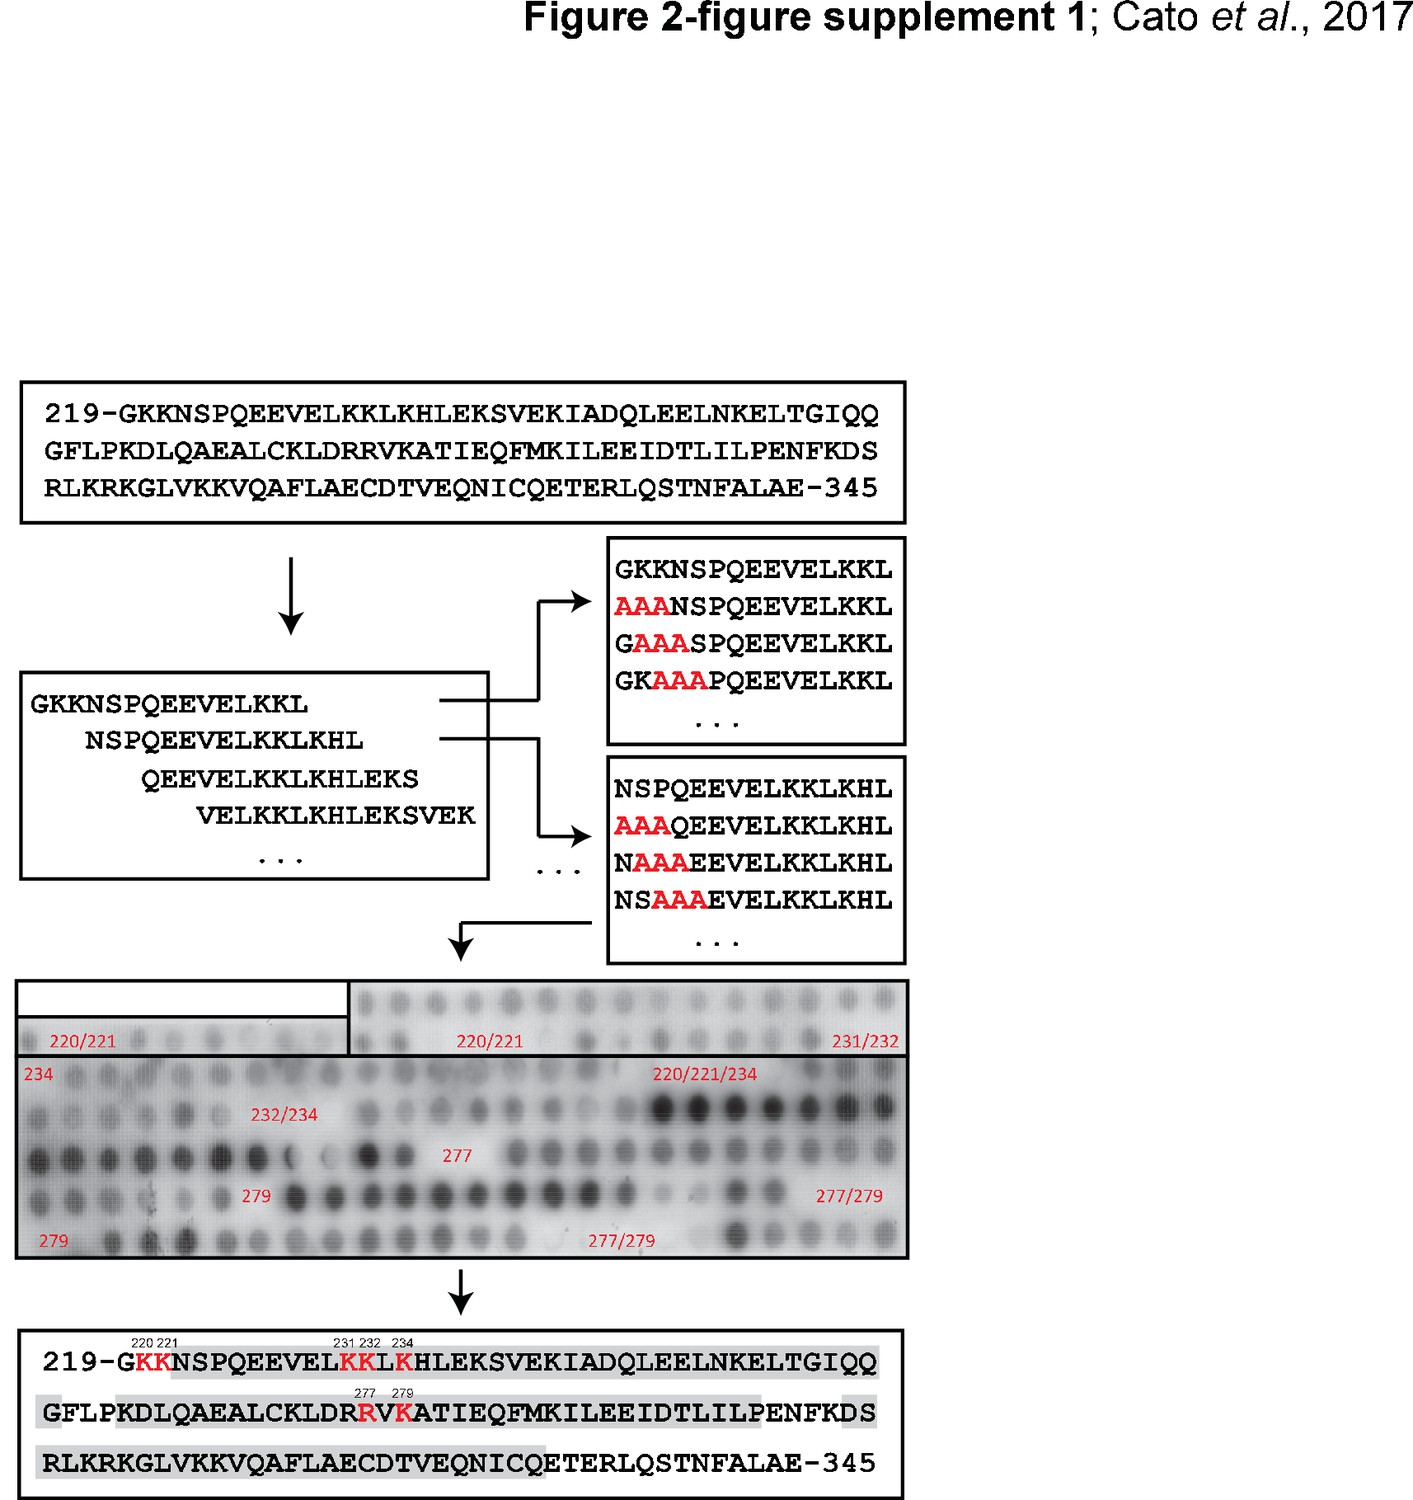
Schematic of the SPOT synthesis technology.
Mutant Bag-1L sequences (alanine substitutions shown in red) spanning the entire BAG domain of Bag-1L (residues 219–345) were bound to a membrane, incubated with GST-AR τau-5 and subsequently probed by Western blotting using an anti-GST antibody. Residues within non-binding regions are indicated in red. We identified seven residues (shown in red; residue numbers are indicated) critical for the interaction with AR τau-5 within the BAG domain. Residues involved in α-helix formation are highlighted in grey.
Figure 2—figure supplement 2
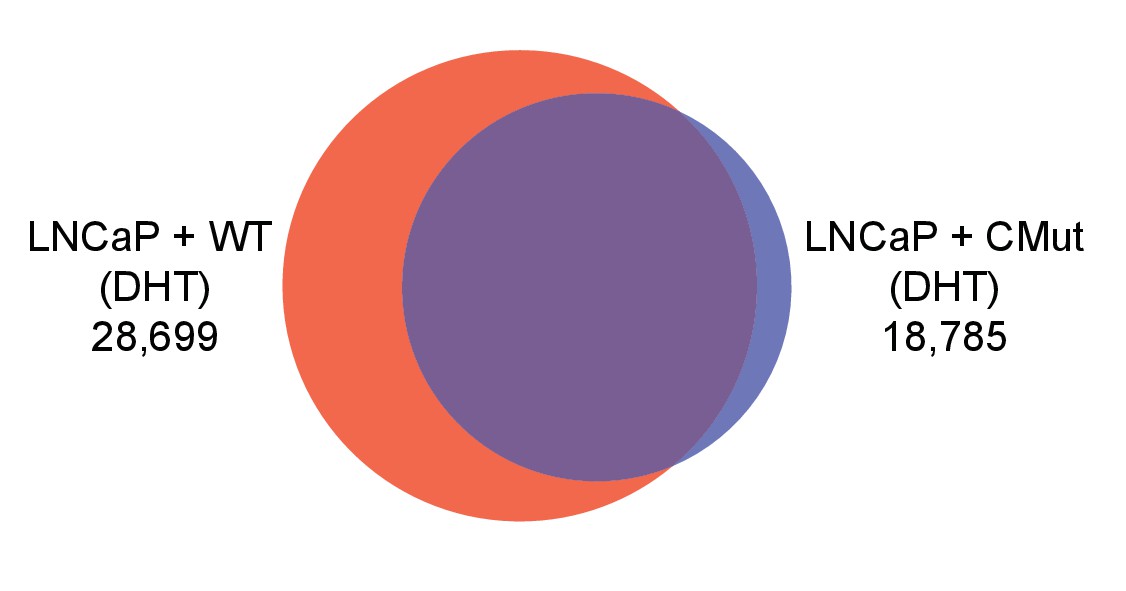
Overlap between AR cistromes in wild-type and CMut Bag-1L-expressing LNCaP cells.
Venn diagram of AR cistromes in wild-type (WT; red) and K231A/K232A/K279A mutant Bag-1L (CMut; blue) LNCaP cells, treated with 10 nM DHT for 4 hr. The union of binding sites is indicated.
Figure 2—figure supplement 3
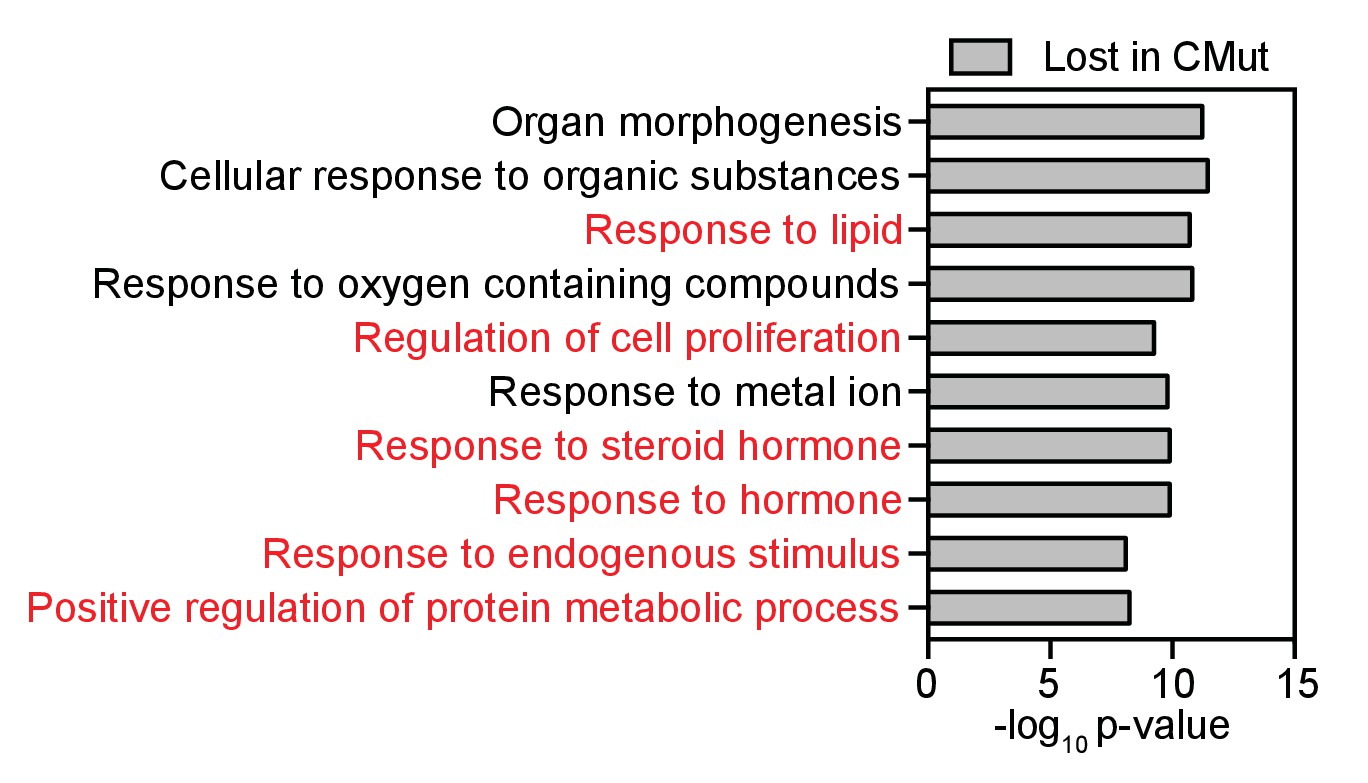
Top ten GO-terms (GSEA) associated with direct AR-target genes lost in the Bag-1L CMut- compared to the wild-type Bag-1L-expressing cells.
Direct AR-target genes were defined as genes with DHT-induced differential expression (p≤0.05, fold change ≥1.5) that harbor a DHT-responsive AR binding site within 50 kb of the TSS of said gene. GO-terms relevant to AR action are highlighted in red.
Figure 2—figure supplement 4
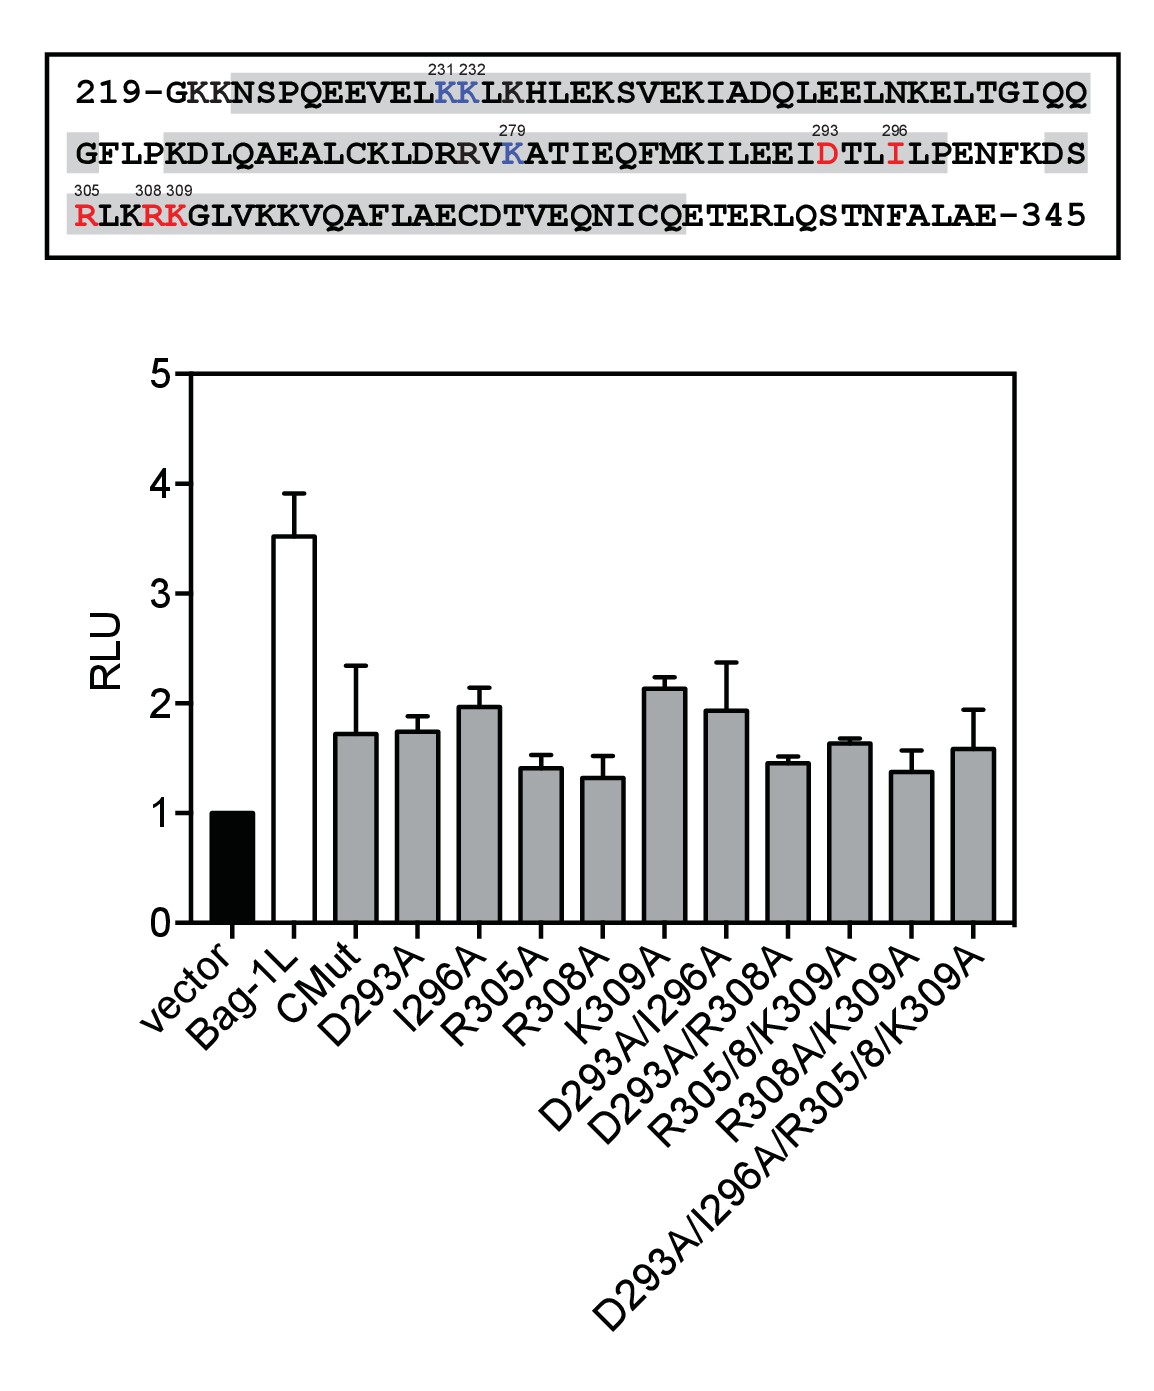
Conserved BAG domain mutations that inhibit the AR AF-1 transactivation.
Top, amino acid sequence of the BAG domain of Bag-1L (residues 219–345) with evolutionarily conserved residues highlighted in red and CMut (K231A/K232A/K279A) shown in blue. Residues involved in α-helix formation are highlighted in grey. Bottom, MMTV luciferase promoter assay in HeLa cells with MMTV luciferase construct, TK Renilla luciferase and ARΔLBD (amino acids 1–682), plus the indicated BAG domain mutants. The results are the mean of three independent experiments ± SD.
Figure 2—figure supplement 5
CBCACONH data of wild-type and CMut Bag-1L.
Superposition of CBCACONH of Bag-1L WT (black) and the K231/232/279A mutant (Bag-1L CMut; red). 1H 13C planes were extracted from the 3D spectrum at the indicated 15N values.
Figure 2—figure supplement 6
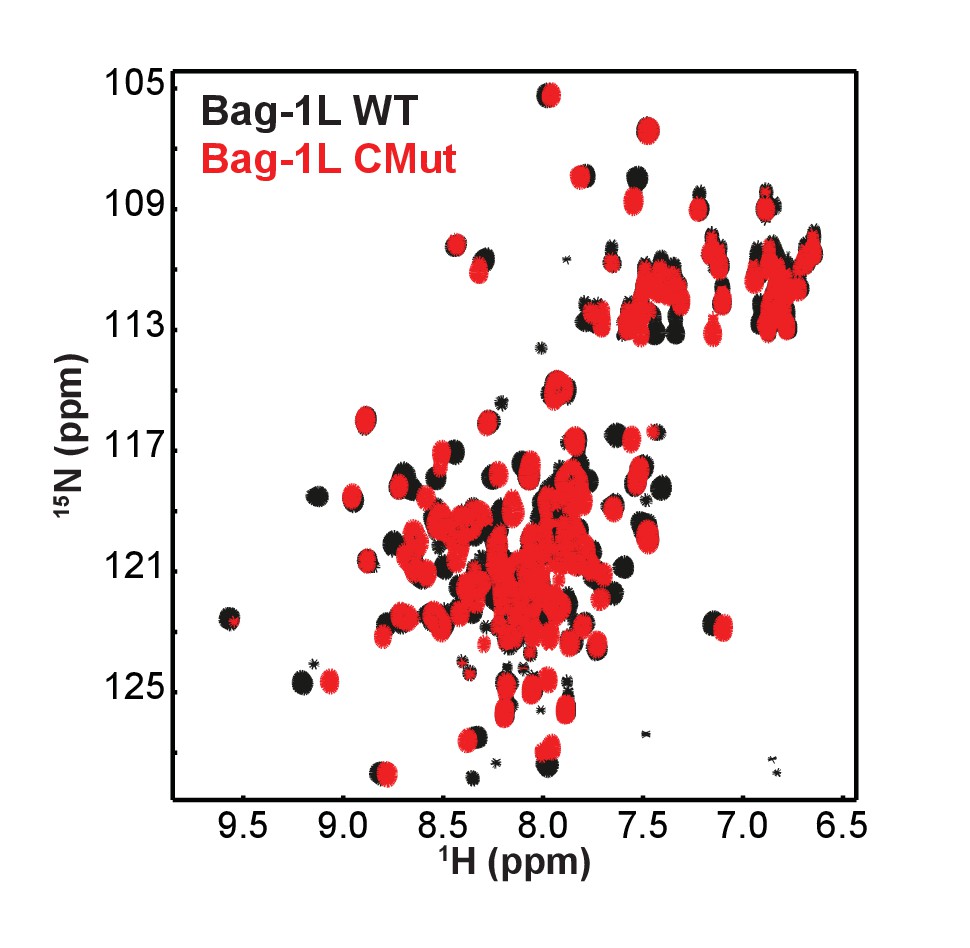
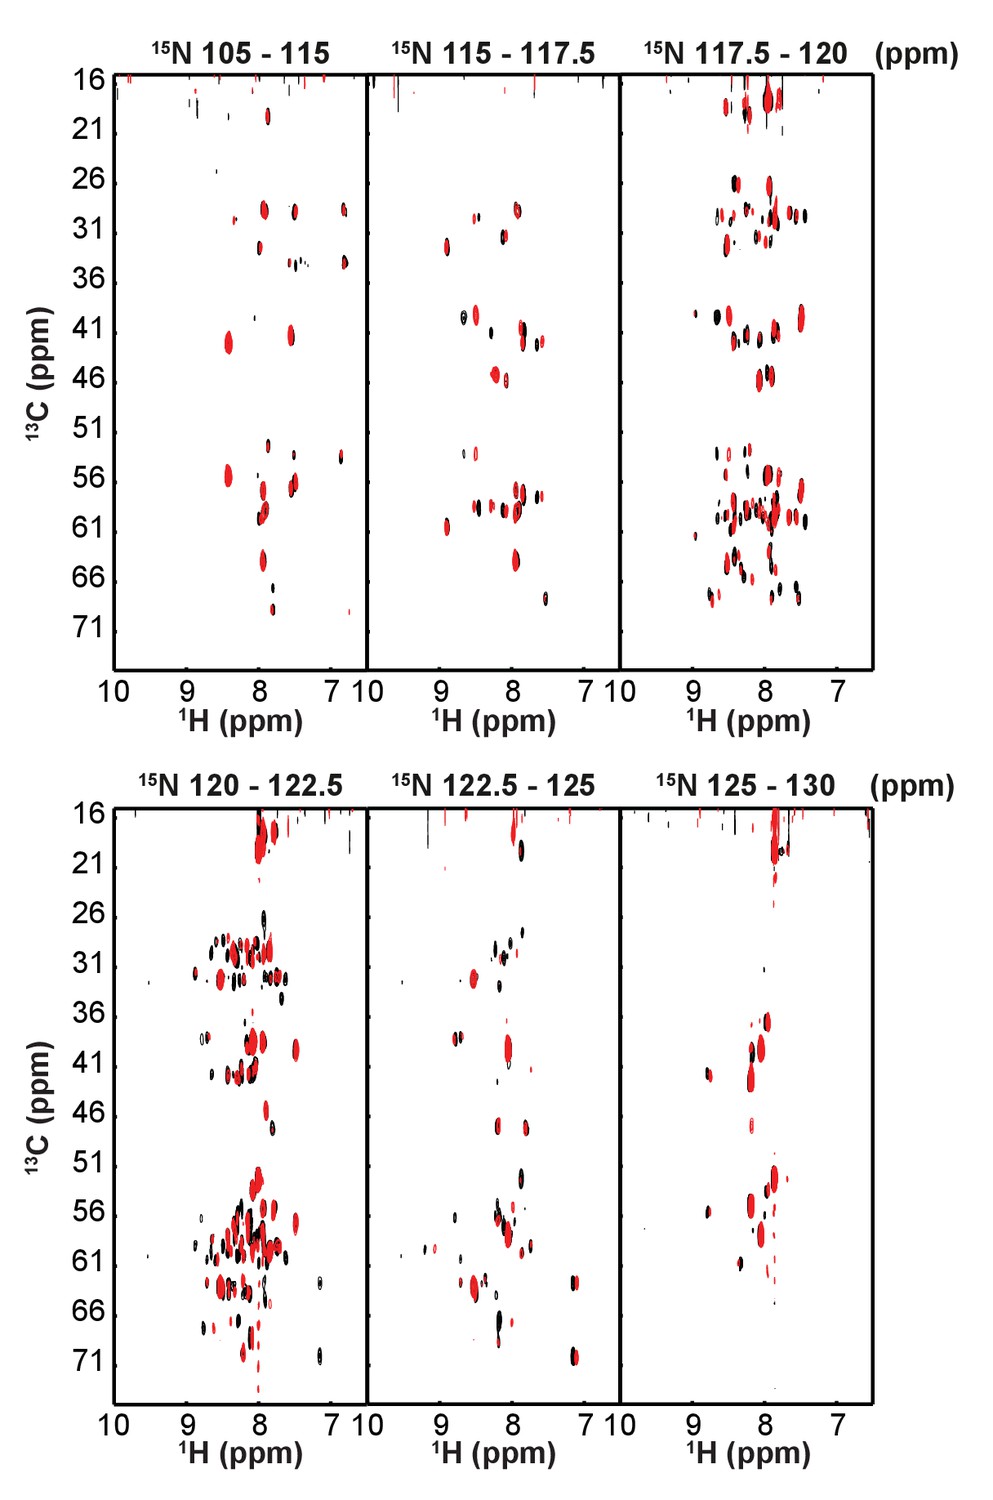
15N-HSQC spectra of wild-type and CMut Bag-1L.
Superposition of 15N-HSQC spectra of the BAG domain of Bag-1L WT (black) and the K231/232/279A mutant (Bag-1L CMut; red).
Figure 3

The BAG domain mutations decrease AR binding and overlap a druggable pocket.
(A) Top left: Normalized peak intensities of AR-AF-1 (residues 142–448) in the presence of GST (grey), or the GST-fused wild-type (blue) or K231/232/279A mutant BAG domain (red) of Bag-1L. A schematic of the τau-1 and τau-5 regions and the nascent secondary structure of these domains are shown. Partially folded helices are indicated by grey cylinders and regions with the propensity to adopt an extended conformation are indicated by black rectangles. Bottom and right: Close-up HSQC spectra of representative residues (as indicated) of AR-AF-1 alone (black) and in the presence of GST (grey), or the GST-fused wild-type (blue) or K231/232/279A mutant BAG domain (red) of Bag-1L. (B) 3D-model of the BAG domain of Bag-1L shown in blue, with the predicted druggable pocket highlighted in gold. (C) Rotations of the structure in (B) with the three residues (K231/232/279) within the BAG domain necessary for the interaction with AR indicated in red.
-
Figure 3—source data 1
Distinct 3D-snapshots of the BAG domain of Bag1/Bag-1L.
- https://doi.org/10.7554/eLife.27159.018
Figure 4
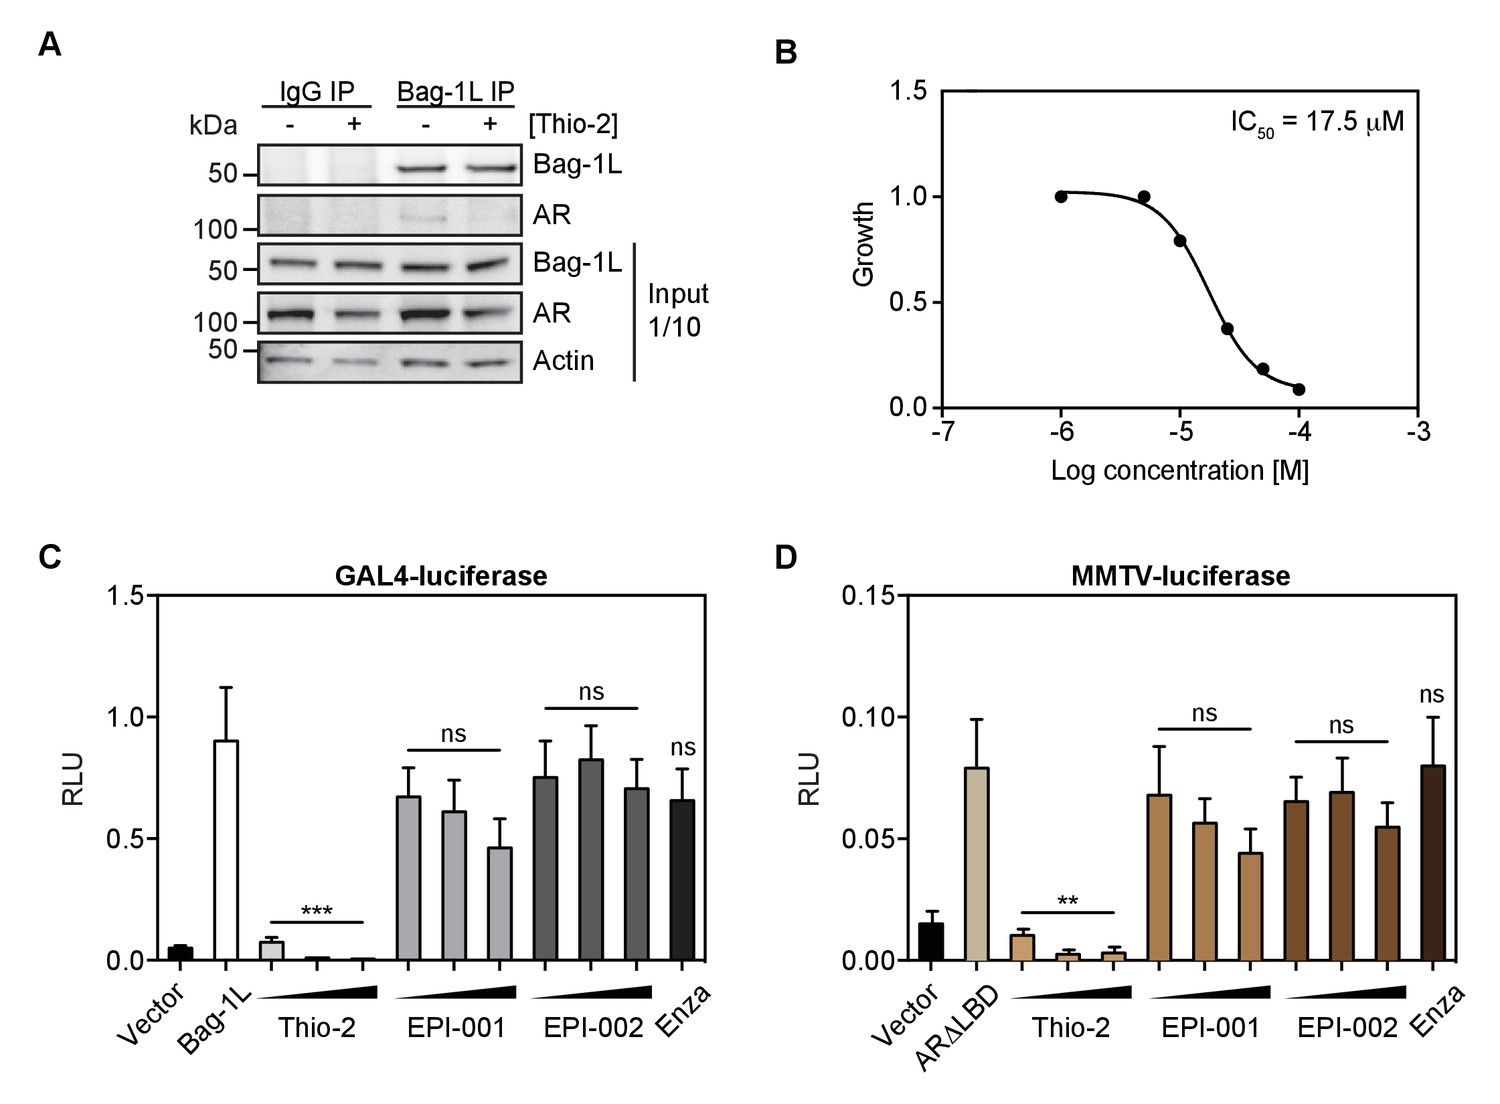
The thioflavin Thio-2 inhibits AR function and AR-dependent PCa growth.
(A) Co-immunoprecipitation of endogenous Bag-1L and AR in LNCaP cells, treated with or without 5 μM Thio-2 for 16 hr. A Bag-1L-specific antibody was employed for the IP and an antibody against AR was used to evaluate binding. IgG IP was carried out simultaneously as a negative control. One-tenth of the input samples are shown, to confirm equal protein loading. (B) LNCaP cells were grown in complete media and treated with indicated concentrations of Thio-2. IC50 values were determined after 72 hr using direct cell counts. Data are the averages of three independent experiments. (C) Mammalian one-hybrid assay in HeLa cells transfected with pG5ΔE4-38 luciferase, TK Renilla luciferase, pM-AR AF-1 and Bag-1L, and (increasing concentrations of) indicated inhibitors. The results are the mean of four independent experiments ± SEM. p-values were calculated using standard t test; ns: not significant; ***p<0.001. (D) MMTV luciferase promoter assay in HeLa cells with MMTV luciferase construct, TK Renilla luciferase and ARΔLBD (amino acids 1–682). The results are the mean of three independent experiments ± SEM. Enza: enzalutamide. p-values were calculated using standard t test; ns: not significant; **p≤0.01.
Figure 5 with 5 supplements
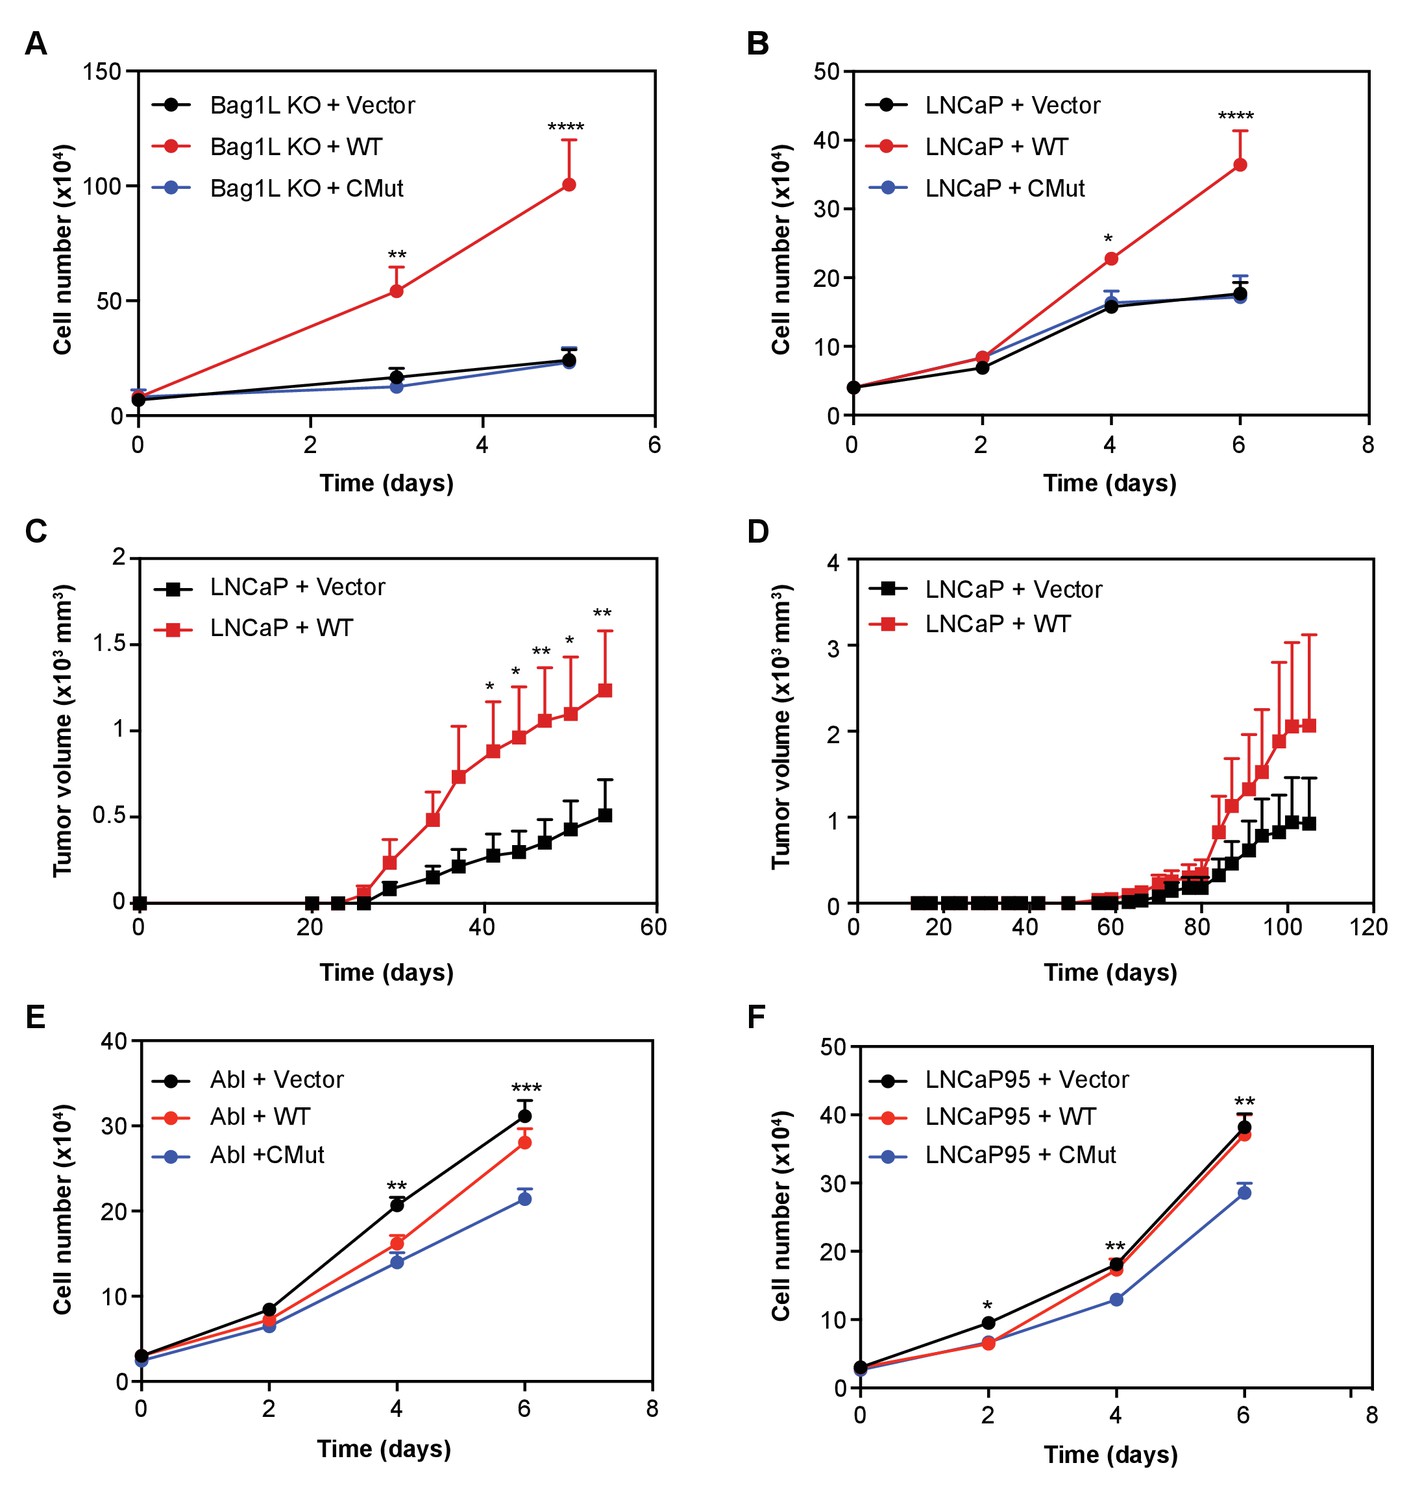
Bag-1L enhances hormone-dependent and -independent PCa cell growth.
LNCaP Bag-1L KO (Bag-1L KO (A)) or parental LNCaP cells (LNCaP (B)) were transfected with an empty retroviral construct (+Vector; black), or expression vectors for wild-type Bag-1L (+WT; red) or the Bag-1L K231/232/279A mutant (+CMut; blue). Cells were counted on indicated days by trypan blue exclusion. Data is represented as the mean of three independent experiments ± SEM. p-values were calculated using standard t test; *p≤0.05; **p≤0.01; ****p<0.001. (C, D) Cell lines described in (B) were injected in 10 intact (C) or 9 castrated, athymic nude mice (D) and tumor volumes were measured at the indicated time points after injection. Data are represented as mean ±SEM per assay point. p-values were calculated using standard t test; *: p≤0.05; **: p≤0.01. (E, F) Cell growth of LNCaP-abl (Abl, (E) or LNCaP95 cells (F) transfected with an empty retroviral construct (+Vector; black), or expression vectors for wild-type Bag-1L (+WT; red) or the Bag-1L K231/232/279A mutant (+CMut; blue). Cells were counted on indicated days by trypan blue exclusion. Data is represented as the mean of three independent experiments ± SEM. p-values were calculated using standard t test; *p≤0.05; **p≤0.01; ****p<0.001.
Figure 5—figure supplement 1
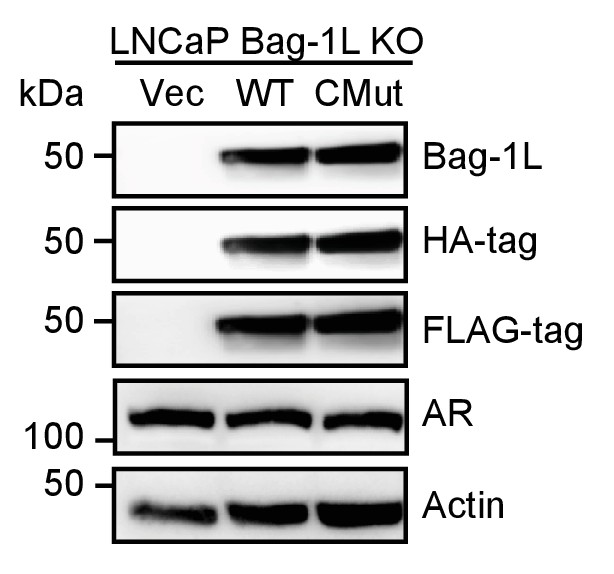
Western blot of Bag-1L KO rescue cell lines.
LNCaP Bag-1L KO cells were stably transfected with an empty retroviral vector (Vec) or expression vectors for FLAG-HA-tagged wild-type Bag-1L (WT) or the Bag-1L K231/232/279A mutant (CMut). Expression levels of Bag-1L were determined using antibodies against Bag-1, and FLAG- or HA-tag. AR levels and equal protein loading were determined with anti-AR and -actin antibodies, respectively.
Figure 5—figure supplement 2
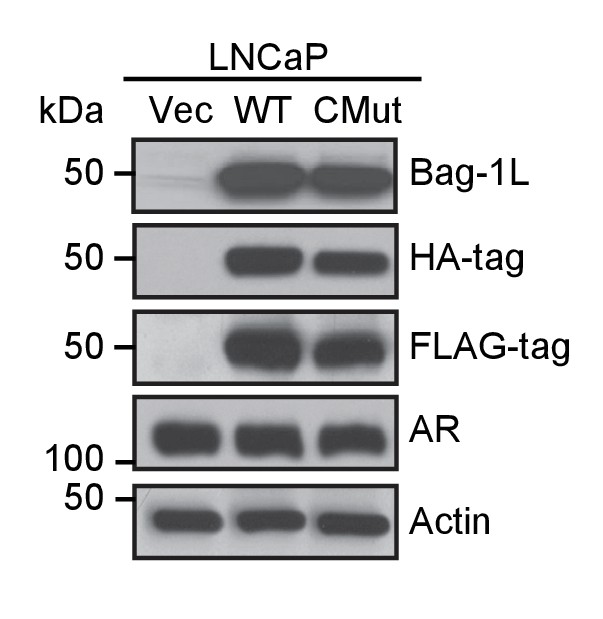
Western blot of Bag-1L over-expression cell lines.
LNCaP cells were stably transfected with an empty retroviral vector (Vec) or expression vectors for FLAG-HA-tagged wild-type Bag-1L (WT) or the Bag-1L K231/232/279A mutant (CMut). Expression levels of Bag-1L were determined using antibodies against Bag-1, and FLAG- or HA-tag. AR levels and equal protein loading were determined with anti-AR and -actin antibodies, respectively.
Figure 5—figure supplement 3
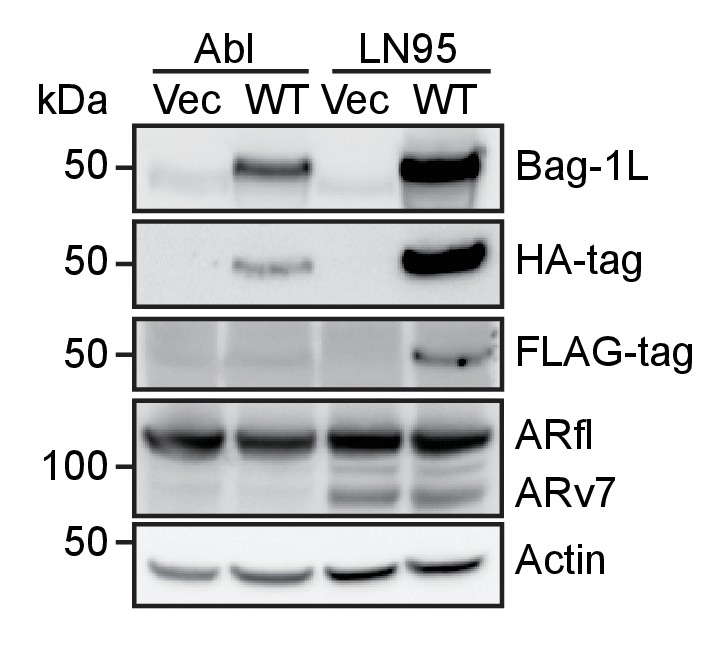
Western blot of wild-type Bag-1L over-expression CRPC lines.
LNCaP-abl (Abl) or LNCaP95 cells (LN95) were stably transfected with an empty retroviral vector (Vec) or expression vectors for FLAG-HA-tagged wild-type Bag-1L (WT). Expression levels of Bag-1L were determined using antibodies against Bag-1, and FLAG- or HA-tag. AR levels and equal protein loading were determined with anti-AR and -actin antibodies, respectively.
Figure 5—figure supplement 4

Western blot comparison of endogenous Bag-1L levels in PCa and CRPC lines.
Endogenous Bag-1L levels, as determined by an antibody against Bag-1, in hormone-dependent LNCaP (LN) cells and in the CRPC lines LNCaP-abl (Abl) and LNCaP95 (LN95). AR levels and equal protein loading are shown, utilizing anti-AR and -actin antibodies, respectively.
Figure 5—figure supplement 5
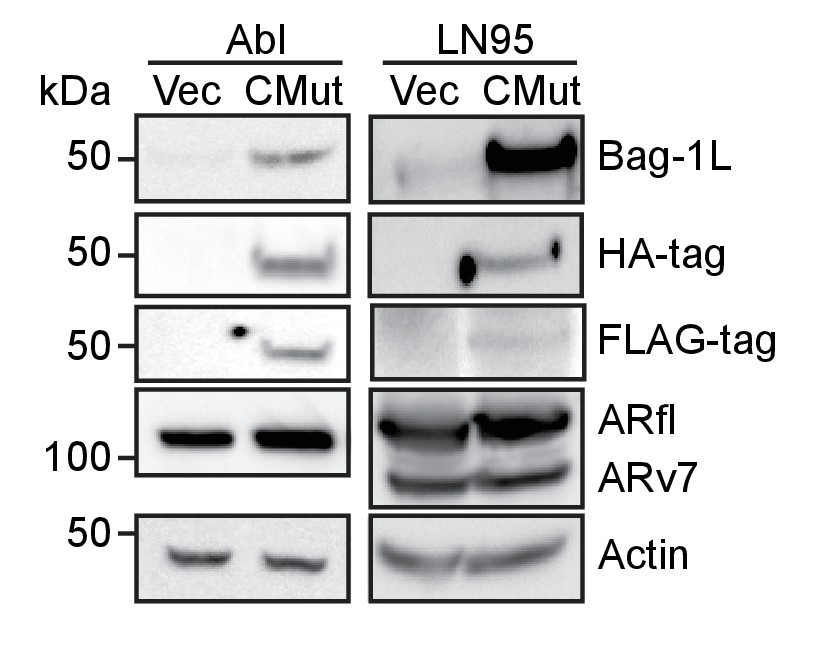
Western blot of BAG domain mutant Bag-1L over-expression CRPC lines.
LNCaP-abl (Abl) or LNCaP95 cells (LN95) were stably transfected with an empty retroviral vector (Vec) or expression vectors for FLAG-HA-tagged Bag-1L K231/232/279A mutant (CMut). Expression levels of Bag-1L were determined using antibodies against Bag-1, and FLAG- or HA-tag. AR levels and equal protein loading were determined with anti-AR and -actin antibodies, respectively.
Figure 6 with 5 supplements
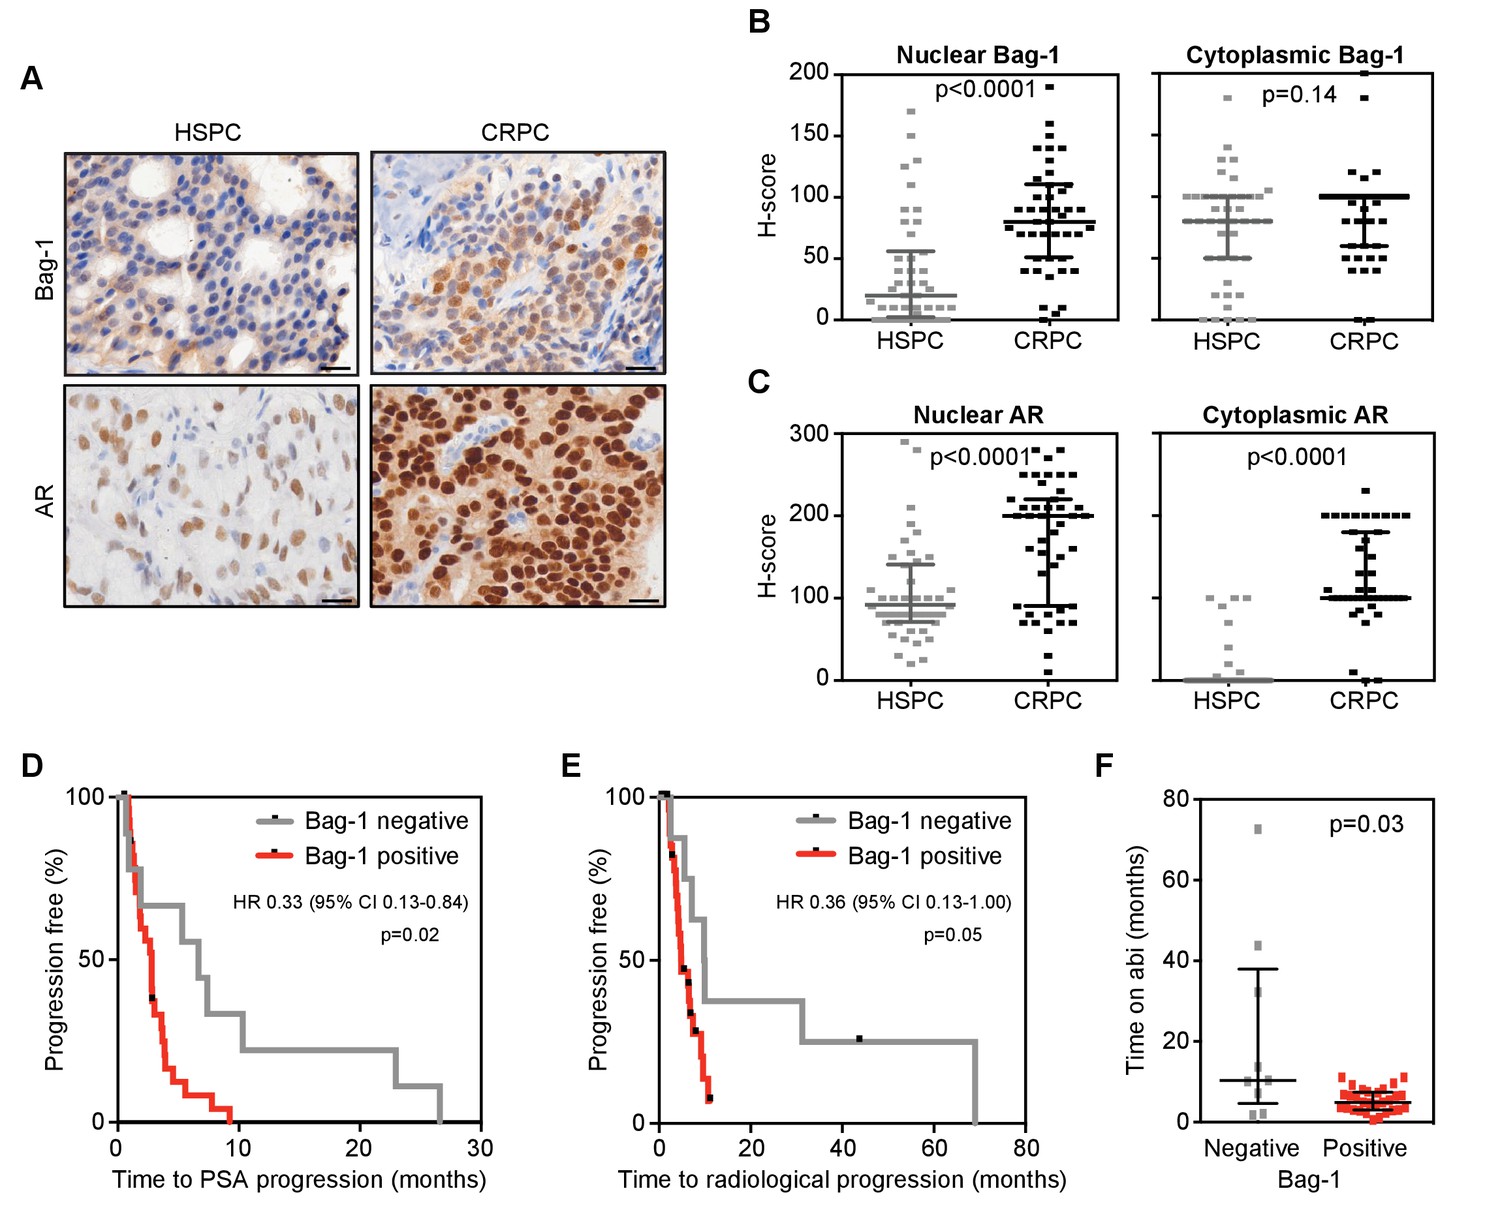
Nuclear Bag-1 levels increased from hormone naïve to CRPC status in PCa patients.
(A) Representative immunohistochemistry images of AR and Bag-1 detection in HSPC and CRPC. Scale bars: 20 μm. (B, C) Expression (H-score) of nuclear and cytoplasmic Bag-1 (B) and AR (C) in 43 matched patient samples at HSPC and CRPC. Median H-score and interquartile range is shown. p-values were calculated using Wilcoxon matched-pair signed rank test. (D, E) Kaplan-Meier curves of time to PSA (D) or radiological progression (E) on abiraterone treatment, for nuclear Bag-1 positive (red; n = 29) and negative (grey; n = 9) patients (at HSPC). Hazard ratios (HR) with 95% confidence intervals (95% CI) and p-values for univariate cox survival model are shown. (F) Time on abiraterone for patients, negative (grey) or positive (red) for Bag-1 staining at HSPC. Median time and interquartile range is shown. p-value represents the Mann-Whitney test.
Figure 6—figure supplement 1
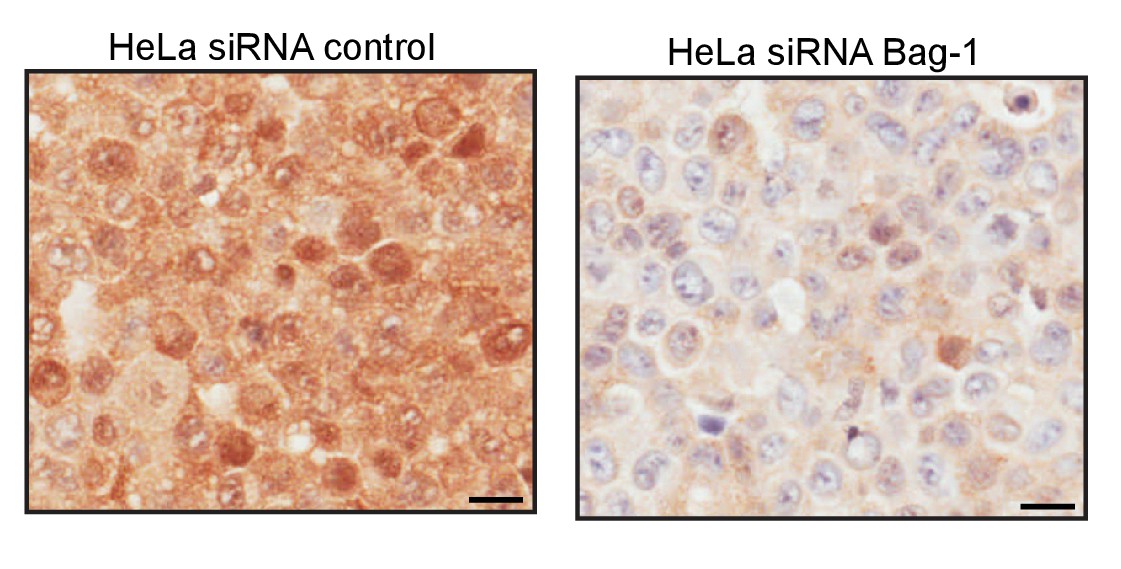
IHC control in response to Bag-1 knock-down.
IHC of HeLa cells transfected with either control siRNA or Bag-1 siRNA and probed with anti-Bag-1 antibody. Scale bars represent 20 μm.
Figure 6—figure supplement 2
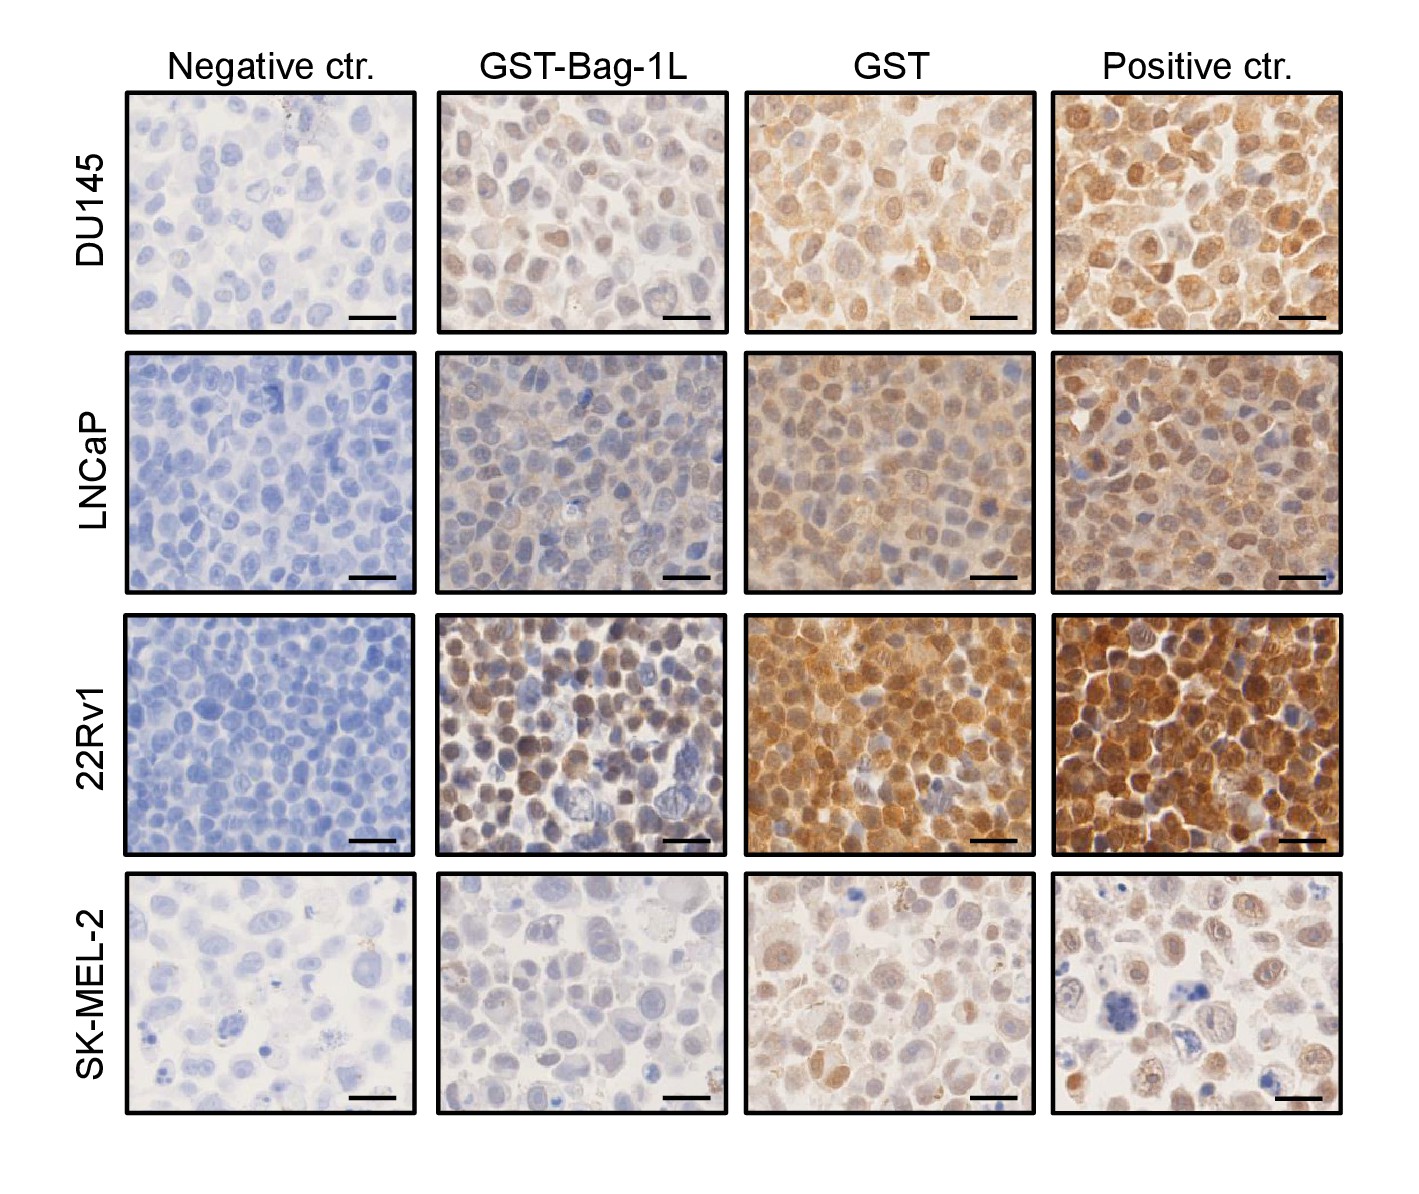
Cell line validation of Bag-1 antibody for IHC.
IHC of Bag-1 in indicated cell lines depleted with GST-Bag-1L or GST alone, as a control. Negative (no antibody added) and positive controls (no antibody depletion) are shown. SK-MEL-2 is a cell line with low Bag-1 expression. Scale bars represent 20 μm.
Figure 6—figure supplement 3
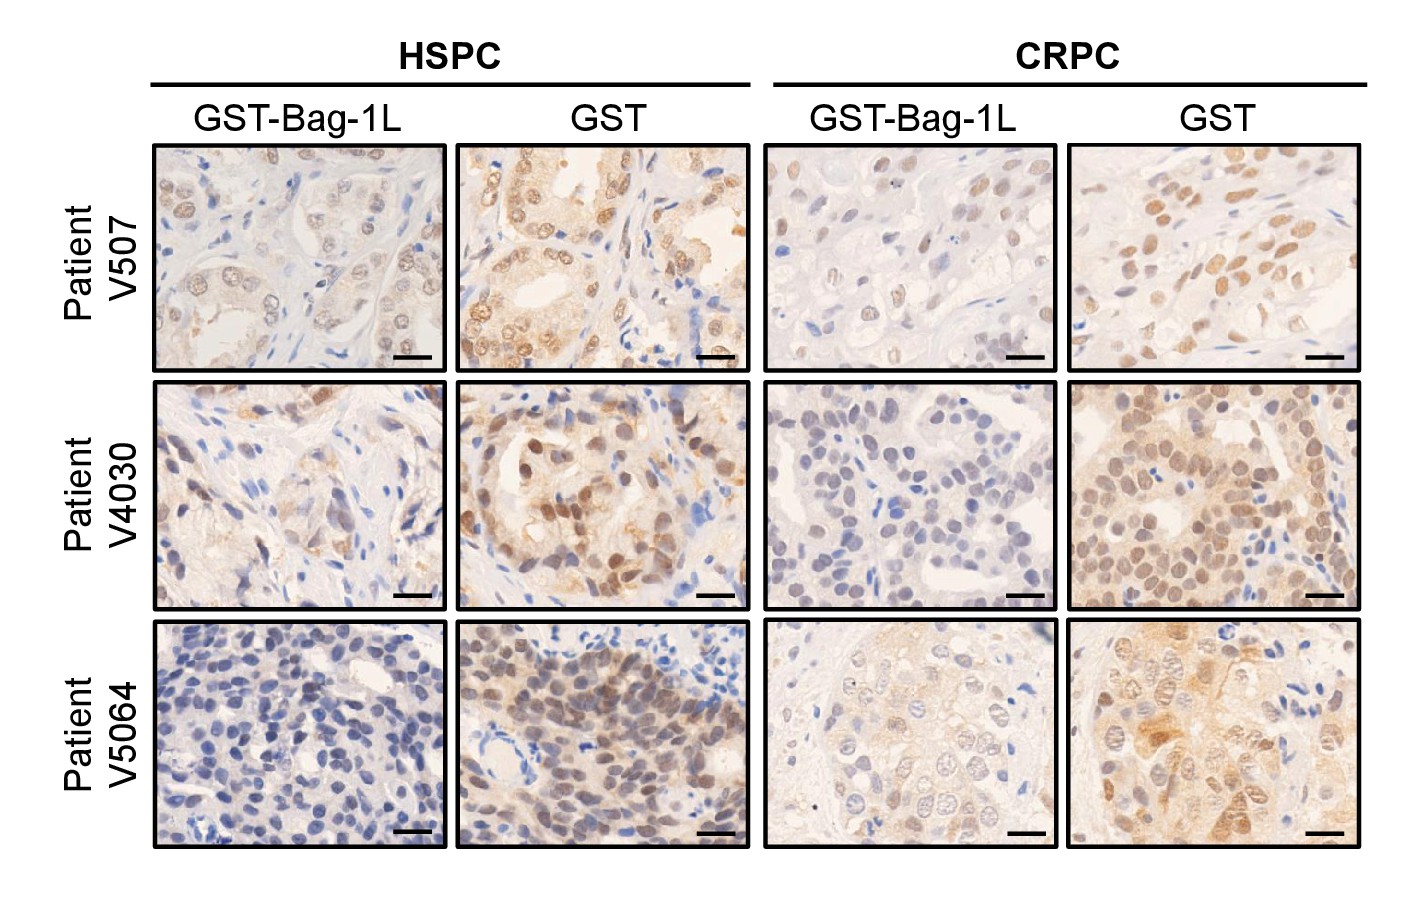
Validation of Bag-1 antibody for IHC using patient samples.
IHC of Bag-1 in patient samples depleted with GST-Bag-1L or GST alone, as a control. Scale bars represent 20 μm.
Figure 6—figure supplement 4
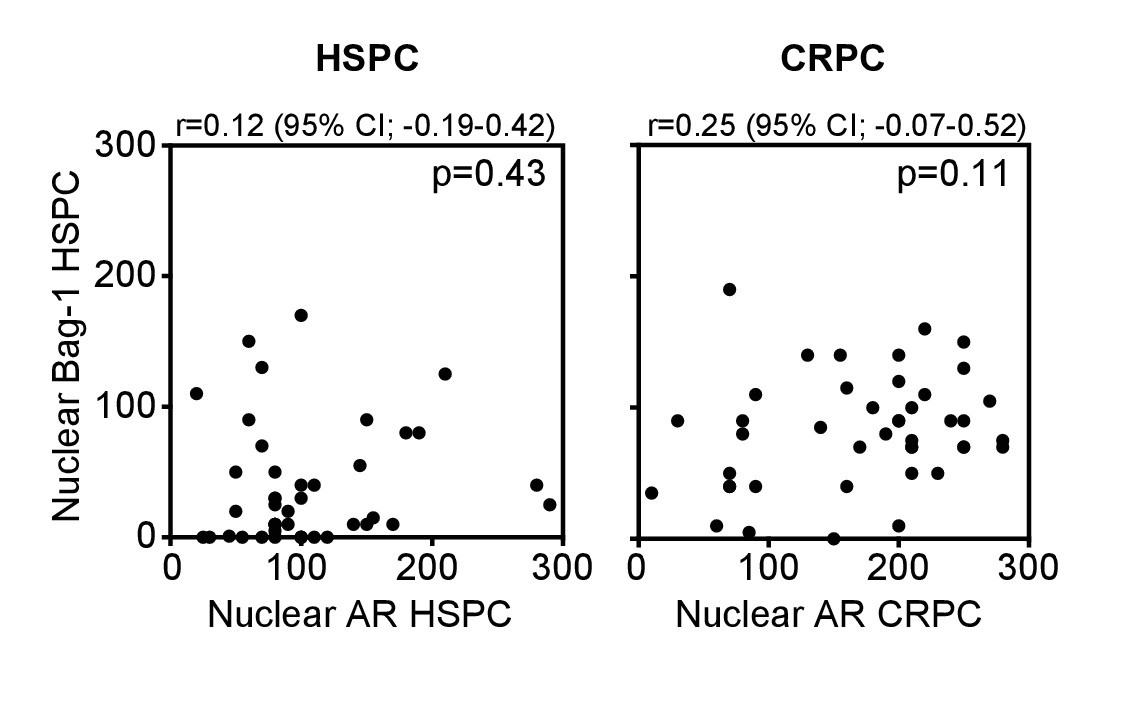
Correlation between nuclear Bag-1 and AR expression in HSPC and CRPC patient samples.
Spearman’s rank correlation test is shown.
Figure 6—figure supplement 5
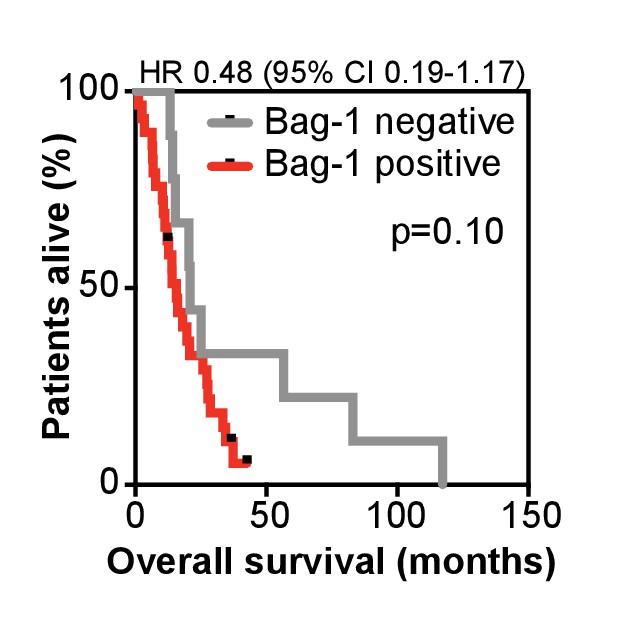
Kaplan-Meier curve of overall survival on abiraterone treatment.
Data is shown for nuclear Bag-1 positive (red; n = 29) and negative (grey; n = 9) patients (at HSPC). Hazard ratio (HR) with 95% confidence intervals (95% CI) and p-value for univariate cox survival model are shown.
Figure 7
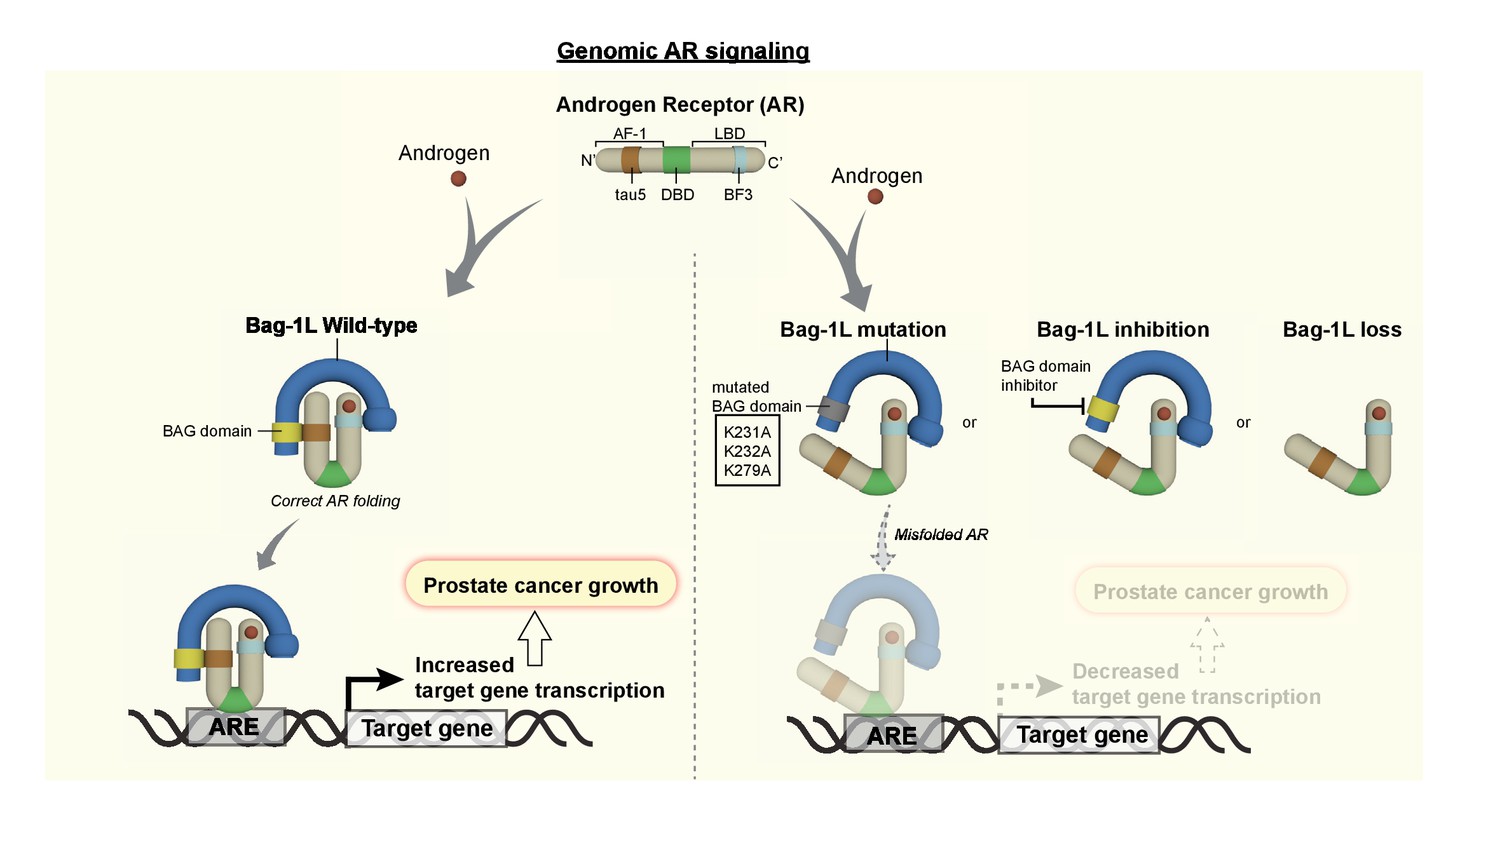
The Bag-1L is a promising target for the inhibition of the AR NTD.
The function of Bag-1L in PCa is to promote the correct folding of the AR, augment its affinity for chromatin and regulate its transcriptional activity. Loss of Bag-1L, or mutation or inhibition of its BAG domain, leads to the abrogation of these processes and hence reduction of PCa growth.
Tables
Table 1
Clinical characteristics of patients at HSPC biopsy and initiation of abiraterone treatment.
HSPC: hormone sensitive biopsy, CRPC: castration-resistant prostate cancer, ECOG PS: Eastern Cooperative Oncology Group performance status, IQR: interquartile range, SD: standard deviation, NA: not available, PSA: prostate specific antigen, n: number, pts: patients.
| Overall 38 pts | Bag-1 negative 9 pts | Bag-1 positive 29pts | p-value | ||
|---|---|---|---|---|---|
| At diagnostic (archival) HSPC biopsy | Biopsy Gleason score, n (%) | ||||
| ≤6 | 2 (5) | 0 (0) | 2 (7) | 0.40† | |
| 7 | 7 (18) | 4 (44) | 3 (10) | ||
| 8–10 | 27 (71) | 5 (56) | 22 (76) | ||
| NA | 2 (5) | 0 (0) | 2 (7) | ||
| Metastatic at diagnosis, n (%) | |||||
| No | 17 (45) | 2 (22) | 15 (52) | 0.25§ | |
| Yes | 14 (37) | 4 (44) | 10 (34) | ||
| NA | 7 (18) | 3 (33) | 4 (14) | ||
| Primary therapy, n (%) | |||||
| Prostatectomy | 4 (11) | 0 (0) | 4 (14) | 0.65§ | |
| Radiotherapy | 13 (34) | 3 (33) | 10 (34) | ||
| Systemic therapy | 21 (55) | 6 (67) | 15 (52) | ||
| PSA at diagnosis, μg/L | |||||
| Median | 46.0 | 61.0 | 29.0 | 0.30* | |
| IQR | 13.1–105.9 | 28.8–150.0 | 10.0–96.6 | ||
| At initiation of abiraterone treatment | Age, yr | ||||
| Median | 69.2 | 69.5 | 69.0 | 0.59* | |
| IQR | 65.5–73.3 | 61.6–74.1 | 66.1–73.3 | ||
| Sites of metastasis, n (%) | |||||
| Node only | 4 (11) | 0 (0) | 4 (14) | 0.57§ | |
| Bone only | 28 (74) | 7 (78) | 21 (72) | ||
| Visceral (with/without bone) | 6 (16) | 2 (22) | 4 (14) | ||
| ECOG PS, n (%) | |||||
| 0 | 12 (32) | 6 (67) | 6 (21) | 0.05§ | |
| 1 | 24 (63) | 3 (33) | 21 (72) | ||
| 2 | 2 (5) | 0 (0) | 2 (7) | ||
| PSA, μg/L | |||||
| Median | 185.5 | 222.0 | 147.0 | 0.77* | |
| IQR | 83.8–445.8 | 51.2–781.5 | 88.0–363.0 | ||
| Hemoglobin, g/L | |||||
| Mean | 118.1 | 124.4 | 116.2 | 0.18‡ | |
| SD | 16.0 | 16.3 | 15.7 | ||
| Alkaline phosphatase, U/L | |||||
| Median | 131.0 | 133.0 | 129.0 | 0.85* | |
| IQR | 69.0–230.5 | 64.5–250.5 | 70.0–231.0 | ||
| Lactate dehydrogenase, U/L | |||||
| Median | 178.0 | 161.0 | 192.0 | 0.08* | |
| IQR | 155.5–247.0 | 149.5–190.0 | 160.0–287.0 | ||
| NA | 2 | 0 | 2 | ||
| Albumin, g/L | |||||
| Mean | 35.8 | 37.8 | 35.2 | 0.17‡ | |
| SD | 4.8 | 2.4 | 5.2 | ||
| Previous treatments for CRPC, n (%) | |||||
| Docetaxel | 27 (71) | 5 (55) | 22 (76) | 0.40§ | |
| Enzalutamide | 2 (5) | 0 (0) | 2 (7) | 1.00§ | |
| Cabazitaxel | 5 (13) | 0 (0) | 5 (17) | 0.31§ | |
| Subsequent treatments for CRPC, n (%) | |||||
| Docetaxel | 8 (21) | 4 (44) | 4 (14) | 0.07§ | |
| Enzalutamide | 7 (18) | 1 (11) | 6 (21) | 1.00§ | |
| Cabazitaxel | 15 (39) | 5 (55) | 10 (34) | 0.44§ | |
-
*Mann-Whitney test
†Chi-square test for trend
-
‡Unpaired t test
§Fisher’s exact test
-
Table 1—source data 1
Association of nuclear Bag-1 or AR expression with clinical benefits from abiraterone therapy.
HSPC: hormone sensitive prostate cancer, CRPC: castration-resistant prostate cancer, PSA: prostate specific antigen, HR: hazard ratio, 95% CI: 95% confidence intervals. a Univariate cox survival model.
- https://doi.org/10.7554/eLife.27159.033
-
Table 1—source data 2
Clinical characteristics of patients at time of castration-resistant prostate cancer biopsy.
CRPC: castration-resistant prostate cancer, ECOG PS: Eastern Cooperative Oncology Group performance status, IQR: interquartile range, SD: standard deviation, PSA: prostate specific antigen, n: number, pts: patients. at-test from linear regression model of Nuclear Bag-1 H-score at the time of CRPC biopsy bWald test from linear regression model of Nuclear Bag-1 H-score at the time of CRPC biopsy
- https://doi.org/10.7554/eLife.27159.034
Additional files
-
Transparent reporting form
- https://doi.org/10.7554/eLife.27159.036
Download links
A two-part list of links to download the article, or parts of the article, in various formats.
Downloads (link to download the article as PDF)
Open citations (links to open the citations from this article in various online reference manager services)
Cite this article (links to download the citations from this article in formats compatible with various reference manager tools)
Development of Bag-1L as a therapeutic target in androgen receptor-dependent prostate cancer
eLife 6:e27159.
https://doi.org/10.7554/eLife.27159


