Unexpected sequences and structures of mtDNA required for efficient transcription from the first heavy-strand promoter
- The Pennsylvania State University, United States
- Northeastern University, United States
- Mayo Clinic College of Medicine, United States
Figures
Figure 1 with 3 supplements
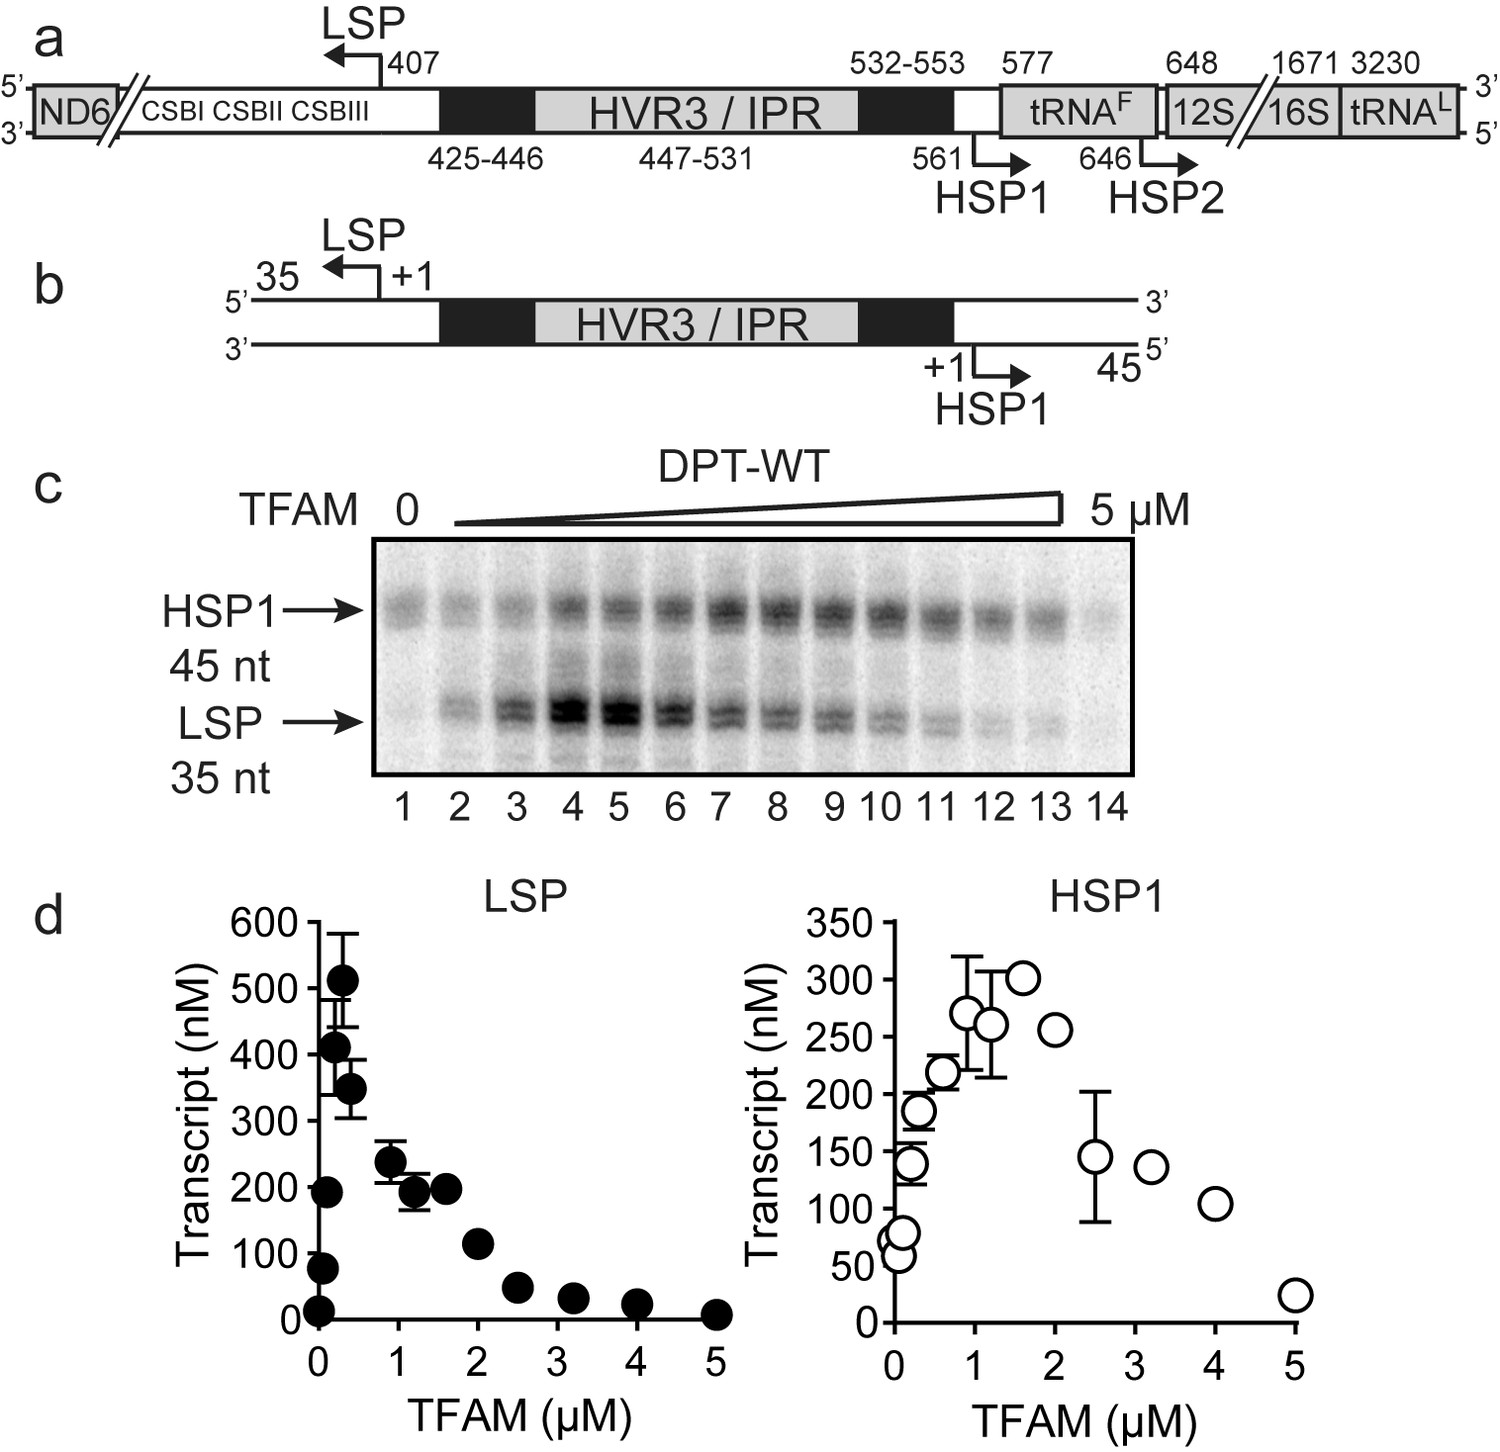
Dual promoter template.
(a) Schematic of the mtDNA transcriptional control region including the three promoters: LSP, HSP1 and HSP2; and interpromoter region (IPR), also known as hypervariable region 3 (HVR3). The relative positions of conserved sequence boxes (CSB I, II and III), ND6, tRNAF, 12S and 16S rRNA genes are shown. Numbering according to the standard Cambridge mtDNA sequence. Black boxes indicate the putative TFAM binding sites. (b) Dual promoter DNA oligonucleotide (234 bp) template containing LSP, HSP1 and HVR3/IPR used for in vitro transcription reactions. This oligo gives rise to LSP and HSP1 derived RNA transcripts 35 and 45 nts long, respectively. (c) Run-off transcription products using the dual promoter DNA oligo template (DPT-WT) and increasing concentrations of TFAM (0–5 µM) resolved by denaturing PAGE. (d) Amount of LSP (35 nt) and HSP1 (45 nt) RNA transcripts produced using the dual promoter construct plotted as a function of TFAM concentration. Data are means from three independent experiments. Error bars represent ± S.E.M.
Figure 1—figure supplement 1
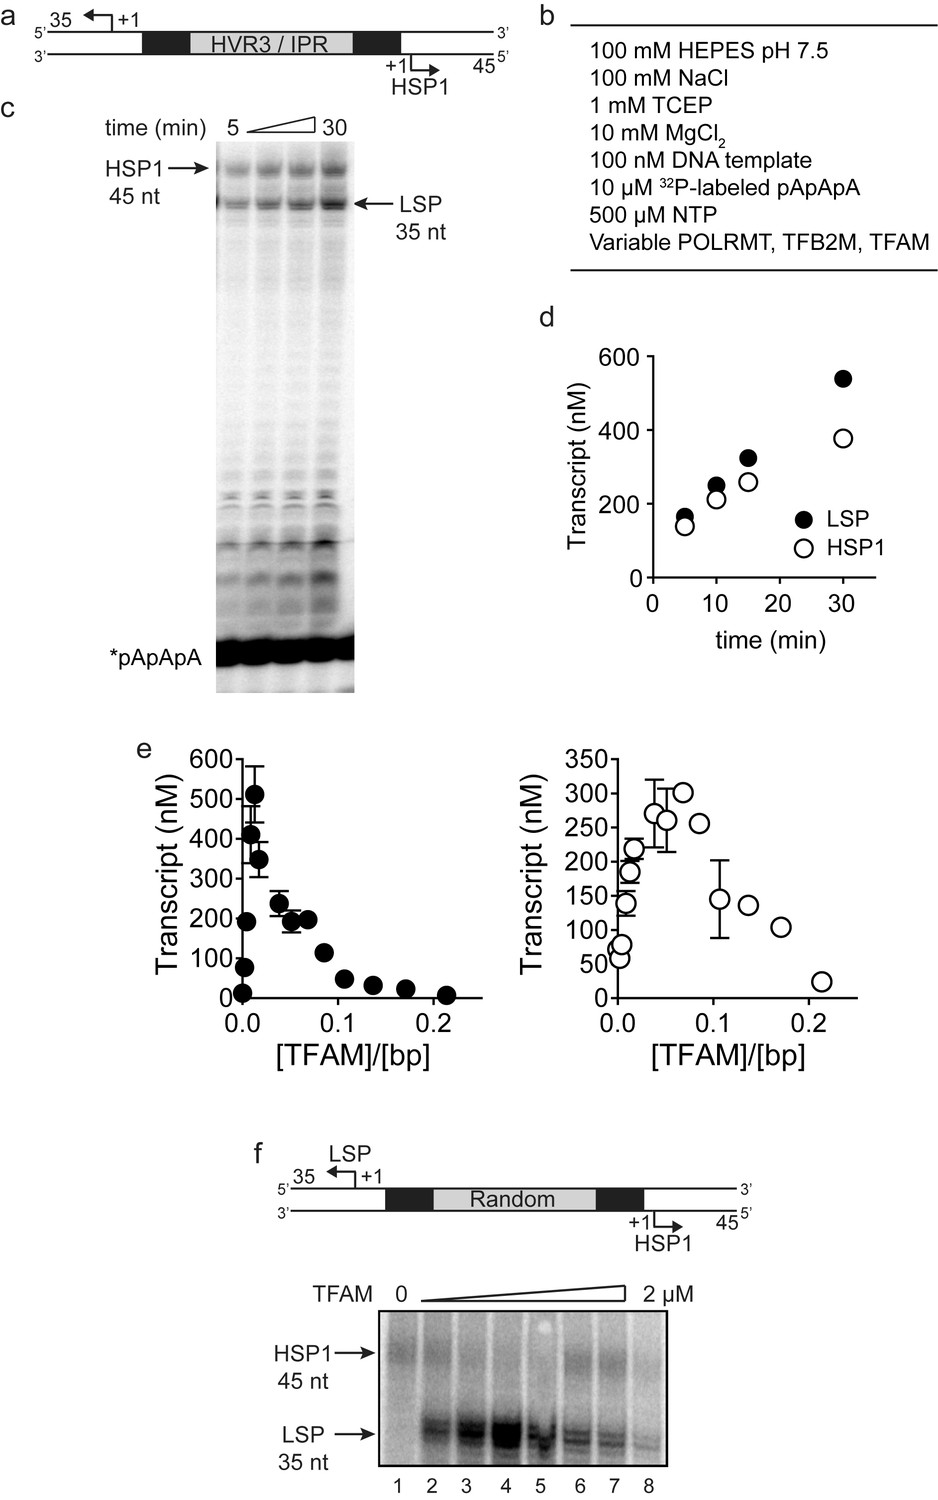
Dual promoter template: Time course and reaction conditions.
(a) Dual promoter DNA oligonucleotide (234 bp) template containing LSP, HSP1 and HVR3/IPR used for in vitro transcription reactions. This oligo gives rise to LSP- and HSP1-derived RNA transcripts 35 and 45 nt long, respectively. (b) In vitro reaction conditions employed for mitochondrial transcription assays. (c) Run-off transcription products using the dual promoter DNA oligo template as a function of time resolved by denaturing PAGE. Concentrations of mitochondrial transcription proteins were 600 nM TFAM, 1000 nM TFB2M and 1000 nM POLRMT. (d) Amount of LSP (35 nt) and HSP1 (45 nt) RNA transcripts produced using the dual promoter construct plotted as a function of time. Time courses were linear over 30 min. (e) Amount of LSP (35 nt) and HSP1 (45 nt) RNA transcripts produced using the dual promoter construct plotted as a function of TFAM concentration per bp. Data are means from three independent experiments. Error bars represent ± S.E.M. (f) Dual promoter DNA oligonucleotide template with the IPR sequence randomized. Run-off transcription products using the IPR randomized dual promoter DNA oligo template and increasing concentrations of TFAM (0–2 µM) resolved by denaturing PAGE.
Figure 1—figure supplement 2
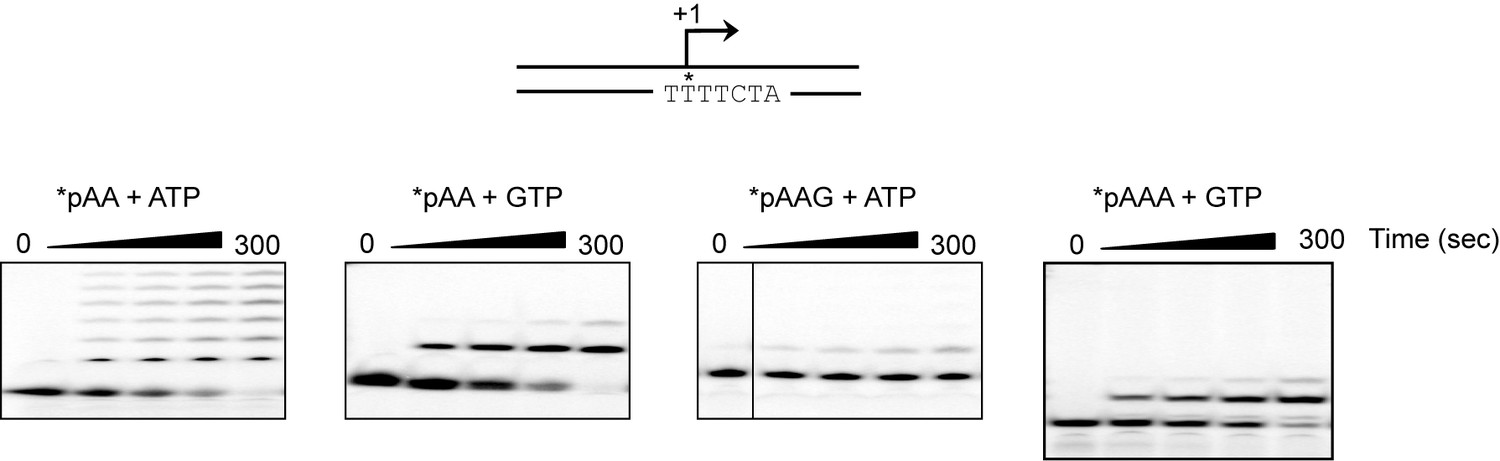
The adenylate homotrimer, pAAA, is specifically and efficiently used for transcription initiation, whereas the pAA and pAAG primers are not.
Schematic of the LSP is shown illustrating the sequence surrounding the transcription start site. Transcription products from LSP using either pAA, pAAG or pAAA primers and ATP or GTP as nucleoside triphosphate substrates. The use of the pAA primer leads to slippage synthesis in the presence of ATP. The pAA primer can be extended to pAAG with GTP as nucleoside triphosphate substrate, which likely occurs by being misaligned in the open complex during initiation. The pAAG primer is not used efficiently for transcription initiation. The pAAA primer is efficiently extended to pAAAG.
Figure 1—figure supplement 3
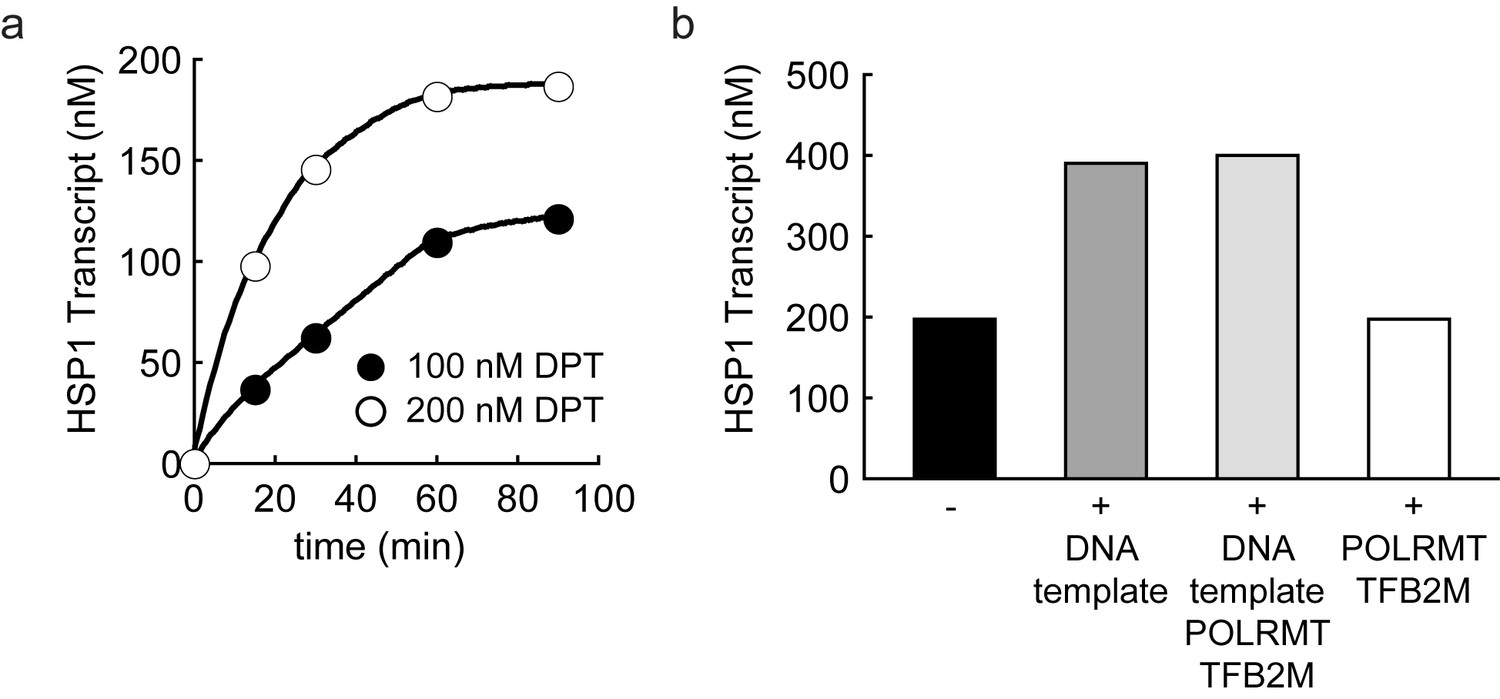
Dual promoter construct: TFAM-independent activity.
(a) Amount of HSP1 RNA transcript produced using either 100 or 200 nM dual promoter template in the absence of TFAM over the course of a 90 min reaction. The maximum amount of transcript produced in the absence of TFAM is equivalent to the template concentration. (b) Amount of HSP1 RNA transcript produced in the absence of TFAM with 200 nM DNA template when at the 60 min time point either more dual promoter template and/or more POLRMT/TFB2M were added to the reaction. No additional transcript is produced when more POLRMT/TFB2M were added to the reaction. Additional transcript is produced when more template is added in the absence or presence of more POLRMT/TFB2M.
Figure 2
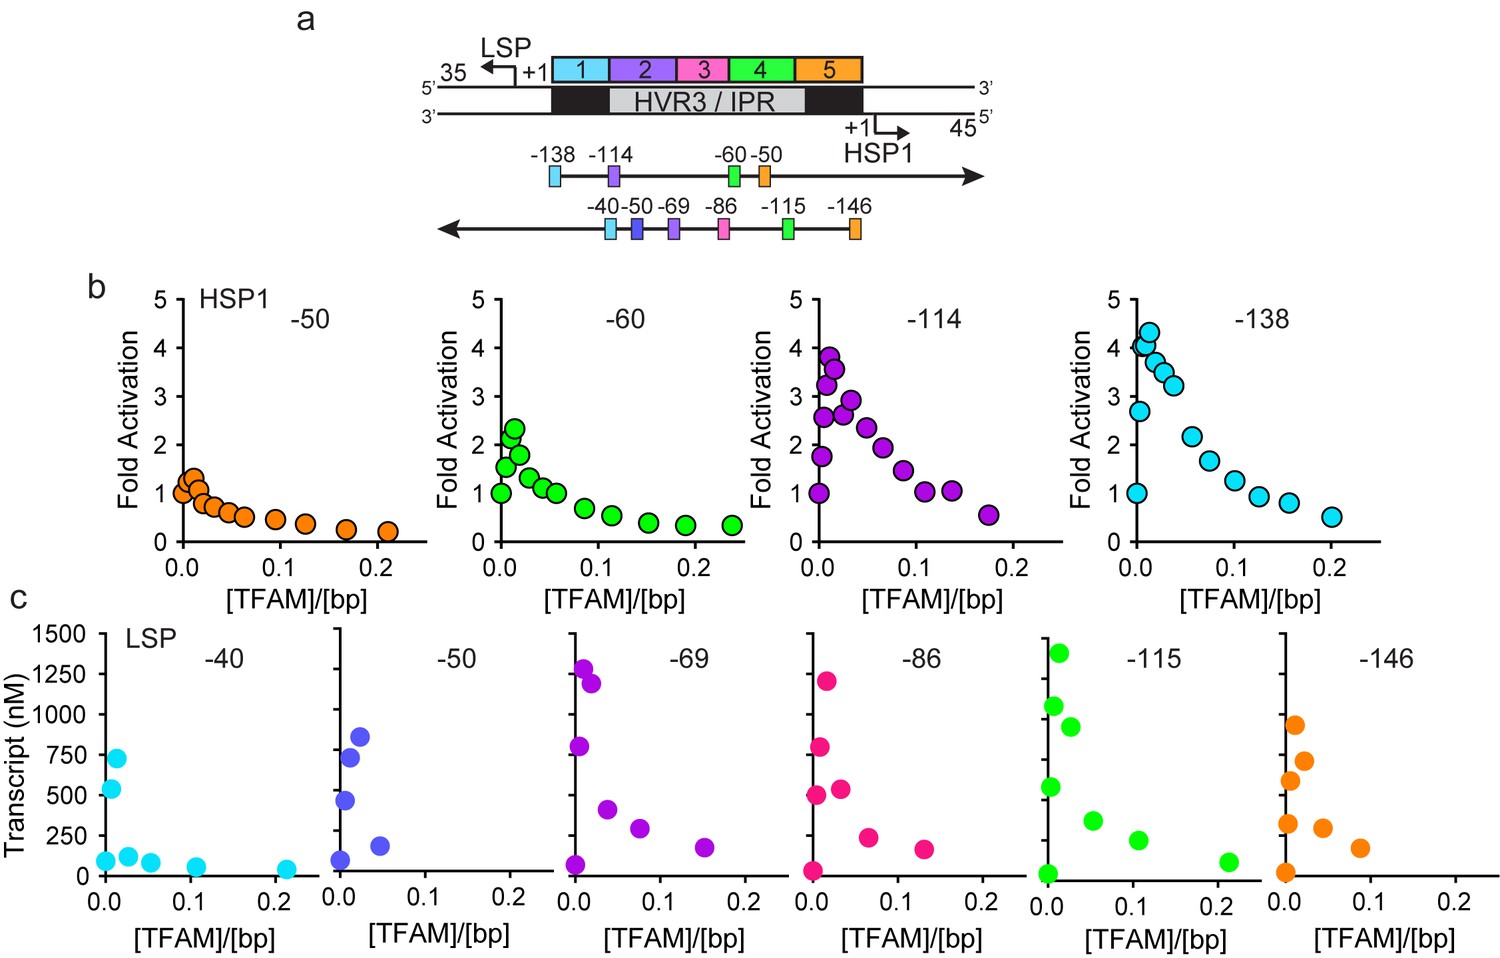
HVR3/IPR contributes to transcription from HSP1.
(a) Deletion constructs used to assess the impact of HVR3/IPR on LSP and HSP1 transcription. The section between and including the putative TFAM binding sites was divided into five distinct regions (1-5; 1:425–447; 2:448–476; 3:447–493; 4:494–522; 5:523–550) and used to guide the deletion design strategy. Four (−50,–60, −114 and −138) and six (−40,–50, −69,–86, −115 and −146) different deletion constructs were used to assess HSP1 and LSP transcription, respectively. (b) Fold activation on HSP1 transcription plotted as a function of TFAM concentration per bp for the different HSP1 deletion constructs. (c) Amount of LSP transcript product plotted as a function of TFAM concentration per bp for the different LSP deletion constructs.
Figure 3
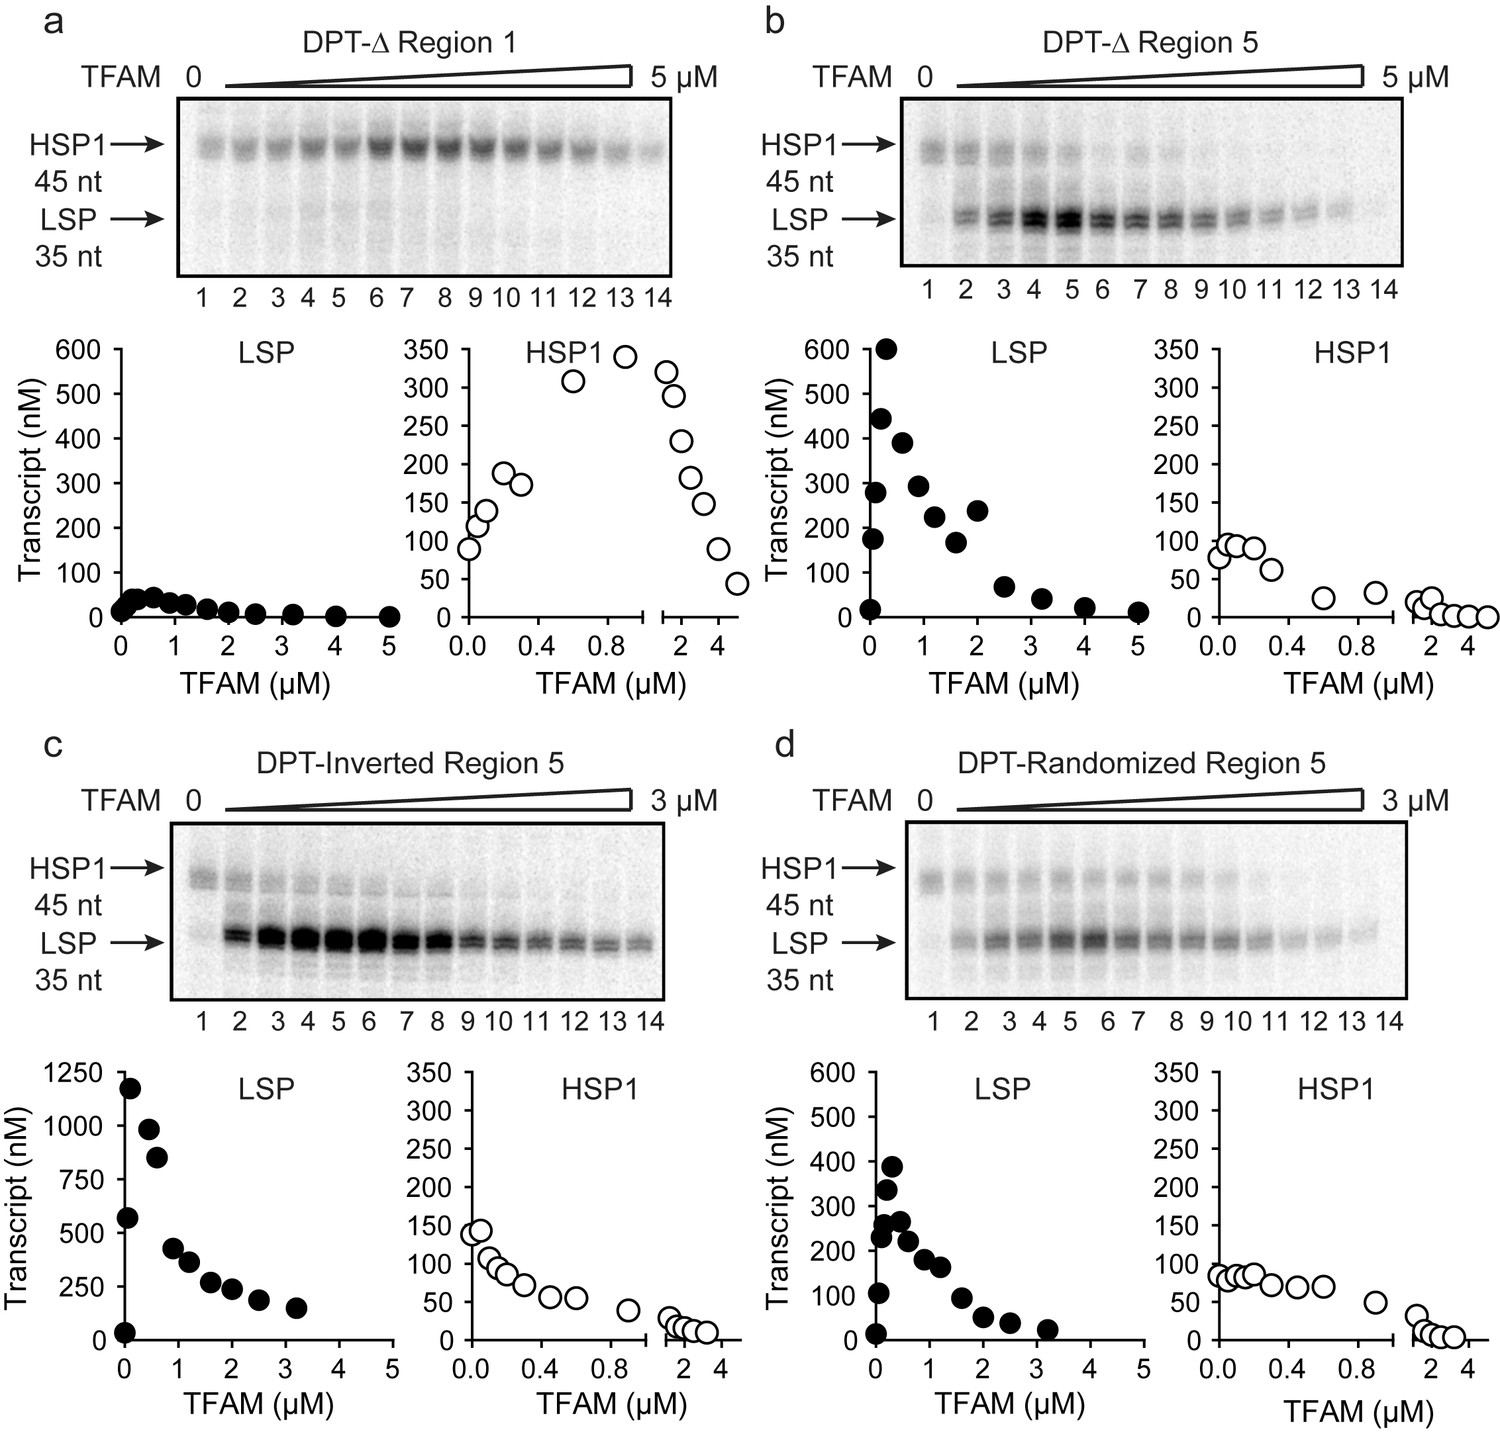
TFAM-binding site of record for HSP1 may not actually bind TFAM to contribute to HSP1 transcription.
(a) Deletion of LSP TFAM-binding site, Δ Region 1, from dual promoter template precludes transcription from LSP. (b) Deletion of HSP1 TFAM-binding site, Δ Region 5, from dual promoter template does not interfere with TFAM-independent activity but converts TFAM from an activator to an inhibitor. (c,d) Inversion and randomization of region five also converts TFAM into an inhibitor. Shown are the run-off transcription products of LSP and HSP1 promoter-dependent transcription resolved by denaturing PAGE and the amount of transcription product plotted as a function of TFAM for the Δ Region 1, Δ Region 5, Inverted Region five and Randomized Region five constructs.
Figure 4 with 1 supplement
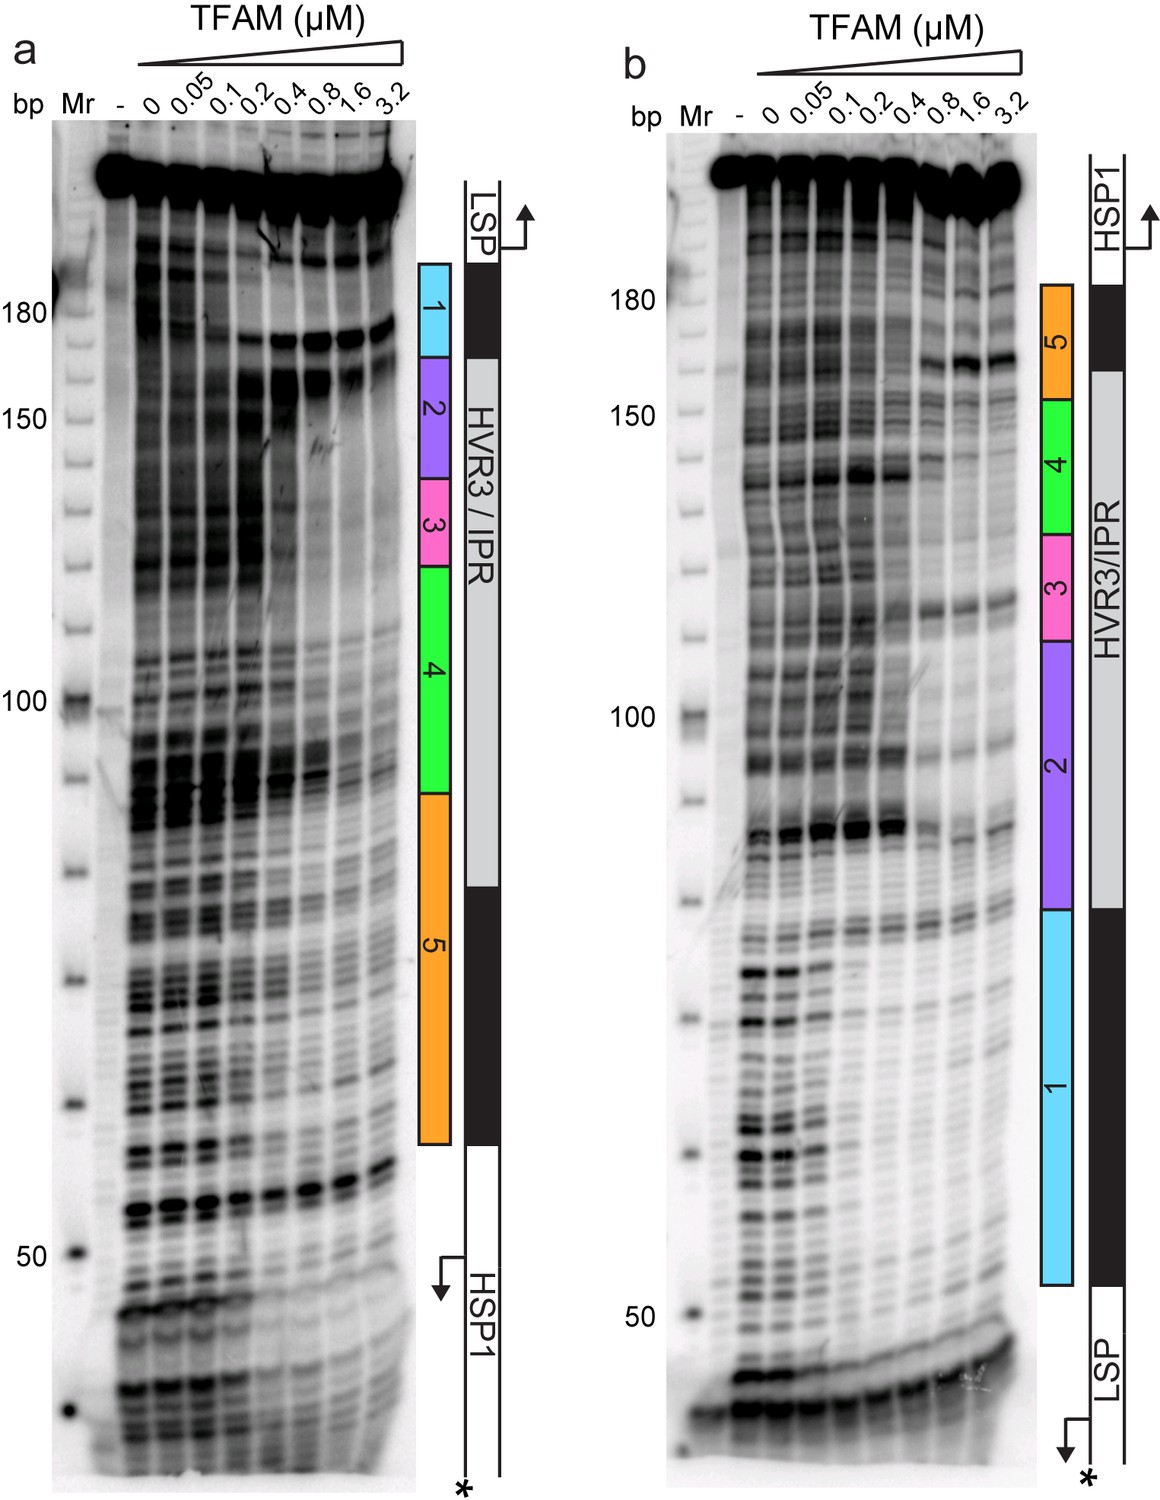
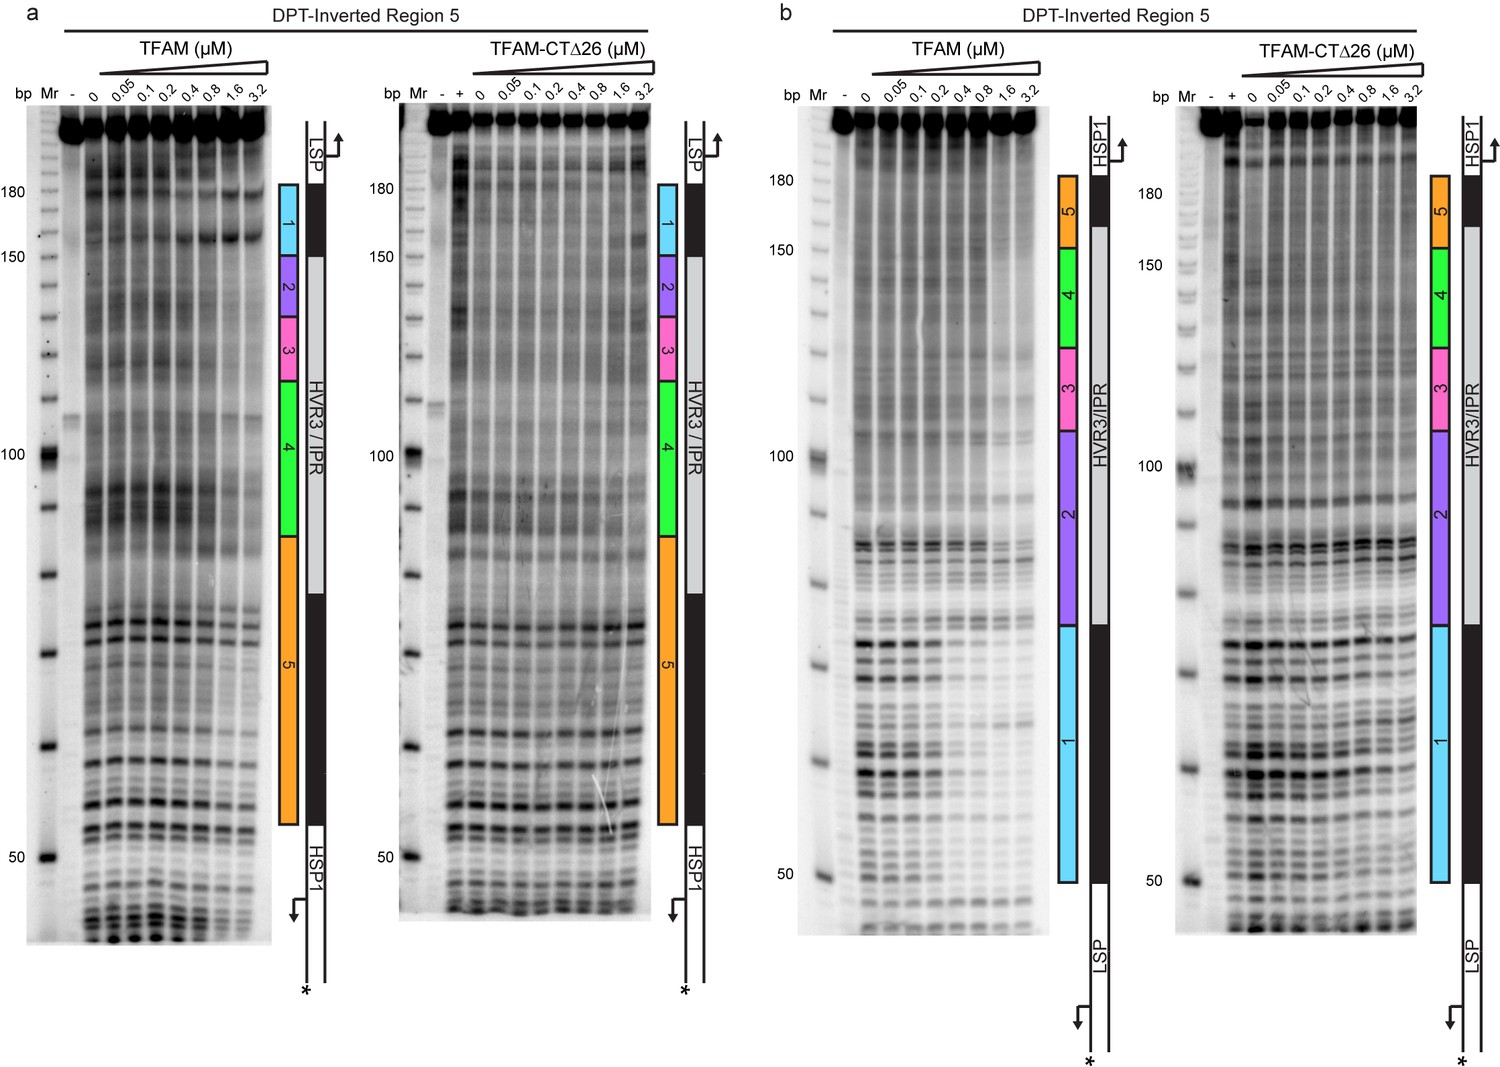
Footprinting of the dual promoter template in the presence of TFAM confirms protection or sensitivity in regions 2 and 4 before region 5.
DNAse I footprinting of the dual promoter template with increasing concentrations of TFAM. (a) HSP1 template strand 32P-labeled. (b) LSP template strand 32P-labeled. A schematic of the transcriptional control region is shown to the right of the denaturing PAGE gels to indicate regions of protection.
Figure 4—figure supplement 1
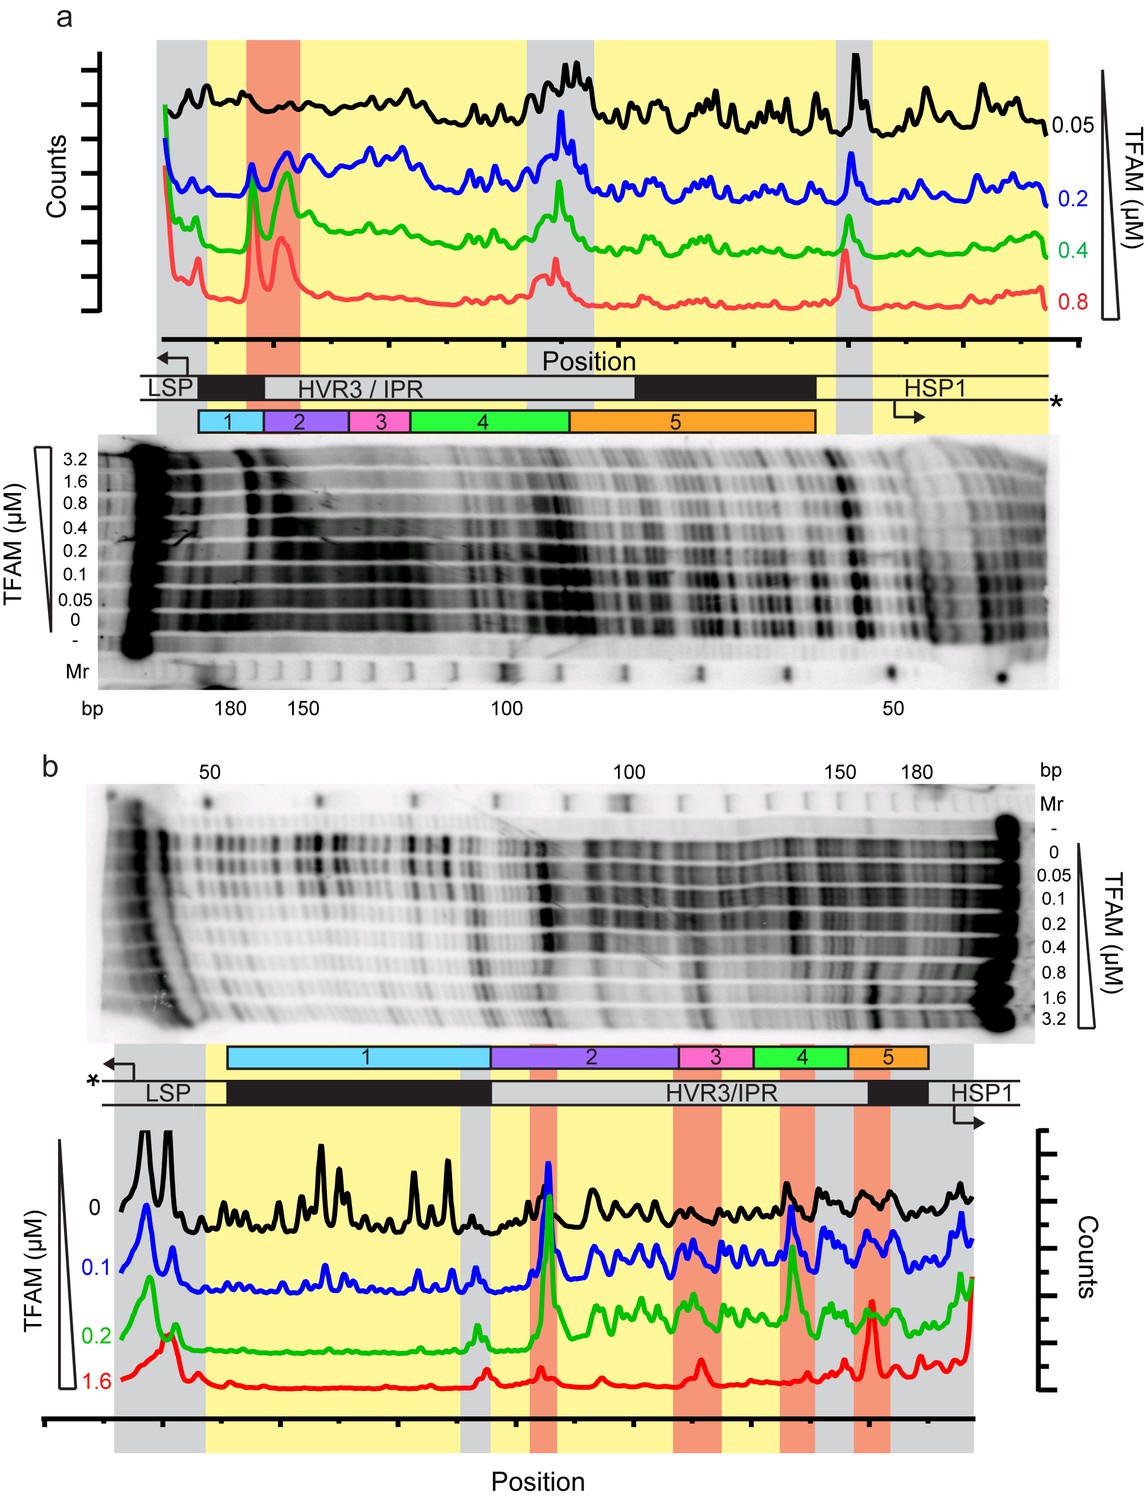
Footprinting of the dual promoter template in the presence of TFAM confirms protection or sensitivity in regions 2 and 4 before region 5.
DNAse I footprinting of the dual promoter template with increasing concentrations of TFAM. (a) HSP1 template strand 32P-labeled. (b) LSP template strand 32P-labeled. A schematic of the transcriptional control region is shown above or below the denaturing PAGE gels to indicate regions of protection. The graph indicates the cleavage and protection pattern across the dsDNA template as quantified using ImageQuant TL software. The yellow shaded areas indicate regions of protection, the red shaded areas indicate regions of enhanced cleavage and the grey shaded areas are regions essentially unchanged.
Figure 5 with 2 supplements
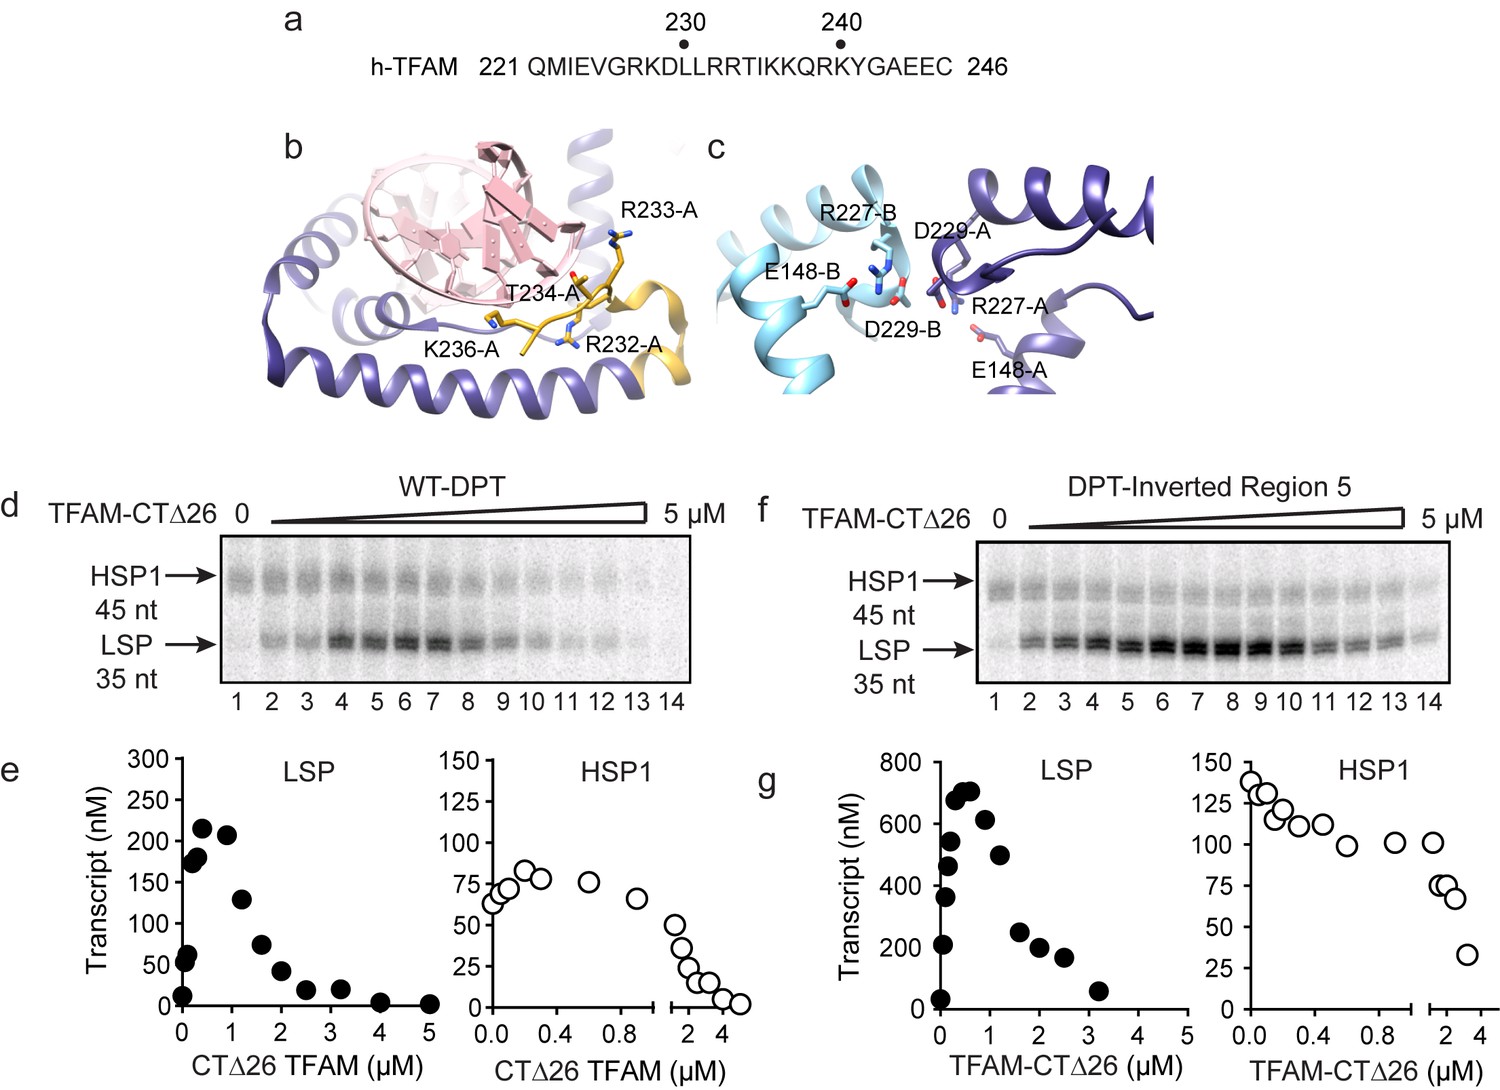
Carboxy-terminal tail of TFAM is essential for transcription from HSP1.
(a) Carboxy-terminal tail (CTT) primary sequence of human TFAM. The last 26 amino acid residues are shown. (b,c) Interactions of TFAM CTT. Structural models were produced using PDB 3TQ6 (Rubio-Cosials et al., 2011). In panel b, TFAM residues 221–236 are colored yellow. Residues 237 to 246 are disordered and absent in the structure. All other residues of TFAM are colored purple. Residues 232–236 interact with the phosphodiester backbone of bound DNA (red). In panel c, two TFAM-DNA complexes are present in the asymmetric unit and designated here as chain A (dark blue) and chain B (light blue). Structural integrity of the CTT of each monomer benefits from interaction of Arg-227 in each monomer with both Asp-229 and Glu148 of the same monomer. The CTT of one monomer packs against that of a second, perhaps creating a mechanism for association between TFAM-DNA complexes. (d) Run-off transcription products using the dual promoter DNA oligo template and increasing concentrations of TFAM-CTΔ26 (0–5 µM) resolved by denaturing PAGE. (e) Amount of LSP (35 nt) and HSP1 (45 nt) RNA transcripts produced using the dual promoter construct plotted as a function of TFAM-CTΔ26 concentration. (f) Run-off transcription products using the dual promoter DNA oligo template with region five inverted and increasing concentrations of TFAM-CTΔ26 (0–5 µM) resolved by denaturing PAGE. (g) Amount of LSP (35 nt) and HSP1 (45 nt) RNA transcripts produced using the dual promoter construct with region five inverted plotted as a function of TFAM-CTΔ26 concentration.
Figure 5—figure supplement 1

Footprinting of the dual promoter template in the presence of either WT and TFAM-CTΔ26 with POLRMT and TFB2M.
DNAse I footprinting of the dual promoter template with increasing concentrations of WT and TFAM-CTΔ26 with POLRMT/TFB2M (1 µM each). In both cases the HSP template strand is 32P-labeled. (a) HSP1 template strand 32P-labeled. (b) LSP1 template strand 32P-labeled. The lane designated (+) indicates DNAse I footprinting in the absence of TFAM, POLRMT and TFB2M. A schematic of the transcriptional control region is shown to the right of each denaturing PAGE gel to indicate regions of protection.
Figure 5—figure supplement 2
Footprinting of the dual promoter template with Inverted Region five in the presence of WT and TFAM-CTΔ26 with POLRMT and TFB2M.
DNAse I footprinting of the dual promoter template with Inverted Region five with increasing concentrations of WT TFAM and TFAM-CTΔ26 with POLRMT/TFB2M (1 µM each). (a) HSP1 template strand 32P-labeled. (b) LSP1 template strand 32P-labeled. The lane designated (+) indicates DNAse I footprinting in the absence of TFAM, POLRMT and TFB2M. A schematic of the transcriptional control region is shown to the right of each denaturing PAGE gel to indicate regions of protection.
Figure 6
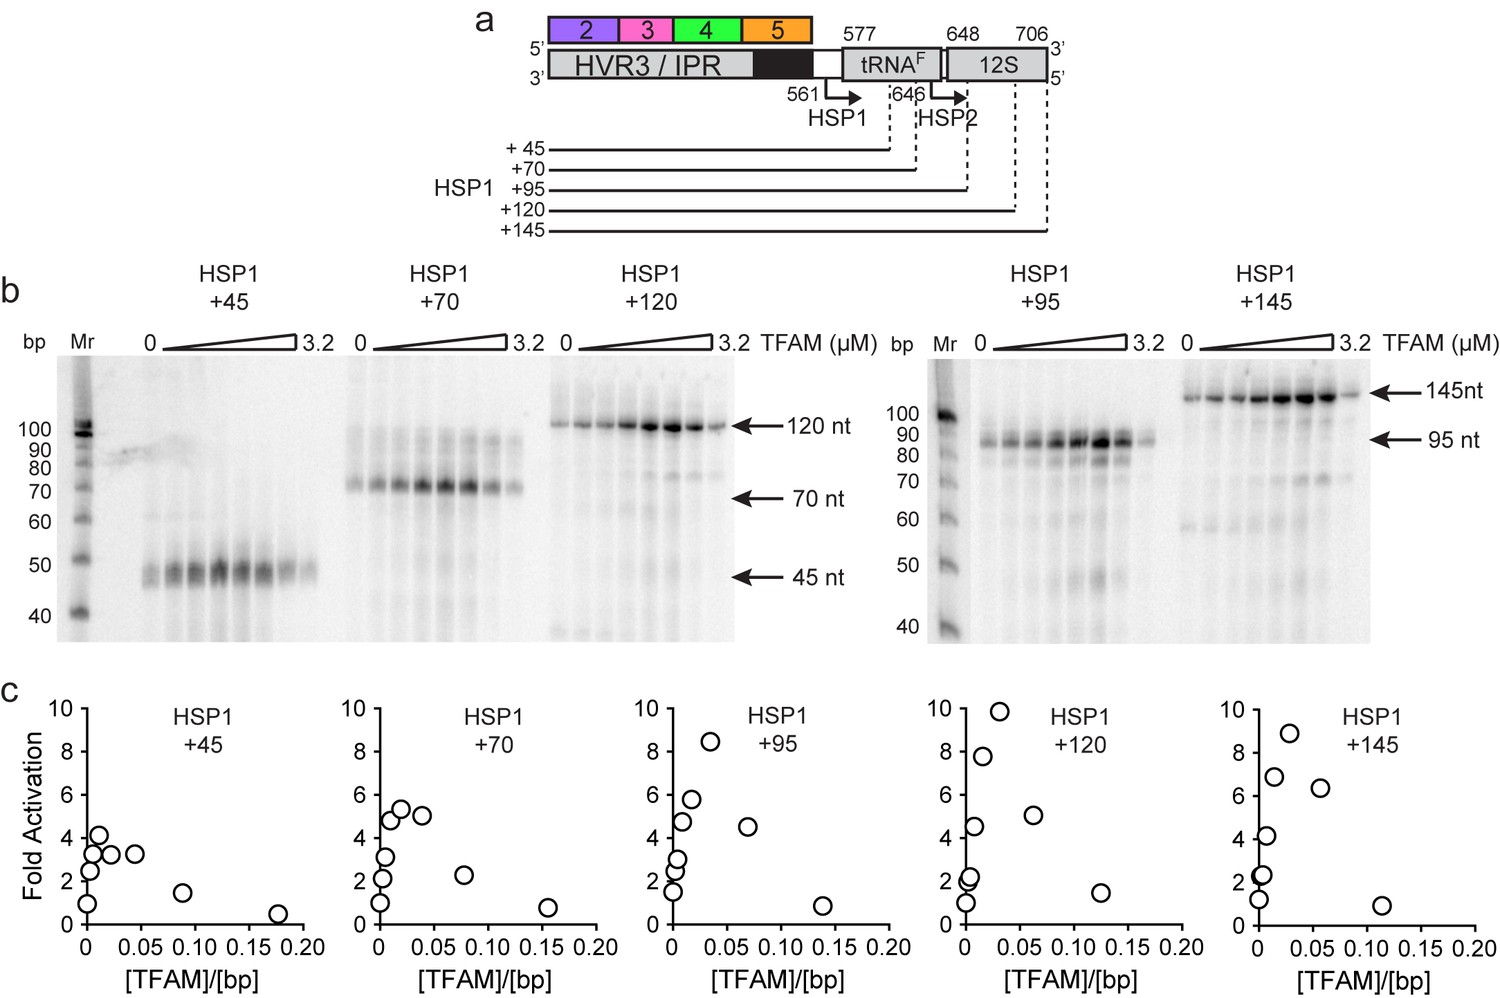
mtDNA sequences downstream of HSP1 increase the fold activation on HSP1 transcription.
(a) Schematic of HSP1 dsDNA oligonucleotide templates used for in vitro transcription reactions which contained additional mtDNA sequences, either 45, 79, 95, 120 or 145 bp, downstream of the HSP1 promoter start site. Each template contained the HVR3/IPR, starting from Region 2, and ending at the indicated bp from the HSP1 start site. The dotted lines show the approximate position each DNA oligo template end relative to the tRNAF and 12S RNA genes. (b) Run-off transcription products using HSP1 DNA oligo templates and increasing concentrations of TFAM (0–5 µM) resolved by denaturing PAGE. Ten-bp markers are indicated on each gel. (c) Fold activation on HSP1 transcription plotted as a function of TFAM concentration using the different HSP1 DNA oligo templates.
Figure 7 with 10 supplements
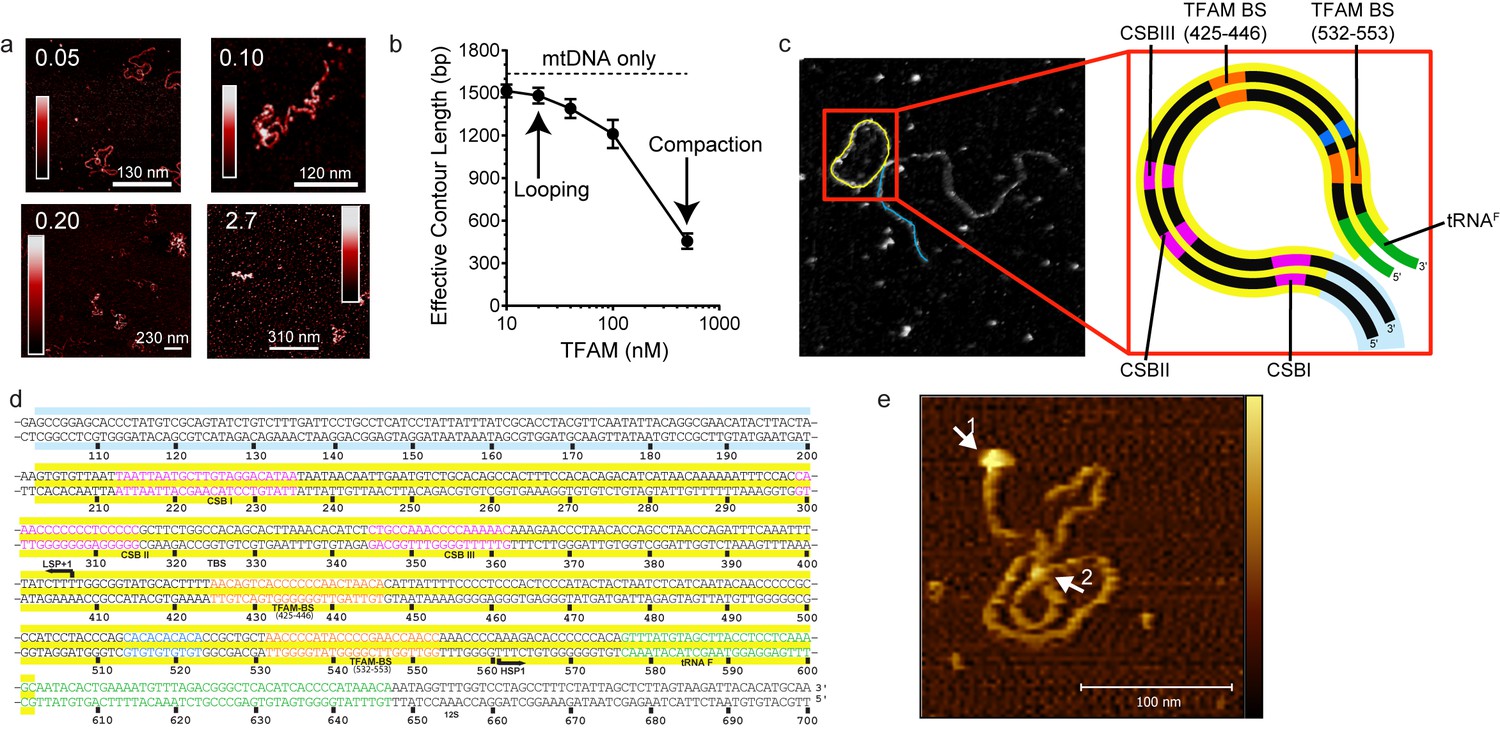
mtDNA looping correlates with activation and compaction with repression.
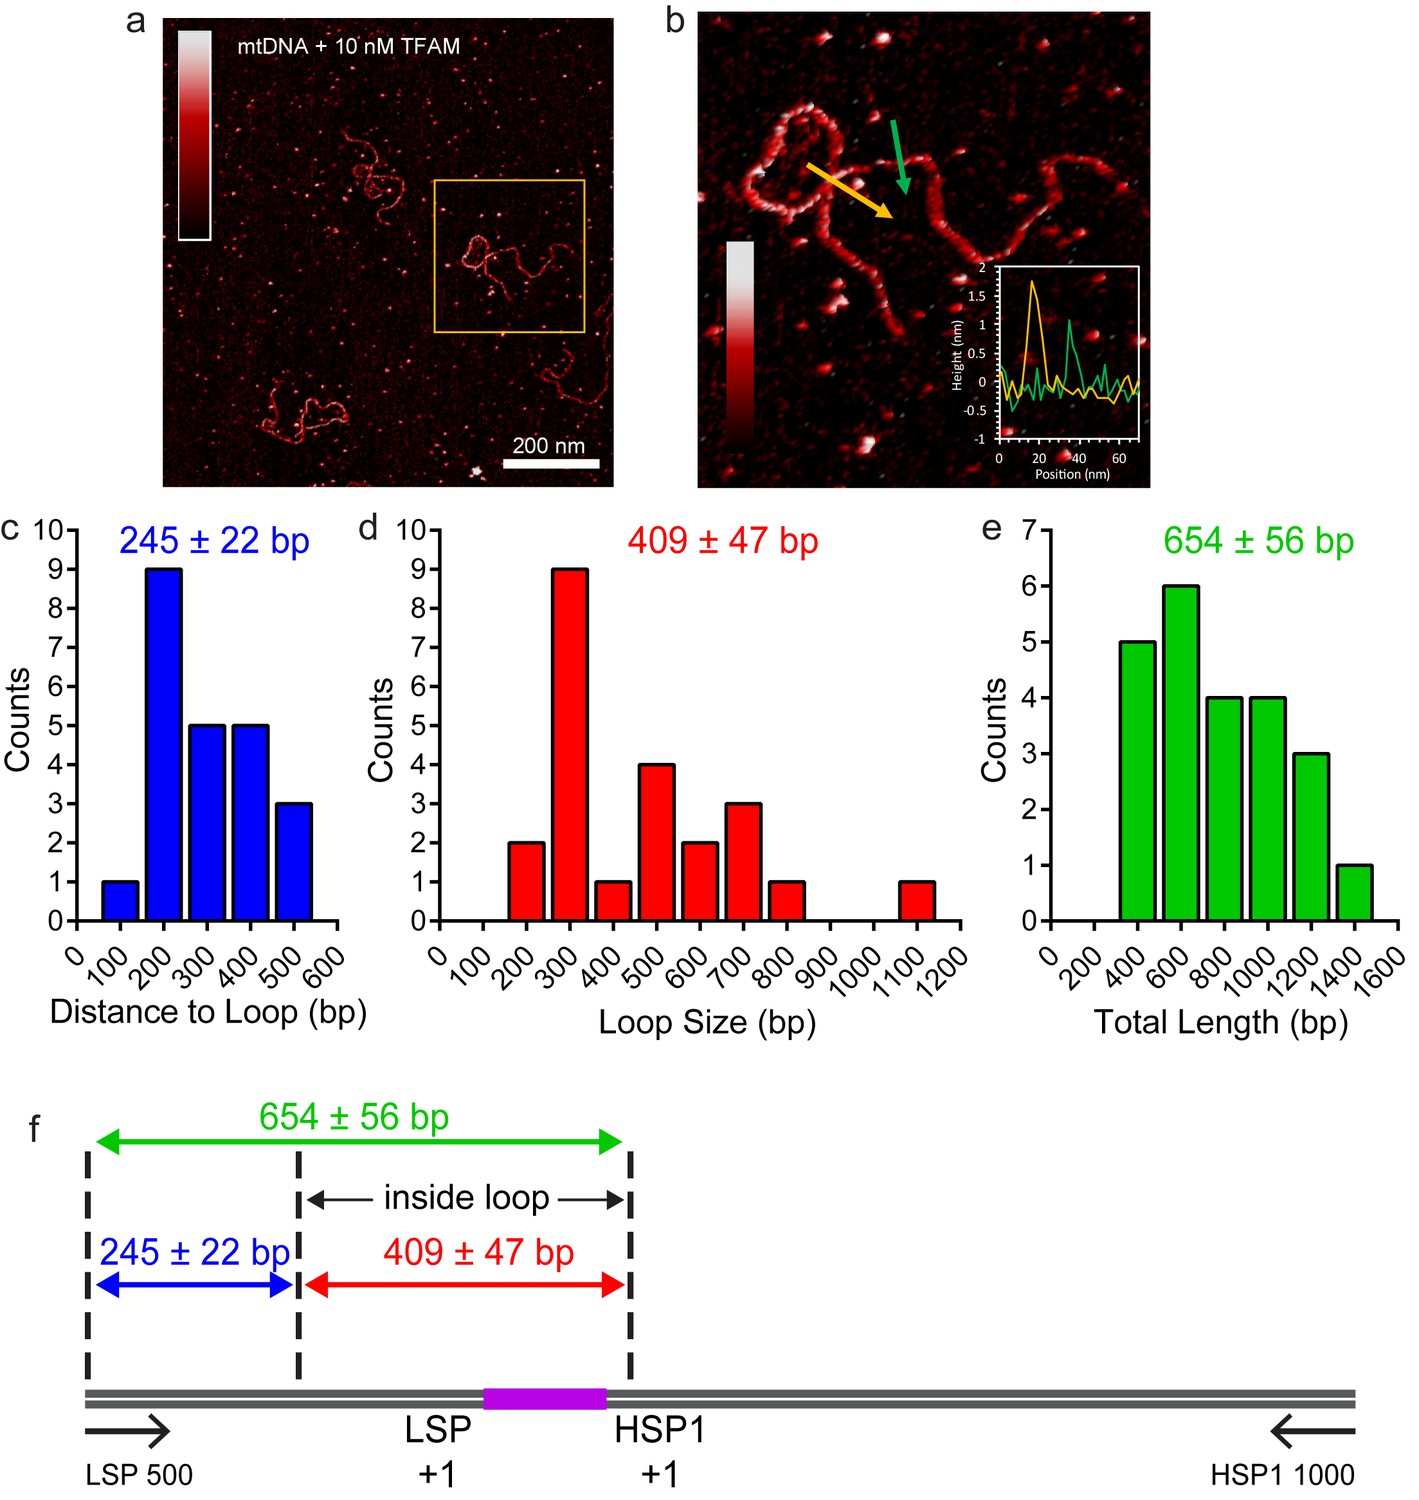
(a) Representative AFM images of TFAM-mtDNA interaction as a function of TFAM concentration per bp, obtained in liquid. The ratio of TFAM/bp is indicated in the upper left corners of each AFM image. The color bar represents the sample height ranging from 0.0 to 2.0 nm. (b) Effective contour length of the IPR DNA as a function of TFAM concentration. The black dotted line represents the contour length of mtDNA in the absence of protein. The filled circles (with connecting black line) represent the measured effective contour length of the mtDNA in the presence of TFAM. (c) The primary loop observed from AFM analysis of TFAM-mtDNA interaction is between the regions that encompass CSB1 to tRNAF and contains the three mitochondrial DNA promoters (LSP, HSP1 and HSP2) and the interpromoter region. In the greyscale image, the loop formed is illustrated in yellow and the region preceding the loop is illustrated in blue. (d) mtDNA sequence. Shown here is a small region of mtDNA sequence surrounding and including the IPR (#101–700; numbering according to the standard Cambridge mtDNA sequence). The yellow shading indicates the region of mtDNA sequence that gives rise to the primary loop observed using AFM. (e) The AFM image shows an individual mtDNA molecule with a streptavidin DNA-end label and a TFAM-wt mediated loop. The bound streptavidin is clearly visible at the biotin-tagged end of the mtDNA (white arrow no. 1). The height profile shows a height of 3.5–4 nm for the TFAM mediated loop at the mtDNA crossing (white arrow no. 2). The mtDNA itself shows a height of ~2 nm which is consistent with the height expected for low force AFM imaging of DNA in liquid.
Figure 7—figure supplement 1
Imaging of mtDNA using AFM in liquid.
Two-dimensional representation of mtDNA in the absence of protein. The inset shows traces along the contour of the DNA, which is used to calculate the DNA persistence length (Figure 8). The color bar represents the sample height ranging from 0.0 to 2.0 nm.
Figure 7—figure supplement 2
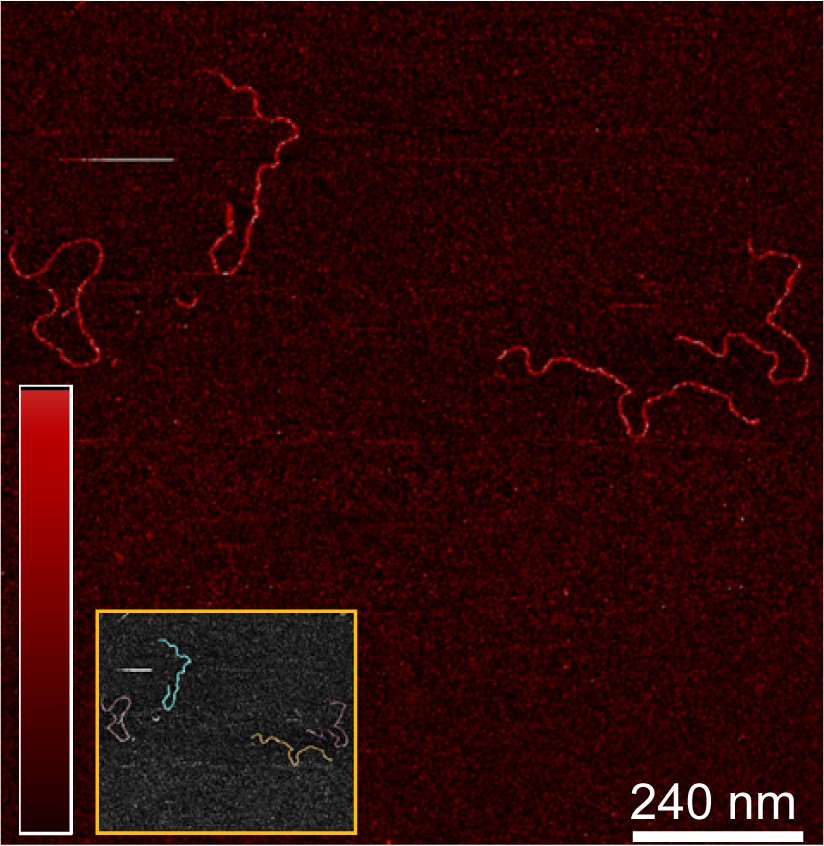
TFAM-induced looping characterized by AFM in liquid.
(a) Two-dimensional representation of loops and bridges mediated by TFAM bound to mtDNA. The concentration used is 10 nM TFAM and 0.11 nM mtDNA. The color bar represents the sample height ranging from 0.0 to 2.0 nm. (b) Three-dimensional representation of looped mtDNA mediated by TFAM, an example from the yellow box in (a). The color bar represents the sample height ranging from 0.0 to 2.0 nm. (c) Histogram of the short distance to the loop, illustrated in blue in Figure 7c. The average distance to the loop is 245 ± 22 bp. (d) Histogram of loop sizes in base pairs. The average loop size is 409 ± 47 bp. An example loop is illustrated in yellow in Figure 7c. (e) Histogram showing the sum of the distance to loop and loop size. The average distance is 654 ± 56 bp. (f) The mtDNA construct, with a 153 bp IPR region (purple), shows that the average location of the IPR region is inside the loop.
Figure 7—figure supplement 3
NiCl2-mediated DNA-protein complex imaging method.
(a) The color bar indicates the height of the sample ranging from 0 to 4.0 nm for images. Individual DNA fragments were traced and the persistence length was calculated with a 2D WLC model for the NiCl2 method, compared to the 3D WLC used for the APTES method. (b) For the NiCl2 deposition method a persistence length of 46.55 ± 0.31 nm (orange fit line) was observed in the absence of TFAM. The value for the persistence length in the presence of 10 nM TFAM was 28.71 ± 0.78 nm (blue fit line). The error bars indicate the 95% confidence interval deviation of individual data points from the fit.
Figure 7—figure supplement 4
NiCl2 mediated DNA-protein complex deposition on Mica.
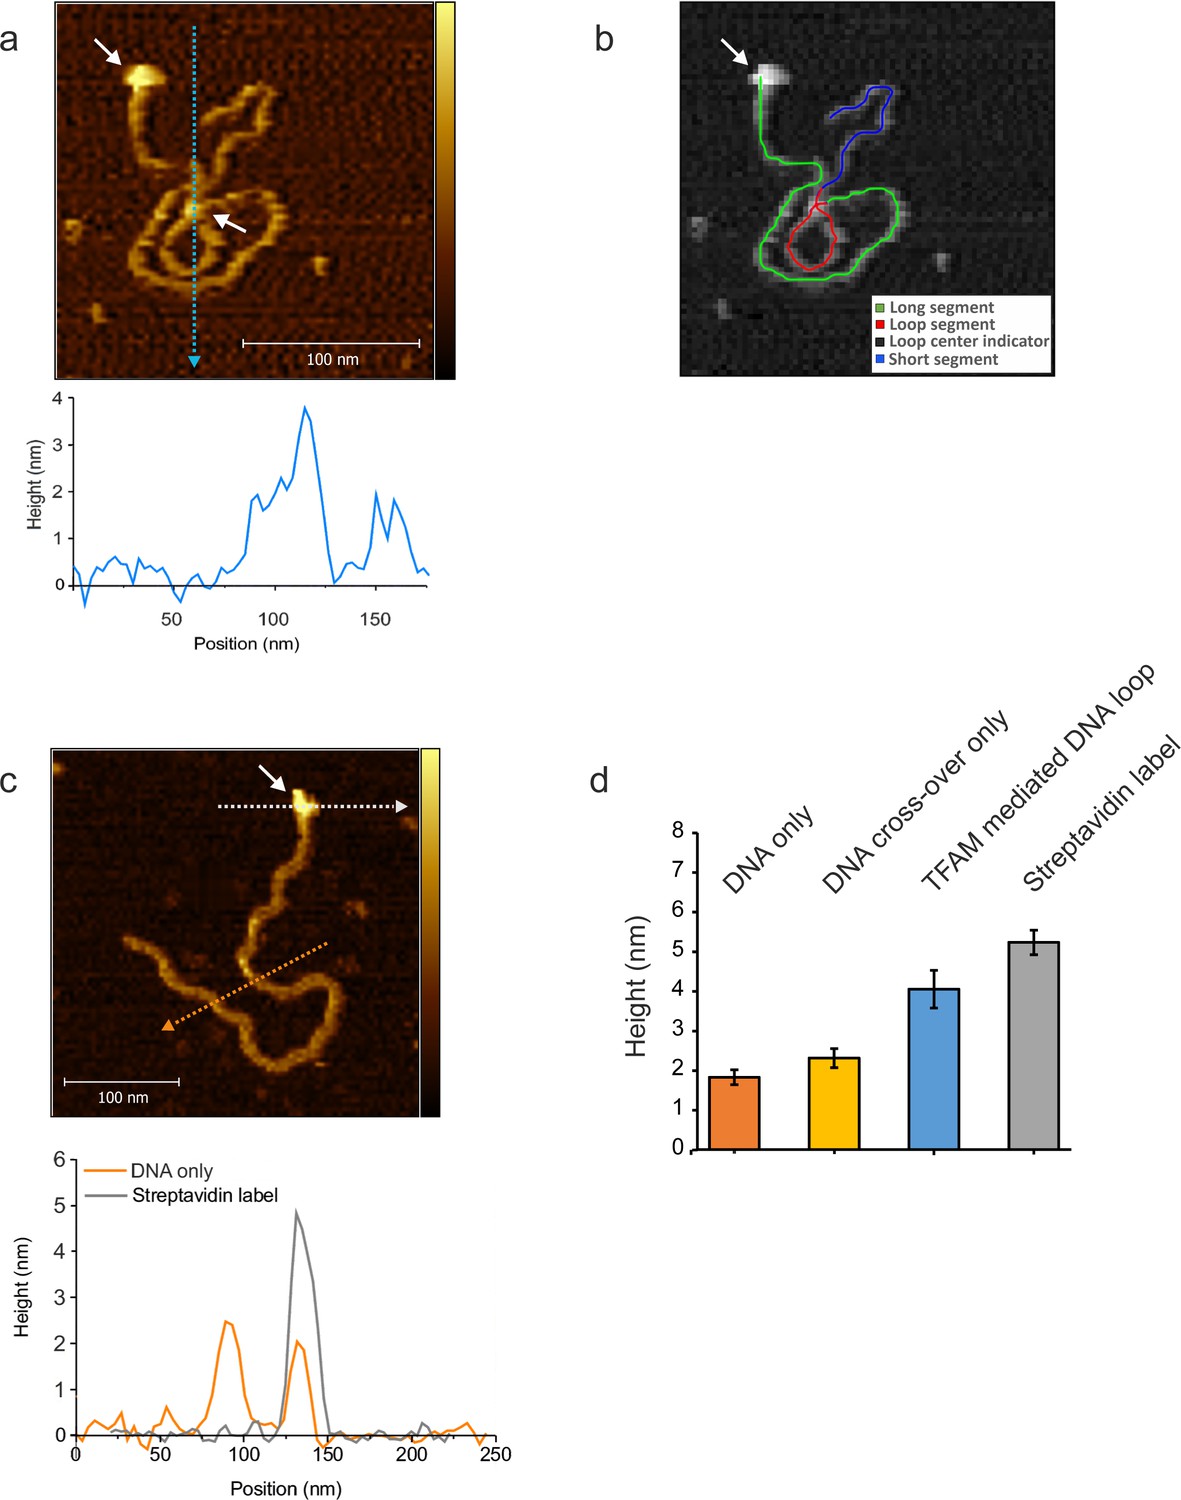
(a) The AFM image shows an individual mtDNA molecule with a Streptavidin DNA-end label and a TFAM- mediated loop. The bound Streptavidin is clearly visible at the biotin-tagged end of the mtDNA (white arrow #1). The height profile shows a height of 3.5–4 nm for the TFAM-mediated loop at the mtDNA crossing (white arrow #2). The mtDNA itself shows a height of ~2 nm which is consistent with the height expected for low force AFM imaging in liquid. A schematic of the tracing of the individual segments of the DNA molecule is shown in (b). The long segment, starting with the Streptavidin label (white arrow), spans over ~927 bp, the loop segment for ~341 bp and the short segment for ~410 bp (total ~1678 bp). (c) Bare/naked mtDNA. The height profile displays a DNA height of 2–2.5 nm. The profile for the Streptavidin label shows a height of ~5 nm. (d) The bar graph shows the average height derived from DNA alone, DNA cross overs only, TFAM mediated DNA loops and the Streptavidin label from mtDNA molecules (n = 10). The bare DNA only displays a mean of 1.8 nm (SD 0.2 nm), DNA cross over only a mean of 2.2 nm (SD 0.24 nm), TFAM mediated loops show a mean of 3.8 nm (SD 0.26 nm), and the Streptavidin label a mean of 5.1 nm (SD 0.3 nm). Color bars range from 0 to 5.0 nm for both AFM images.
Figure 7—figure supplement 5
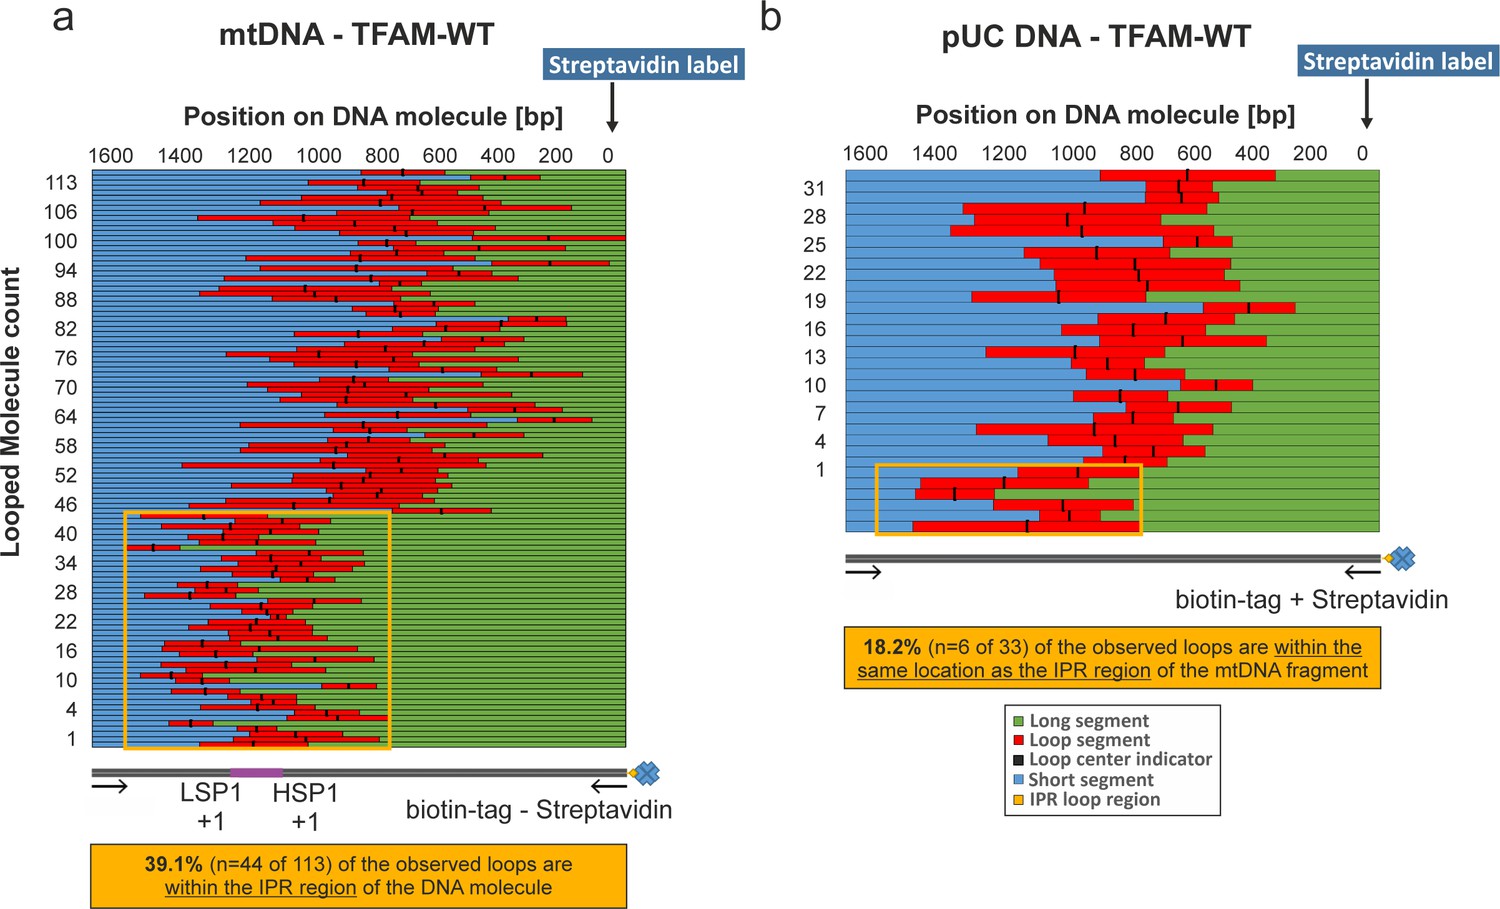
NiCl2 mediated DNA deposition on Mica.
DNA–end labeling via Streptavidin binding to the DNA biotin-tag. (a, b) Shows the length distributions for traced mtDNA and pUC18 DNA fragments in the presence of TFAM. The graphs show the contour lengths of each segment from individual DNA molecules. Each DNA molecule was traced starting with the attached Streptavidin label attached at the biotin-tag of the DNA fragment. The individual tracings have been sorted by the length of the long segment of the DNA starting with the Streptavidin labeled end. The center of the loop is indicated with a black bar. In (a) the orange box indicates the region containing the three mitochondrial promotors including the IPR region (~740 bp span). 39.1% of all counted loops on mtDNA molecules have been detected in this region (n = 44 of 113). (b) 18.2% of detected loops are present within this corresponding region of pUC18 DNA molecules (n = 6 of 33).
Figure 7—figure supplement 6
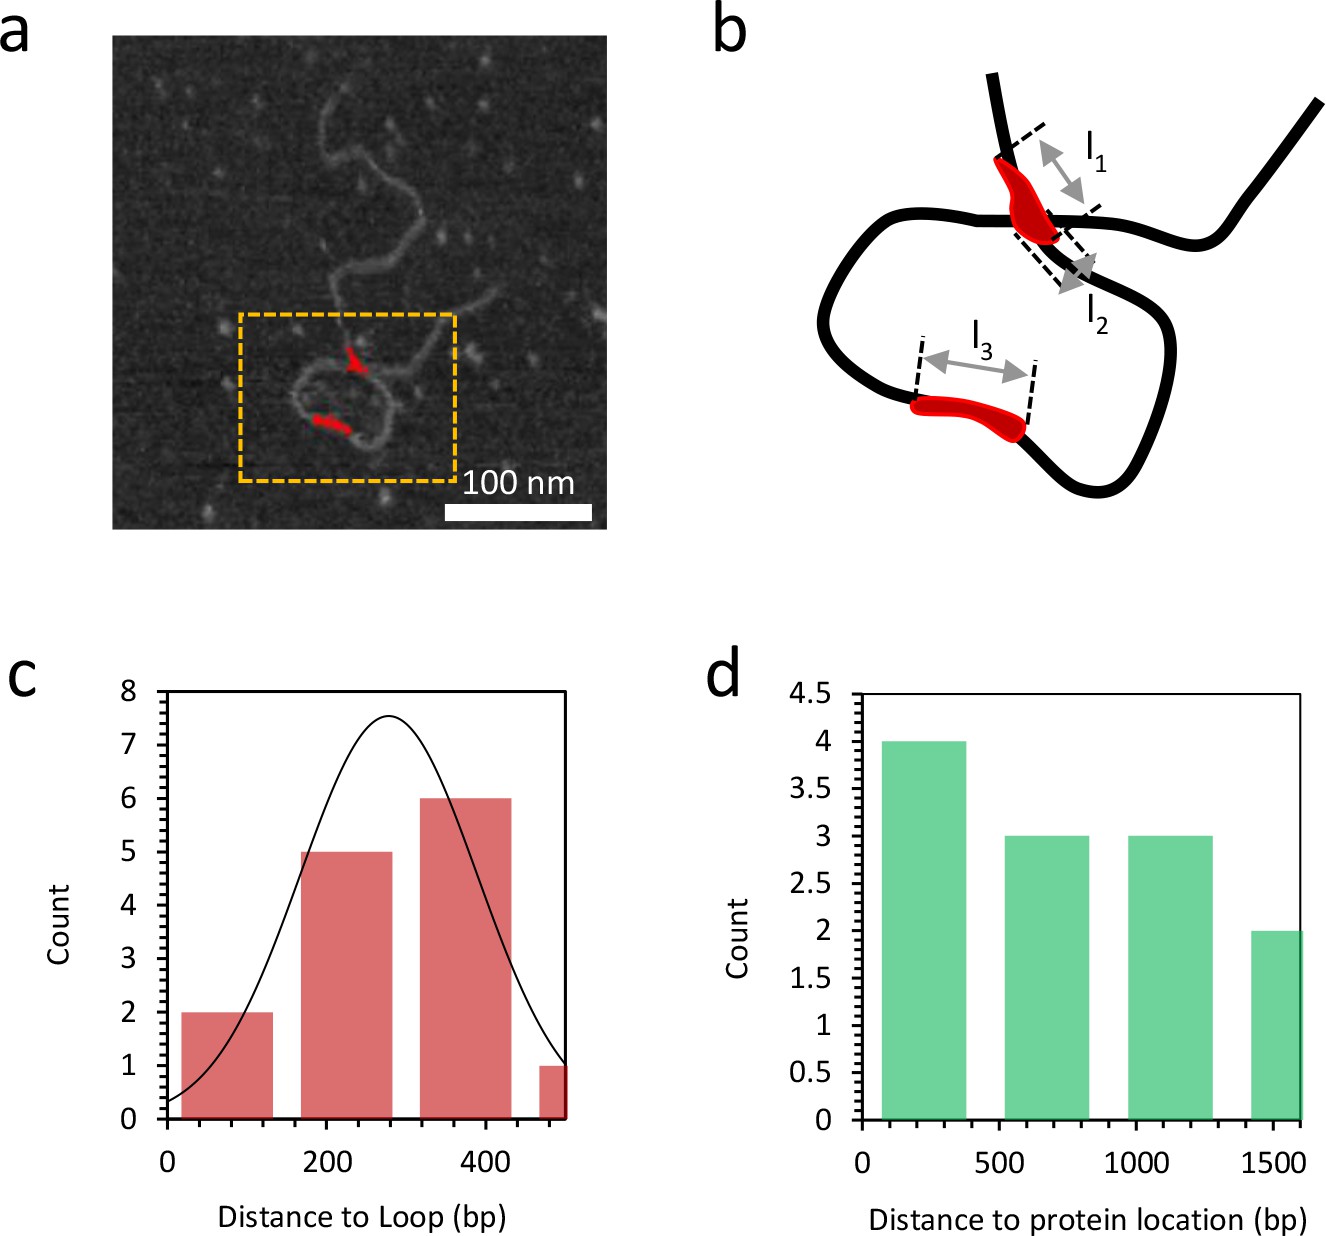
Distance to loop and distance to protein location.
(a) Grayscale image of DNA bound with 10 nM TFAM (in red). (b) A magnified view of the orange dashed rectangle is illustrated in (b). At a detectable bound protein cluster location on the DNA, the length l1,l2,l3 along the single DNA molecule is measured to quantify the binding affinity (Figure 7—figure supplement 8). (c) The histogram illustrates the distance from the short end of the molecule to the TFAM-mediated loop. The mean value is 278 bp and the standard deviation is 111 bp. (d) The histogram illustrates the distance to the protein location from the end of the molecule with the shortest distance to the loop, for proteins not located at the loop crossing point. The mean value is 753 bp and the standard deviation is 509 bp.
Figure 7—figure supplement 7
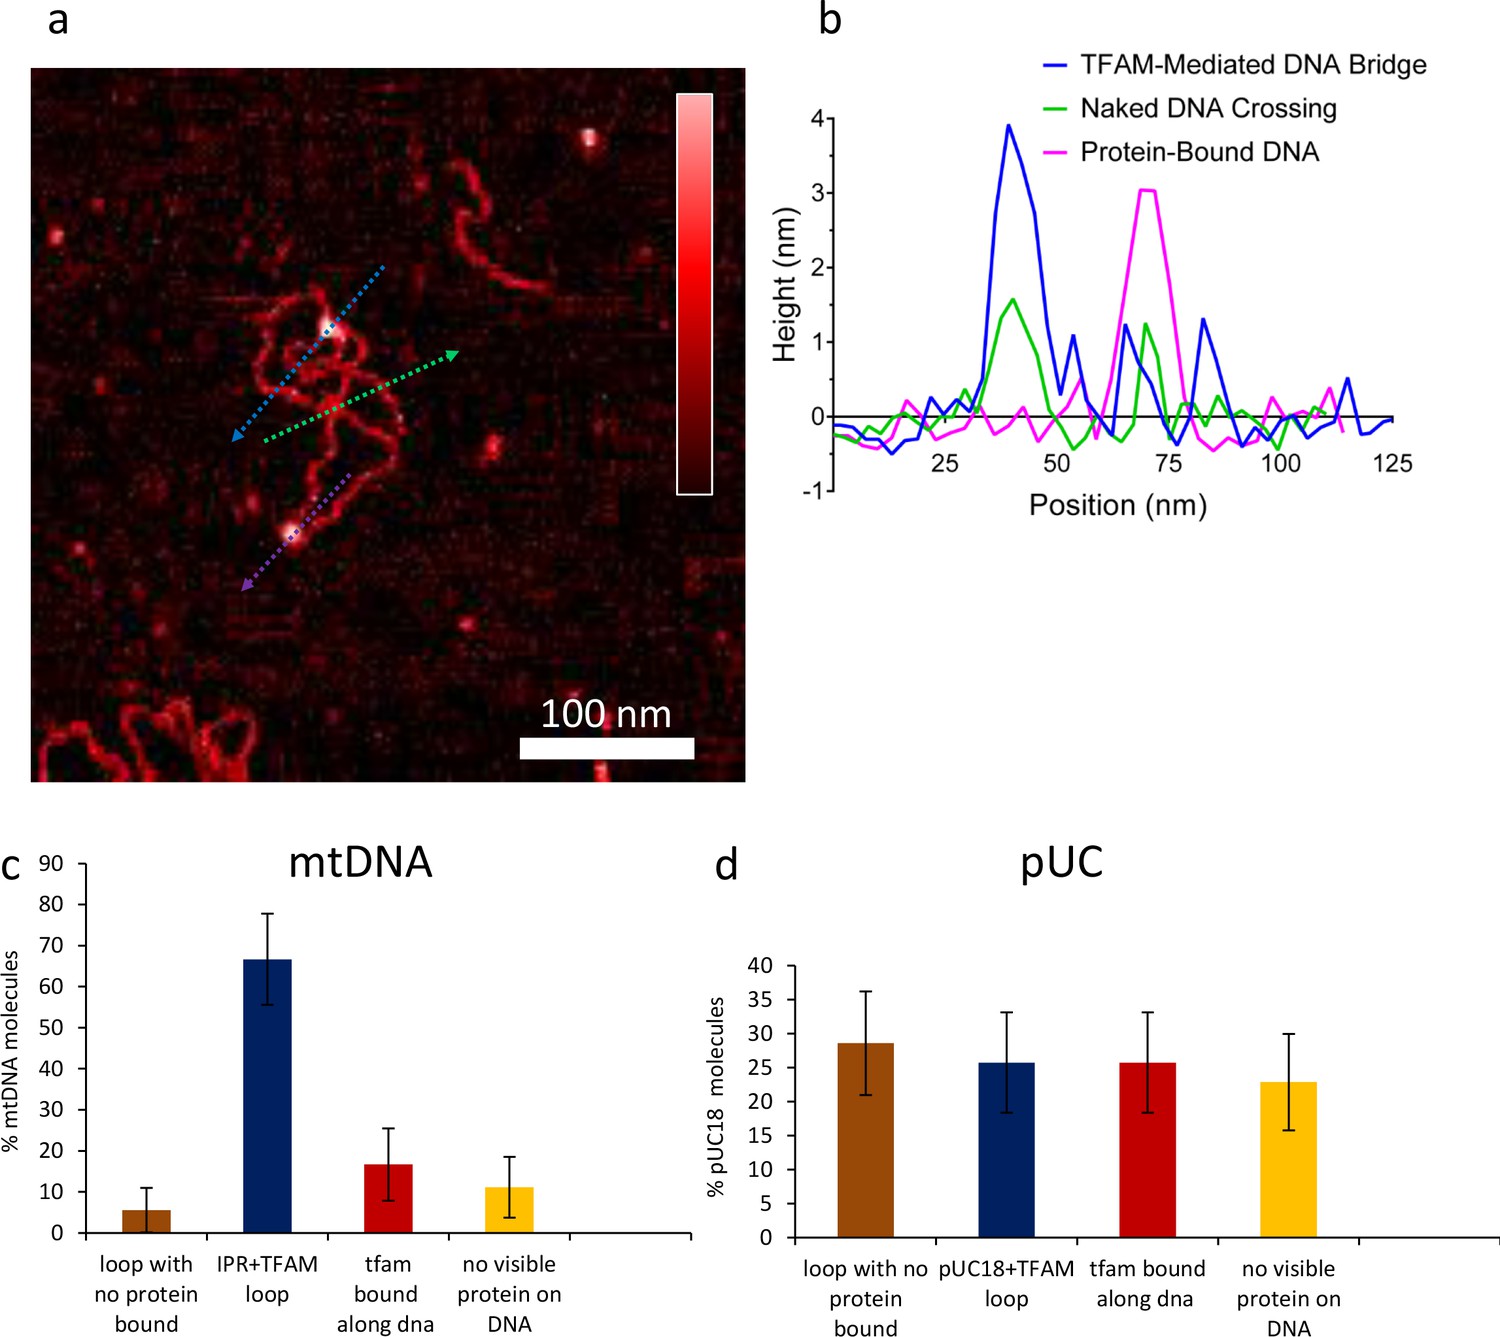
Percent of DNA molecules (either mtDNA or puc18) in each of four categories: Loop present but no detectable protein bound at the DNA crossover, loop present with protein bound at the crossover, no loop with protein bound somewhere on the molecule, and no loop and no detectable protein bound.
(a) Two-dimensional representation of DNA bridges and loops mediated by TFAM. The color bar indicates the height of the sample ranging from 0 to 2.5 nm. The lines represent the locations of cross-section presented in (b). Three types of crossovers or bridges can be identified: protein-bound DNA (purple arrow); TFAM-mediated DNA bridge (blue arrow); and naked DNA crossover (green arrow). (b) Height of the cross-sections on the image (a) as color coded. (c) For mtDNA (N = 18), a strong peak of 67% in the category of loop formed with protein bound is dominant. Other categories are weak. (d) With puc18 (N = 35) these categories are all equally probable within uncertainty.
Figure 7—figure supplement 8
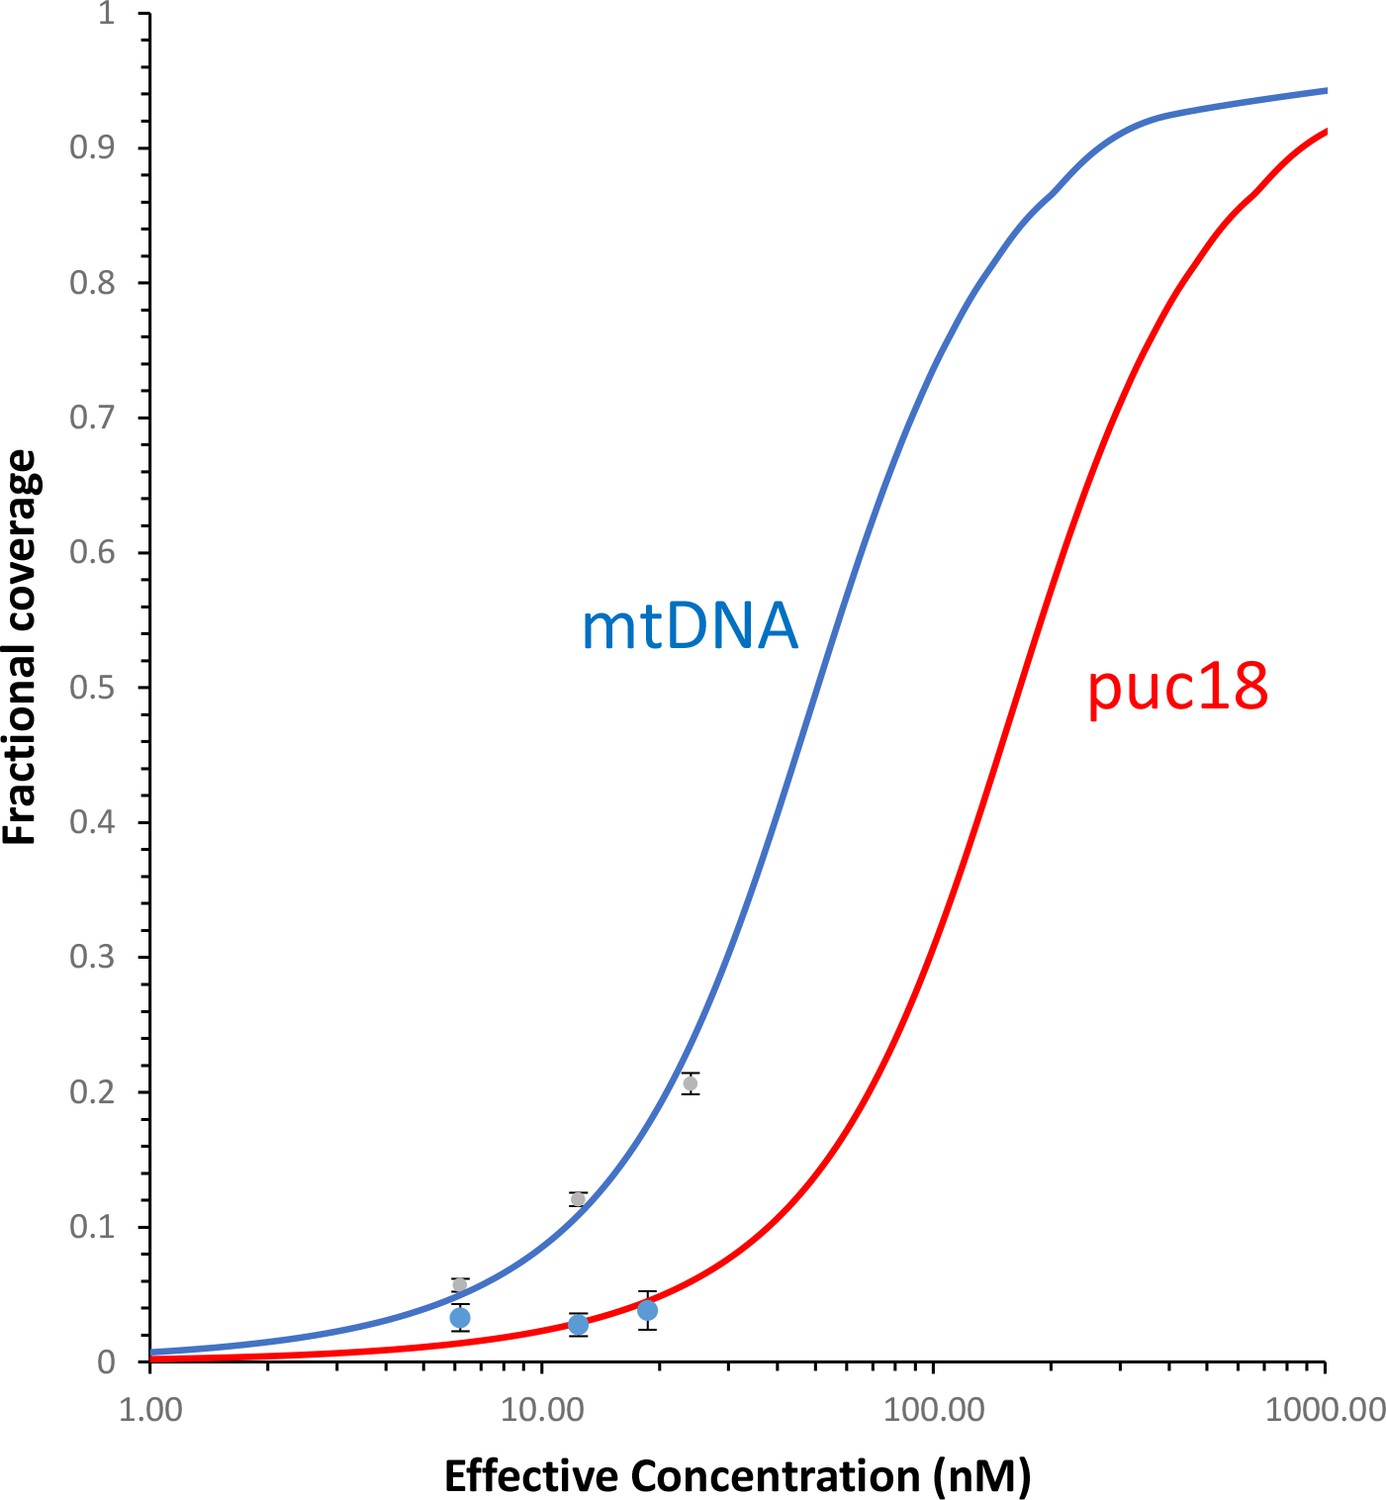
Fraction of the DNA contour that is covered by protein as a function of protein concentration.
The measured fractional binding as a function of effective concentration of TFAM in solution (taking into account the reduction in solution protein concentration due to DNA binding). The results demonstrate a factor of 3 increase in TFAM binding affinity for the mtDNA construct (Kd = 59 ± 2 nM) relative to the puc18 construct (Kd = 200 ± 40 nM) under our solution conditions. This support the preferential binding of TFAM to mtDNA, thus providing a direct connection between the sequence-specific transcription measurements and AFM measurements of DNA binding.
Figure 7—figure supplement 9
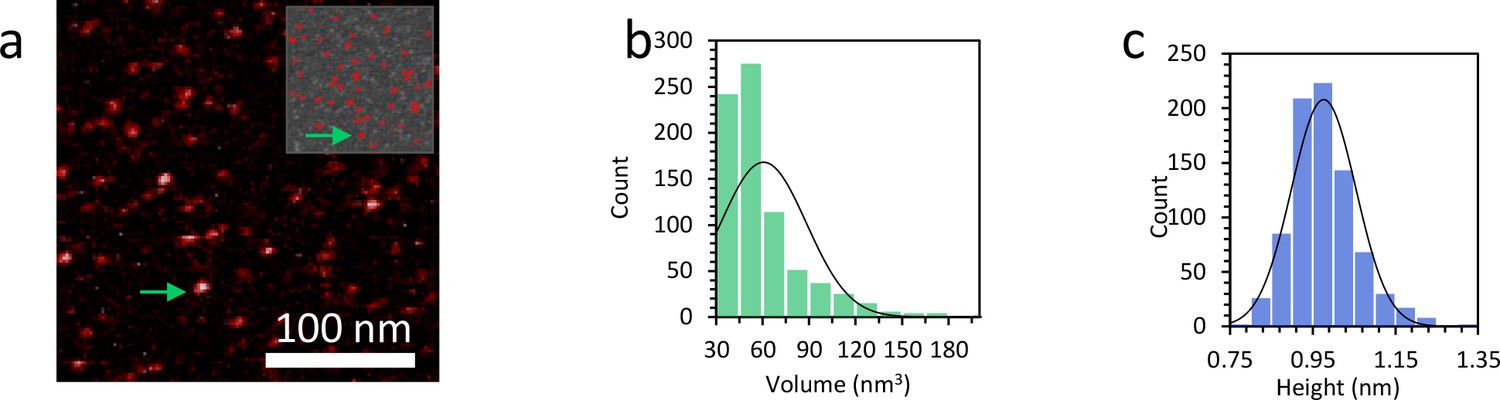
Characterization of the size of the protein complexes.
(a) AFM image shows TFAM protein only. The upper inset shows the proteins remaining for analysis after the background is removed using Gwyddion. (b) The measured volume distribution of individual proteins shown in (a) reveals an average volume of 61 nm3 and a standard deviation of 28 nm3. The calculated theoretical value for TFAM is 52 nm3. (c) The histogram shows an average height of 0.98 nm and a standard deviation of 0.07 nm.
Figure 7—figure supplement 10
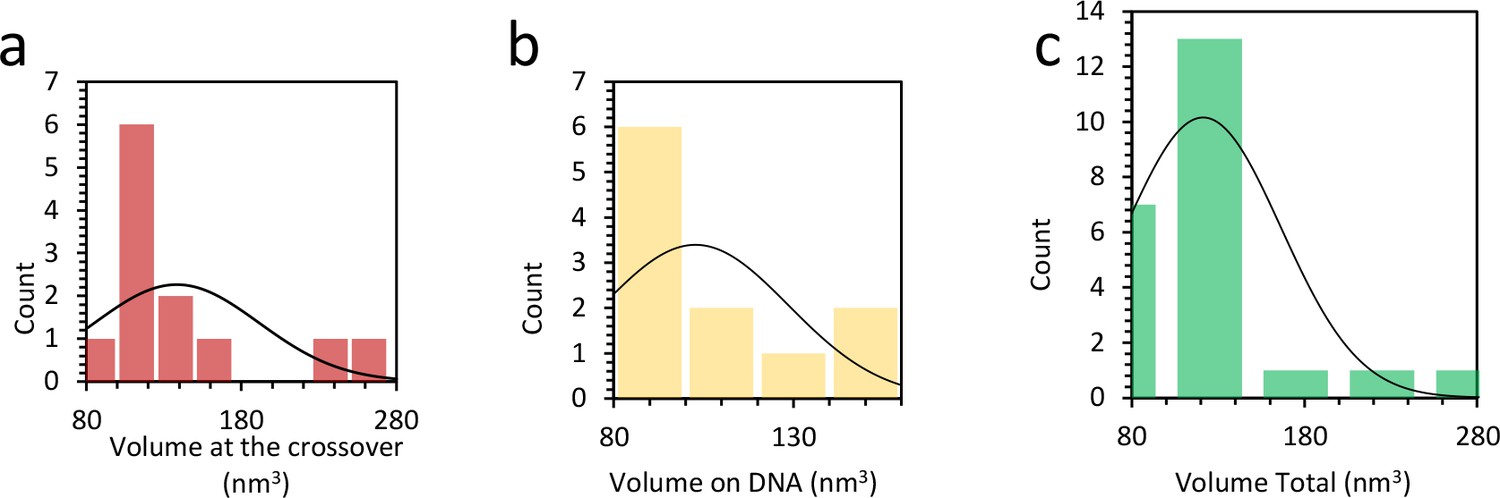
Distribution of protein complex volume when bound to DNA.
(a) Average volume of protein at the DNA crossing is 138 ± 15 nm3, or 2 to 3 proteins. (b) When the complexes are found outside the crossing point, the average volume is 103 ± 9 nm3, or 1 to 2 proteins. (c) Combining both histograms in (b) and (c) the average protein volume on the DNA is 121 nm3.
Figure 8 with 1 supplement
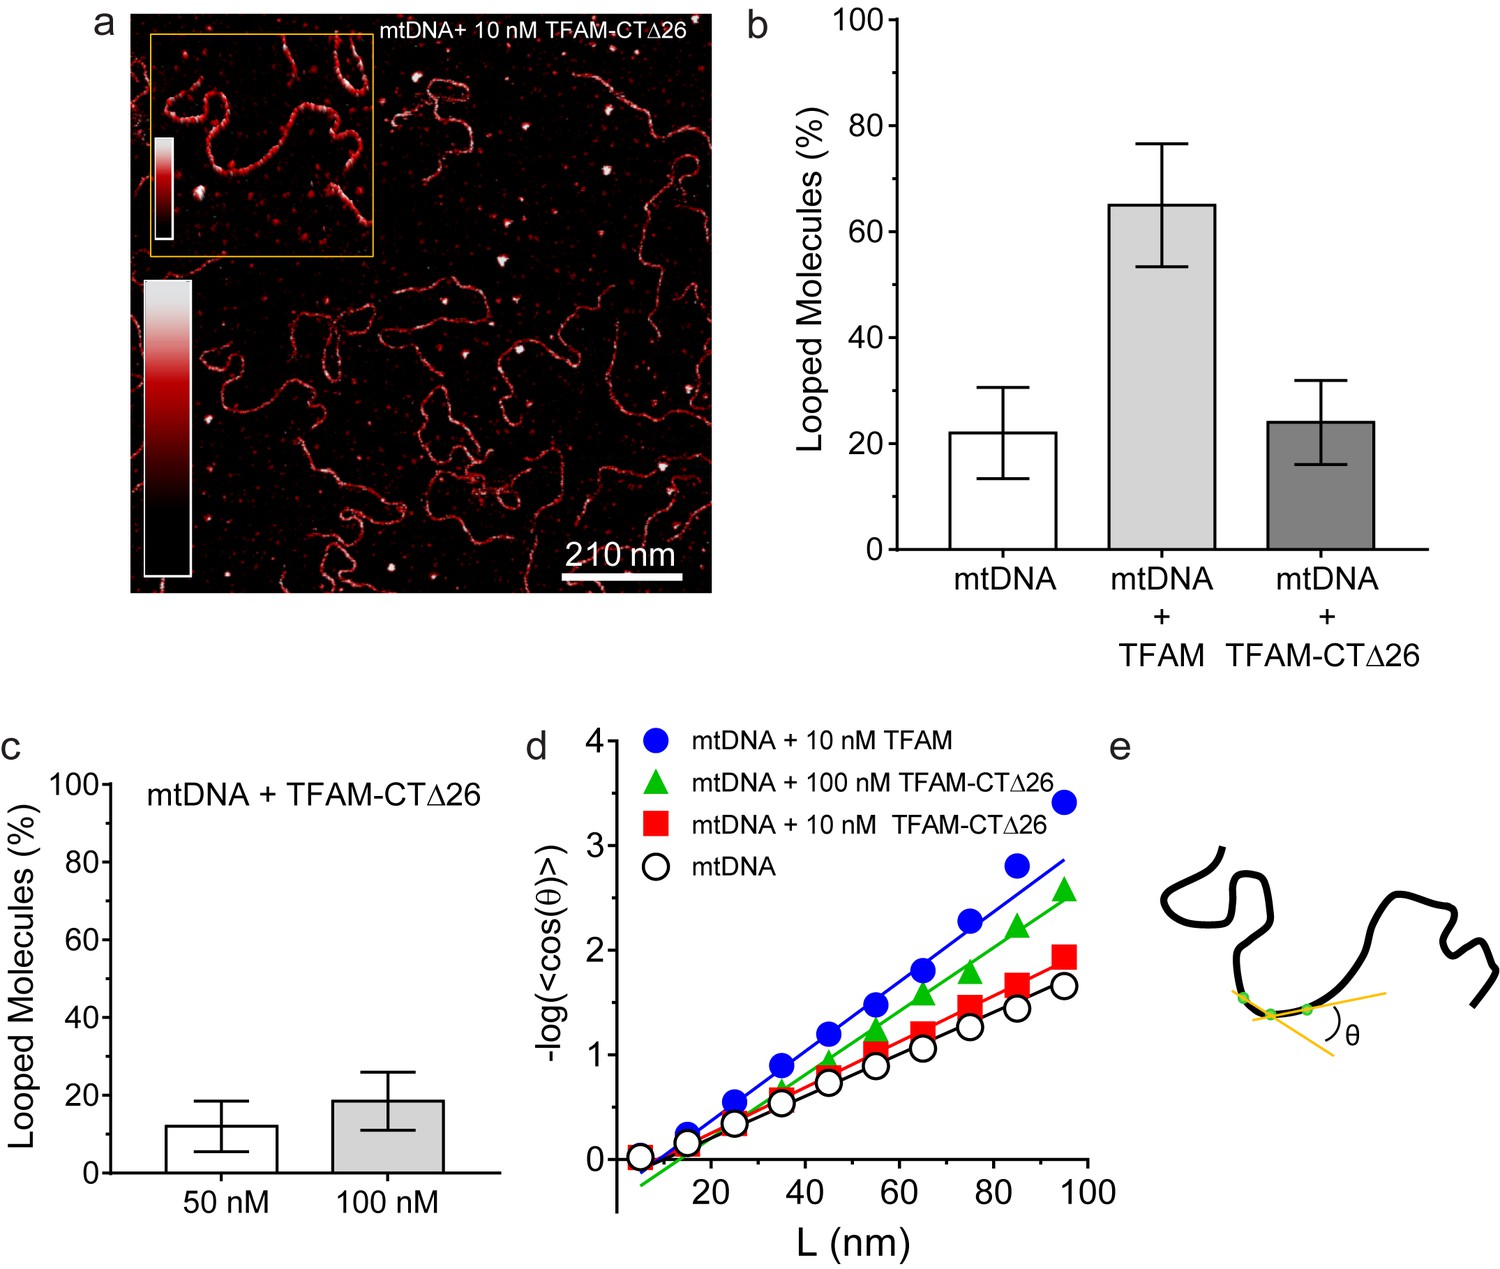
DNA looping is enhanced in the presence of TFAM, but not in the presence of TFAM-CTΔ26, even when strongly bound.
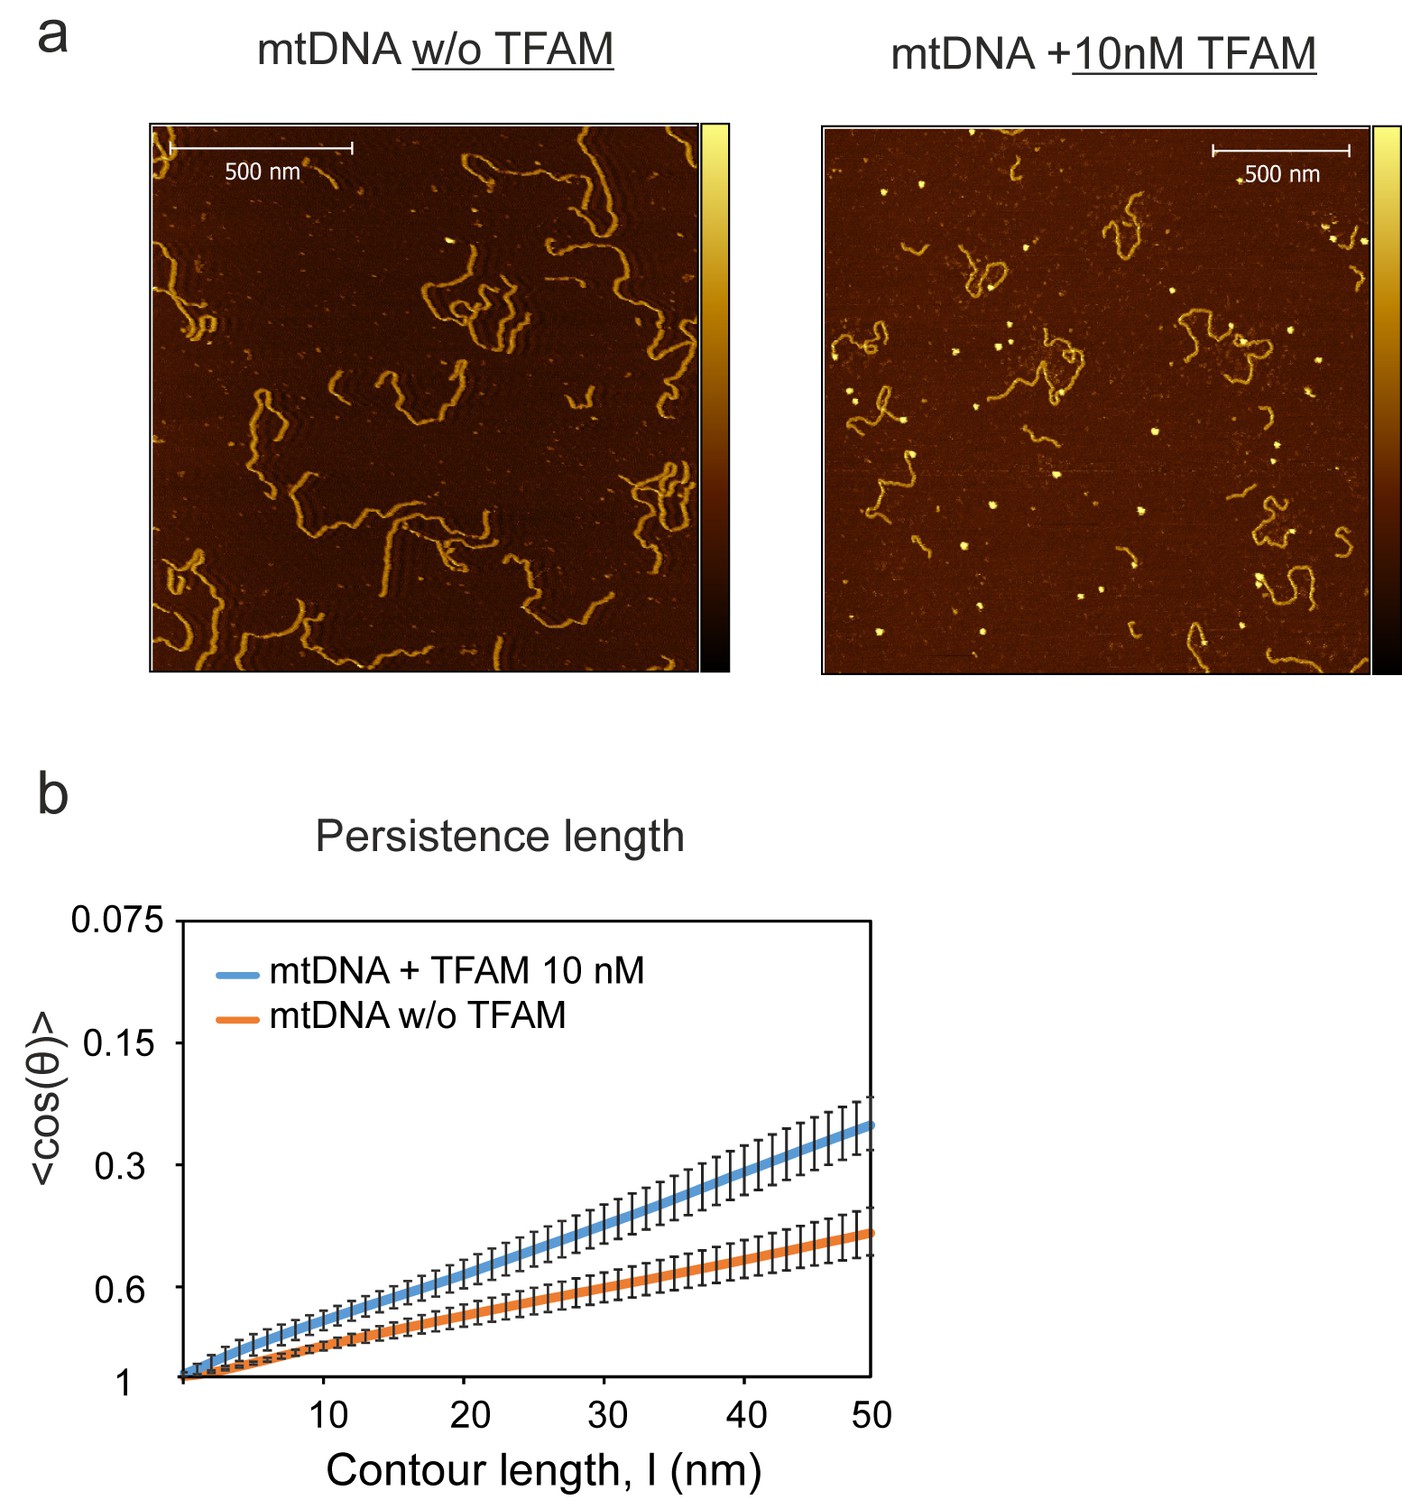
(a) Two-dimensional representation of mtDNA bound to TFAM-CTΔ26. The inset shows a three-dimensional representation of a selected region from the same image. The color bars represents the sample height ranging from 0.0 to 2.0 nm. (b) The bar graph shows the percentage of looped molecules that were observed for mtDNA constructs in the absence and presence of 10 nM TFAM or TFAM-CTΔ26. (c) Percentage of looped mtDNA molecules in the presence of 50 nM and 100 nM TFAM-CTΔ26, showing that even when strongly bound, TFAM-CTΔ26 does not increase DNA looping. (d) Fits to the 3D wormlike chain model for mtDNA construct in the absence and presence of TFAM or TFAM-CTΔ26. The results from the fits give persistence lengths of 50 ± 2 nm for mtDNA alone, 30 ± 2 nm for mtDNA with 10 nM TFAM, 46 ± 2 nm for mtDNA with 10 nM TFAM CTΔ26, and 33 ± 1 nm for mtDNA with 100 nM TFAM CTΔ26. These results show that 100 nM TFAM CTΔ26 is equivalent in DNA binding to 10 nM TFAM. (e) Diagram of a single DNA molecule. The distance between two consecutive green dots is L. The angle formed between these adjacent segments is θ.
Figure 8—figure supplement 1
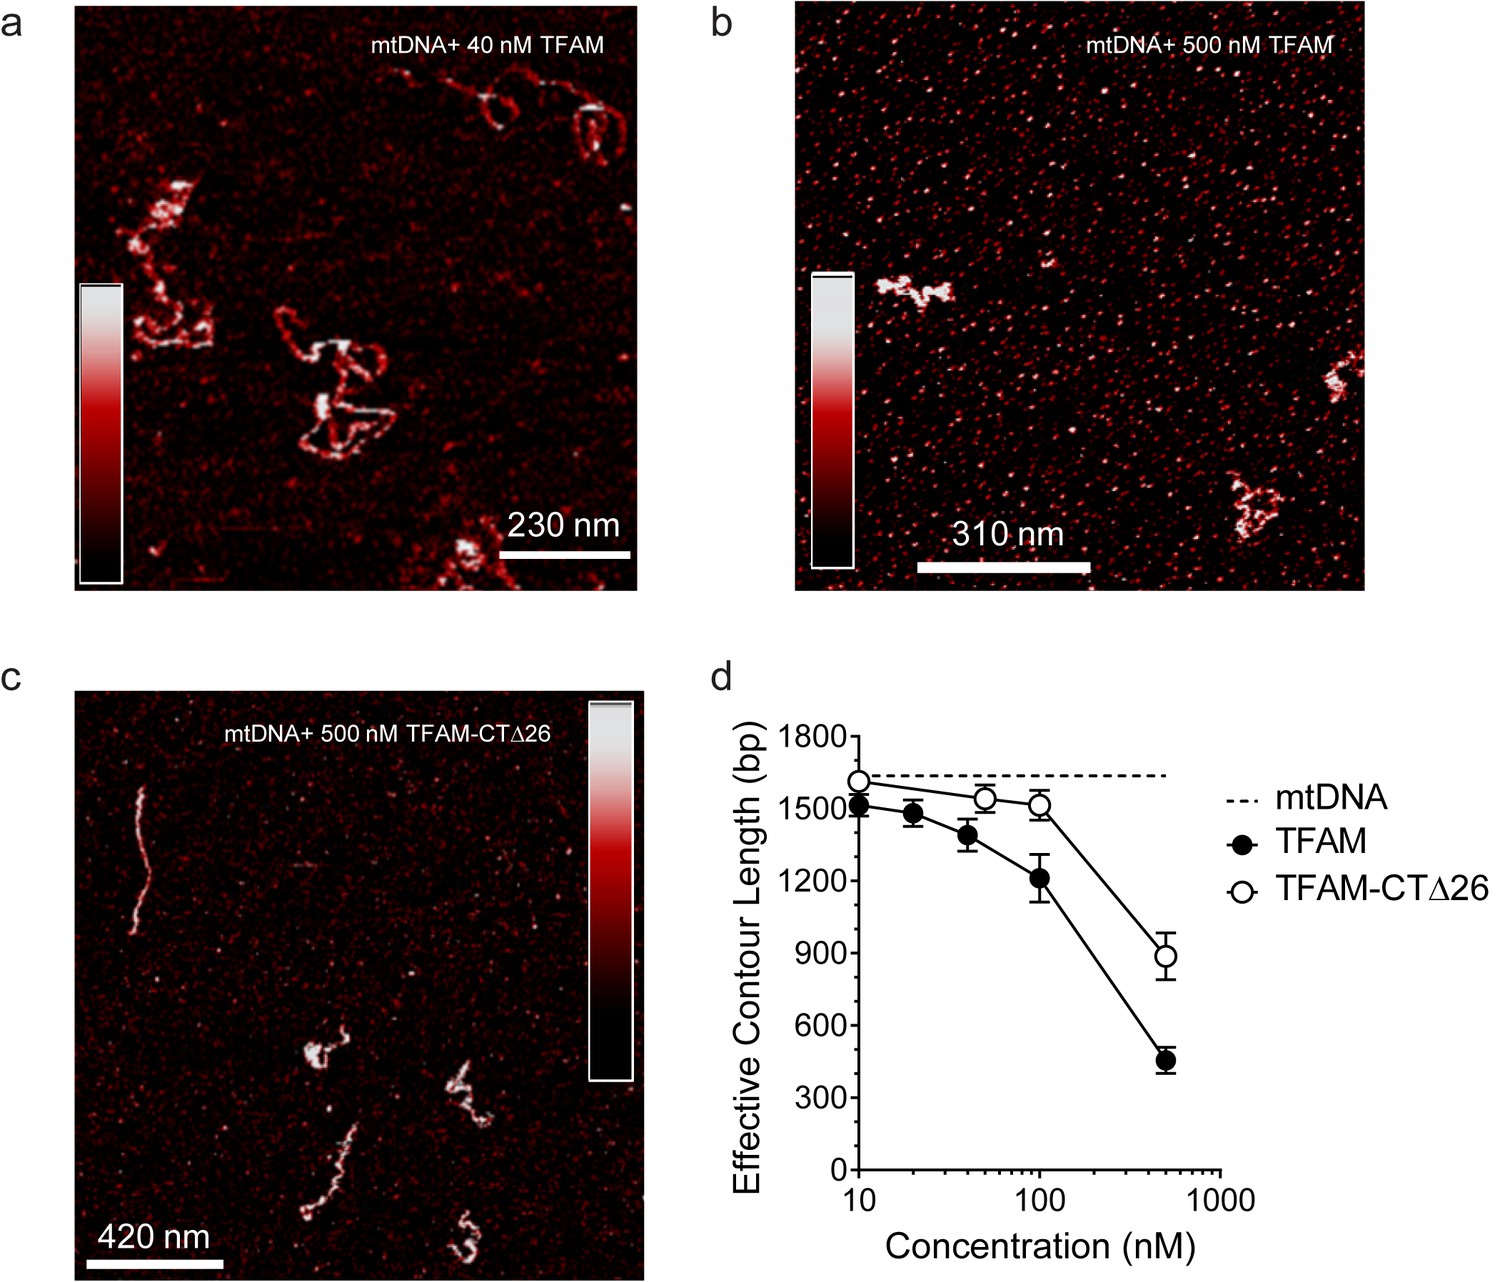
Both TFAM and TFAM-CTΔ26 compact DNA at high concentrations.
(a) Two-dimensional representation of 40 nM TFAM bound to 0.11 nM mtDNA. The color bar represents the sample height ranging from 0.0 to 2.0 nm. (b) Two-dimensional representation of 500 nM TFAM bound to 0.11 nM mtDNA. The color bar represents the sample height ranging from 0.0 to 2.0 nm. (c) Two-dimensional representation of 500 nM TFAM-ΔCT26 bound to 0.11 nM mtDNA. The color bar represents the sample height ranging from 0.0 to 2.0 nm. (d) Contour length of the mtDNA as a function of concentration of TFAM and TFAM-CTΔ26. The black dotted line represents the contour length of the mtDNA only. The open circles (with connecting black line) represent the measured contour length of the mtDNA in the presence of TFAM-CTΔ26. The filled black circles (with connecting black line) represent the measured contour length of the mtDNA in the presence of TFAM.
Figure 9
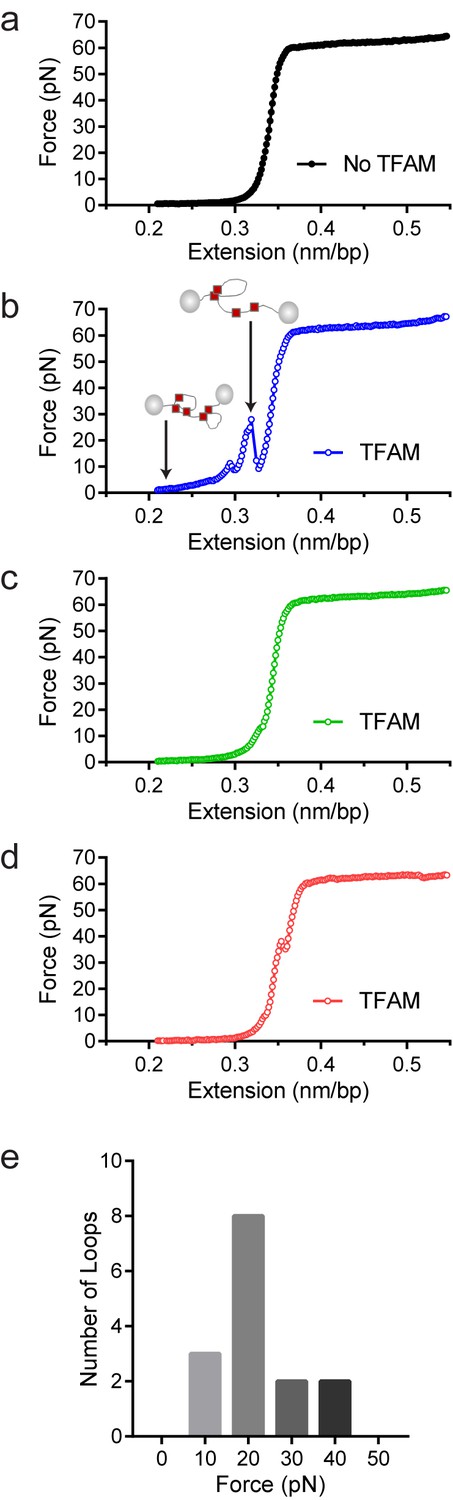
Optical tweezers data confirm DNA looping by TFAM.
(a) Force-extension curve of bacteriophage-λ molecule of 48,500 base pairs (bp) in the absence of TFAM. (b) Initial force-extension curve of bacteriophage-λ molecule in the presence of 50 nM TFAM (blue open circles). When held at low extension loops are mediated in the presence of TFAM and as the molecule of DNA is extended we observe jumps revealing the breaking of a loop previously formed. The cartoon inset illustrates the formation of loops mediated by TFAM and the breaking of loops as the DNA is extended. (c,d) Consecutive force-extension curves in the presence of TFAM are shown in green (panel c, extended immediately after the initial extension shown in panel b) and red (panel d, extended after waiting 7 min). (e) The histogram illustrates the forces involved in breaking the loops mediated by TFAM. The most probable loop breaking force is 20 pN.
Figure 10 with 1 supplement
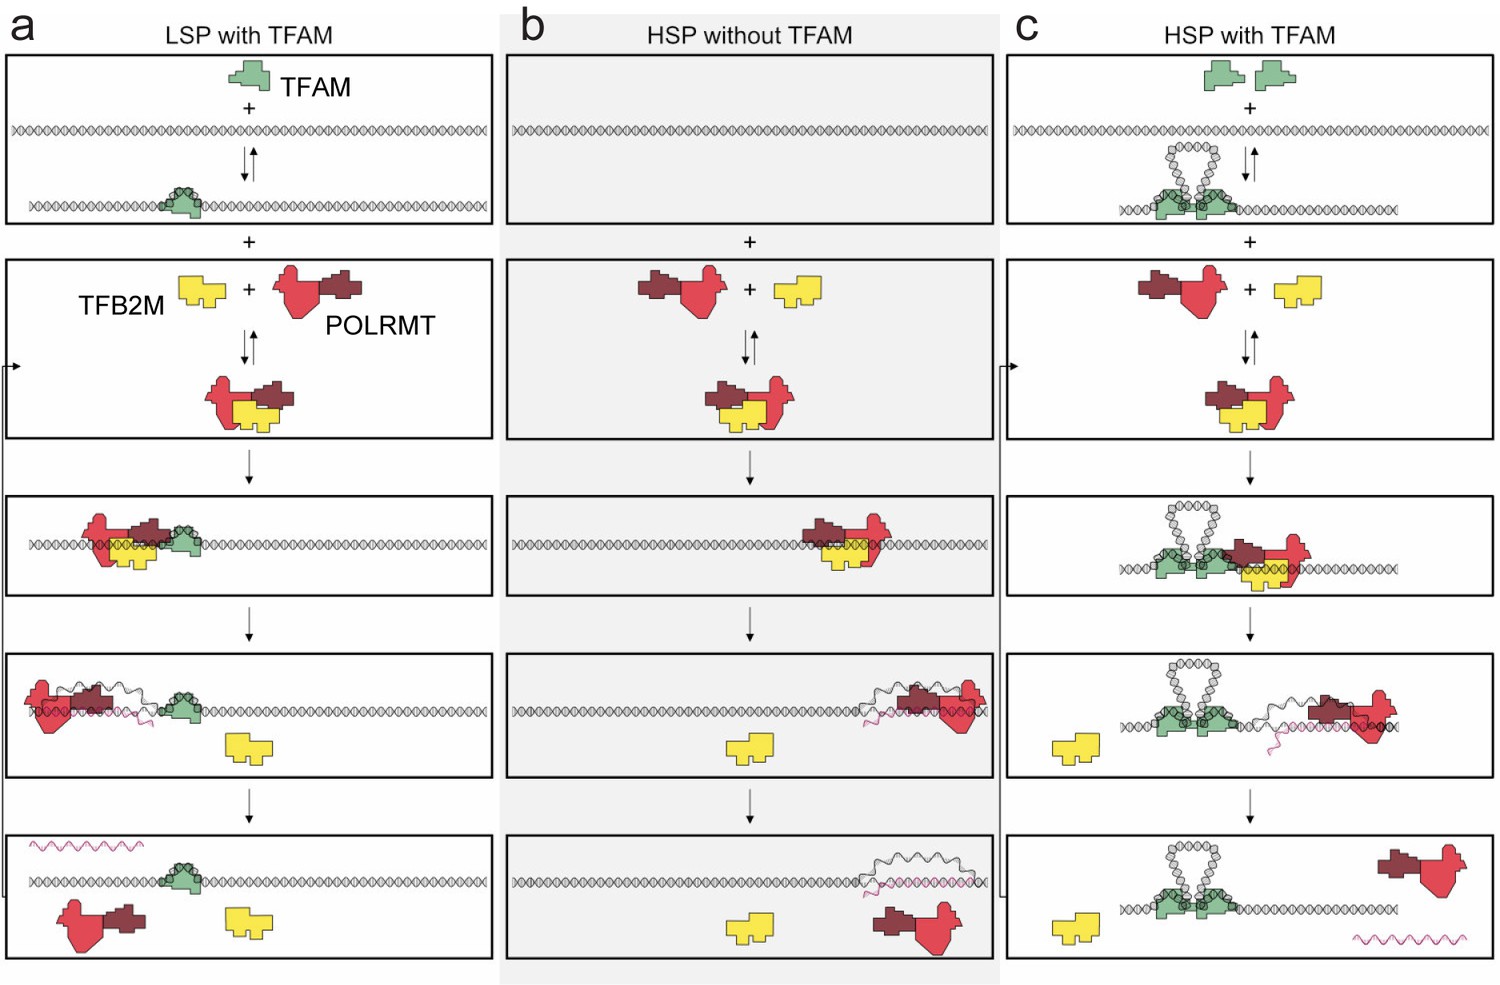
Regulation of mitochondrial transcription by TFAM.
(a) Initiation of transcription at light-strand promoter (LSP) requires TFAM. A TFAM monomer binds to a specific site upstream of the LSP transcription start site (TSS) and bends the DNA. POLRMT and TFB2M associate and add to LSP, perhaps directed by TFAM. Initiation requires all three components at this promoter; elongation only requires POLRMT. Elongation to the end of template leads to dissociation of POLRMT and RNA product from template, thus enabling another round of transcription. (b) Initiation of transcription at heavy-strand promoter 1 (HSP) does not require TFAM. POLRMT and TFB2M associate and are sufficient to recognize and bind to HSP. Initiation requires only these two components, and elongation requires only POLRMT. Elongation to the end of template leads to dissociation of POLRMT, but additional rounds of transcription are not supported, perhaps because RNA product remains hybridized to template. (c) Reutilization of HSP requires TFAM. Binding of a TFAM dimer to the inter-promoter region creates loops of the DNA. Formation of the loops requires the carboxy-terminal tail of TFAM. POLRMT and TFB2M associate and add to TFAM-bound HSP. Initiation and elongation occur as described above; except TFAM facilitates multiple turnovers from HSP. Looping is required for this function as deletion of the carboxy-terminal tail precludes TFAM activation at HSP. FIGURE SUPPPLEMENTS.
Figure 10—figure supplement 1
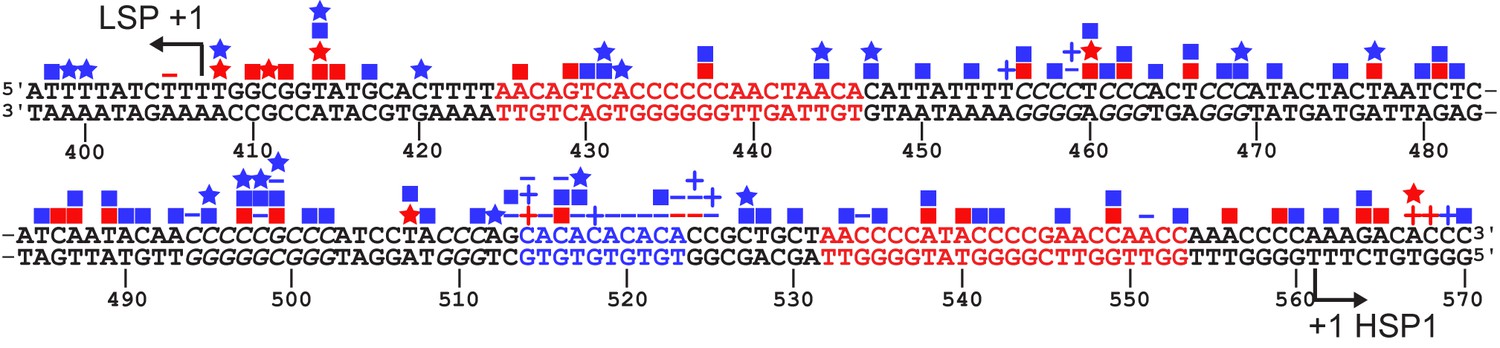
SNPs and somatic mutations associated with disease in LSP, HSP1 and HVR3.
The mtDNA sequence of LSP, HSP1 and HVR3/IPR is shown. SNPs and mutations associated with disease are shown as blue and red symbols, respectively; deletions (-); insertions (+), transitions (■); transversions (★). Location of putative TFAM-binding sites are colored red. CA repeats implicated in disease are colored blue. Possible TFAM binding sites in HVR3/IPR are italicized.
Tables
Table 1
DNA Oligonucleotides used in this study.
| DNA oligo | Sequence |
|---|---|
| LSP + 35-For | 5'AACACCAGCCTAACCAGATTTC3' |
| HSP1 + 45-Rev | 5'ATTGCTTTGAGGAGGTAAGC3' |
| HSP1-138-For | 5'TTAACAGTCACCCCCCAACTAAC3' |
| HSP1-114-For | 5'CATTATTTTCCCCTCCCACTC3' |
| HSP1-60-For | 5'CCATCCTACCCAGCACACAC3' |
| HSP1-50-For | 5'CAGCACACACACACCGCTGC3' |
| LSP-146-Rev | 5'GGTTGGTTCGGGGTATGGG3' |
| LSP-115-Rev | 5'GTGTGTGTGCTGGGTAGGATG3' |
| LSP-86-Rev | 5'TTGTATTGATGAGATTAGTAG3' |
| LSP-69-Rev | 5'GTAGTATGGGAGTGGGAGG3' |
| LSP-40-Rev | 5'GTGTTAGTTGGGGGGTGAC3' |
| IPR-Reg2-For | 5'ATTATTTTCCCCTCCCACTCCC3' |
| HSP1 + 70-Rev | 5'GAGCCCGTCTAAACATTTTC3' |
| HSP1 + 95-Rev | 5'AACCTATTTGTTTATGGGGTG3' |
| HSP1 + 120-Rev | 5'AGAGCTAATAGAAAGGCT3' |
| HSP1 + 145-Rev | 5'GATGCTTGCATGTGTAATCTTACTAAGAGCTAAT3' |
| °-Reg1-For | 5’GCACTTTTATTATTTTCCCCTCCCAC3’ |
| °-Reg1-Rev | 5’GGAAAATAATAAAAGTGCATACCGCC3’ |
| °-Reg5-For | 5’CAGCACACACACACCAAACCCCAAAGACAC3’ |
| °-Reg5-Rev | 5’GGTTTGGTGTGTGTGTGCTGGGTAG3’ |
| Inv-Reg5-For | 5’TGGTTCGGGGTATGGGGTTAGCAGCGGTACCAAACCCCAAAGACACCC3’ |
| Inv-Reg5-Rev | 5’ACCGCTGCTAACCCCATACCCCGAACCAGTGTGTGTGCTGGGTAGGATGG3’ |
| Rdm-Reg5-For | 5’GACCCGACCTCCCTACCACCACTCCGAACGACCACCCACCAAACCCCAAAGACACCCCC3’ |
| Rdm-Reg5-Rev | 5’TGGTGGTAGGGAGGTCGGGTCGGGGTGTATGAGGTGGGTCTTTGTATTGATGAGATTAGTAGTATGG3’ |
| LSP + 510-For | 5’CTTCCGGCTCGTATGTTGTGTGGAATTG3’ |
| HSP1 + 1000-Rev | 5’ACTTTAAAAGTGCTCATCATTGG3’ |
Download links
A two-part list of links to download the article, or parts of the article, in various formats.
Downloads (link to download the article as PDF)
Open citations (links to open the citations from this article in various online reference manager services)
Cite this article (links to download the citations from this article in formats compatible with various reference manager tools)
Unexpected sequences and structures of mtDNA required for efficient transcription from the first heavy-strand promoter
eLife 6:e27283.
https://doi.org/10.7554/eLife.27283


