Blockade of the LRP16-PKR-NF-κB signaling axis sensitizes colorectal carcinoma cells to DNA-damaging cytotoxic therapy
- Department of Molecular Biology, Immunological and Bio-therapeutic, Institute of Basic Medicine, Chinese PLA General Hospital, China
- Department of Pathology, Chinese PLA General Hospital, China
- Department of Pathology, Xiyuan Hospital, China Academy of Chinese Medical Sciences, China
- Division of Pharmaceutical Biosciences, Faculty of Pharmacy, University of Helsinki, Finland
- Department of Food and Environmental Sciences, University of Helsinki, Finland
Figures
Figure 1 with 1 supplement

LRP16 is progressively elevated expression during progression of CRC.
(A) Representative images of tumors and matched adjacent tissues from a tissue array containing 202 CRC samples paired with adjacent normal colon tissues, which were immunohistochemically (IHC) stained for LRP16 expression. The outlined areas in the left images are magnified on the right. Scale bars, 50 μm. (B) LRP16 expression scores by IHC shown as scatter dot plots. We compared the CRC tissues with the matched adjacent normal colon tissues using the Wilcoxon matched pairs test (n = 202). Error bars represented the mean ± SD. *p<0.05, **p<0.01, ***p<0.001, ****p<0.0001. (C–D) Analysis of LRP16 expression levels in CRC samples based on the indicated stratification (T stages and tumor stages). Error bars represented the mean ± SD. *p<0.05, **p<0.01, ***p<0.001, ****p<0.0001. (E) Kaplan–Meier plot of the overall survival (OS) of 202 patients with CRC (two groups stratified by LRP16 expression level: low LRP16 [0 and 1], N = 87; high LRP16 [2 and 3], N = 115). A log-rank test was used to compare the differences between two groups. (F–I) Raw data were exported from The Cancer Genome Atlas (TCGA) CRC database. Whisker plots of the expression of LRP16 in CRC samples based on the indicated stratification, T stages (F), tumor stages (G), lymph-node metastasis (H), distant metastasis (I). Data presented as the log2 median-centered ratio expression. Unpaired Mann–Whitney test was used to evaluate statistical significance. Error bars represented the mean ± SD. *p<0.05, **p<0.01, ***p<0.001, ****p<0.0001. (J) Representative images of CRC tissue samples and matched adjacent tissues from a tissue array containing 202 CRC samples paired with adjacent normal colon tissues, IHC stained for p65 expression. The outlined areas in the left images are magnified on the right. Scale bars, 50 μm. p65 expression scores are shown as scatter dot plots. We compared the CRC tissues with the matched adjacent normal colon tissues with the Wilcoxon matched pairs test (N = 202). Error bars represented the mean ± SD. *p<0.05, **p<0.01, ***p<0.001, ****p<0.0001. (K) Representative images of two serial sections from the same tissue samples IHC stained for LRP16 and p65. Scale bars, 50 μm. (L) Positive correlation between LRP16 and p65 expression levels. The 202 samples were classified into two groups (low LRP16, N = 87; high LRP16, N = 115) based on the LRP16 level relative to the score for the whole cohort. p<0.01, calculated with both the χ2 and Mann–Whitney tests. Pearson correlation between LRP16 and p65 expression levels (N = 102; p<0.0001; R2 = 0.09732).
-
Figure 1—source data 1
LRP16 expression in tumor-adjacent tissues of the colorectal carcinoma (CRC) patient subgroups according to clinical pathological parameters.
- https://cdn.elifesciences.org/articles/27301/elife-27301-fig1-data1-v2.docx
Figure 1—figure supplement 1
LRP16 is significantly elevated and positively correlates with constitutive NF-κB activation in human CRC samples.
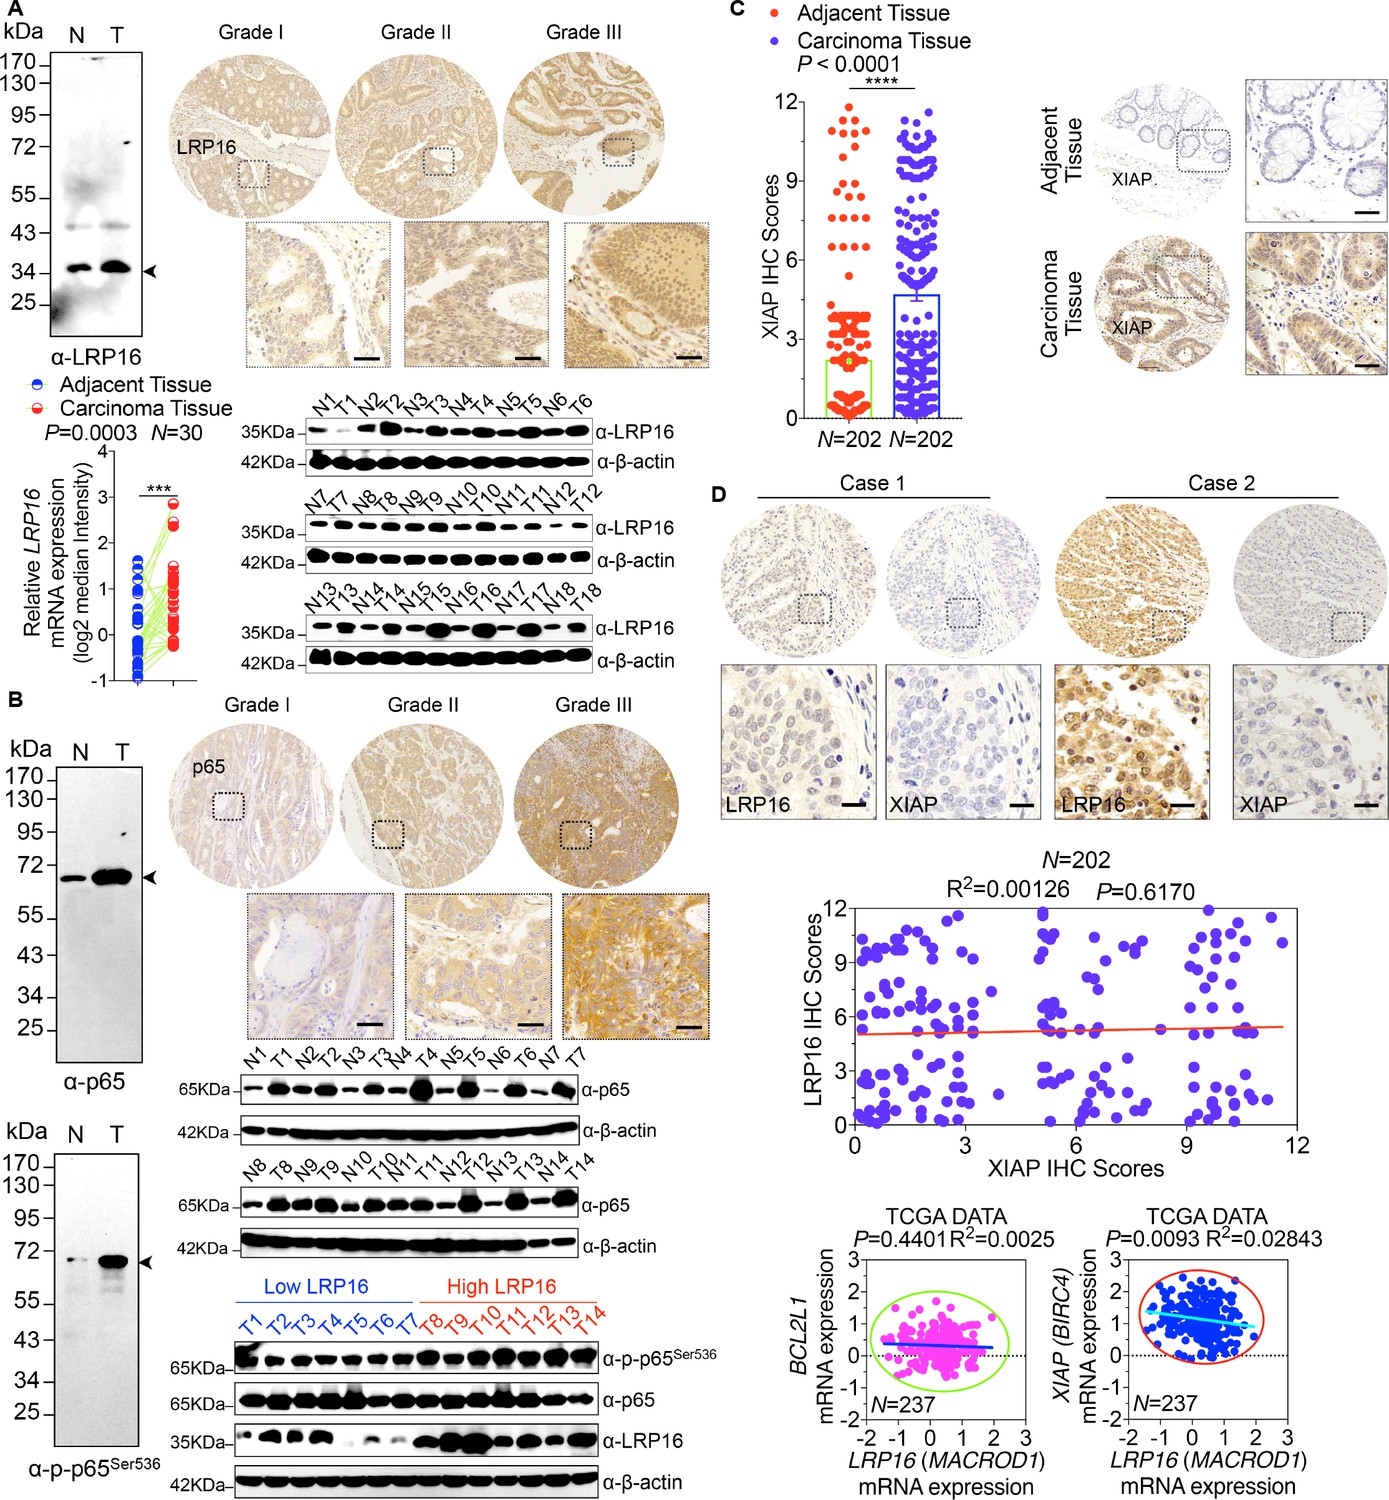
(A) LRP16 protein expression is higher in CRC tissues compared with adjacent normal tissues, as determined by Western blot and RT-qPCR. Representative IHC images are shown, based on the histological grades of CRC patients. Alternatively, the specificity of the LRP16 antibody used in IHC analysis was confirmed by Western blot. (B) p65 protein expression is higher in CRC tissues compared with adjacent normal tissues, as determined by Western blot. Representative IHC images are shown, based on the histological grades of CRC patients. LRP16 expression is positively correlated with phospho-p65 expression levels in some representative CRC tissues, as determined by Western blot. Alternatively, the specificity of the p65 and phospho-p65 antibodies used in IHC analysis were also confirmed by Western blot. (C) XIAP protein expression scores by IHC shown as scatter dot plots. Scale bars, 50 μm. We compared CRC tissues with matched adjacent normal tissues using a Wilcoxon matched pairs test. N = 202. Error bars represented the mean ± SD.*p<0.05, **p<0.01, ***p<0.001, ****p<0.0001. (D) Representative images of IHC staining for LRP16 and XIAP in two serial sections from the same tissue samples. Scale bars, 50 μm. Pearson’s correlation between LRP16 and PKR expression levels (N = 202; p=0.6170; R2 = 0.00126). We also analyzed the correlation of LRP16 and XIAP or BCL2L1 mRNA expression levels in TCGA CRC cohort. Data are representative of at least three independent experiments.
Figure 2 with 3 supplements
LRP16 mediates acquired resistance to etoposide in CRCs.
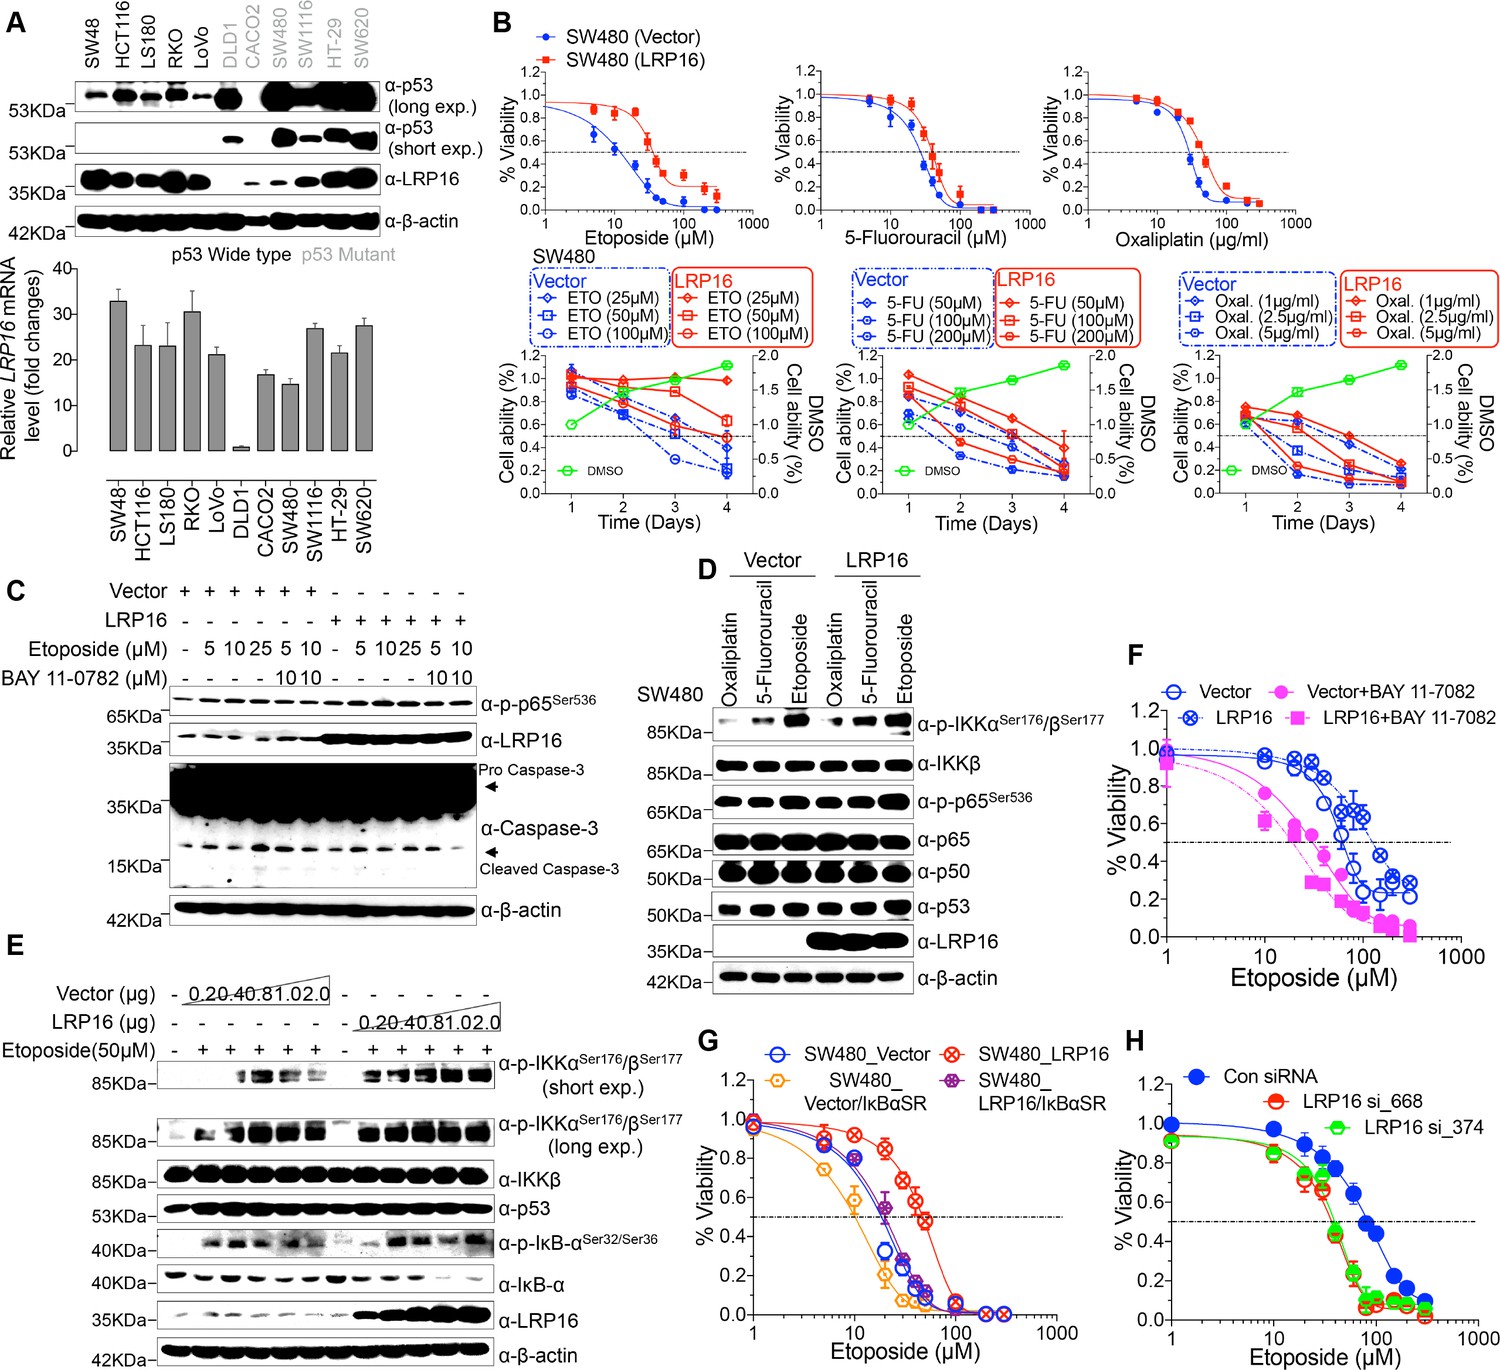
(A) Expression levels of LRP16 were analyzed in 11 CRC cell lines with Western blotting and RT–qPCR. (B) Cell growth assay. SW480 cells were transfected with the control vector or an LRP16-expressing plasmid for 48 hr, and then treated with etoposide, 5-fluorouracil, or oxaliplatin for a further 72 hr. Cell viability was determined with a CCK-8 assay. (C) SW480 cells transfected with an LRP16-expressing plasmid or the control vector were treated for 36 hr with the indicated concentrations of etoposide and/or BAY 11–7082. Cell lysates were separated with SDS-PAGE and analyzed with Western blotting using the indicated antibody. β-Actin was used as the loading control. (D) SW480 cells transfected with an LRP16-expressing plasmid or the control vector were treated with etoposide (50 μM), 5-fluorouracil (100 μM), or oxaliplatin (2 μg/ml) for 3 hr, and the cell lysates were analyzed with Western blotting using the indicated antibodies. (E) SW480 cells transfected with increasing doses of an LRP16-expressing plasmid or the control vector were treated with etoposide (50 μM), and then immunoblotted with the indicated antibodies. (F) SW480 cells transfected with an LRP16-expressing plasmid or the control vector were pretreated with or without BAY 11–7082 and then treated with etoposide for indicated concentrations, and subjected to a cell viability analysis. (G) SW480 cells transfected with the indicated plasmids and treated with etoposide for indicated concentrations, and subjected to a cell viability analysis. (H) SW620 cells were transfected with control or LRP16-directed shRNAs, and the resulting stable cells were treated with etoposide and subjected to a cell viability analysis. Data are representative of at least three independent experiments.
Figure 2—figure supplement 1
The cytotoxic and cytostatic effects of chemotherapeutic drugs on CRC cell lines.
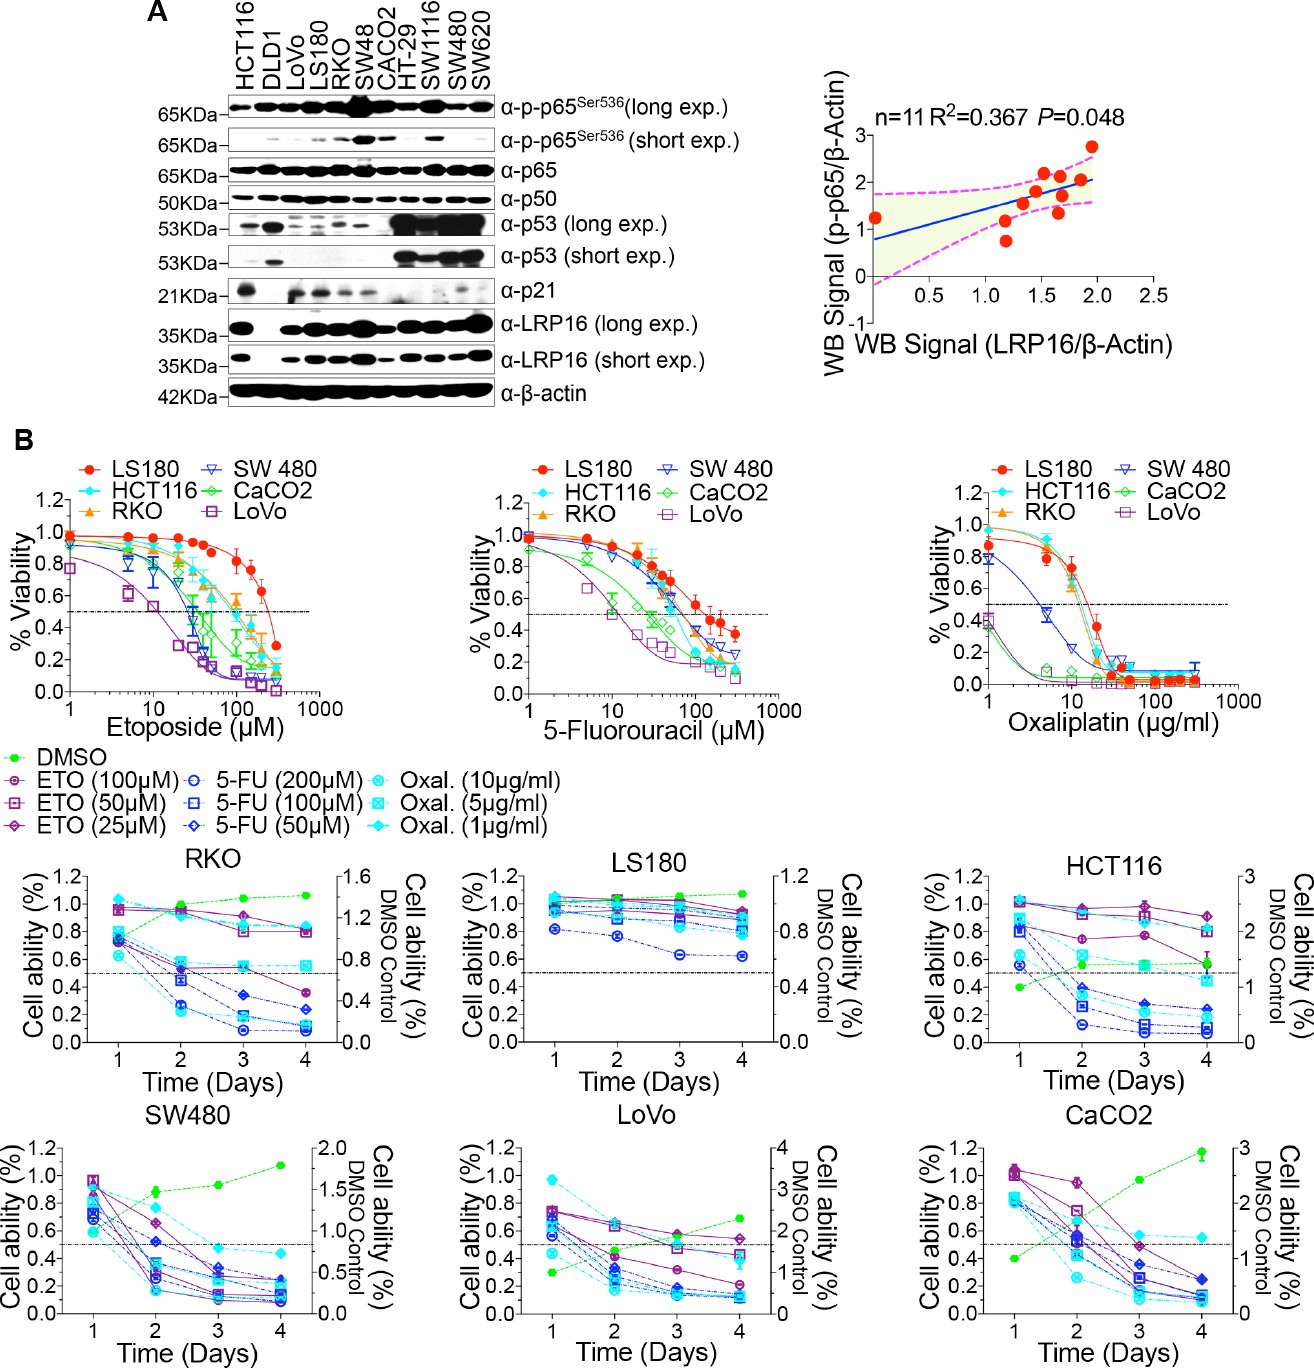
(A) Whole cell lysates from 11 different CRC cell lines were immunoblotted with the indicated antibody. β-Actin was used as the loading control. Correlation analysis gray value using ImageJ software for the protein expression level of LRP16 and phosphorylation-p65 by R programming. (B) RKO, LS180, HCT116, LoVo, SW480, and CACO2 cell lines were treated with the indicated concentrations of etoposide, 5-fluorouracil, or oxaliplatin for 3 days and cell viability was measured with a CCK8 assay (upper). RKO, LS180, HCT116, LoVo, SW480, and CACO2 cell lines were treated with etoposide, 5-fluorouracil, or oxaliplatin for the indicated times and then cell viability was measured with a CCK8 assay (bottom). Data are representative of at least three independent experiments.
Figure 2—figure supplement 2

LRP16 plays a critical protective role for the survival of CRC cells.
(A) SW480 cells transfected with the control vector or an LRP16-expressing plasmid were treated with the indicated concentrations of etoposide, 5-fluorouracil, or oxaliplatin and then subjected to a clonogenic cell survival assay for 14 days. (B) Transwell invasion assays of SW480 cells transfected with control vector or LRP16-expressing plasmid were treated with the indicated concentrations of etoposide, 5-fluorouracil, or oxaliplatin. (C) Whole cell lysates from 11 different colon cancer cell lines treated with etoposide (50 μM) or 5-fluorouracil (100 μM) for 2 hr were immunoblotted with the indicated antibody. β-Actin was used as a loading control. Data are representative of at least three independent experiments.
Figure 2—figure supplement 3
The protective roles of LRP16 for CRC cell survival rely on PAR-dependent NF-κB activation in response to DNA damage.
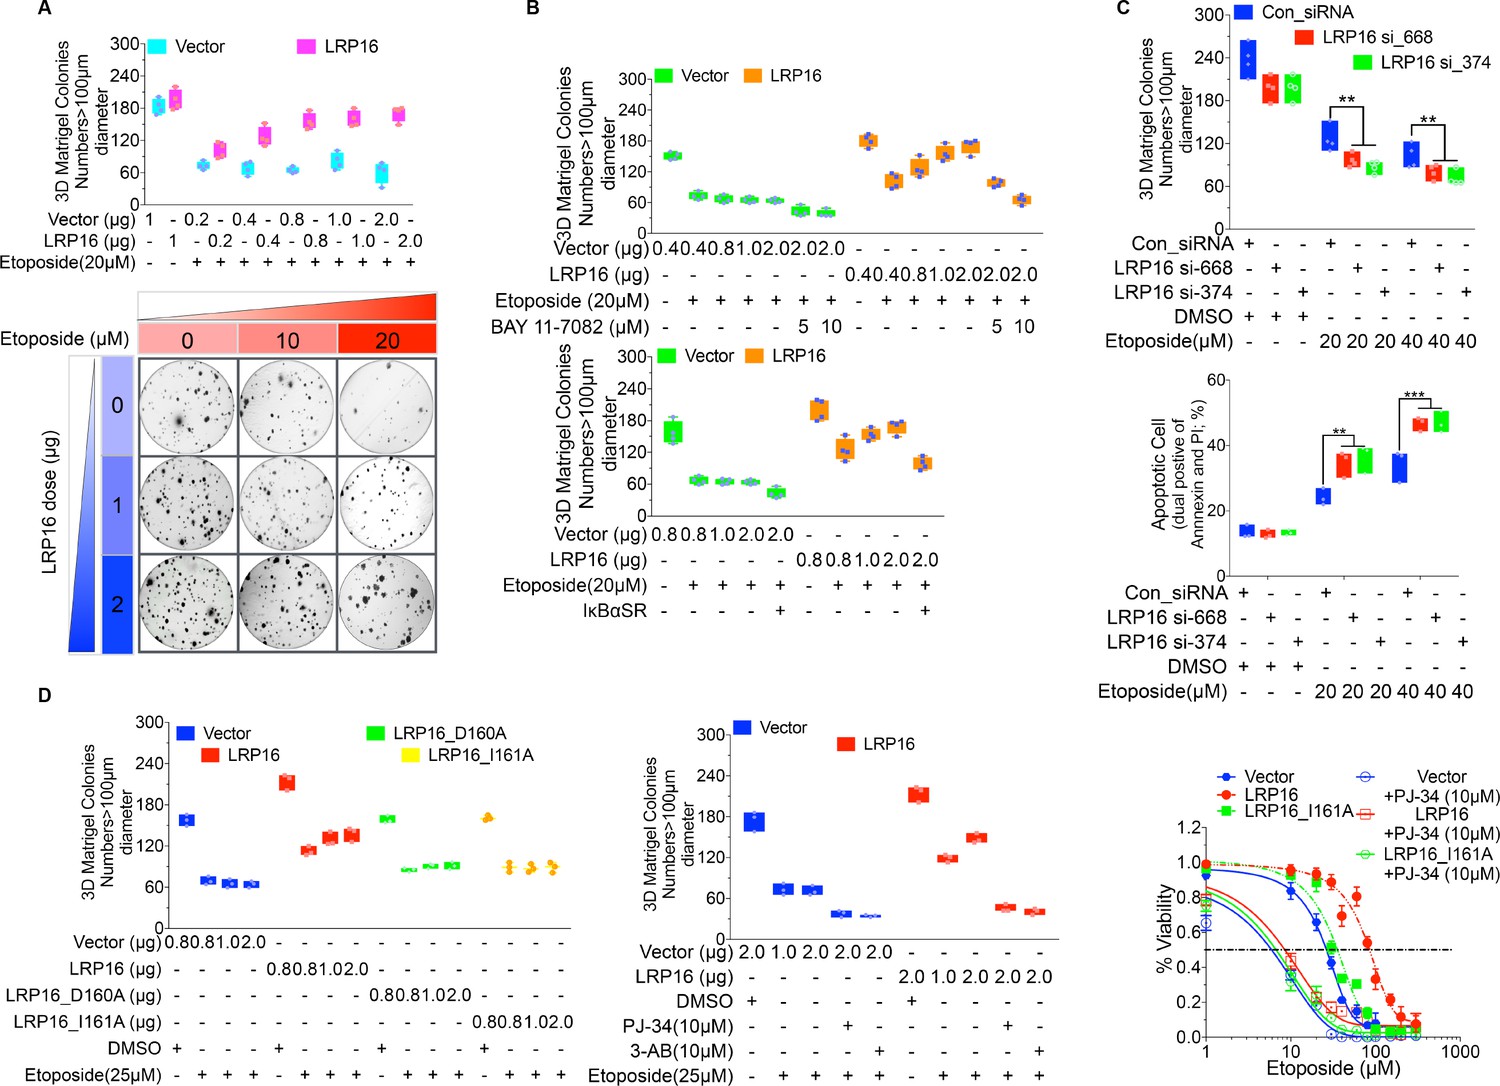
(A) SW480 cells transfected with increasing doses of LRP16 or the control for 48 hr were then treated with increasing amounts of etoposide for 14 days and then subjected to a clonogenic cell survival assay. (B) SW480 cells transfected with increasing doses of an LRP16-expressing plasmid or the control vector were treated with the indicated concentrations of etoposide and/or BAY 11–7082 for 12 days and subjected to a clonogenic cell survival assay. Quantification of the clonogenic cells from four independent experiments is shown. (C) SW620 cells were transfected with control or LRP16-directed siRNAs, and the resulting stable cells were treated with etoposide and subjected to clonogenic cell survival assay, and cell apoptosis analysis. (D) SW480 cells were transfected with the indicated plasmids (control vector, LRP16, LRP16_D160A, and LRP16_I161A) for 48 hr, and then were treated the indicated concentrations of etoposide and/or PARP inhibitors (PJ-34 or 3-AB) subjected to clonogenic cell survival and cell viability assays. One representative experiment of three was shown.
Figure 3 with 4 supplements

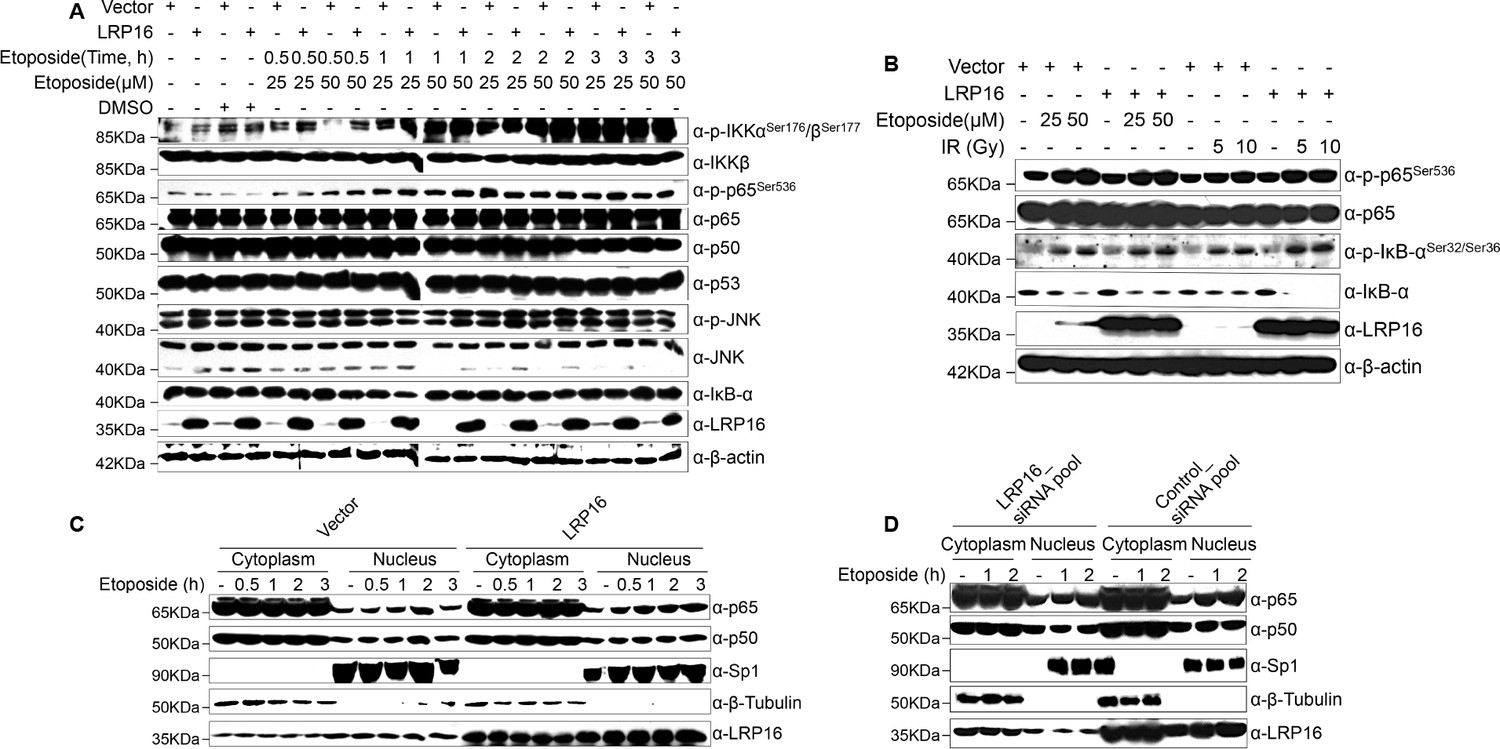
LRP16 is required for genotoxicity-induced NF-κB activation.
(A) Whole cell lysates from cells transfected with an LRP16-expressing plasmid or the control vector were treated with the indicated concentrations of etoposide for 2 hr or with 50 μM etoposide for the indicated periods, and then immunoblotted with the indicated antibody. β-Actin was used as the loading control. (B) SW480 cells transfected with an LRP16-expressing plasmid or the control vector were treated with IR for the indicated dose. The cell lysates were then separated with SDS-PAGE and analyzed with Western blotting using the indicated antibody. (C) Whole-cell lysates from SW620 cells transfected with the indicated siRNAs and treated with the indicated concentrations of etoposide for 2 hr or with 50 μM etoposide for the indicated periods were immunoblotted with the indicated antibody. β-Actin was used as the loading control. (D) SW620 cells were transfected with the indicated siRNAs and exposed to IR for the indicated periods. Their lysates were separated with SDS-PAGE and analyzed with Western blotting using the indicated antibody. (E) SW620 cells were cotransfected with the indicated siRNAs and/or the LRP16-expressing vector that contained silent mutations in the sequences that targeted by the LRP16 siRNAs, and were then treated with 50 μM etoposide for the indicated periods. The cell lysates were immunoblotted using the indicated antibody. (F) Whole cell lysates of cells transfected with the control vector or vectors expressing LRP16 or the LRP16 mutants (LRP16_D160A, LRP16_I161A) and treated with the indicated concentrations of etoposide for 2 hr or with 50 μM etoposide for the indicated periods were immunoblotted with the indicated antibody. β-Actin was used as the loading control. One representative experiment of three was shown.
Figure 3—figure supplement 1
LRP16 executes an essential function in the nuclear-initiated NF-κB signaling in response to DNA damage.
(A) LoVo cells transfected with control vector or LRP16-expressing plasmid were treated with the indicated concentrations of etoposide or with etoposide for the indicated periods, and their lysates were separated with SDS-PAGE and analyzed with Western blotting using the indicated antibody. β-Actin was used as the loading control. (B) LoVo cells transfected with control vector or LRP16-expressing plasmid were treated with the indicated concentrations of etoposide or with the indicated doses of IR for 2 hr, and their lysates were analyzed with Western blotting using the indicated antibody. β-Actin was used as the loading control. (C) Cytosolic and nuclear fractions derived from SW480 cells transfected with an LRP16-expressing plasmid or the control vector for 48 hr and then treated with etoposide (50 μM) for the indicated periods were immunoblotted with the indicated antibody. β-Tubulin and Sp1 were used as the loading controls and the cytosolic and nuclear markers, respectively. (D) SW620 cells were transfected with the indicated siRNAs and exposed to 50 μM etoposide for the indicated periods. The cytoplasmic and nuclear fractions were then prepared and immunoblotted with the indicated antibodies. One representative experiment of three was shown.
Figure 3—figure supplement 2
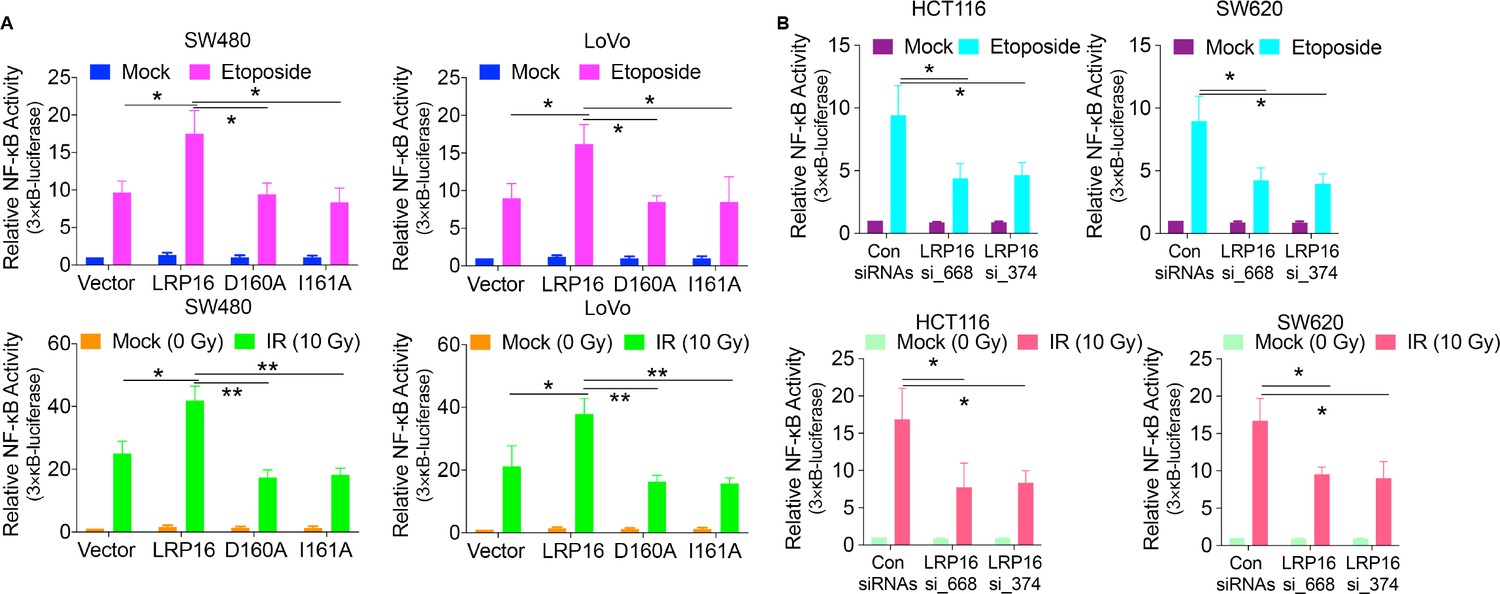
LRP16 is required for NF-κB transactivation in response to genotoxic stress.
(A) NF-κB transcriptional activity. SW480 cells or LoVo cells were co-transfected 3 × κB-luc luciferase reporter constructs with the indicated plasmids for 48 hr followed by the treatment with etoposide or IR. Luciferase activity was normalized by that in the vehicle group. (B) SW620 cells or HCT116 cells co-transfected 3 × κB-luc luciferase reporter constructs with the indicated siRNAs for 48 hr were treated with etoposide or IR for luciferase activity assay. Error bars in (A) and (B) represent the mean ± SD for triplicate experiments. *p<0.05, **p<0.01.
Figure 3—figure supplement 3
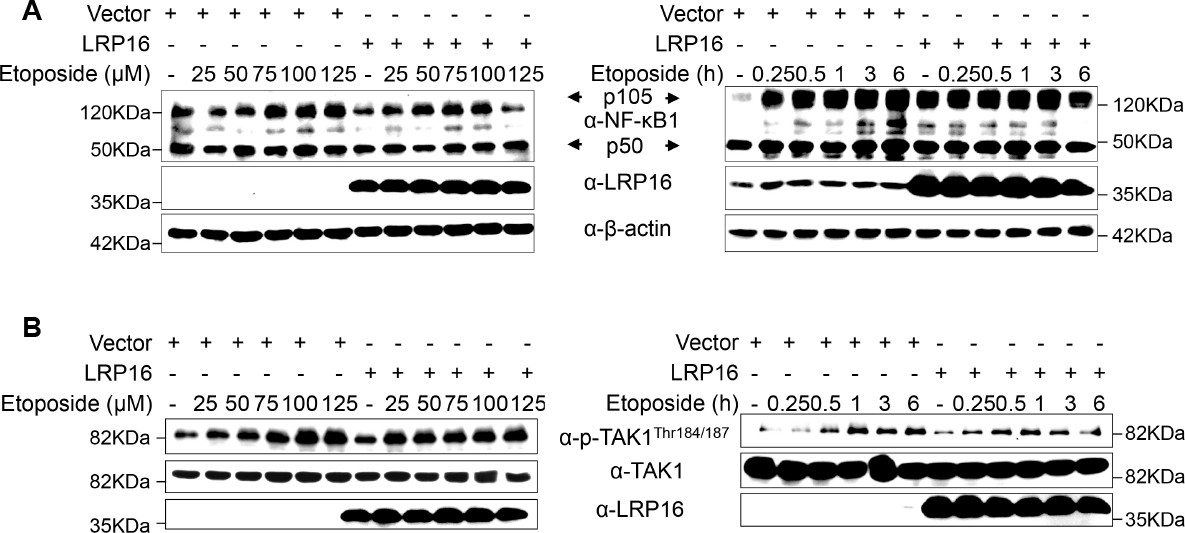
LRP16 is not critical for NF-κB1 and TAK1 activation during the cellular response to gentoxic stress.
(A–B) SW480 cells transfected with control vector or LRP16-expressing plasmid were treated with the indicated concentrations of etoposide or etoposide for the indicated periods. Their lysates were subjected to immunoblotting using the indicated antibody. One representative experiment of three was shown.
Figure 3—figure supplement 4
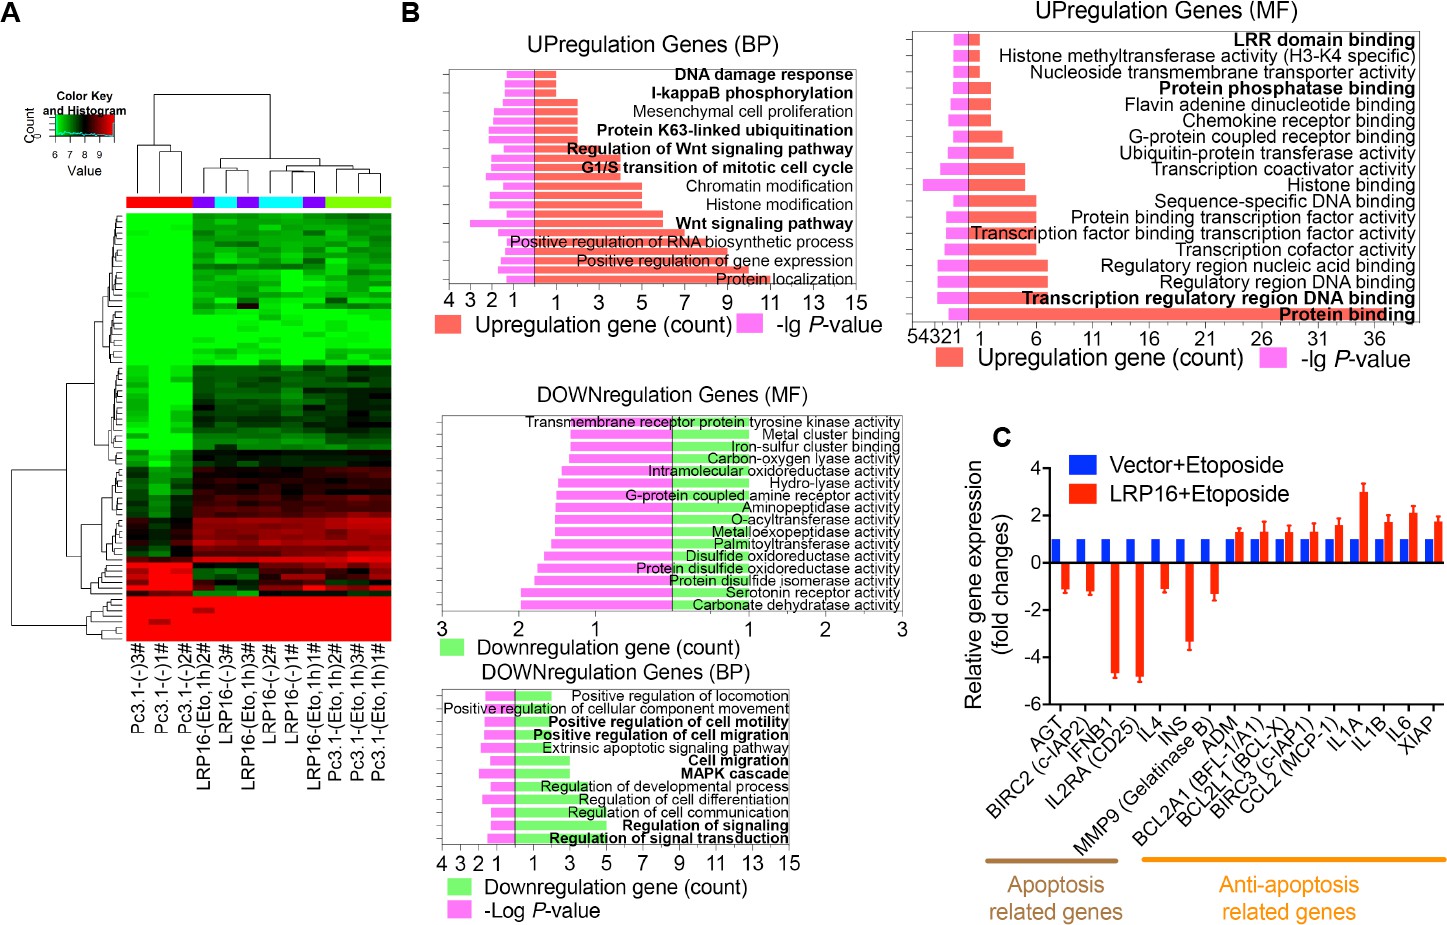
Ectopic of LRP16 augments DNA-damage-triggered NF-κB-mediated expression of anti-apoptotic molecules.
(A) The expression of different genes in SW480 cells that were transfected with an LRP16-expressing plasmid or the control vector followed by the treatment with etoposide were assessed with a gene expression microarray and is presented as a heat map. (B) Analyses of KEGG and GO functional pathway were performed using the gene expression microarray data. (C) RT–qPCR measurement of the expression of the indicated genes, selected from the PCR array results for human NF-κB signaling pathway, in SW480 cells during the ectopic expression of LRP16 or the control cells followed by the treatment with etoposide (50 μM) for 1 hr. One representative experiment of three was shown.
Figure 4 with 1 supplement
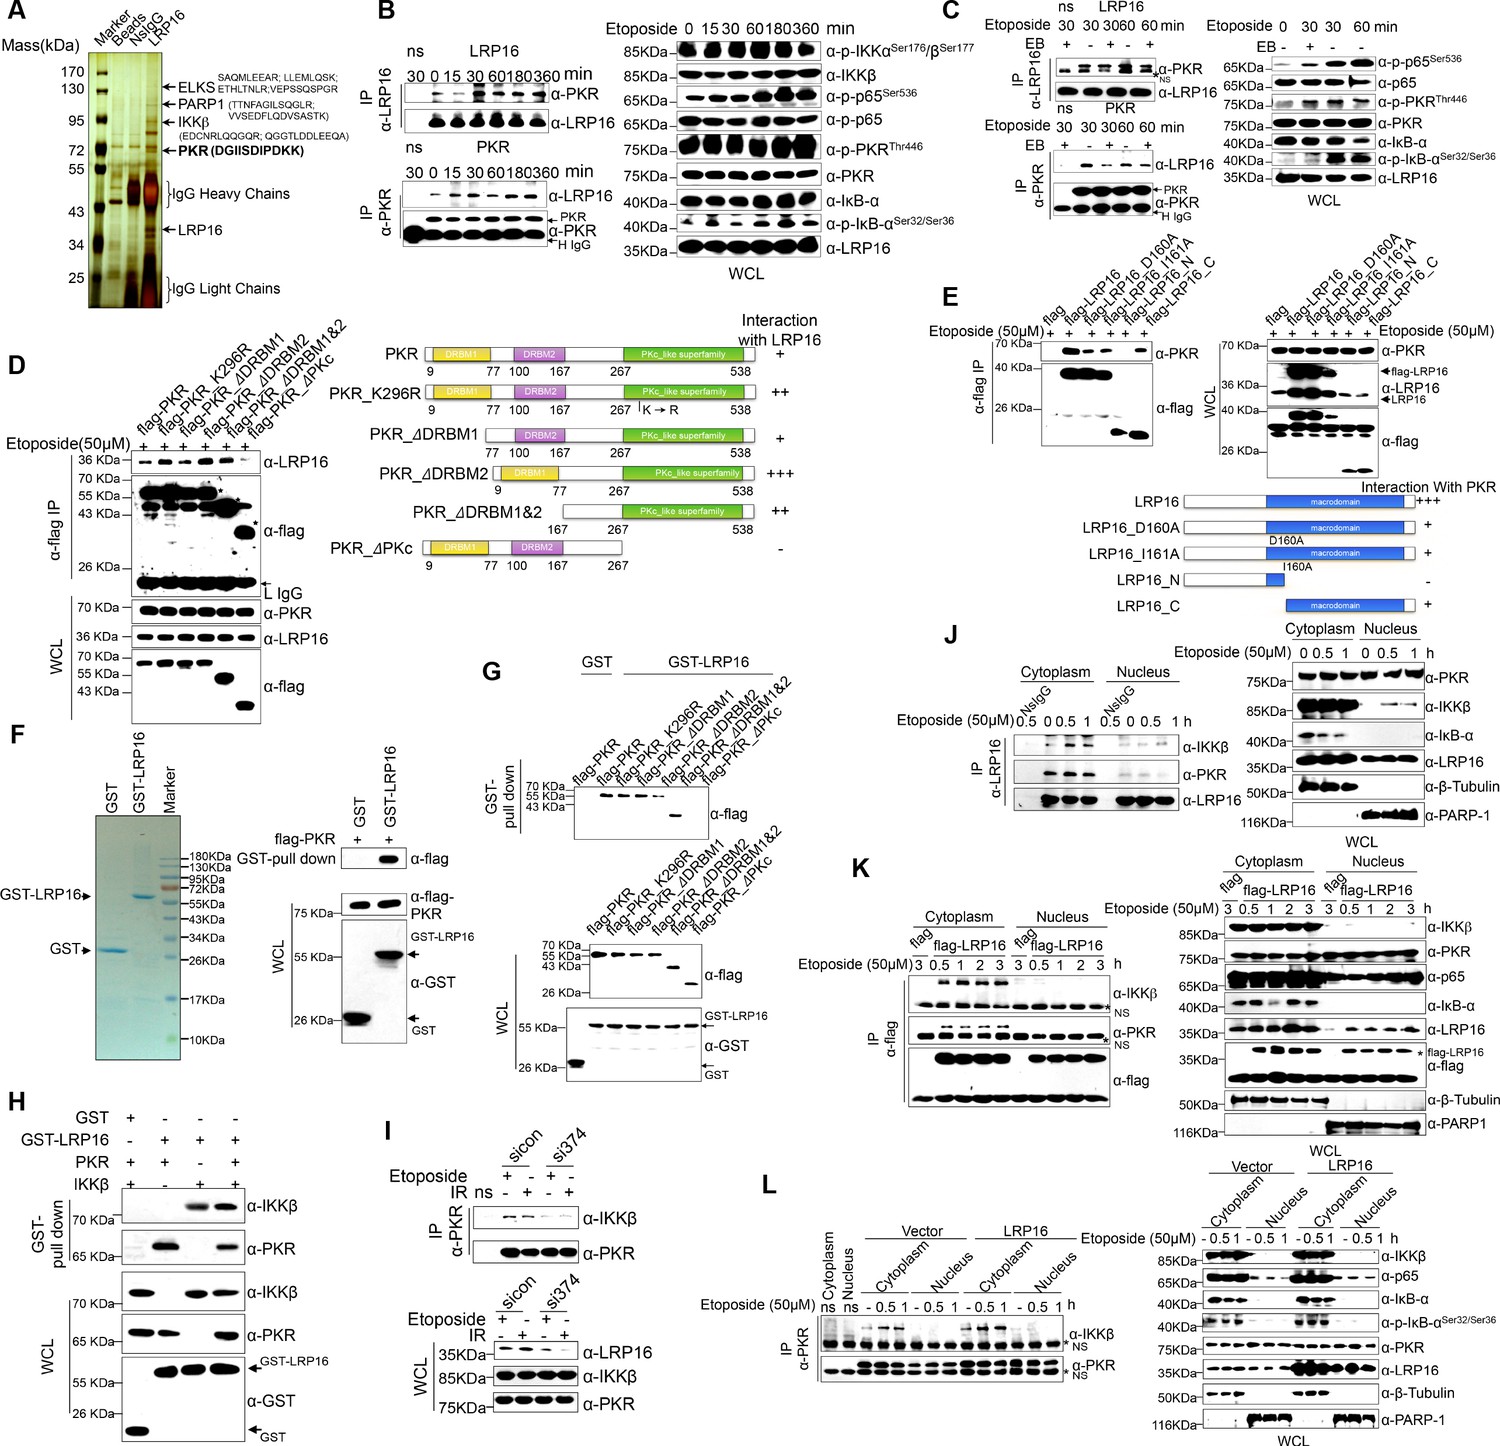
LRP16 physically interacts with PKR/IKKβ in the cytoplasm.
(A) Mass spectrometry (MS) analysis of LRP16-associated proteins. Total cell lysate of SW620 cells was subjected to affinity purification with an anti-LRP16 antibody. The purified protein complex was resolved with SDS-PAGE and silver stained. The bands were excised, purified, and analyzed with MS. (B–C) Interactions of endogenous LRP16 with PKR were determined with a co-immunoprecipitated (co-IP) analysis in SW480 cells treated with the indicated periods of etoposide. (D) SW480 cells transfected with the indicated FLAG-tagged PKR deletion mutants and treated with etoposide for 30 min were subjected to immunoprecipitation with an anti-FLAG antibody. The lysates and immunoprecipitates were analyzed. (E) Cells transfected with the indicated constructs were subjected to immunoprecipitation with an anti-FLAG antibody. The lysates and immunoprecipitates were then blotted. (F) Bacterially expressed glutathione S-transferase (GST)–LRP16 fusion protein was purified on glutathione agarose beads; 10% of the beads were analyzed with SDS-PAGE and Coomassie Brilliant Blue staining. The remaining beads containing the GST–LRP16 fusion protein were used to pull down in vitro-translated FLAG–PKR. The interactions were detected with SDS-PAGE and immunoblotting. (G) In vitro-translated FLAG–PKR deletion mutants were incubated with GST or GST–LRP16–GSH–Sepharose. Proteins retained on the Sepharose were blotted with the indicated antibodies. (H) In vitro-translated PKR and IKKβ were incubated with GST or GST–LRP16–GSH–Sepharose. Proteins retained on the Sepharose were blotted with the indicated antibodies. (I) SW620 cells transfected with the indicated siRNAs were treated with etoposide before collection. PKR was immunoprecipitated with an anti-PKR antibody and immunoblotted with the indicated antibodies. (J–K) Cytosolic and nuclear fractions derived from SW620 cells (J), and cytosolic and nuclear fractions derived from SW480 cells expressing exogenous FLAG–LRP16 (K), were treated with etoposide (50 μM) for the indicated periods, and immunoprecipitated and immunoblotted with the indicated antibody. (L) Cytosolic and nuclear fractions derived from SW480 cells transfected with vector expressing FLAG–LRP16 or the control vector were treated with etoposide (50 μM) for the indicated periods, and immunoprecipitated and immunoblotted with the indicated antibody. One representative experiment of three was shown.
Figure 4—figure supplement 1
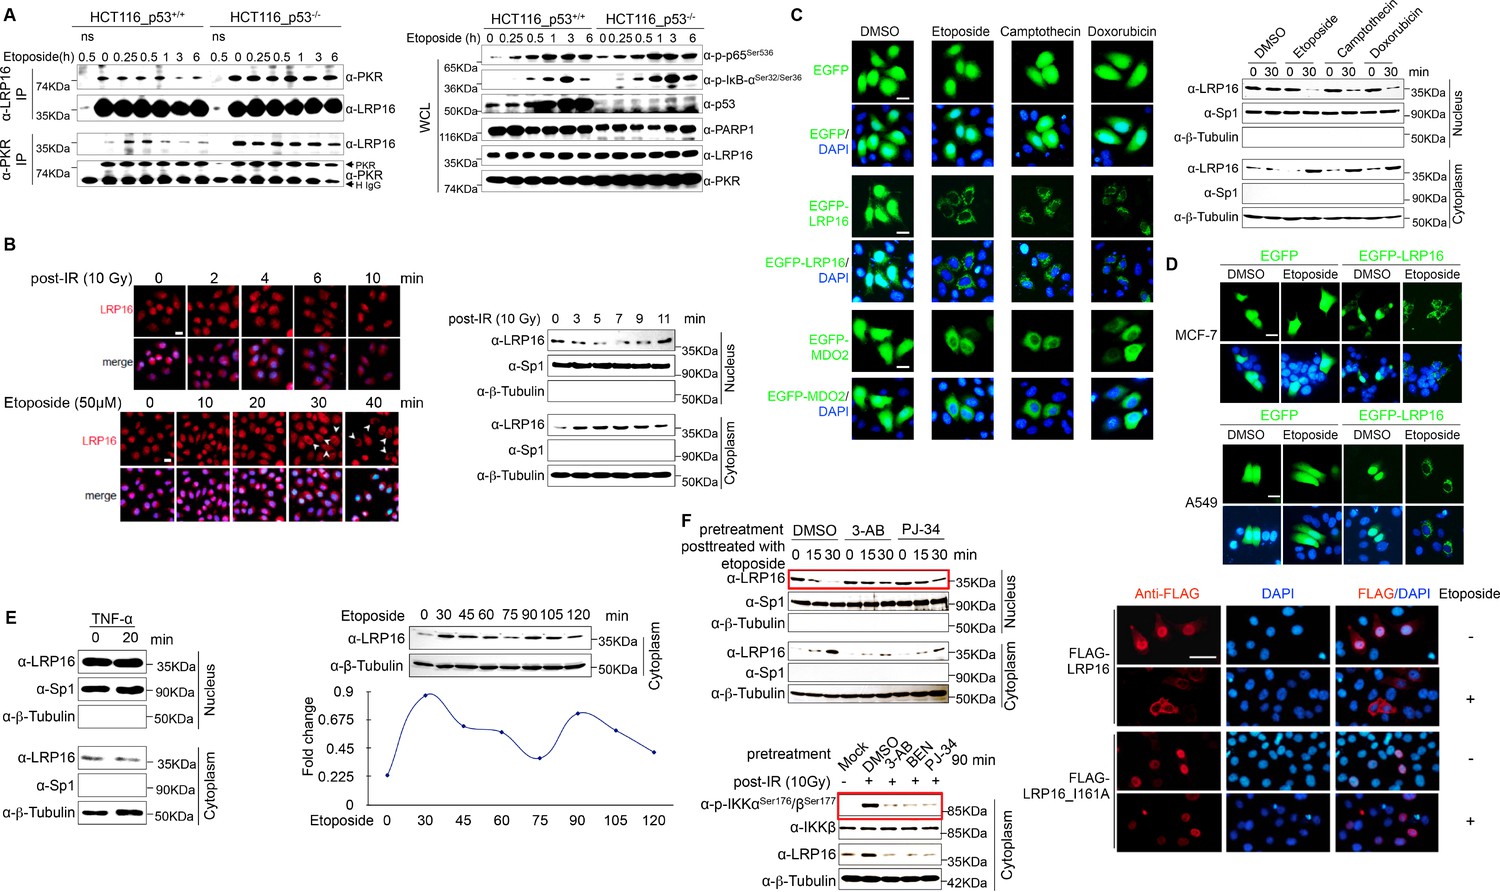
LRP16 physically interacts with PKR in a TP53 independent manner, and nucleocytoplasmic shuttling of LRP16 in response to DNA damage, not TNFα signaling depends on PAR.
(A) Interaction of endogenous LRP16 with PKR determined with a co-IP analysis using the indicated antibodies in HCT116+/+ or HCT116−/− cells treated with etoposide (50 μM) for the indicated periods. The lysates and immunoprecipates were analyzed. (B) 293 T cells treated with either etoposide or IR for the indicated periods were immunofluorescently stained for LRP16. LRP16 is labeled in red. Nuclei were counterstained with DAPI, and the cytosolic and nuclear fractions derived from these cells treated with IR for the indicated periods were analyzed by Western blotting using the indicated antibody. Cytosolic and nuclear markers β-Tubulin and Sp1 were used as loading controls, respectively. (C) SW480 cells transfected with the enhanced green fluorescent protein (EGFP)-encoding control vector, EGFP–LRP16-encoding plasmid, or EGFP–MDO2-encoding plasmid (another macrodomain containing protein) were treated with etoposide, camptothecin, or doxorubicin for 30 min and then subjected to a confocal microscopic analysis, and the cytosolic and nuclear fractions derived from these cells treated with IR for the indicated periods were analyzed by Western blotting using the indicated antibody. Cytosolic and nuclear markers β-Tubulin and Sp1 were used as loading controls, respectively. (D) Both MCF-7 (breast cancer cell line) and A549 (lung cancer cell line) transfected with EGFP control vector or EGFP–LRP16-encoding plasmid were treated with etoposide for 30 min and then subjected to a confocal microscopic analysis. (E) Cytosolic and nuclear fractions derived from SW620 cells treated with TNFα for the indicated periods, or cytosolic fraction derived from SW620 cells treated with etoposide for the indicated periods were analyzed with Western blotting using the indicated antibody. (F) Cytosolic and nuclear fractions derived from cells pretreated with PARP inhibitors (e.g. PJ-34 and 3-AB) for 2 hr and then treated with either etoposide or IR for the indicated periods were analyzed with Western blotting using the indicated antibody. Cells transfected with plasmid encoding LRP16 WT or an LRP16 mutant (I161A), and then treated with or without etoposide, were subjected to a confocal microscopic analysis. One representative experiment of three was shown.
Figure 5 with 1 supplement
LRP16 PAR-dependently activates PKR and confers NF-κB activation induced by DNA damage.
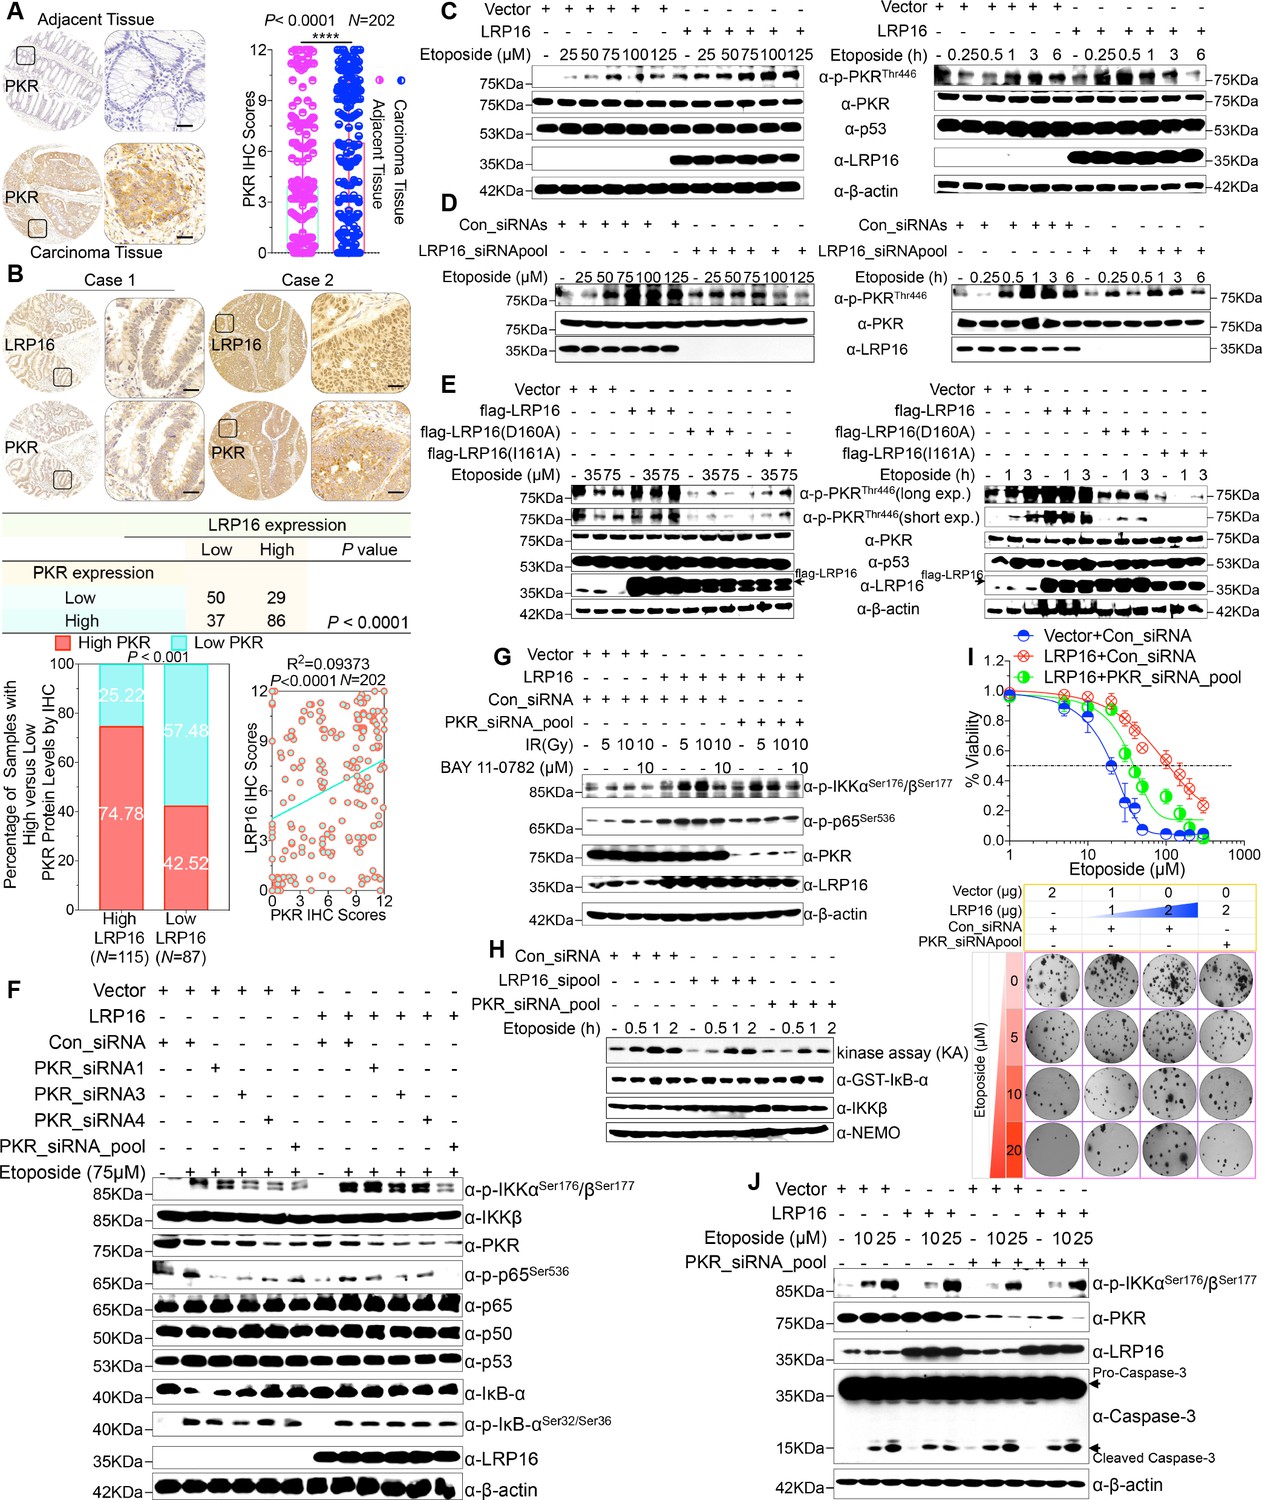
(A) Representative images of the IHC staining of PKR expression in CRC tissues and matched adajcent tissues from a tissue array containing 202 CRC samples paired with adjacent normal colon tissues. The outlined areas in the left images are magnified on the right. Scale bars, 50 μm. PKR expression scores are shown as scatter dot plots. We compared the CRC tissues with the matched adjacent normal colon tissues using a Wilcoxon matched pairs test. N = 202. Error bars represented the mean ± SD. *p<0.05, **p<0.01, ***p<0.001, ****p<0.0001. (B) Representative images of IHC staining for LRP16 and PKR in two serial sections from the same tissue samples. Scale bars, 50 μm. Positive correlation between LRP16 and PKR protein levels. The 202 samples were classified into two groups (low LRP16, N = 87; high LRP16, N = 115) based on the LRP16 level relative to the score for the whole cohort. p<0.001, calculated by both χ2 and Mann–Whitney tests. Pearson’s correlation between LRP16 and PKR expression levels (N = 202; p<0.0001; R2 = 0.09373). (C) Whole cell lysates from SW480 cells transfected with an LRP16-expressing plasmid or control vector were treated with the indicated concentrations of etoposide for 2 hr or with 50 μM etoposide for the indicated periods, and immunoblotted with the indicated antibody. β-Actin was used as the loading control. (D) Lysates from cells transfected with LRP16 siRNAs or control siRNAs and treated with the indicated concentrations of etoposide for 2 hr or with 50 μM etoposide for the indicated periods were immunoblotted with the indicated antibody. β-Actin was used as the loading control. (E) Cells were transfected with control vector or vector expressing LRP16 or the LRP16 mutants (LRP16_D160A or LRP16_I161A) and treated with the indicated concentrations of etoposide for 2 hr (left) or etoposide (50 μM) for the indicated periods (right). The cell lysates were immunoblotted with the indicated antibody. (F) SW480 cells either overexpressing LRP16 or transfected with the control vector were cotransfected with the indicated PKR siRNAs and treated with etoposide for 2 hr. Their lysates were immunoblotted with the indicated antibody. β-Actin was used as the loading control. (G) Cells were co-transfected with the indicated plasmids and/or siRNAs and were treated with IR at the indicated doses, with or without subsequent BAY 11–7082 treatment. Their lysates were immunoblotted with the indicated antibody. (H) In vitro kinase assay. SW620 cells were mocked transfected or transfected with the indicated siRNAs, treated with etoposide for the indicated periods, and then analyzed with an IKK kinase assay using GST–IκBα as the substrate. (I) Cells were cotransfected with the indicated plasmids and/or siRNAs, treated with etoposide, and subjected to cell viability analysis and clonogenic cell survival assays. (J) Cells were co-transfected with the indicated plasmids and/or siRNAs and treated with etoposide at the indicated concentrations. Their lysates were separated with SDS-PAGE and analyzed with Western blotting using the indicated antibody. β-Actin was used as the loading control. One representative experiment of three was shown.
Figure 5—figure supplement 1

PKR is elevated in CRC samples and is activated in response to DNA damage, and intact PKR, but not its kinase activity is required for the DNA damage-induced NF-κB activity.
(A) PKR protein expression is higher in CRC tissues compared with adjacent normal tissues, as determined by Western blot and RT-qPCR. Representative images stained by IHC for PKR are shown, based on the histological grades of CRC patients. Whole cell lysates from 11 different CRC cell lines were immunoblotted using the indicated antibody. β-Actin was used as the loading control. (B) Eleven CRC cell lines were treated with either etoposide (50 μM) or 5-fluorouracil (100 μM) for 2 hr. Their lysates were separated with SDS-PAGE and analyzed with Western blotting using the indicated antibody. (C) Both LoVo cells and RKO cells were treated with etoposide at indicated concentrations for the indicated periods. Their lysates were analyzed with Western blotting using the indicated antibody. (D) Inhibition efficiency of PKR siRNAs was examined with immunoblotting. SW620 cells transfected with the indicated PKR siRNAs or control siRNAs were then treated with or without etoposide before collection. LRP16 was immunoprecipitated with anti-LRP16 antibody and immunoblotted with the indicated antibodies. (E–F) SW480 cells were co-transfected with control vector and an LRP16-expressing plasmid and the indicated siRNAs, and treated with the indicated concentrations etoposide for 14 days, before they were subjected to a clonogenic cell survival assay, and cell apoptosis analysis. (G–H) SW480 cells overexpressing LRP16 or transfected with the control vector were pretreated with increasing amounts of 2-aminopurine (2-AP) (G) and/or BAY 11–7082 (H) for 2 hr, and then treated with etoposide for 2 hr. Their lysates were immunoblotted with the indicated antibody. β-Actin was used as the loading control. One representative experiment of three was shown.
Figure 6 with 1 supplement
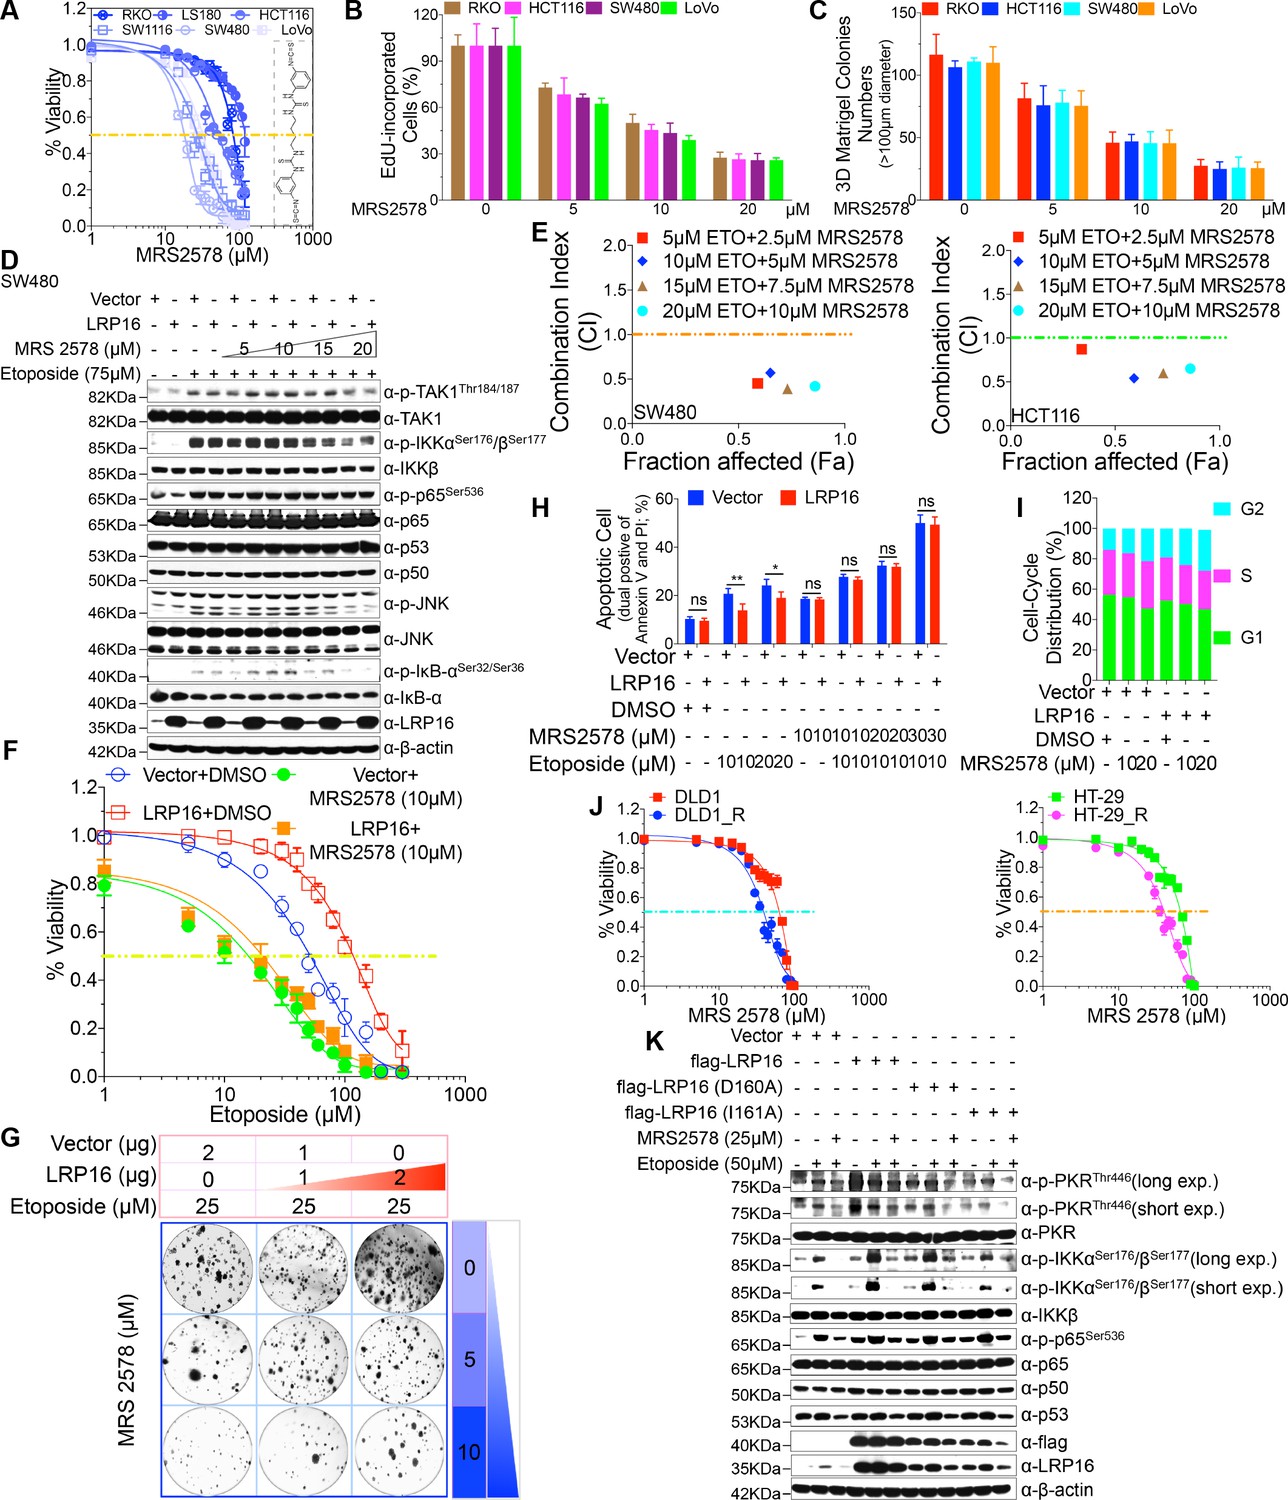
MRS2578 impairs LRP16-mediated NF-κB activity induced by DNA damage, inhibits cells proliferation, and enhances the cytotoxic effects of etoposide.
(A) MRS2578 inhibits CRC cell viability. Cell viability was measured with the CCK-8 assay in RKO, LS180, HCT116, SW1116, SW480, and LoVo cell lines treated with the indicated concentrations of MRS2578 for 72 hr. (B) MRS2578 inhibited the proliferation of CRC cell lines, measured with EdU labeling, when the cells were treated with the indicated concentrations of MRS2578. (C) Colony formation assays: MRS 2578 suppressed colony formation in several CRC cell lines. Cells were cultured with the indicated concentrations of MRS2578 for 10 days. (D) SW480 cells transfected with the LRP16-overexpressing vector or control vector were pretreated with increasing amounts of MRS2578 for 90 min, and then with etoposide for 2 hr. Their lysates were immunoblotted with the indicated antibody. β-Actin was used as the loading control. (E) SW480 cells and HCT116 cells were treated with dual etoposide (5–20 μM) and MRS2578 (2.5–10 μM). The cells were treated daily for 3 days with the indicated drug combinations, and then assayed with CCK-8 to determine the cytotoxicity of the treatments. X axis, fraction of cells affected (Fa); y axis, combination index (CI). Combinations with CI <1 are synergistic. (F–H) Cells transfected with the control vector or a plasmid expressing LRP16 were treated with etoposide alone or in the presence of MRS2578, and subjected to cell viability analysis (F), a clonogenic cell survival assay (G), and cell apoptosis analysis (H), Error bars in (H) represented the mean ± SD for triplicate experiments. *p<0.05, **p<0.01, ns, not significant. (I) Cell-cycle analysis: Flow-Cytometric analysis of the cell-cycle profiles of SW480 cells overexpressing LRP16 or transfected with the control vector in the presence of MRS2578. (J) Cell viability assay: two CRC cell lines (DLD1 and HT-29) were exposed over time to IR until resistance emerged, generating the two cell lines DLD1_R (parental DLD1) and HT-29_R (parental HT-29). Cell viability was measured with the CCK-8 assay in the presence of MRS2578. (K) SW480 cells transfected with the control vector or with LRP16-expressing vector or the LRP16 mutants (LRP16_D160A or LRP16_I161A) were treated with etoposide alone or in the presence of MRS2578. Their lysates were immunoblotted with the indicated antibody. One representative experiment of three was shown.
Figure 6—figure supplement 1
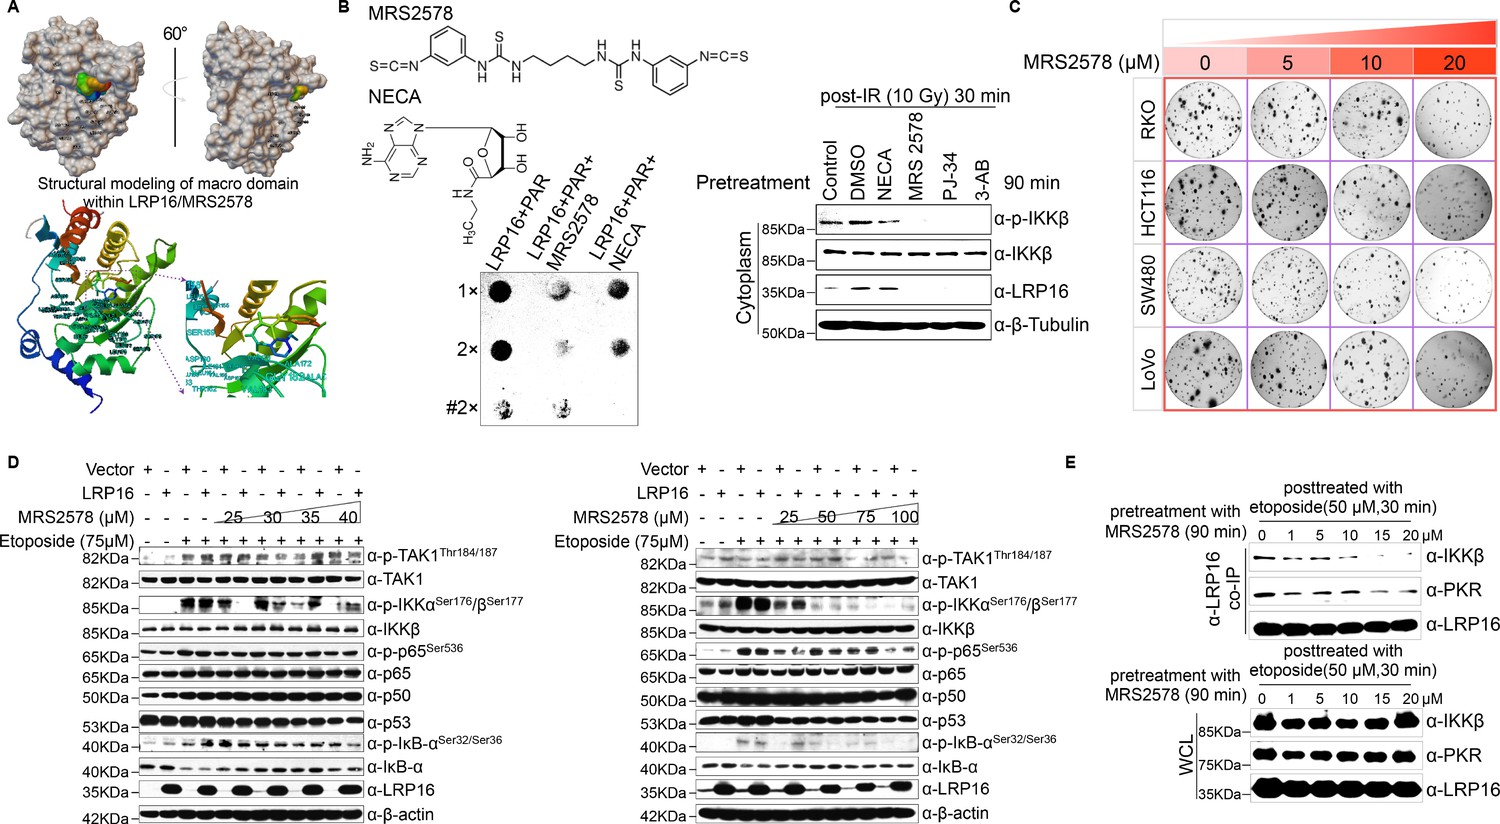
A small molecule MRS2578 inhibits the NF-κB activity induced by LRP16, and disrupts the interactions of the LRP16, PKR, and IKKβ complex in response to DNA damage.
(A) Structural modeling of a small molecule MRS2578 in the macrodomain binding pocket of LRP16. (B) PAR-binding assays were performed with the indicated small molecules, purified LRP16, and synthesized PAR. ‘#’ represents the heat treatment. Cytosolic fractions derived from SW620 cells pretreated with the indicated drugs (e.g. two small molecules, NECA, MRS2578, PARP inhibitors, PJ-34, 3-AB) for 90 min, followed by IR (10 Gy) for 30 min. Their lysates were separated with SDS-PAGE and analyzed with Western blotting using the indicated antibody. (C) MRS2578 suppressed colony formation in several CRC cell lines (RKO, HCT116, SW480 and LoVo). Cells were cultured with the indicated concentrations of MRS2578 ranging from 0 μM to 20 μM for 10 days. (D) SW480 cells transfected with the control vector or LRP16-overexpressing vector were then pretreated with increasing amounts of MRS2578 for 90 min, and then treated with etoposide for 2 hr. Their lysates were immunoblotted with the indicated antibody. β-Actin was used as the loading control. (E) SW480 cells pretreated with the indicated concentrations of MRS2578 for 90 min, followed by etoposide (50 μM) for 30 min. LRP16 was immunoprecipitated from the cell lysates with anti-LRP16 antibody and immunoblotted with the indicated antibodies. One representative experiment of three was shown.
Figure 7 with 3 supplements

LRP16 deficiency sensitizes CRC to DNA-damaging cytotoxic therapies and combination of MRS2578 and etoposide synergistically represses CRC in xenograft models.
(A) nu/nu nude mice were transplanted with 1 × 10⁶ SW620 cells infected with a lentivirus carrying either control shRNA or LRP16 shRNA. When the tumors were established, mice with tumor sizes > 150 mm3 (n = 5 per group) were treated with the control or etoposide (20 mg/kg intraperitoneal injection) for the indicated numbers of days. The sizes of the tumors were measured every 3 days with a Vernier caliper. (B) Representative immunohistochemical (IHC) staining for TUNEL and Ki67 in tumor tissues under the indicated conditions. The bar denotes 50 μm. Error bars in (A) and (B) represented the mean ± SD for triplicate experiments. *p<0.05, **p<0.01, ***p<0.001. (Ca–Cc) nu/nu nude mice with CRC cell xenografts were treated with increasing doses of MRS2578 (0, 10, or 20 mg/kg) twice a week for 28 days. Tumor volumes and bodyweights were measured weekly. At the end of the study, the mice were killed, and the tumors were removed and analyzed. All p values were compared with the control group. Error bars indicated the mean ± SD for triplicate experiments. *p<0.05, **p<0.01, ***p<0.001. (D) nu/nu nude mice were transplanted with CRC cells infected with a lentivirus carrying either control shRNA or LRP16 shRNA. When the tumors were established, the mice with tumor sizes > 150 mm3 (n = 6 per group) were treated with the control or etoposide (20 mg/kg intraperitoneal injection) and/or MRS2578 (10 mg/kg intraperitoneal injection) for the indicated number of days. Tumor volumes (Da), representative bright-field images of the tumors (Db), Representative IHC staining for Ki-67 in tumor tissues from mice after treatment with MRS2578 or a combination of etoposide and MRS2578. Scale bar represents 50 μm (Dc), representative tumors were isolated at the end of the assay, and tissue lysates were immunoblotted with the indicated antibodies (Dd). (E) BALB/c mice were implanted with CT26 colorectal adenocarcinoma cells. When the tumors were established, the mice with tumor sizes > 150 mm3 (n = 6 per group) were treated with the control, MRS2578, etoposide, or a combination of etoposide and MRS2578, for the indicated number of days. Error bars in (D) and (E) represented the mean ± SD for triplicate experiments.*p<0.05, **p<0.01, ***p<0.001. (F) Kaplan–Meier survival curves for BALB/c mice implanted CT26 colorectal adenocarcinoma xenografts after treatment with the control, MRS2578, etoposide, or a combination of etoposide and MRS2578. *p<0.05, **p<0.01, ***p<0.001. One representative experiment of three was shown.
Figure 7—figure supplement 1
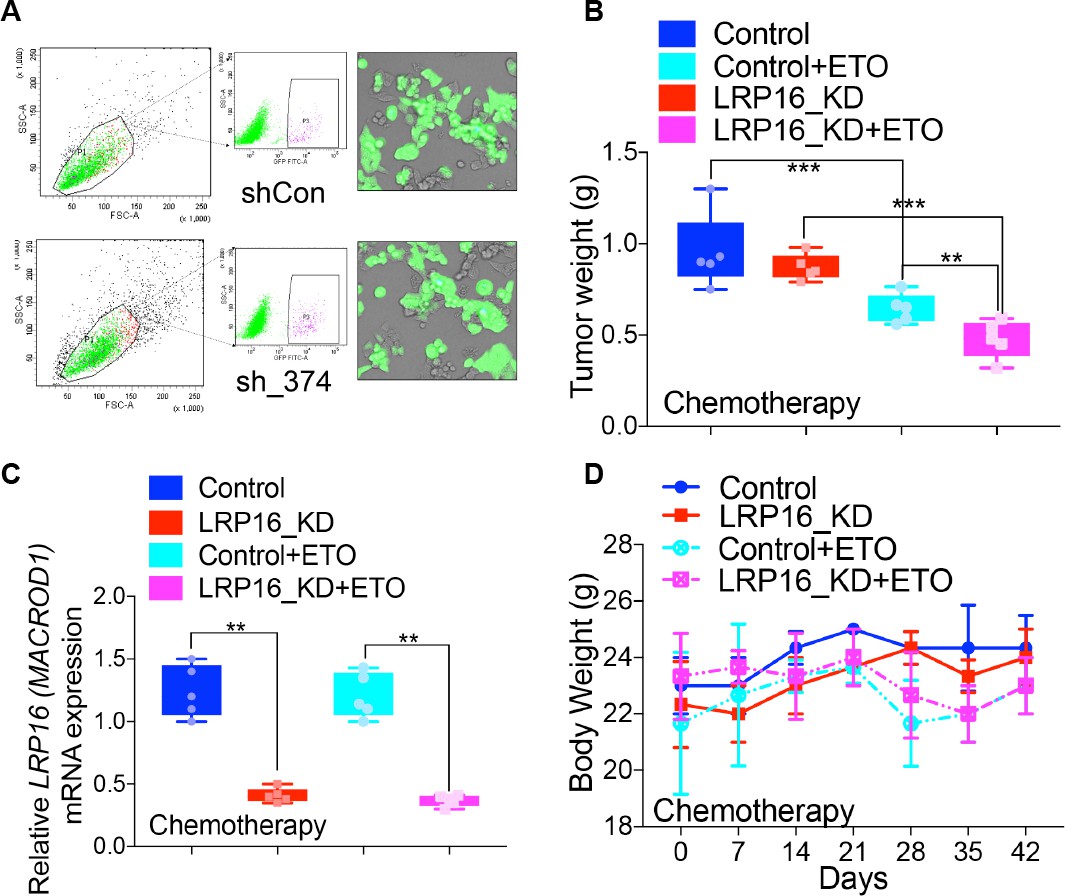
LRP16 deletion sensitizes CRC to etoposdie in xenograft models.
(A) SW620 cells stably infected with lentivirus carrying either control shRNA (shCon) or LRP16 shRNA (sh_374) with GFP were sorted with flow cytometry. Tumors from five mice in each group were collected at the end of the study to measure the tumor weights (B), and then used to isolate RNAs, from which were determined the mRNA levels of LRP16 (C). The bodyweights of the mice during treatment were measured weekly for 42 days (D). Error bars indicate the mean ± SD for triplicate experiments. *p<0.05, **p<0.01.
Figure 7—figure supplement 2
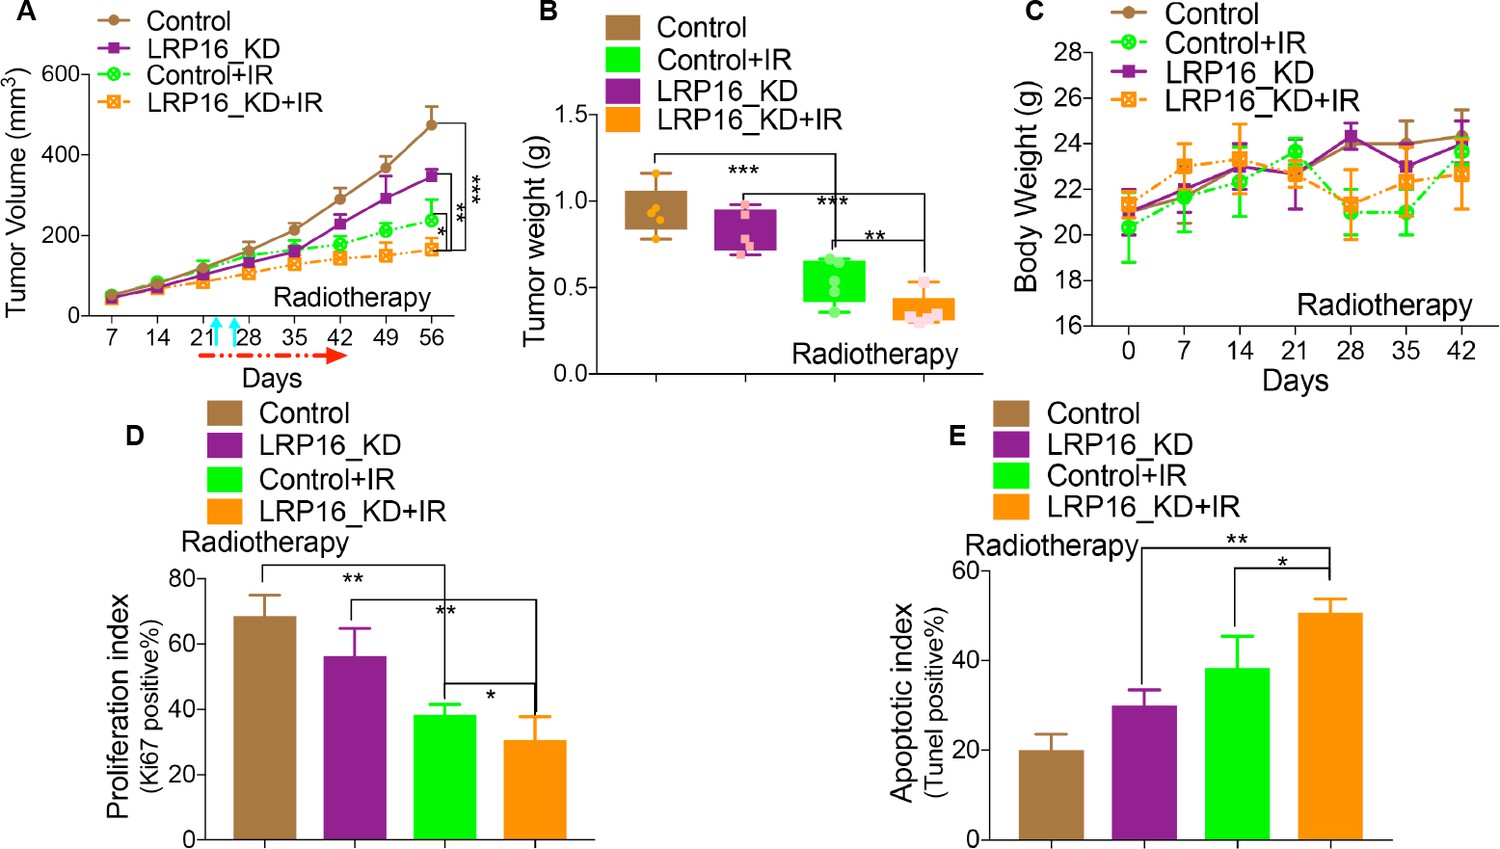
LRP16 deficiency sensitizes CRC to IR in vivo.
(A) Nu/Nu nude mice engrafted with SW620 cells infected with a lentivirus carrying either control shRNA or LRP16 shRNA to form tumor xenografts were treated with IR for the indicated days; arrows indicate the time of irradiation, tumor volume (A), tumor weight (B), bodyweight (C), and Ki-67 (D) and TUNEL (E) in the tumor tissues were analyzed. Error bars represent the mean ± SD for triplicate experiments. *p<0.05, **p<0.01.
Figure 7—figure supplement 3
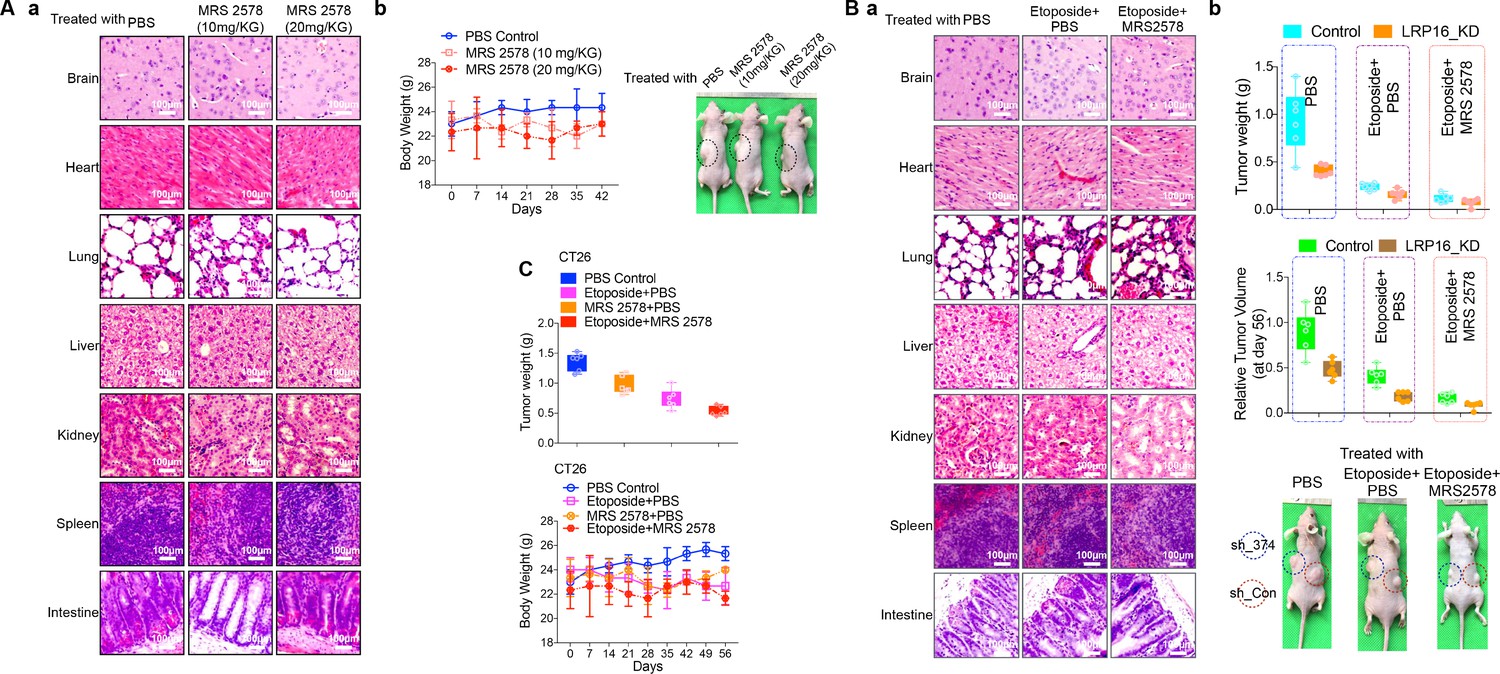
Evaluation of the toxicity and antitumor efficacy of MRS2578 in vivo and combination of MRS2578 and etoposide has no significant toxicity in vivo.
(Aa–Ab) Representative H and E histology of various organs isolated at the end of the study from Nu/Nu nude mice after treatment with MRS2578. Scale bar represents 100 μm. Bodyweights were measured. (Ba–Bb) Representative H and E histology of various organs isolated at the end of the study from Nu/Nu nude mice after treatment with etoposide alone or a combination of MRS2578 and etoposide. Scale bar represents 100 μm. Bodyweights were measured. Error bars represent the mean ± SD for triplicate experiments. (C) BALB/c mice were implanted with CT26 colorectal adenocarcinoma cells. When the tumors were established, the mice with tumor sizes > 150 mm3 (n = 6 per group) were treated with the control, MRS2578, etoposide, or a combination of etoposide and MRS2578, for the indicated number of days. Tumor weight and body weight were analyzed. Error bars represent the mean ± SD for triplicate experiments.
Figure 8
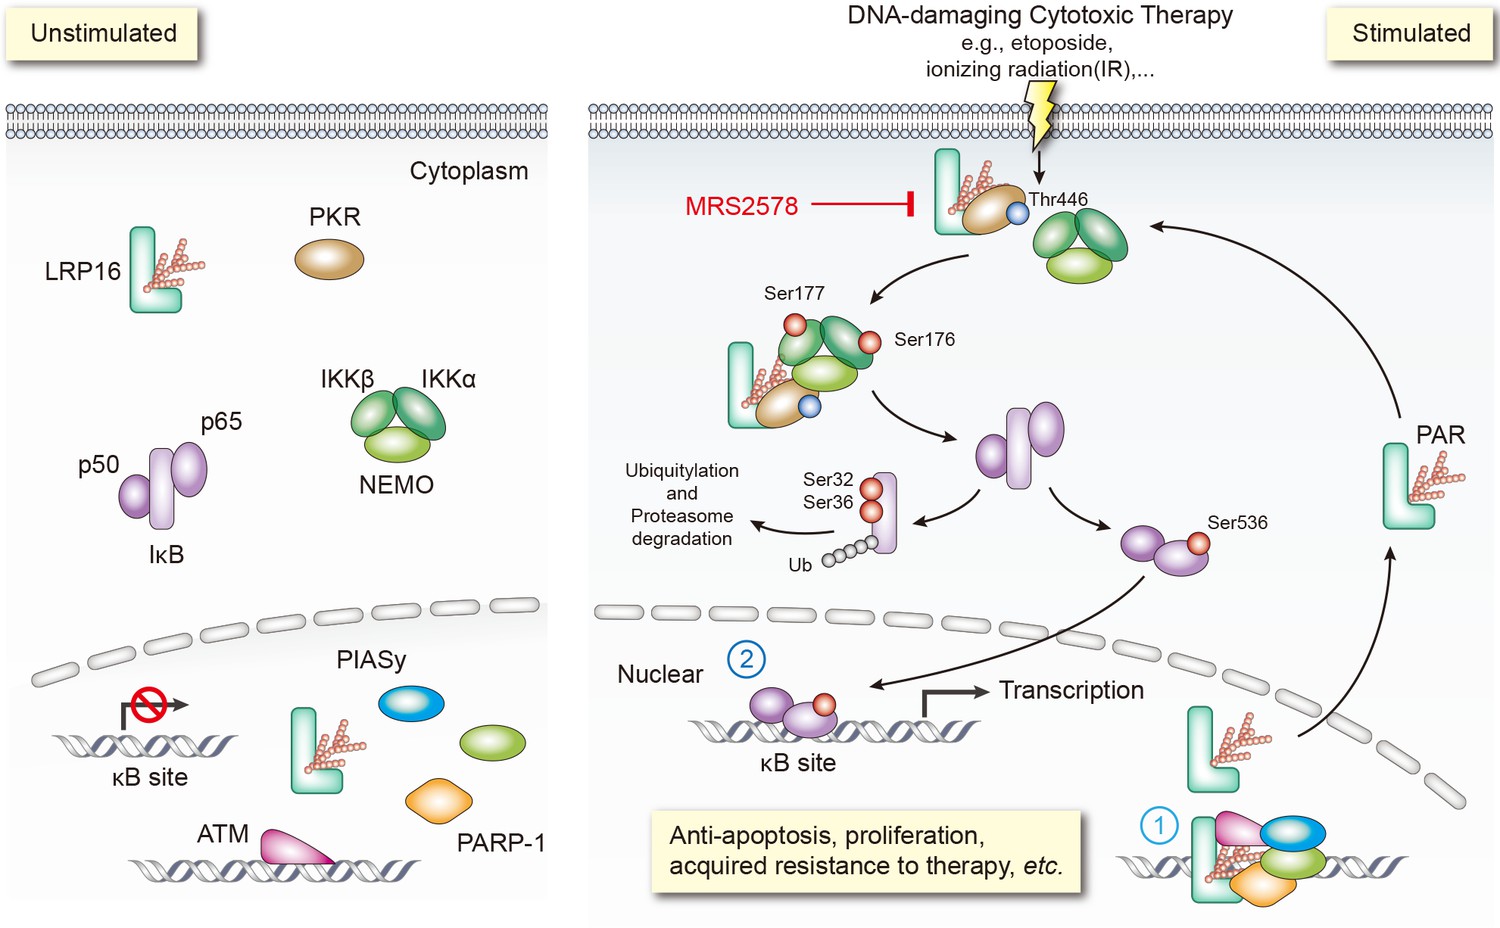
Schematic model of LRP16 function as a signaling molecule in the genotoxicity-initiated NF-κB signaling pathway.
A model summarizing the role of the LRP16/PKR/NF-κB core signaling axis in reducing the sensitivity of colon cancer cells to DNA-damaging therapies, and the synergistic effects of MRS2578 and etoposide in suppressing CRC.
Download links
A two-part list of links to download the article, or parts of the article, in various formats.
Downloads (link to download the article as PDF)
Open citations (links to open the citations from this article in various online reference manager services)
Cite this article (links to download the citations from this article in formats compatible with various reference manager tools)
Blockade of the LRP16-PKR-NF-κB signaling axis sensitizes colorectal carcinoma cells to DNA-damaging cytotoxic therapy
eLife 6:e27301.
https://doi.org/10.7554/eLife.27301


