Structure analyses reveal a regulated oligomerization mechanism of the PlexinD1/GIPC/myosin VI complex
- University of Texas Southwestern Medical Center, United States
- Skirball Institute of Biomolecular Medicine, United States
Figures
Figure 1 with 2 supplements
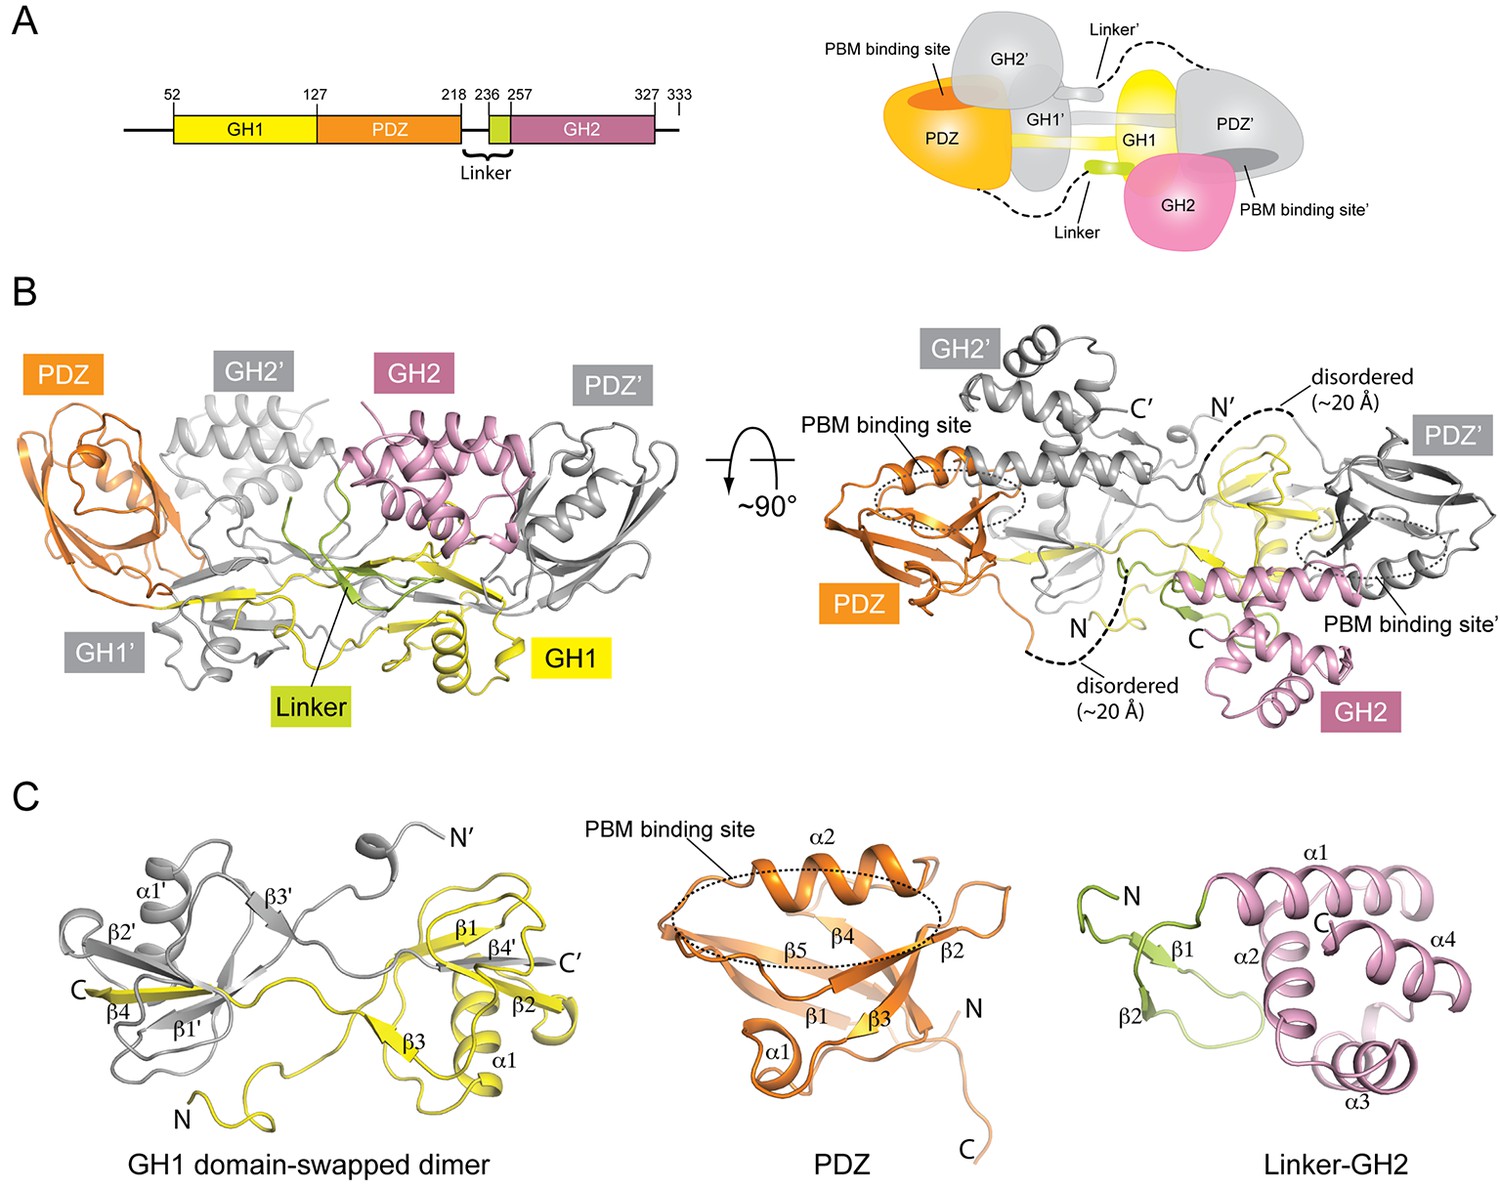
Crystal structure of mouse GIPC1 in the autoinhibited conformation.
(A) Domain structure of mouse GIPC1 and cartoon representation of the overall architecture of the domain-swapped dimer. The color scheme for one subunit in the dimer of the cartoon representation is the same as in the domain structure. The other subunit is colored gray. (B) Two orthogonal views of the GIPC1 structure. The dotted lines indicate the disordered portion of the linker between the PDZ and GH2 domains. The color scheme is the same as in (A). (C) Expanded views of the individual domains.
Figure 1—figure supplement 1
Representative electron density of the apo-GIPC1 structure.
The sigma-A weighted 2Fo-Fc map for helix α1 and loop(α1- α2) in the GIPC1-GH2 domain is shown, contoured at 1.0 sigma.
Figure 1—figure supplement 2
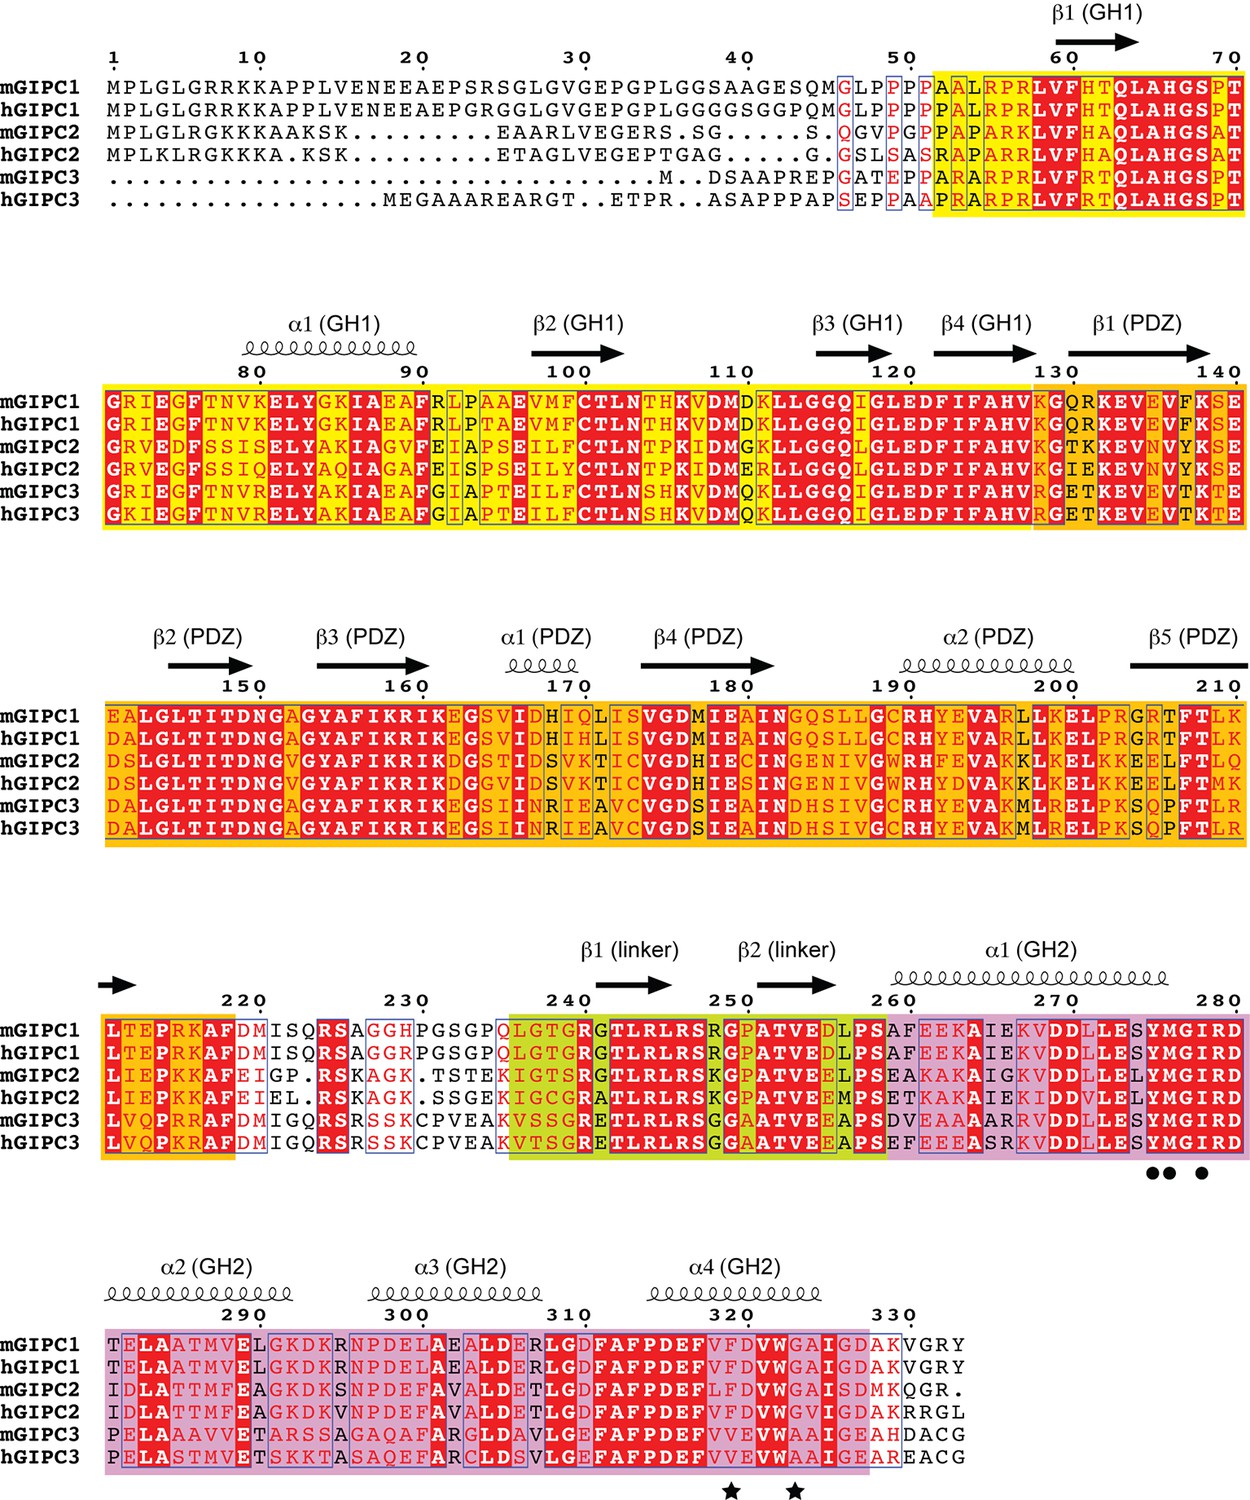
Sequence alignment of GIPC1, 2 and 3.
The secondary structure and domain boundary assignments are based on the apo-GIPC1 structure. Residue numbering is based on mouse GIPC1. The GH1, PDZ, PDZ-GH2 linker and GH2 domains are denoted by background color of yellow, orange, light green and magenta, respectively. The black circles and stars highlight key residues in binding interfaces I and II for myosin VI-HCBD that were tested by mutational analyses. h, human; m, mouse.
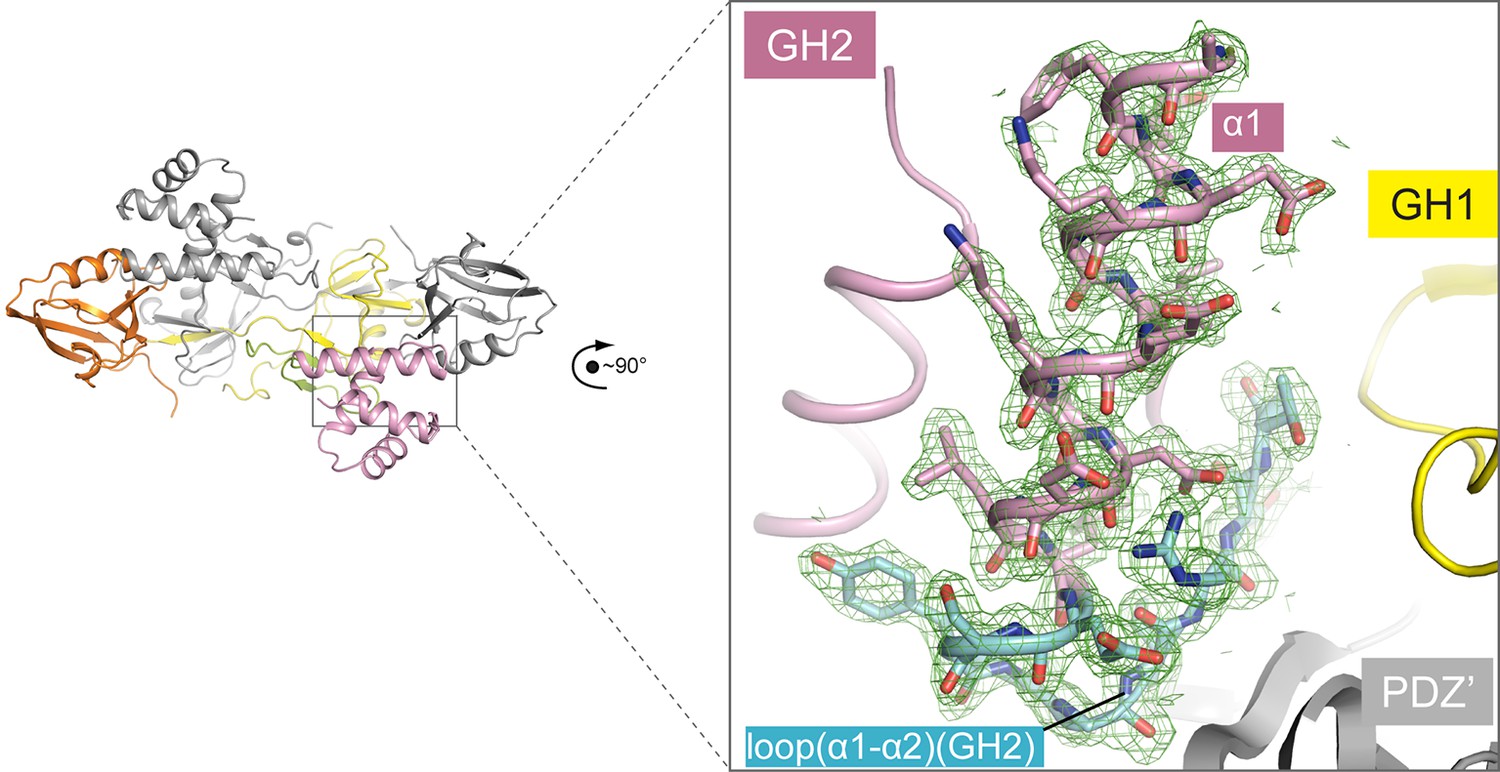
Figure 2
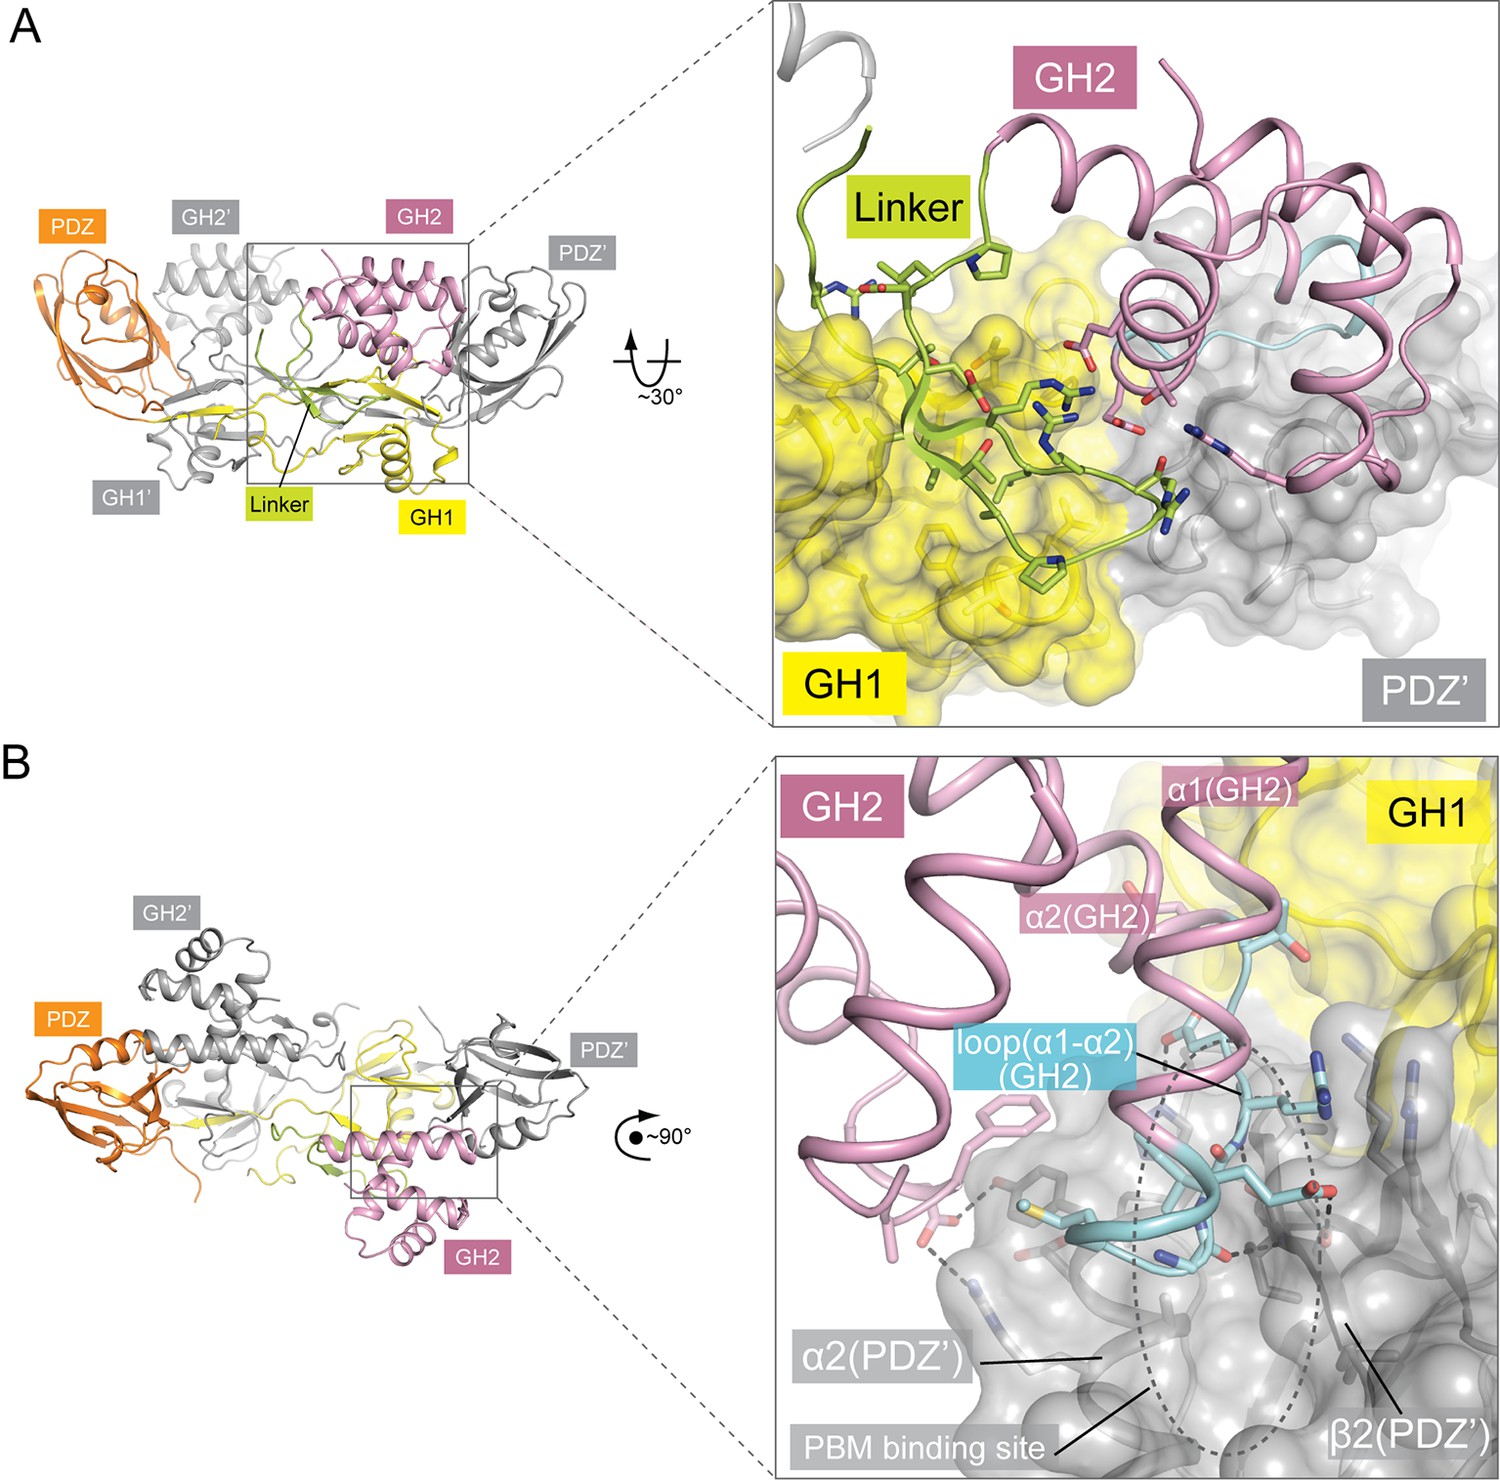
Autoinhibitory interactions mediated by the linker-GH2 domains in the apo-GIPC1 structure.
(A) Interactions of the linker with the GH1 and GH2 domains. (B) Interaction between the GH2 and PDZ domains. The loop between helices α1 and α2 in the GH2 domain that partially blocks the PBM binding site is labeled ‘loop(α1-α2)’ and highlighted in cyan.
Figure 3 with 3 supplements
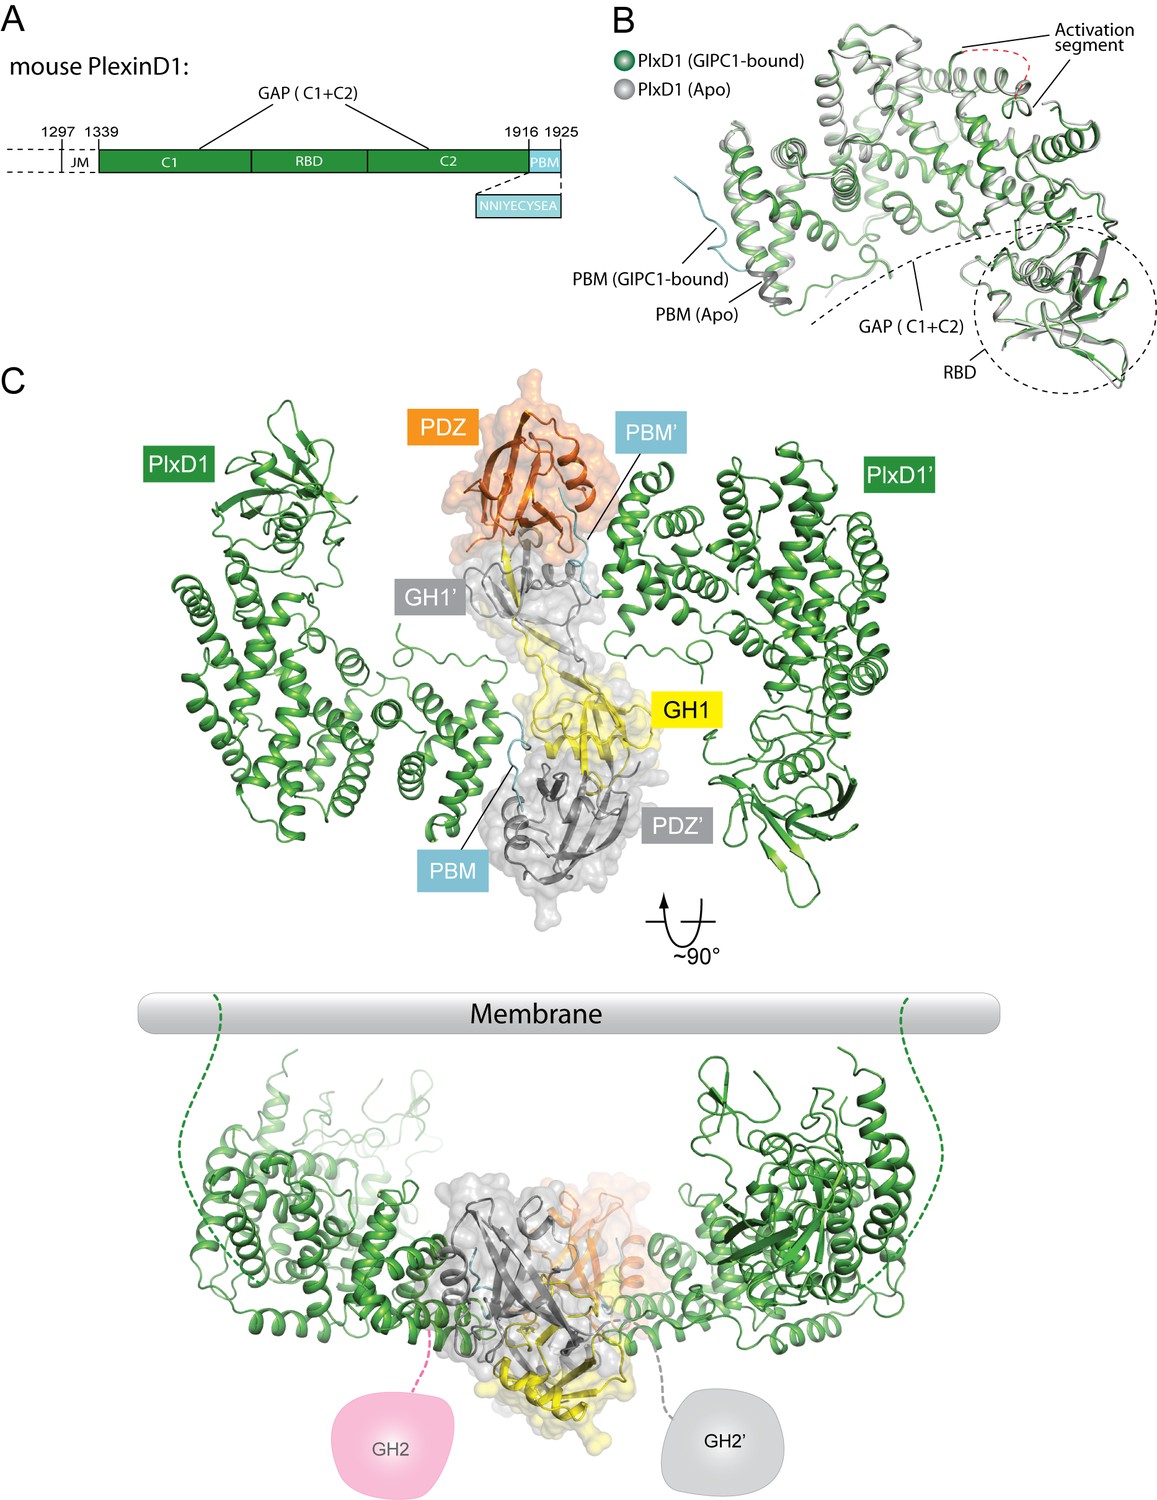
Crystal structure of PlexinD1cyto and the PlexinD1cyto/GIPC1 complex.
(A) Domain structure of mouse PlexinD1. The extracellular and transmembrane regions in PlexinD1 are omitted. The crystallization construct includes the regions denoted by the solid boxes. The single-letter amino acid sequence of the PBM is shown. (B) Comparison of the structures of apo-PlexinD1cyto and PlexinD1cyto from the PlexinD1cyto/GIPC1 complex. (C) Two orthogonal views of the PlexinD1cyto/GIPC1 complex structure. The dotted lines in green indicate the connection to the membrane by the transmembrane and juxtamembrane (JM) regions of PlexinD1. The linker-GH2 domains in GIPC1, invisible in the structures, are drawn as cartoons. Plx, Plexin.
Figure 3—figure supplement 1
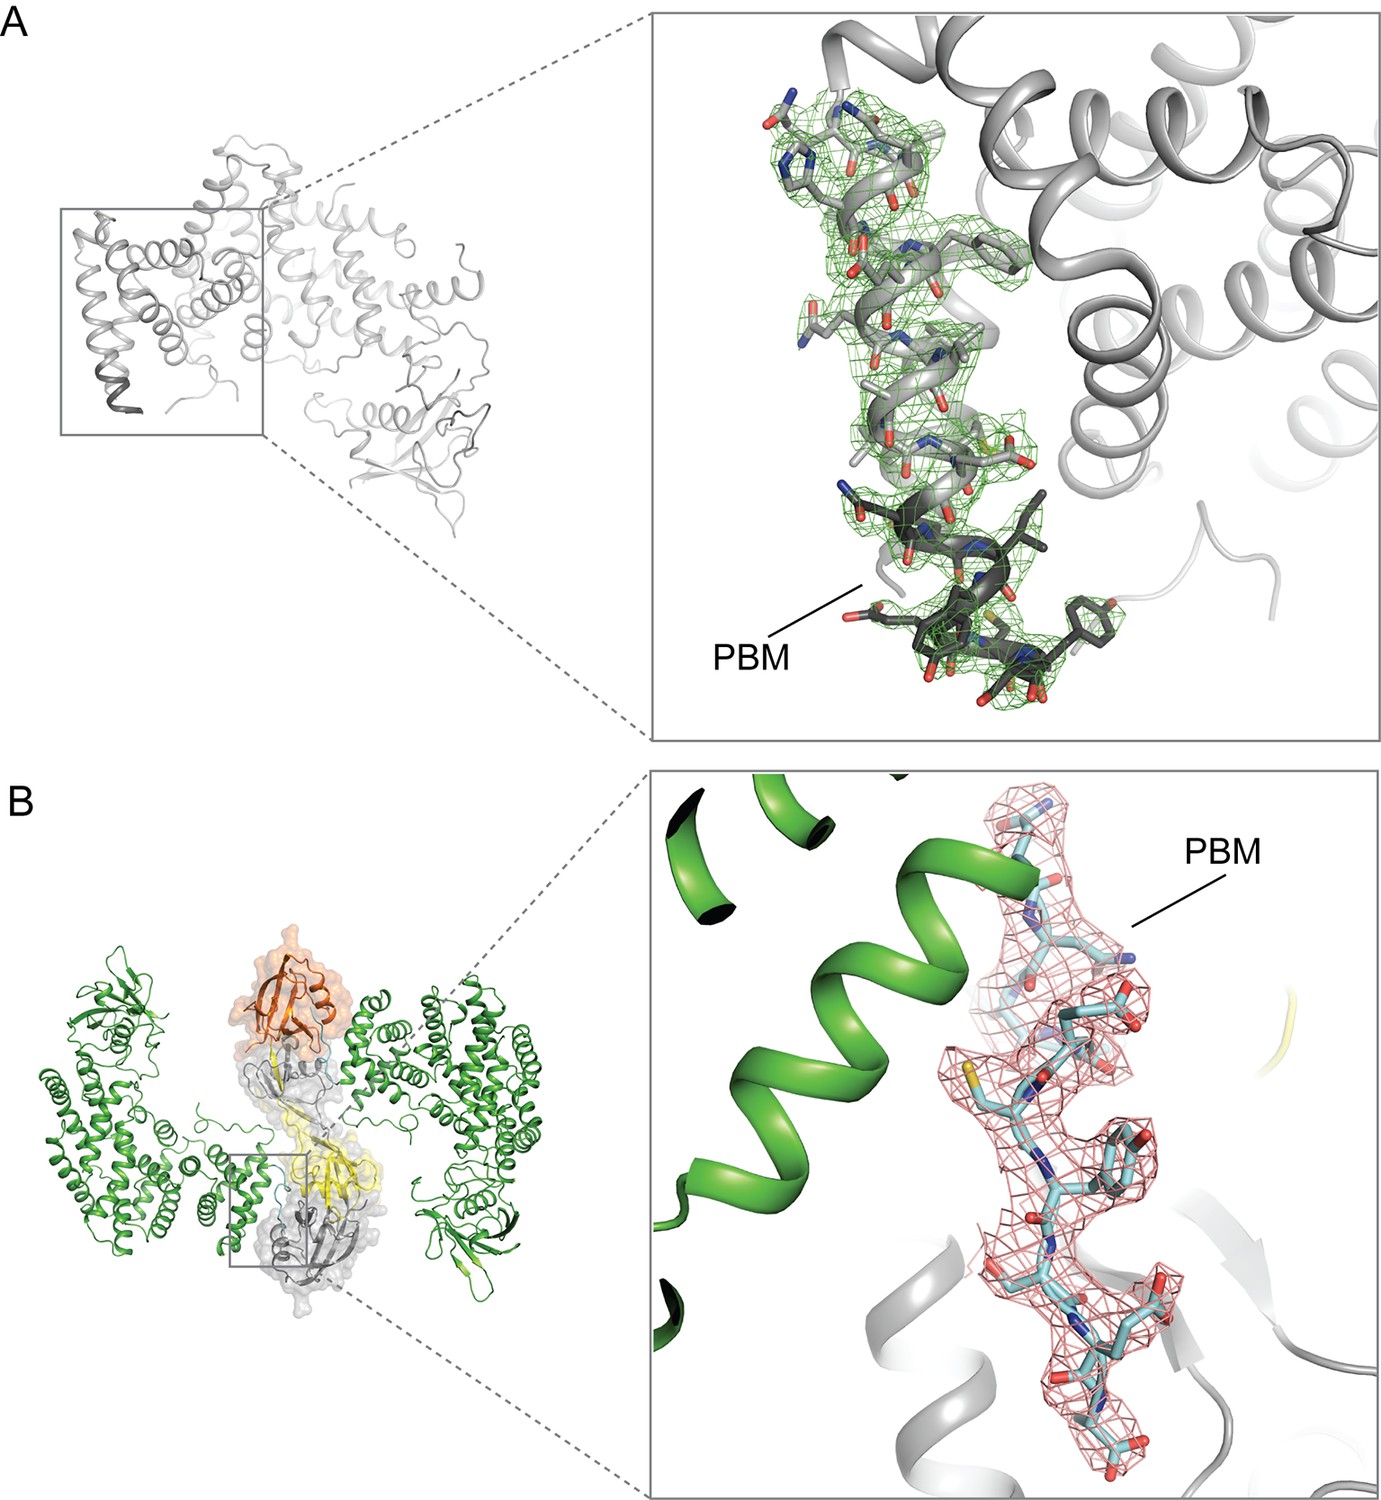
Electron-density maps for the PBM region in the structures of (A) apo-PlexinD1 and (B) PlexinD1 in complex with GIPC1.
The sigma-A weighted 2Fo-Fc maps are contoured at 1.0 sigma.
Figure 3—figure supplement 2
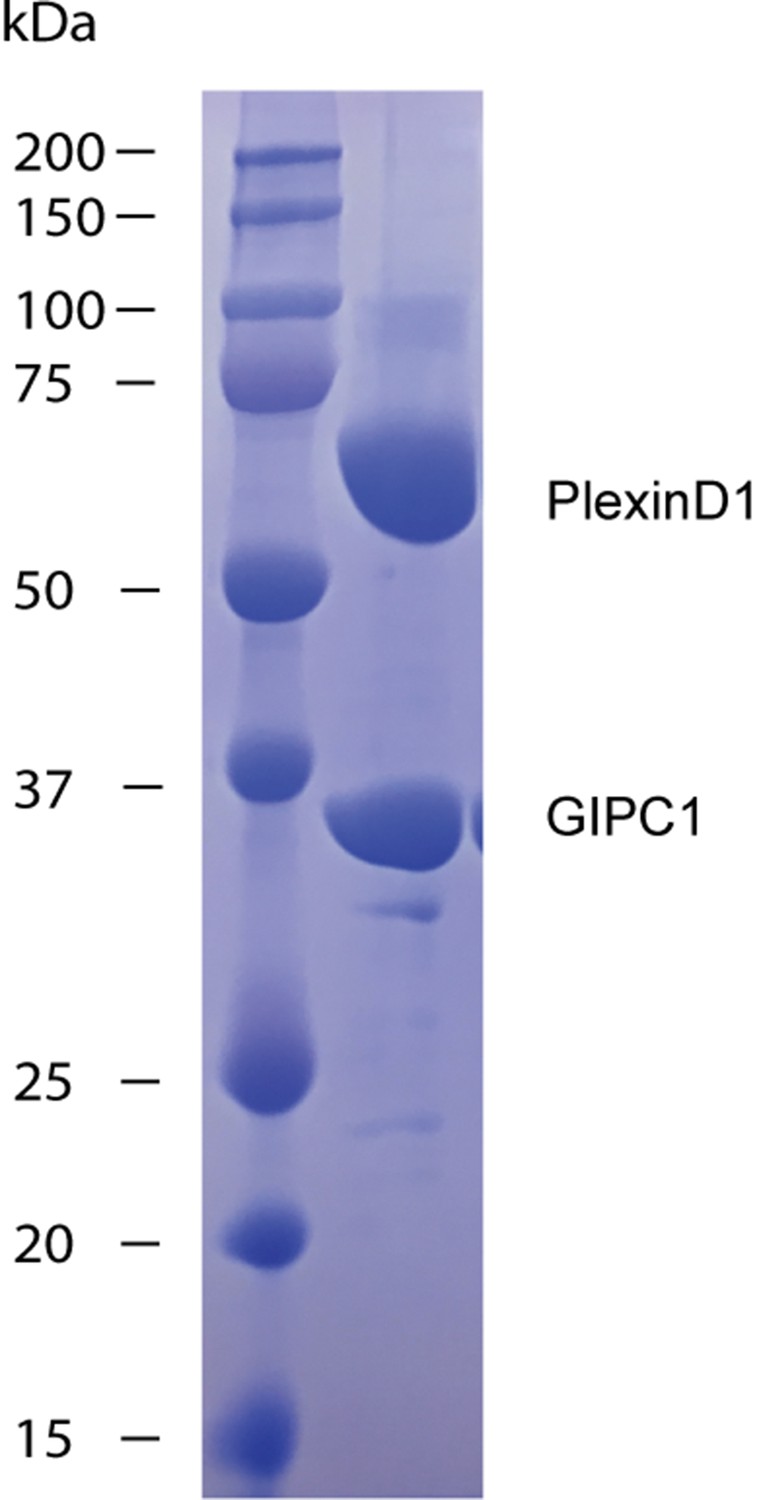
Gel analysis of crystals of the PlexinD1/GIPC1 complex.
Many crystals were collected, washed with the crystallization buffer three times and analyzed by SDS-PAGE. PlexinD1cyto (~66 kDa) and GIPC1 (~36 kDa) ran at their respective expected molecular weight, demonstrating that both proteins were intact in crystals.
Figure 3—figure supplement 3

Comparison of the domain-swapped dimer of the GH1-PDZ domains from apo-GIPC1 and the PlexinD1/GIPC1 complex.
The two structures are superimposed on the PDZ domain on the left. The red arrows indicate the conformational difference at the other end of the dimer. The PDZ-GH2 linker and GH2 domain in the apo-GIPC1 structure are omitted for clarity.
Figure 4
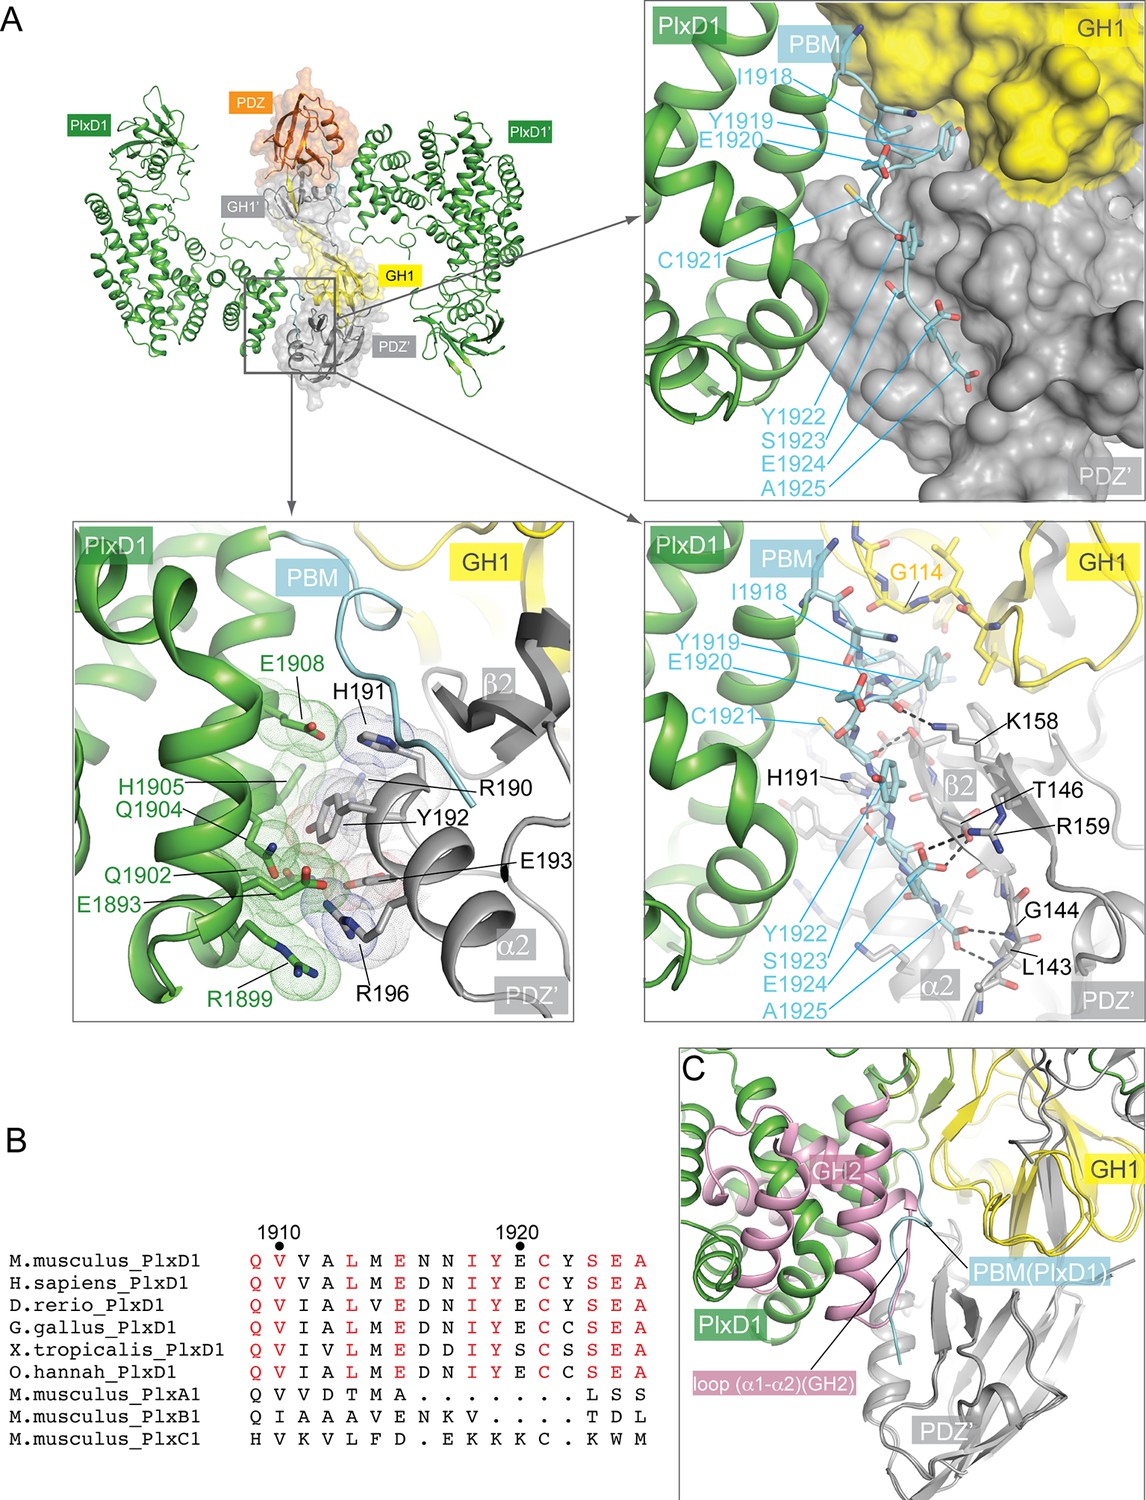
Interactions between PlexinD1 and GIPC1.
(A) Detailed views of the interfaces. The top right panel highlights the packing interactions between the PlexinD1-PBM and GIPC1. The I1918/Y1919 motif in the PMB is accommodated by a hydrophobic pocket between the GH1 and PDZ domains in GIPC1. The lower right panel shows detailed interactions between the PlexinD1-PBM and GIPC1. The lower left panel shows the additional interface between the PlexinD1-GAP domain and the GIPC1-PDZ domain. (B) Sequence alignment of the C-terminal region of PlexinD1 from different species and other plexin family members. Residue numbers are based on mouse PlexinD1. (C) Superimposition of the structures of the PlexinD1cyto/GIPC1 complex and apo-GIPC1 based on the PDZ domain. It is evident that the GIPC1-GH2 domain in the apo-GIPC1 structure clashes with PlexinD1 bound to GIPC1. Plx, Plexin.
Figure 5 with 4 supplements
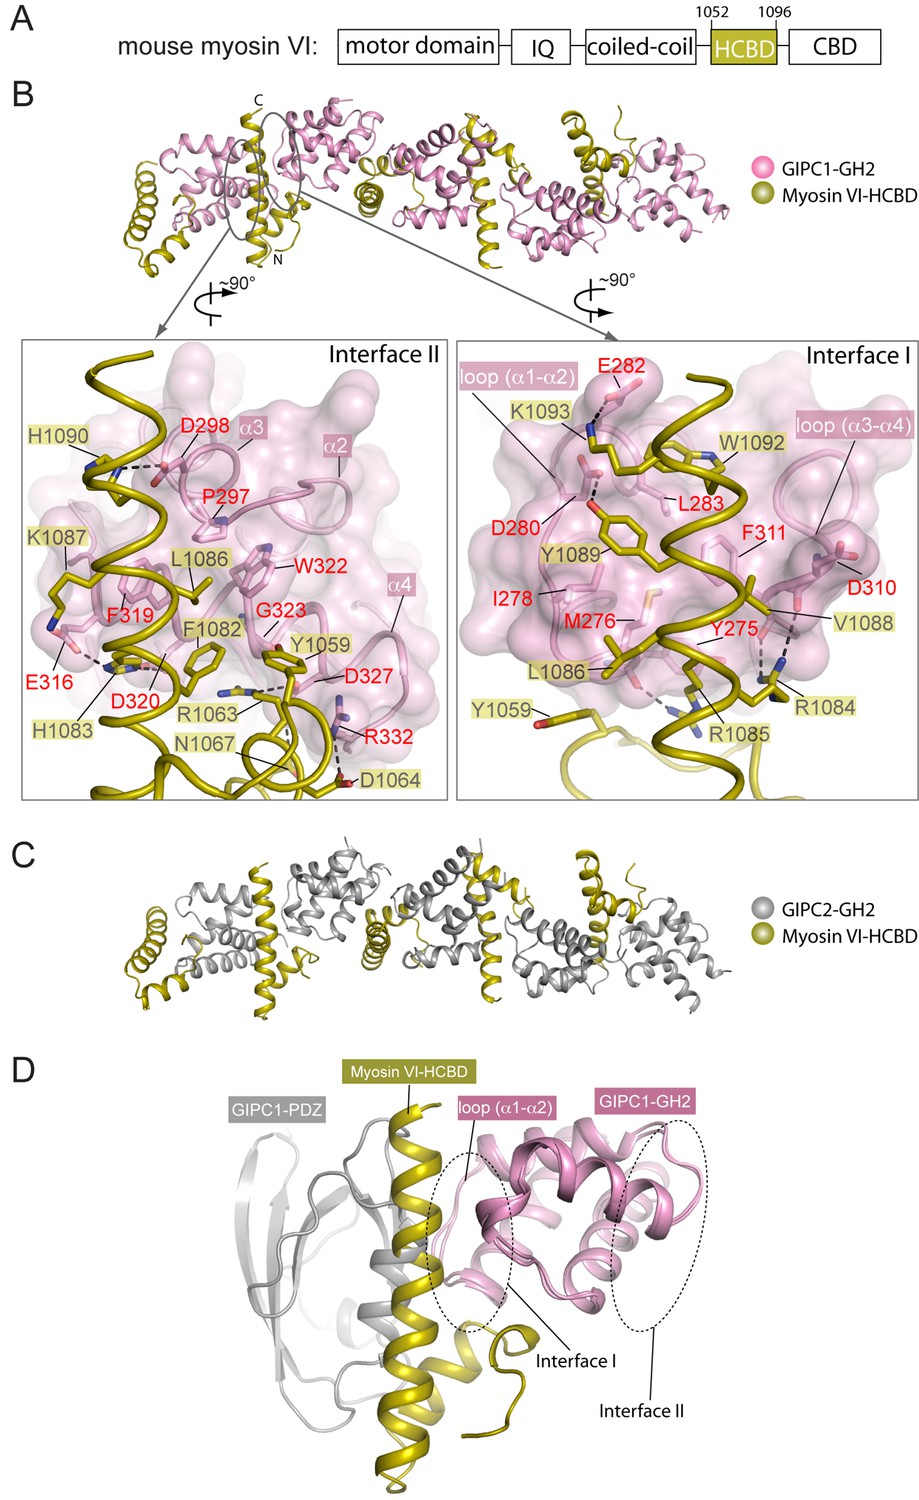
Crystal structures of the GH2 domains from GIPC1 and GIPC2 in complex with the myosin VI-HCBD.
(A) Domain structure of mouse myosin VI. The HCBD is drawn larger than its proportion. (B) Structure of the GIPC1-GH2/myosin VI-HCBD complex. The five GH2/HCBD units in the asymmetric unit are shown. The N- and C-termini of one HCBD are labeled. Interfaces I and II between the GIPC1-GH2 and myosin VI-HCBD domains are displayed in detail in the two expanded views, respectively. (C) Overall structure of the GIPC2-GH2/myosin VI-HCBD complex. The five GH2/HCBD units in the asymmetric unit are shown. (D) Superimposition of one GH2/HCBD unit to the apo-GIPC1 structure. The superimposition is based on the GH2 domain. For clarity, only one GH2 and PDZ from the apo-GIPC1 structure are shown. It is evident that the PDZ domain in the apo-GIPC1 structure clashes with the myosin VI-HCBD bound to interface I of the GH2 domain.
Figure 5—figure supplement 1
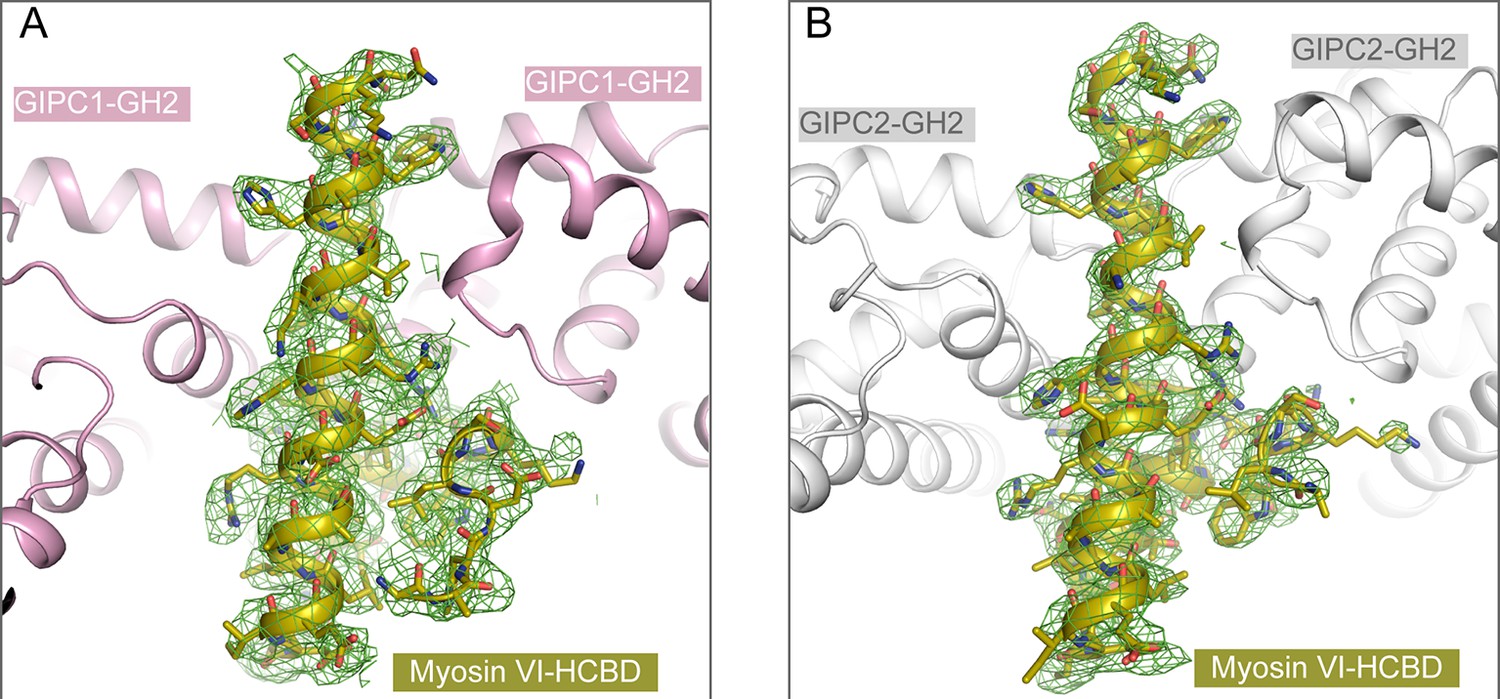
Electron-density maps for the HCBD in the structures of (A) the GIPC1-GH2/myosin VI-HCBD complex and (B) the GIPC2-GH2/myosin VI-HCBD complex.
The sigma-A weighted 2Fo-Fc maps are contoured at 1.0 sigma.
Figure 5—figure supplement 2
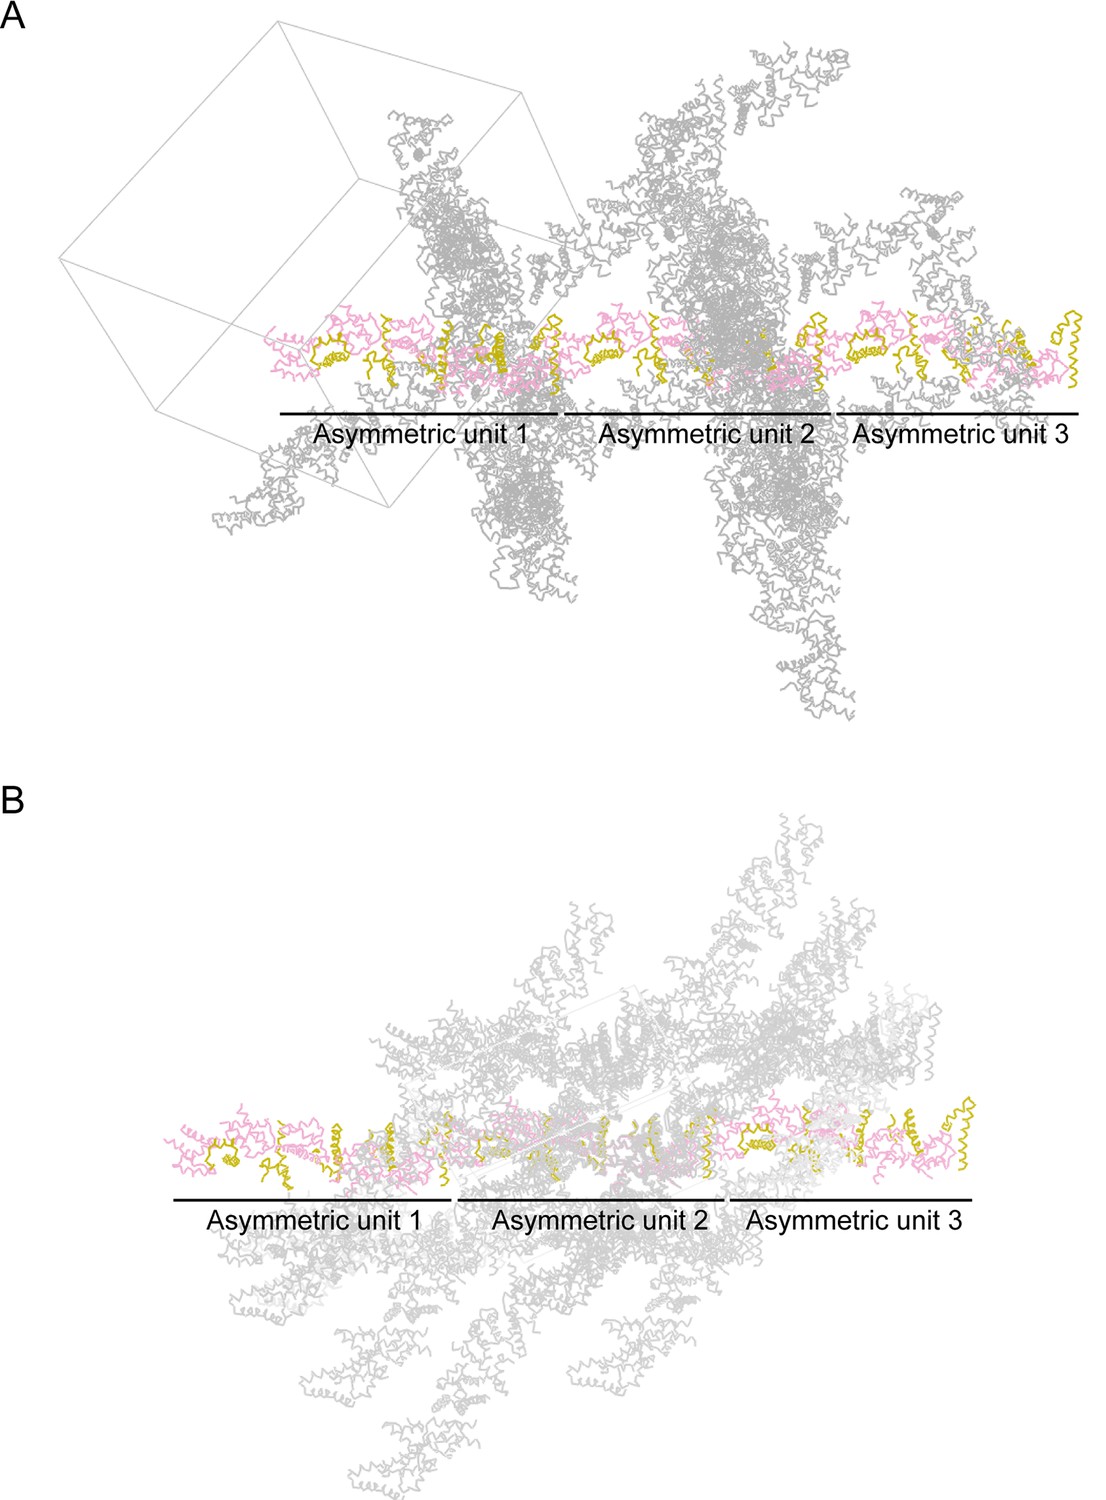
Crystal packing of (A) the GIPC1-GH2/myosin VI-HCBD complex and (B) the GIPC2-GH2/myosin VI-HCBD complex.
In each, one chain of alternating GH2 (pink) and HCBD (olive) are highlighted. Three asymmetric units (each containing 5 GH2/HCBD pairs) are displayed for each structure.
Figure 5—figure supplement 3
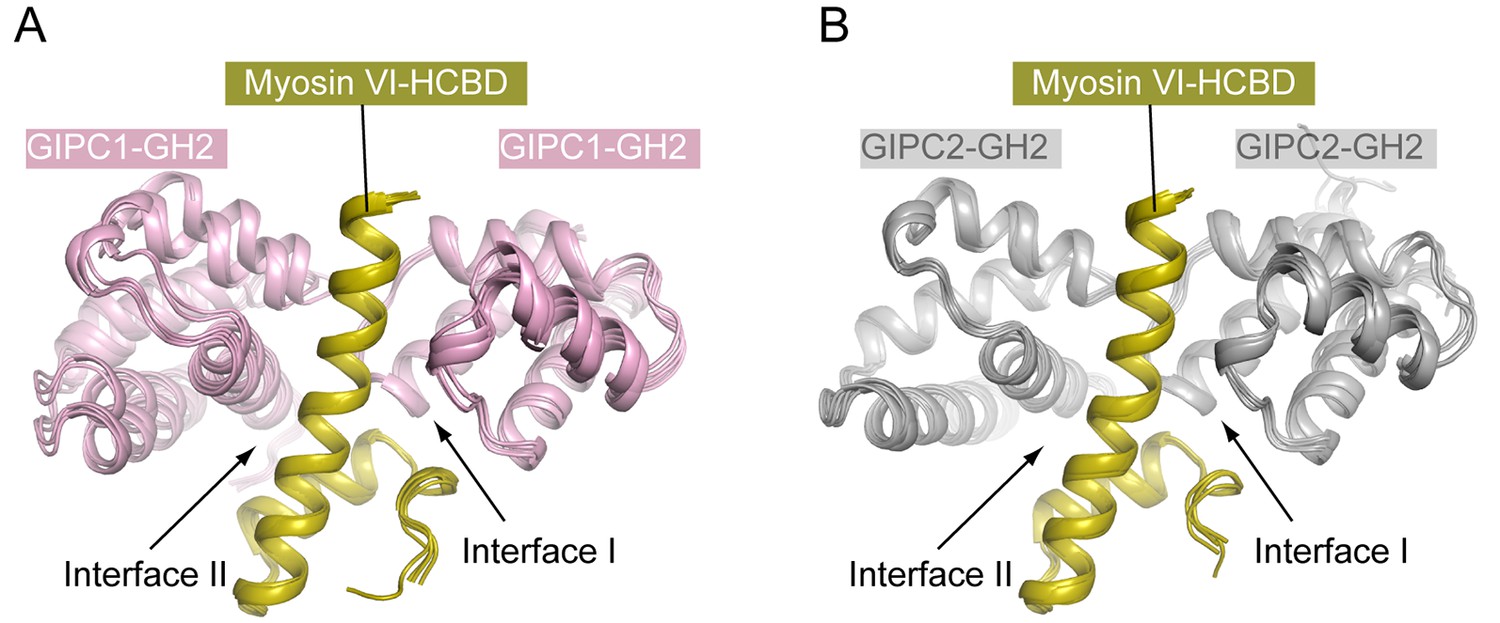
Comparison of interfaces I and II in the structures of the GIPC1-GH2/myosin VI-HCBD and GIPC2-GH2/myosin VI-HCBD complexes.
(A) The five unique copies of the HCBD in the asymmetric unit of the crystal of the GIPC1-GH2/myosin VI-HCBD complex are superimposed. This operation led to well alignment of all the GH2 domains bound to these HCBD molecules, highlighting the fact that all the HCBD molecules in the crystal interact with the GIPC1-GH2 domain in the same modes through either interface I or II. (B) The same superimposition as in (A) was applied to the GIPC2-GH2/myosin VI-HCBD structure, showing that both interfaces I and II are highly similar to those in the GIPC1-GH2/myosin VI-HCBD structure.
Figure 5—figure supplement 4

Interference of the GIPC-GH2/myosin VI-HCBD interaction by the insert helix in the longer version of myosin VI.
The structure of the longer version of myosin VI (PDB ID: 2N12) is superimposed to the HCBD in the GIPC1-GH2/myosin VI-HCBD complex. The two molecules of the GH2 domain, interacting with the HCBD through interfaces I and II, respectively, are shown. The insert helix (red) clashes severely with the GH2 domain bound at interface II, and with that bound at interface I to a lesser extent.
Figure 6
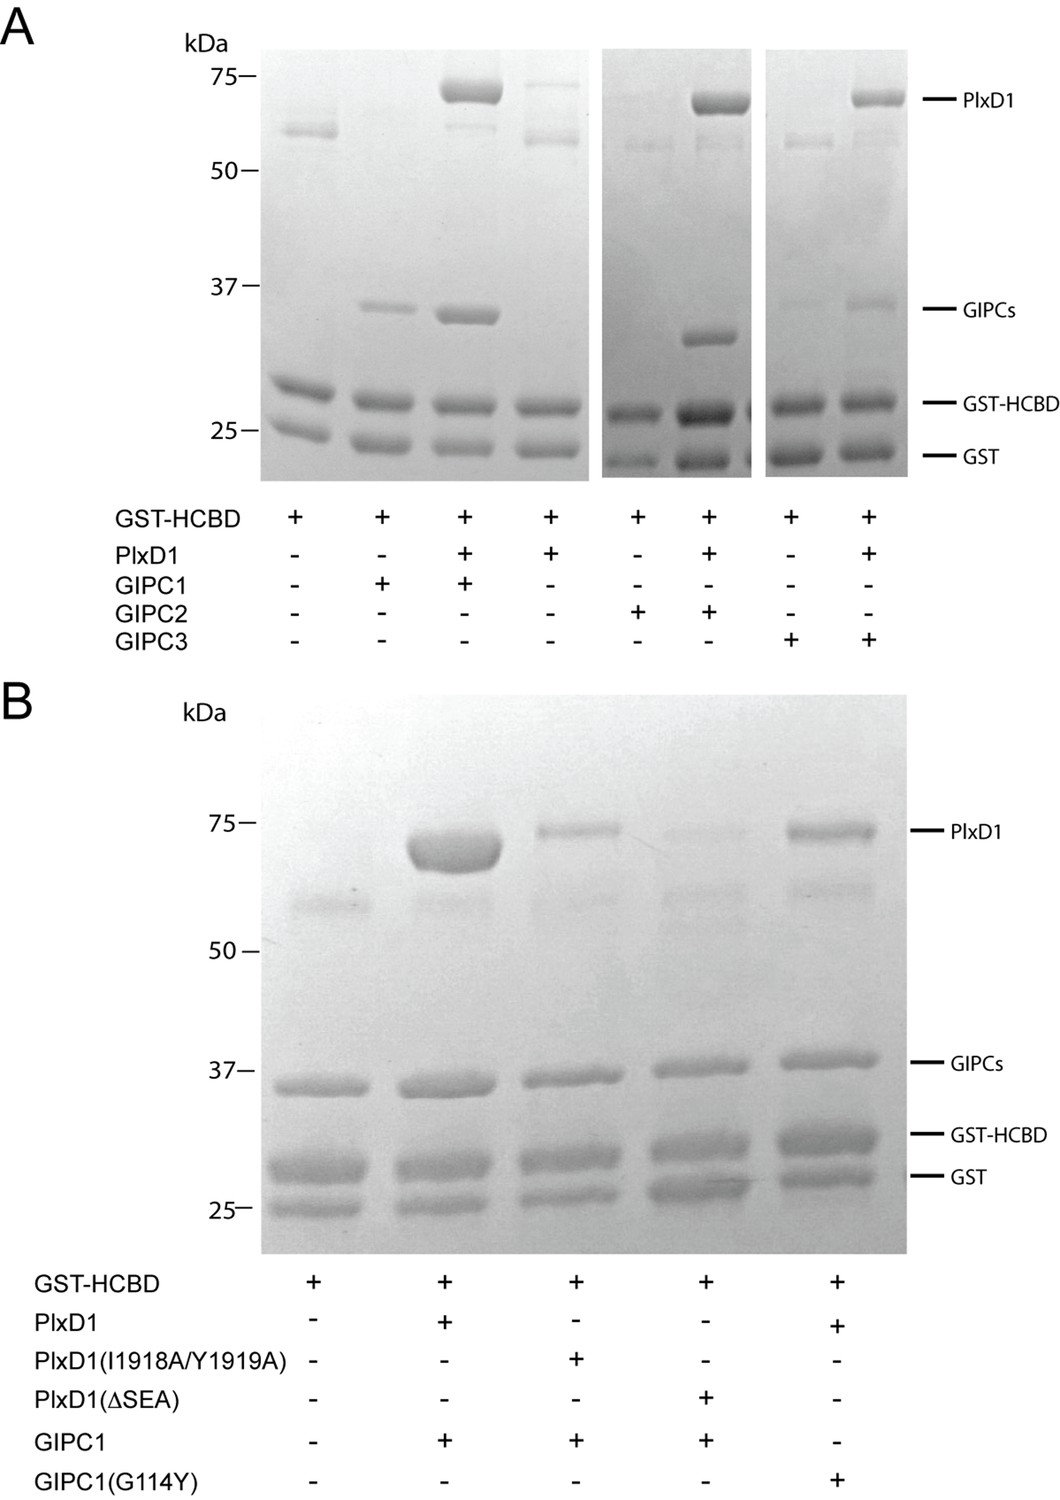
Analyses of the interactions of myosin VI-HCBD with GIPCs and PlexinD1.
(A) Pull-down of GIPC1, GIPC2 and GIPC3 by GST-HCBD in the absence or presence of PlexinD1cyto. (B) Effects of mutations in PlexinD1 and GIPC1 on the interactions among PlexinD1cyto, GIPC1 and myosin VI-HCBD. PlxD1, PlexinD1cyto.
Figure 7 with 2 supplements
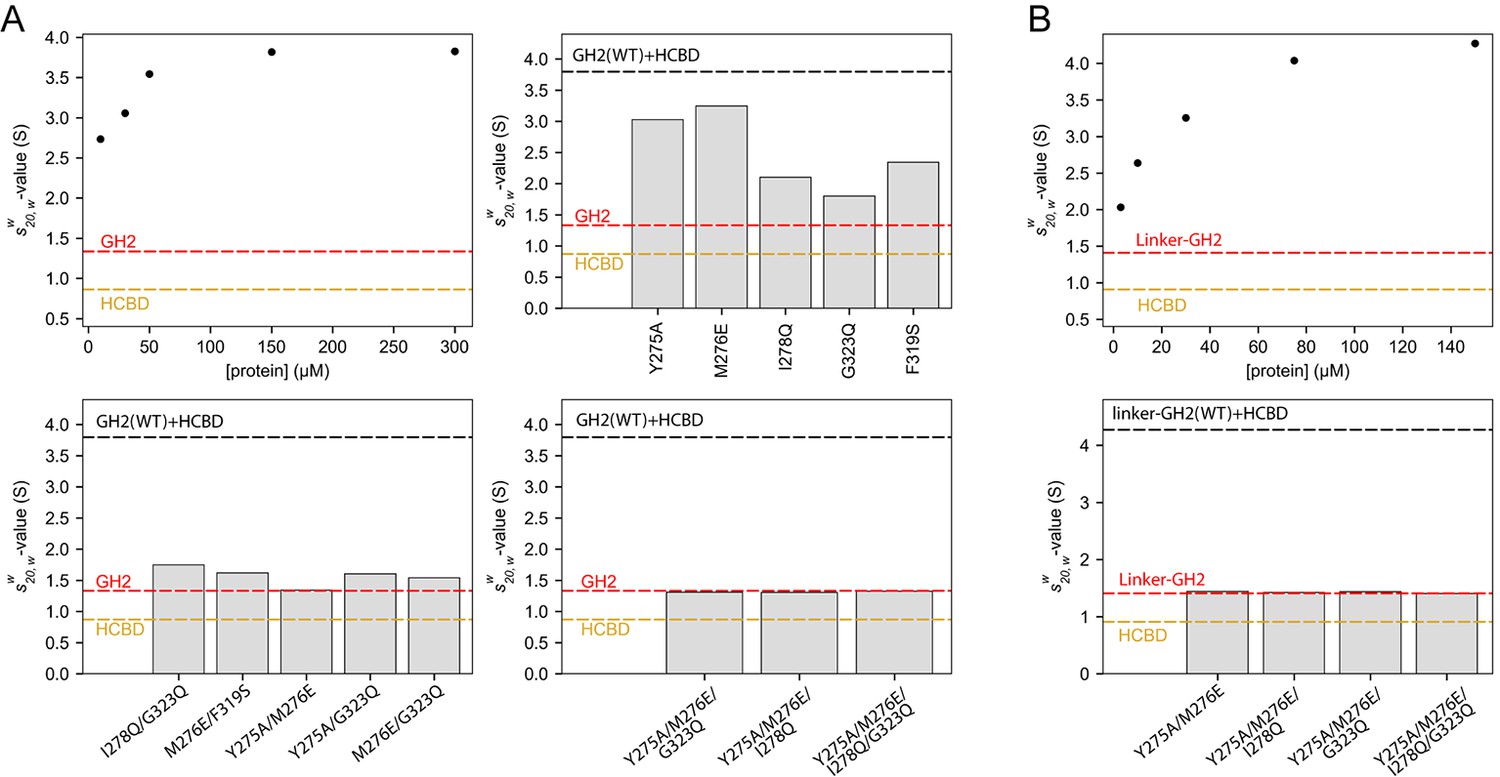
Oligomerization of the GIPC1-GH2/myosin VI-HCBD complex in solution.
(A) Analytical ultracentrifugation (AUC) of the GH2, HCBD and their complexes. The dots in the top-left panel show the -values of the wild-type GH2/HCBD complex at concentrations as indicated on the X-axis. Other panels describe the effects of mutating interfacial residues in the GH2 on the -value of the GH2/HCBD complex (150 μM). The red and orange dashed lines indicate the s20,w-values of the GH2 domain at 30 μM and the HCBD at 20 μM, respectively. The black dashed line indicates the -value of the wild-type complex at 150 μM. (B) AUC of the linker-GH2 and its complex with the HCBD. The top panel describes the titration analogous to the top left panel of (A). The bottom panel shows the effects of interfacial mutations in the linker-GH2 on the -value of the linker-GH2/HCBD complex (150 μM). The HCBD at 150 μM sedimented as a major monomeric and minor dimeric species as shown in Figure 7—figure supplement 1. The s20,w-value of the monomeric species is indicated by the orange dashed lines. The s20,w-value of the linker-GH2 (red dashed line) is the same at both 38 μM and 200 μM. The black dashed line indicates the -value of the wild-type complex at 150 μM.
Figure 7—figure supplement 1

AUC data of the HCBD, GH2, linker-GH2 and the complexes.
(A) The interaction of the GIPC1-GH2 and myosin VI-HCBD studied by AUC. Shown are c(s) distributions, colored as indicated in the inset. The concentrations of the complex given represent those of the equimolar mixtures of the GH2 and HCBD. All distributions have been normalized by the respective areas under the curves. (B) Multi-signal sedimentation velocity (MSSV) analysis of the GH2/HCBD mixture at 30 μM. The areas under the ck(s) distributions represent the concentrations of the respective mixture components. The molar ratio of GH2:HCBD sedimenting faster than 1 S is 1:1. (C) MSSV analysis of the GH2/HCBD mixture at 150 μM. The molar ratio of GH2:HCBD in the region of 1.5–6 S is 1.1:1. (D) AUC analysis of the linker-GH2/HCBD titration. Data are presented in the same fashion as in (A). (E) Comparison of linker-GH2 sedimentation at low and high concentrations. (F) Comparison of HCBD sedimentation at low and high concentrations. Note that the experiment of the HCBD at 20 μM was conducted under low-salt conditions (150 mM NaCl), while the 150 μM sample contained 500 mM NaCl.
Figure 7—figure supplement 2

Salt-dependent reversible precipitation of the complex between the linker-GH2 of GIPC1 and myosin VI-HCBD.
Mixing the linker-GH2 and HCBD in a buffer containing 150 mM NaCl led to precipitation. Adding NaCl to the final concentration of 500 mM re-solubilized the linker-GH2/HCBD complex.
Figure 8 with 1 supplement
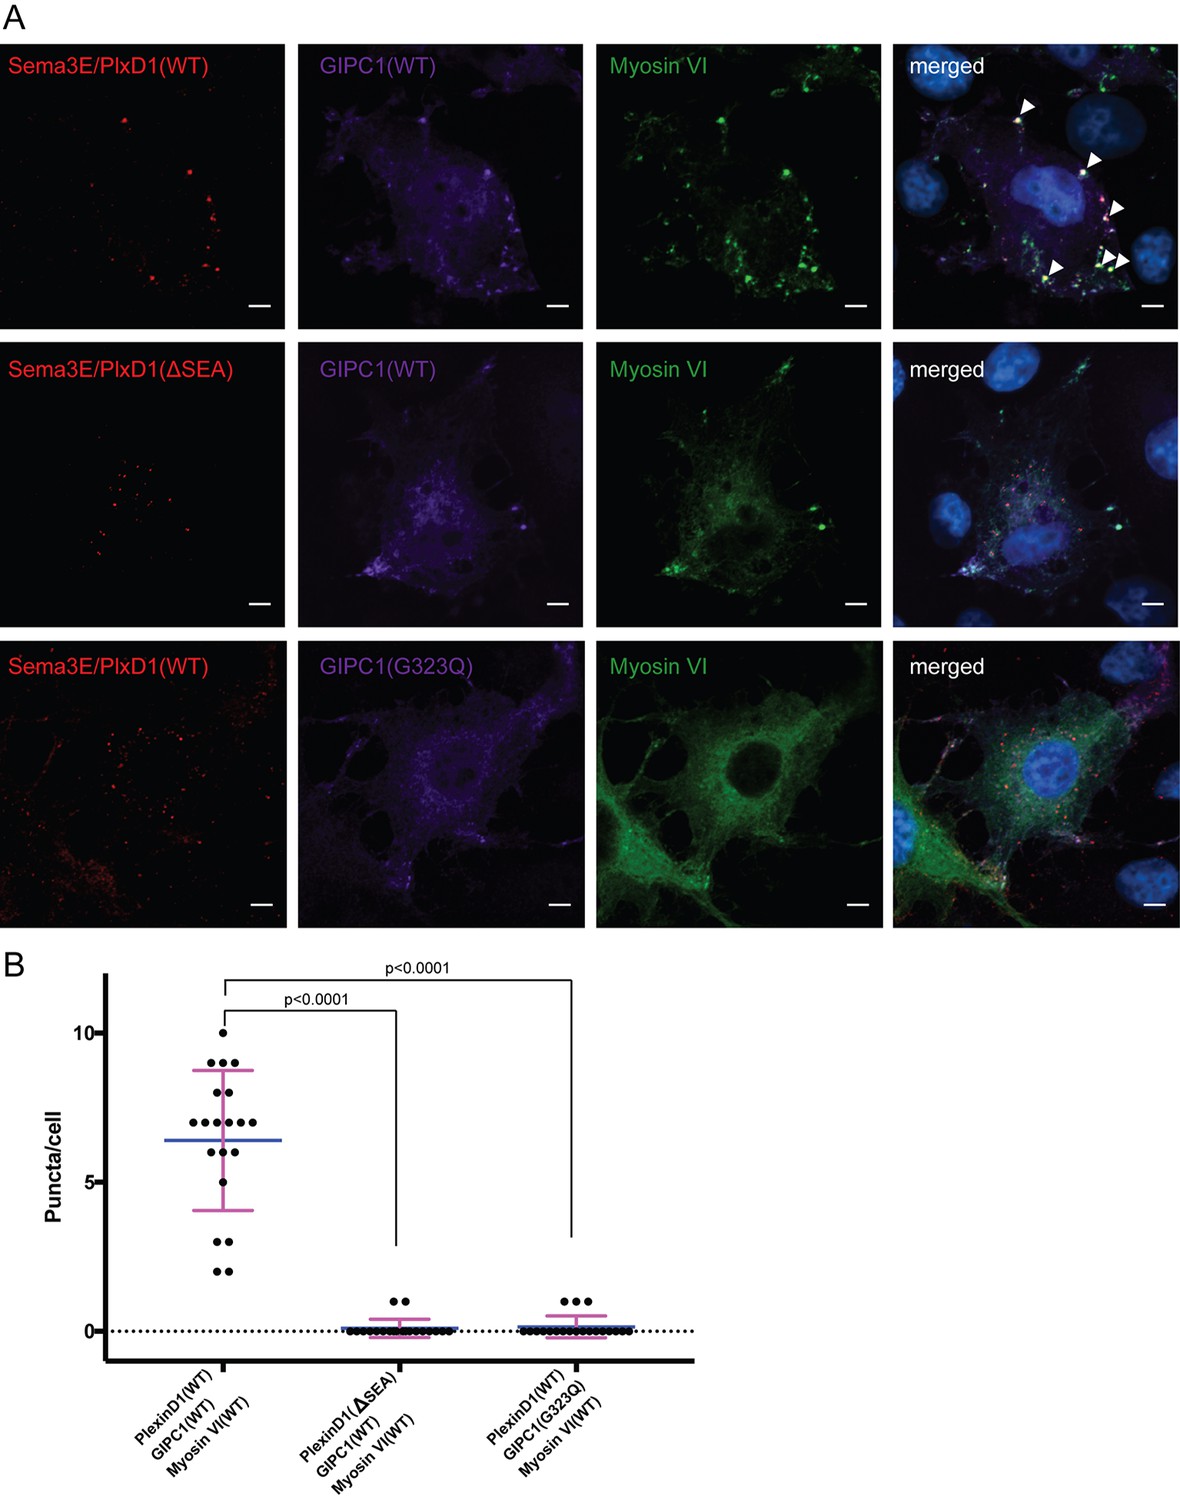
Co-localization and oligomerization of Sema3E/PlexinD1 with GIPC1 and myosin VI in mammalian cells.
(A) Representative fluorescence images of cells. Arrow heads highlight large puncta in which Sema3E/PlexinD1 (red), GIPC1 (purple) and myosin VI (green) co-localize. Nuclei were stained with DAPI (blue). Scale bar, 5 µm. Images shown are representative from three independent samples of each group. (B) Quantification of puncta in each group of cells. Puncta larger than 1 µm2 and containing Sema3E/PlexinD1, GIPC1 and myosin VI are counted for 20 cells from each group. Each dot in the plot represents one cell. Mean and standard deviations are shown as the blue and magenta bars, respectively. p-Values are determined by two-tailed Student’s t-test.
Figure 8—figure supplement 1
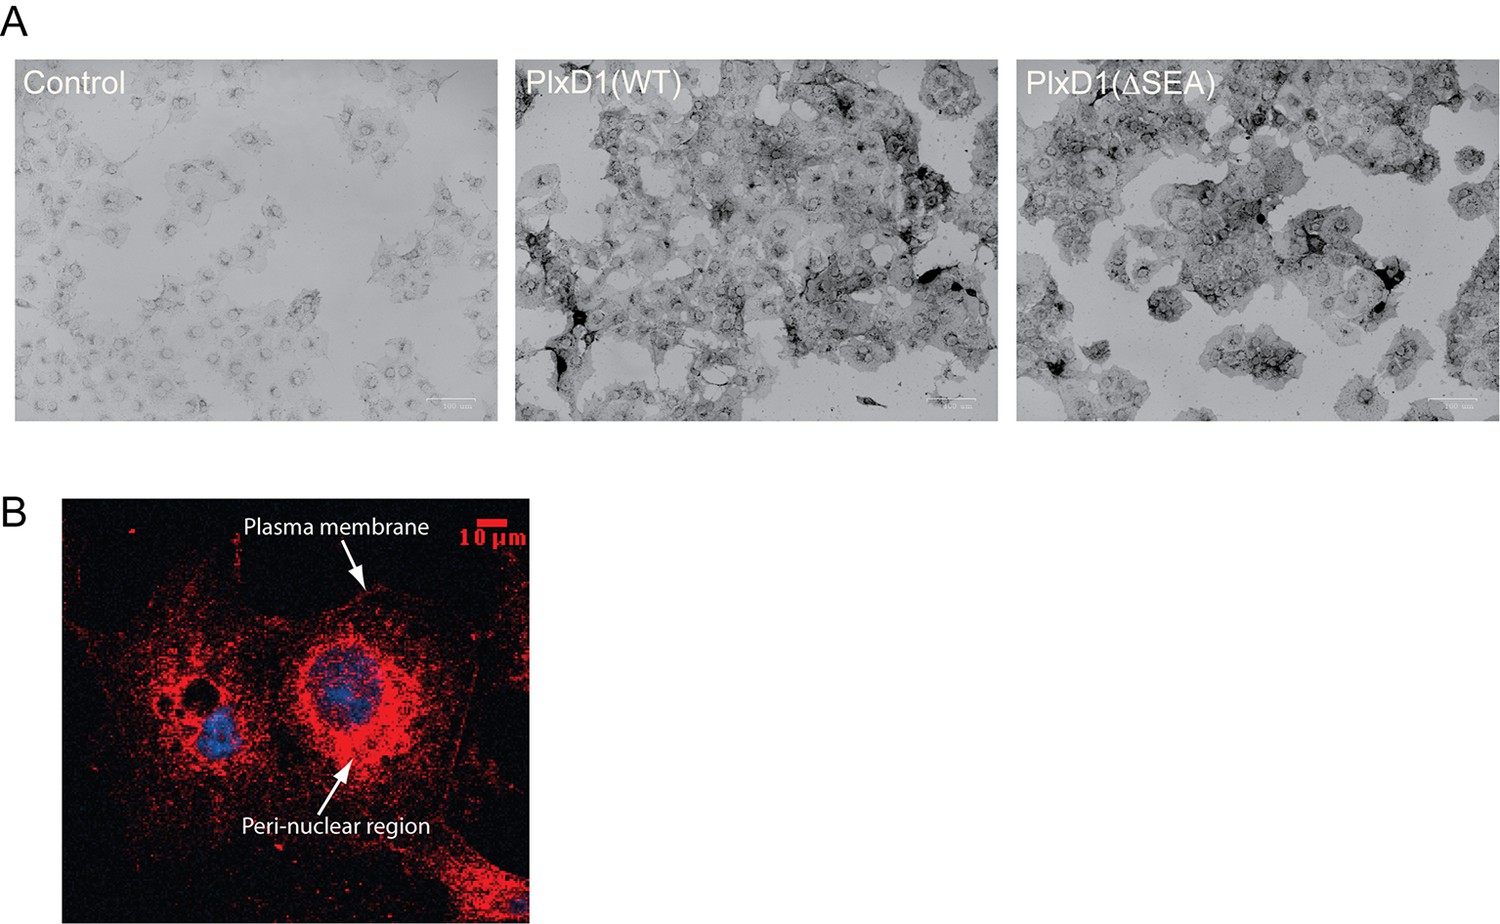
Protein expression analyses of COS-7 cells stably expressing PlexinD1.
(A) Staining of cells with Sema3E, the ligand of PlexinD1, fused to alkaline phosphatase (See Materials and methods for details). Cell surface expression levels of PlexinD1(WT) and PlexinD1(ΔSEA), as reflected by staining darkness of cells, are similar. (B) Confocal image of whole cell distribution of PlexinD1(WT) as detected with anti-PlexinD1 immuno-staining. The image shows that a portion of PlexinD1 did not reach the cell surface and remained in the peri-nuclear region.
Figure 9
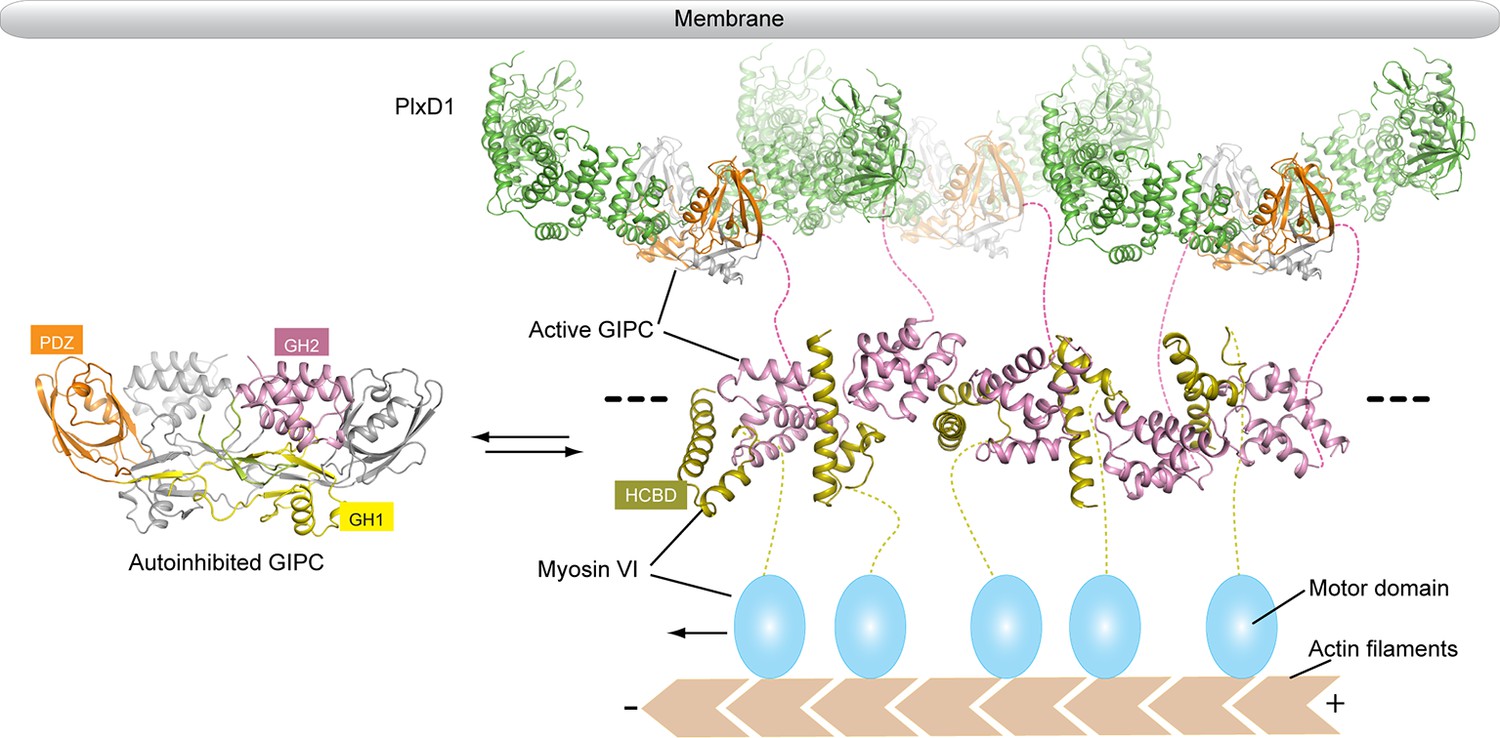
Model of the regulated oligomerization of PlexinD1, GIPCs and myosin VI.
Unbound GIPCs adopt the autoinhibited conformation (left). Binding of cargo such as PlexinD1 to GIPCs releases the autoinhibition, promoting their interaction with myosin VI and formation of the linear oligomer (right). The black dashed lines indicate that the oligomer can extend further, and multiple such oligomers can assemble into two-dimensional arrays. The transmembrane and extracellular regions of PlexinD1 are omitted for clarity.
Figure 10

Mapping disease-associated mutations in GIPCs to the GIPC1 structure.
The structure is shown in the same view and color scheme as in the right panel of Figure 1B. The mutations listed in Table 2 are mapped to the colored subunit in the dimer.
Author response image 1

Tables
Table 1
Data collection and refinement statistics.
| GIPC1 | PlexinD1 | PlexinD1/ GIPC1 complex | GIPC1-GH2/ myosin VI-HCBD complex | GIPC2-GH2/ myosin VI-HCBD complex | |
|---|---|---|---|---|---|
| Data collection | |||||
| Space group | P21 | P21 | P6122 | I222 | C2 |
| Cell dimensions | |||||
| a, b, c (Å) | 45.4, 77.6, 80.3 | 69.9, 164.5, 84.3 | 99.8, 99.8, 531.9 | 115.0, 164.1, 171.8 | 171.8, 53.2, 122.8 |
| α, β, γ (°) | 90.00, 89.95, 90.00 | 90.00, 99.47, 90.00 | 90.00, 90.00, 120.00 | 90.00, 90.00, 90.00 | 90.00 108.23 90.00 |
| Content of the asymmetric unit | GIPC1 dimer, 1 | PlexinD1, 2 | PlexinD1, 1; GIPC1, 1 | GH2, 5; HCBD, 5 | GH2, 5; HCBD, 5 |
| Resolution (Å) | 50.0–1.90 (1.93–1.90)* | 50.0–2.70 (2.75–2.70) | 50.0–3.20 (3.26–3.20) | 50.0–3.5 (3.56–3.50) | 50–3.6 (3.66–3.60) |
| Rsym (%) | 6.2 (56.1) | 7.2 (38.8) | 14.1 (81.9) | 15.7(>100) | 15.9 (47.2) |
| Rpim(%) | 3.4 (31.9) | 4.2 (23.1) | 4.1 (36.8) | 7.4 (49.3) | 7.9 (27.2) |
| I/σ | 21.3 (2.1) | 29.9 (3.4) | 17.5 (2.0) | 10.3 (1.6) | 11.0 (2.7) |
| CC1/2# | 0.782 | 0.922 | 0.679 | 0.653 | 0.859 |
| Completeness (%) | 100.0 (100.0) | 99.4 (96.8) | 100.0 (100.0) | 98.1 (97.0) | 98.7 (95.4) |
| Redundancy | 4.1 (4.0) | 3.9 (3.6) | 12.0 (5.6) | 6.1 (6.0) | 4.7 (3.7) |
| Refinement | |||||
| Resolution (Å) | 40.1–1.9 (1.95–1.90) | 37.1–2.7 (2.77–2.70) | 48.0–3.2 (3.28–3.20) | 47.1–3.5 (3.60–3.50) | 42.9–3.6 (3.79–3.60) |
| No. reflections | 40623 | 47171 | 26781 | 18708 | 9763 |
| Rwork/Rfree (%) | 13.6 (19.4)/17.5 (24.8) | 21.5 (31.8)/25.6 (36.9) | 17.9 (29.3)/21.6 (32.4) | 18.7 (26.8)/24.0 (32.3) | 21.3 (26.6)/27.8 (37.6) |
| No. atoms | |||||
| Protein | 4120 | 8092 | 5416 | 4858 | 4590 |
| Ligand/ion | 0 | 0 | 35 | 0 | 0 |
| Water | 645 | 98 | 19 | 0 | 0 |
| B-factors | |||||
| Protein | 21.9 | 80.0 | 57.8 | 70.4 | 57.8 |
| Ligand/ion | 115.2 | ||||
| Water | 33.5 | 61.0 | 25.7 | ||
| R.m.s deviations | |||||
| Bond lengths (Å) | 0.006 | 0.003 | 0.005 | 0.007 | 0.003 |
| Bond angles (°) | 0.9276 | 0.617 | 0.834 | 0.823 | 0.603 |
| Ramanchandran plot | |||||
| Favored (%) | 96.5 | 96.2 | 96.7 | 94.1 | 96.2 |
| Allowed (%) | 3.5 | 3.6 | 3.2 | 5.9 | 3.7 |
| Disallowed (%) | 0 | 0.2 | 0.1 | 0 | 0.2 |
-
*Numbers in parenthesis are for the highest resolution shell.
-
# CC1/2 values shown are for the highest resolution shell.
Table 2
Structural mapping of disease-associated mutations in GIPCs. Listed mutations are based on (Ammar-Khodja et al., 2015; Katoh, 2013). HNSCC, head and neck squamous cell carcinoma. Mutations are mapped to GIPC1 based on the sequence alignment of GIPC1, 2 and 3 as shown in Figure 1—figure supplement 2.
| Gene | Mutation | Disease | Corresponding residue in GIPC1 | Location and function of the mutated residue | Possible effect of the mutation |
|---|---|---|---|---|---|
| GIPC1 | F319L | HNSCC | F319 | GH2, Interface II for myosin VI | Weaken binding to myosin VI |
| GIPC2 | F74Y | Colorectal cancer | F90 | GH1, Hydrophobic core | Destabilize the structure |
| GIPC2 | G102E | Ovarian cancer | G118 | GH1, Domain-swapped dimer Interface | Destabilize the structure |
| GIPC3 | M88I | Familial hearing loss | M109 | GH1, Inter-domain interface with PDZ | Destabilize the structure |
| GIPC3 | G94D | Familial hearing loss | G115 | GH1, autoinhibitory interface with GH2, Part of the hydrophobic pocket accommodating the I1918/Y1919 motif in PlexinD1 | Disrupt the autoinhibited state, Weaken cargo binding |
| GIPC3 | H170N | Familial hearing loss | H191 | PDZ, Key PBM binding residue | Weaken cargo binding |
| GIPC3 | T221I | Familial hearing loss | T242 | PDZ/GH2 Linker, Autoinhibitory interface with GH2 | Alter the autoinhibited state |
| GIPC3 | M255K | Familial hearing loss | M276 | GH2, Autoinhibitory interface with PDZ, Interface I for myosin VI | Alter the autoinhibited state, weaken binding to myosin VI |
| GIPC3 | G256D | Familial hearing loss | G277 | GH2, Autoinhibitory interface with PDZ Interface I for myosin VI | Alter the autoinhibited state, weaken binding to myosin VI |
| GIPC3 | L262R | Familial hearing loss | L283 | GH2, Autoinhibitory interface with PDZ, Interface I for myosin VI | Alter the autoinhibited state, weaken binding to myosin VI |
Download links
A two-part list of links to download the article, or parts of the article, in various formats.
Downloads (link to download the article as PDF)
Open citations (links to open the citations from this article in various online reference manager services)
Cite this article (links to download the citations from this article in formats compatible with various reference manager tools)
Structure analyses reveal a regulated oligomerization mechanism of the PlexinD1/GIPC/myosin VI complex
eLife 6:e27322.
https://doi.org/10.7554/eLife.27322


