Golgi-independent secretory trafficking through recycling endosomes in neuronal dendrites and spines
- University of Colorado School of Medicine, United States
- University Paris-Descartes, France
Figures
Figure 1 with 3 supplements
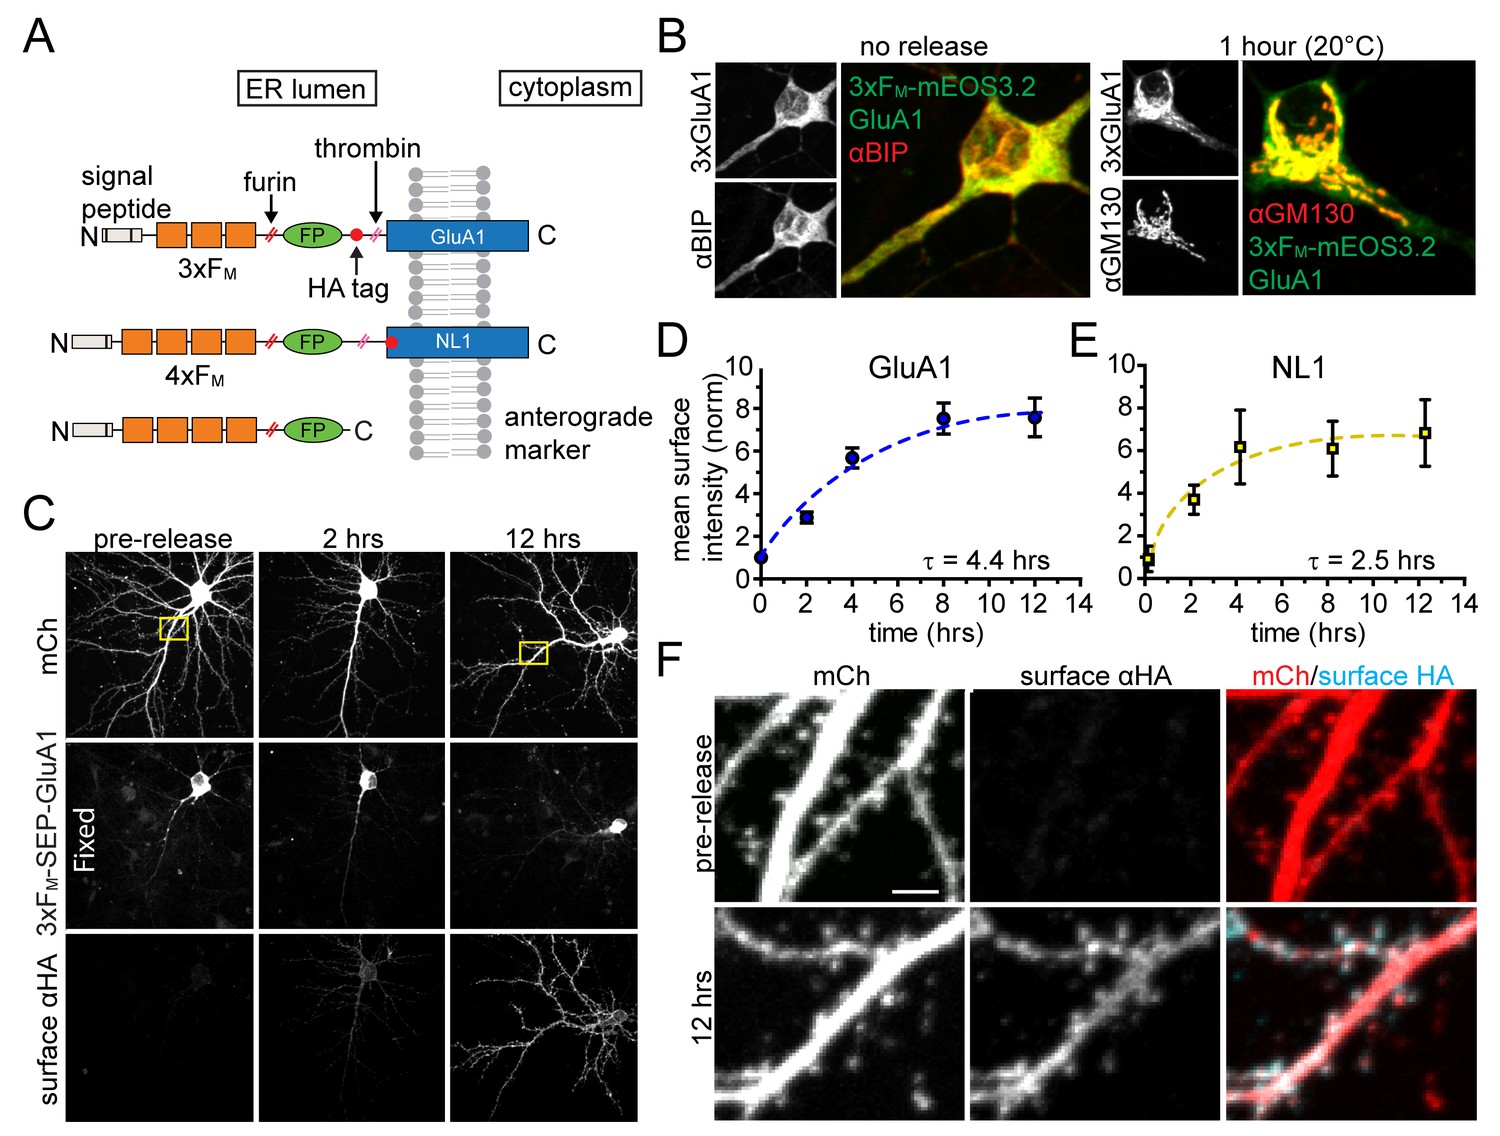
Inducible release system to investigate the dendritic secretory network.
(A) Schematic depicting inducible release constructs. Multiple copies of self-associating FM domains were fused to target proteins downstream of an ER signal peptide and upstream of a fluorescent protein (FP). DDS dissociates FM domains allowing synchronous ER exit. A furin cleavage site allows removal of the FM domains as they transit the GA. A thrombin cleavage site was included in some constructs so that the FP could be selectively removed from proteins localized at the PM. (B) Comparison of 3xFM-mEOS-GluA1 with the endogenous ER-marker BiP before release (left panel) and the Golgi marker GM130 1 hr after DDS addition (right panel). (C) Detection of GluA1 surface delivery at various time points following addition of DDS by surface labelling against the extracellular HA-tag of 3xFM-GluA1. (D) Quantification of GluA1 surface delivery shown in C (mean ± SEM, n = 10–12 neurons/timepoint from 2 independent experiments). All values normalized to neurons that were not treated with DDS. (E) Time-course of NL1 surface delivery (mean ± SEM, n = 9–10 neurons/timepoint from 2 independent experiments). (F) Localization of surface GluA1 after ER-release. Images taken from insets in panel C. Scale bar, 2 µm.
Figure 1—figure supplement 1

ER-retention of 4xFM-SEP-NL1.
ER-retained 4xFM-SEP-NL1 coexpressed with an engineered ER-marker TfR-mCh-KDEL in a COS7 cell. Scale bar, 5 µm.
Figure 1—figure supplement 2

4xFM-NL1 trafficking in COS7 cell.
Trafficking of 4xFM-SNAPtag-NL1 (labelled with JF646) in COS7 cells. 30 min after addition of DDS, NL1 accumulates in a perinuclear GA-like distribution. 120’ after addition of DDS, NL1 is present on the membrane and in vesicular structures located throughout the cell. Addition of thrombin eliminates the surface signal. Scale bar, 10 µm.
Figure 1—figure supplement 3
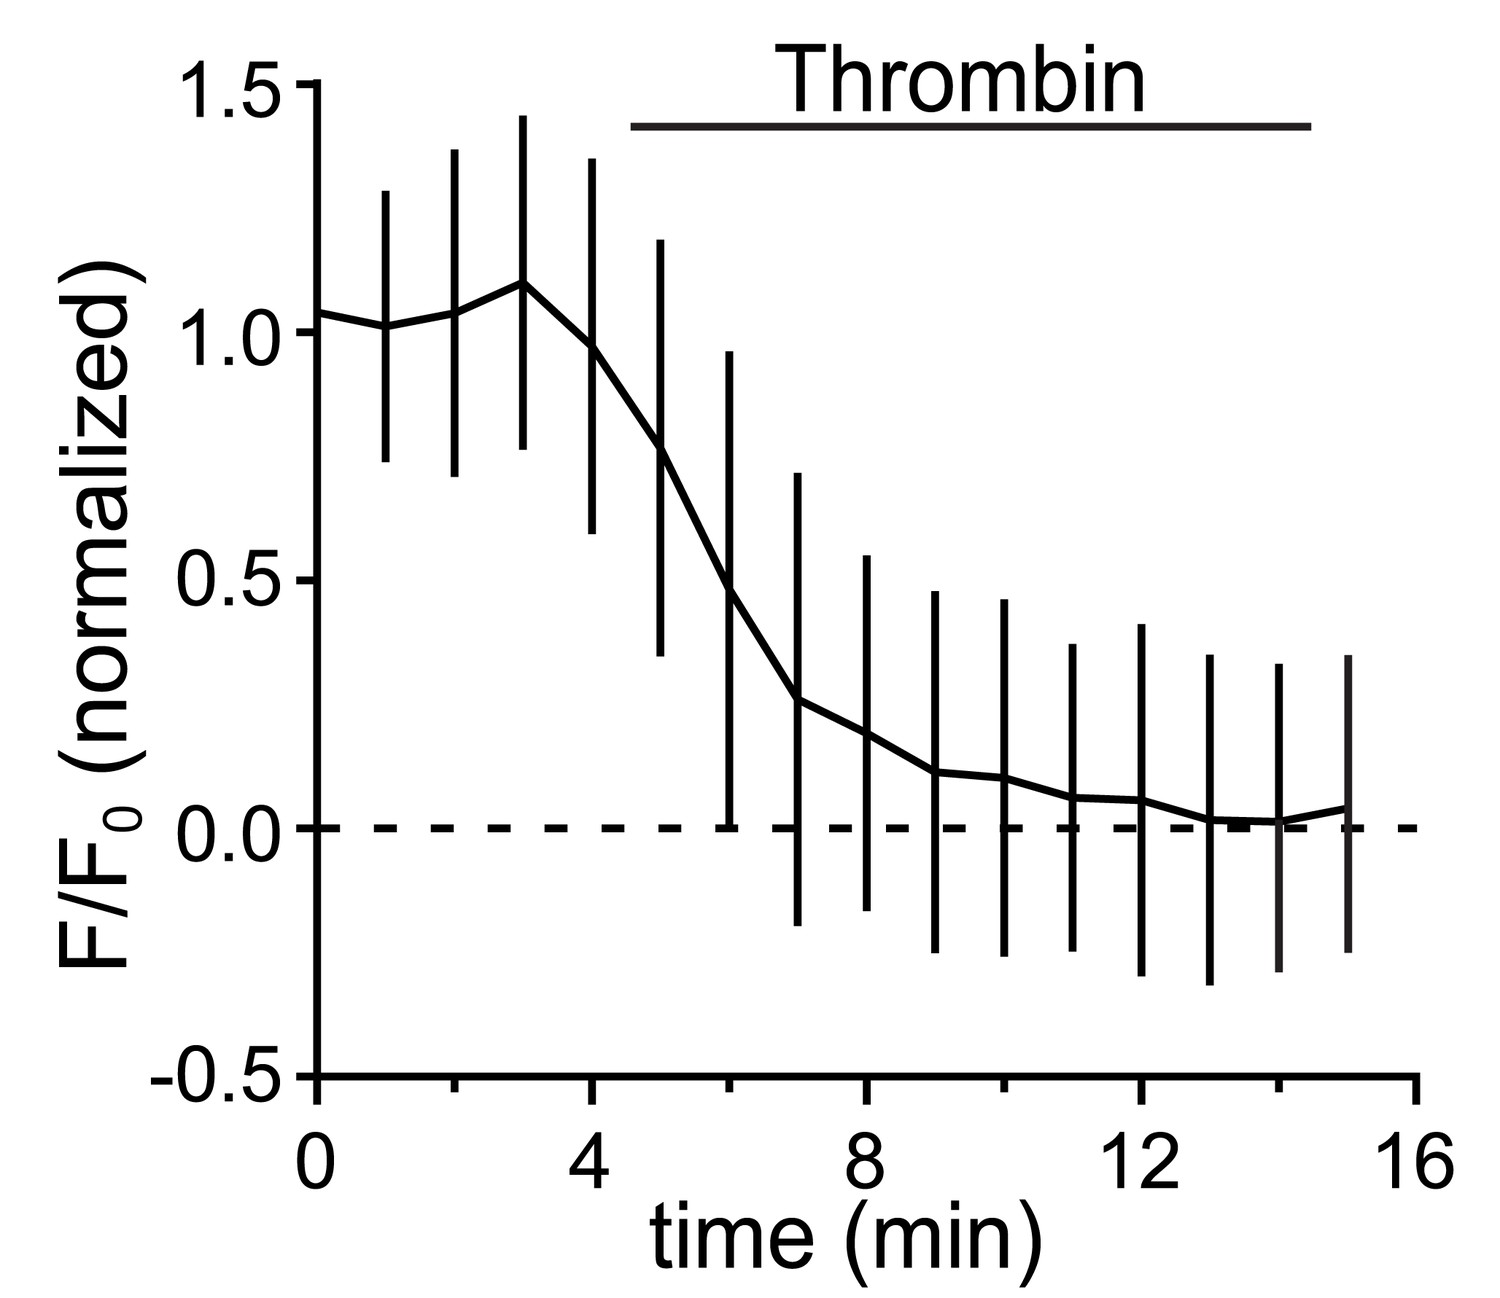
Kinetics of fluorescent tag removal by thrombin.
Kinetics of fluorescent protein removal following addition of extracellular thrombin (1 U/ml) in neurons expressing 3xFM-SEP-GluA1 (containing thrombin site between SEP and GluA1) and exposed to DDS (data are normalized to the pre-thrombin values; mean ± SD, n = 4 neurons). SEP-tagged GluA1 was used for this experiment to selectively visualize surface receptors.
Figure 2 with 1 supplement

Compartmentalization of GluA1 trafficking between the soma and dendrites.
(A) Localization of dendritically photoconverted mEOS*-GluA1 after ER-release. A cortical neuron expressing 3xFM-mEOS3.2-GluA1 was imaged at baseline (top panels) and immediately after photoconversion of mEOS3.2 from green to red (middle panels or 0’ time point). After photoconversion, DDS was added and the cells were imaged for 120 min (bottom panels). The yellow line highlights the distribution of mEOS*-GluA1 before and after addition of DDS. The pink arrow highlights the cell body, which exhibits robust accumulation of non-photoconverted GluA1 (in the green channel), but does not accumulate mEOS*-GluA1 over the same time period. Scale bar, 50 µm. Also see Video 1. (B) Cortical neuron imaged before and after somatic photoconversion and following ER release. Photoconversion results in robust generation of mEOS*-GluA1 in the neuronal soma (middle panel). Following addition of DDS, mEOS*-GluA1 redistributes to somatic GA with little entry into dendrites (bottom panels). The yellow bar indicates the distribution of photoconverted cargo before and after ER release. The pink arrows indicate the appearance of dendritic GluA1 puncta (green channel) lacking mEOS*-GluA1 (red channel) following release. Dendrites were computationally straightened using ImageJ; scale bar, 25 μm. Also see Video 2. (C) Quantification of the percent of mEOS*-GluA1 localized to the neuronal soma 120’ after ER release following dendritic or somatic photoconversion. (mean ± SEM, n = 7 neurons for somatic photoconversion; n = 9 neurons for dendritic photoconversion from 3 experiments).
Figure 2—figure supplement 1
Photoconversion of 3xFM-mEOS-GluA1 without ER release.
(A) Shown is a cortical neuron expressing 3xFM-mEOS-GluA1 that was photoconverted from green to red in a dendritic region with local 405 nm excitation. Scale bar 30 µm. (B) Zoomed images (yellow square in A) are shown before, and at various times following dendritic photoconversion. The red signal largely remains within the original boundary of photoconversion (dashed lines). Scale bar 5 µm. (C) Same as B, except photoconversion was performed in the soma. Scale bar 5 µm. (D) Quantification of somatic mEOS*-GluA1 signal (normalized to signal immediately following photoconversion) within and at various distances into the adjacent dendritic arbors. Mean values ± SEM are plotted for 6 neurons. (E) Same as E for dendritic mEOS-GluA1 photoconversion. Mean values ± SEM are plotted for 4 neurons.
Figure 3

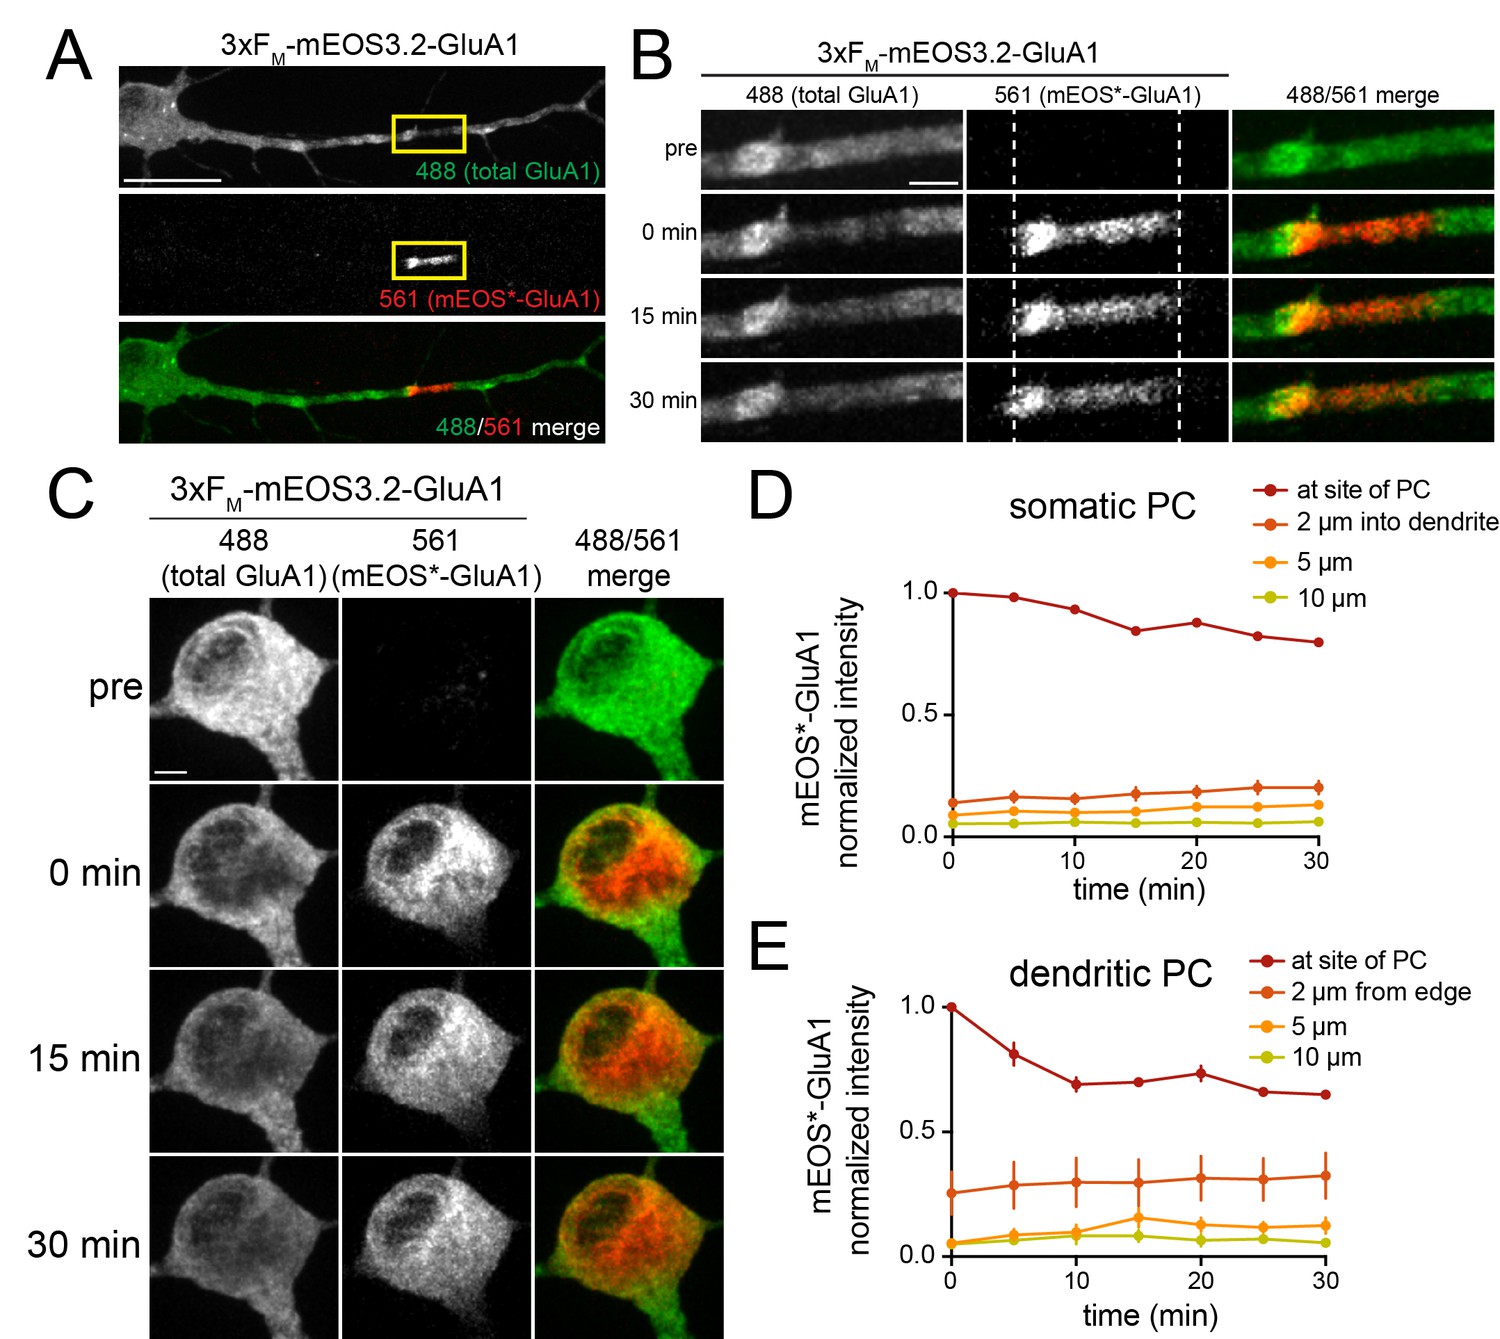
Quantification of spatial confinement after GluA1 exits the somatic or dendritic ER.
(A) Time-course of the accumulation of GluA1 (total signal in the 488 channel) in the somatic Golgi (mean ±SEM. black line, plotted on left Y-axis, n = 19 neurons, 4 experiments) and the appearance of dendritic GluA1 puncta with (+DDS, red triangles w/dotted line, n = 8 neurons from 3 experiments) or without addition of DDS (puncta no release, grey squares, n = 5 neurons from 2 experiments) plotted on the right Y-axis. (B) Spatially constrained trafficking of photoconverted mEOS-GluA1 to local dendritic organelles following ER release. ER-localized 3xFM-GluA1-mEOS3.2 was photoconverted from green to red in a dendritic segment prior to the addition of DDS. Images show mEOS*-GluA1 signal prior to photoconversion (top), immediately following photoconversion (middle) and 60 min following ER release (bottom). Dendrites computationally straightened in ImageJ. Scale bar, 30 µm. (C) The left panel plots the mean mEOS*-GluA1 fluorescence intensity in individual dendritic puncta as a function of their distance from the boundaries of the photoconversion site, 60 min following ER release. The arrow denotes the somatic Golgi data point. The right panel shows pooled and binned data for 5 neurons, mean ±SEM from 3 experiments. Schematized neuron aligns with X-axis of graph. (D) ER-localized 3xFM-GluA1-mEOS3.2 was photoconverted from green to red in the neuronal soma prior to the addition of DDS. Images show mEOS*-GluA1 signal prior to photoconversion (top), immediately following photoconversion (middle) and 60 min following ER release (bottom). Dendrites computationally straightened in ImageJ. Scale bar, 30 µm. Blue arrows indicate dendritic puncta that appear in the total GluA1 channel, but do not contain detectable mEOS*-GluA1. (E) Quantification of somatically photoconverted GluA1 60 min following ER release. The left graph plots mEOS*-GluA1 signal intensity as a function of distance from the soma (somatic Golgi indicated by the black arrow). The right panel shows pooled and binned data for 5 neurons, mean ± SEM from 3 experiments. Schematized neuron aligns with X-axis of graph.
Figure 4 with 4 supplements
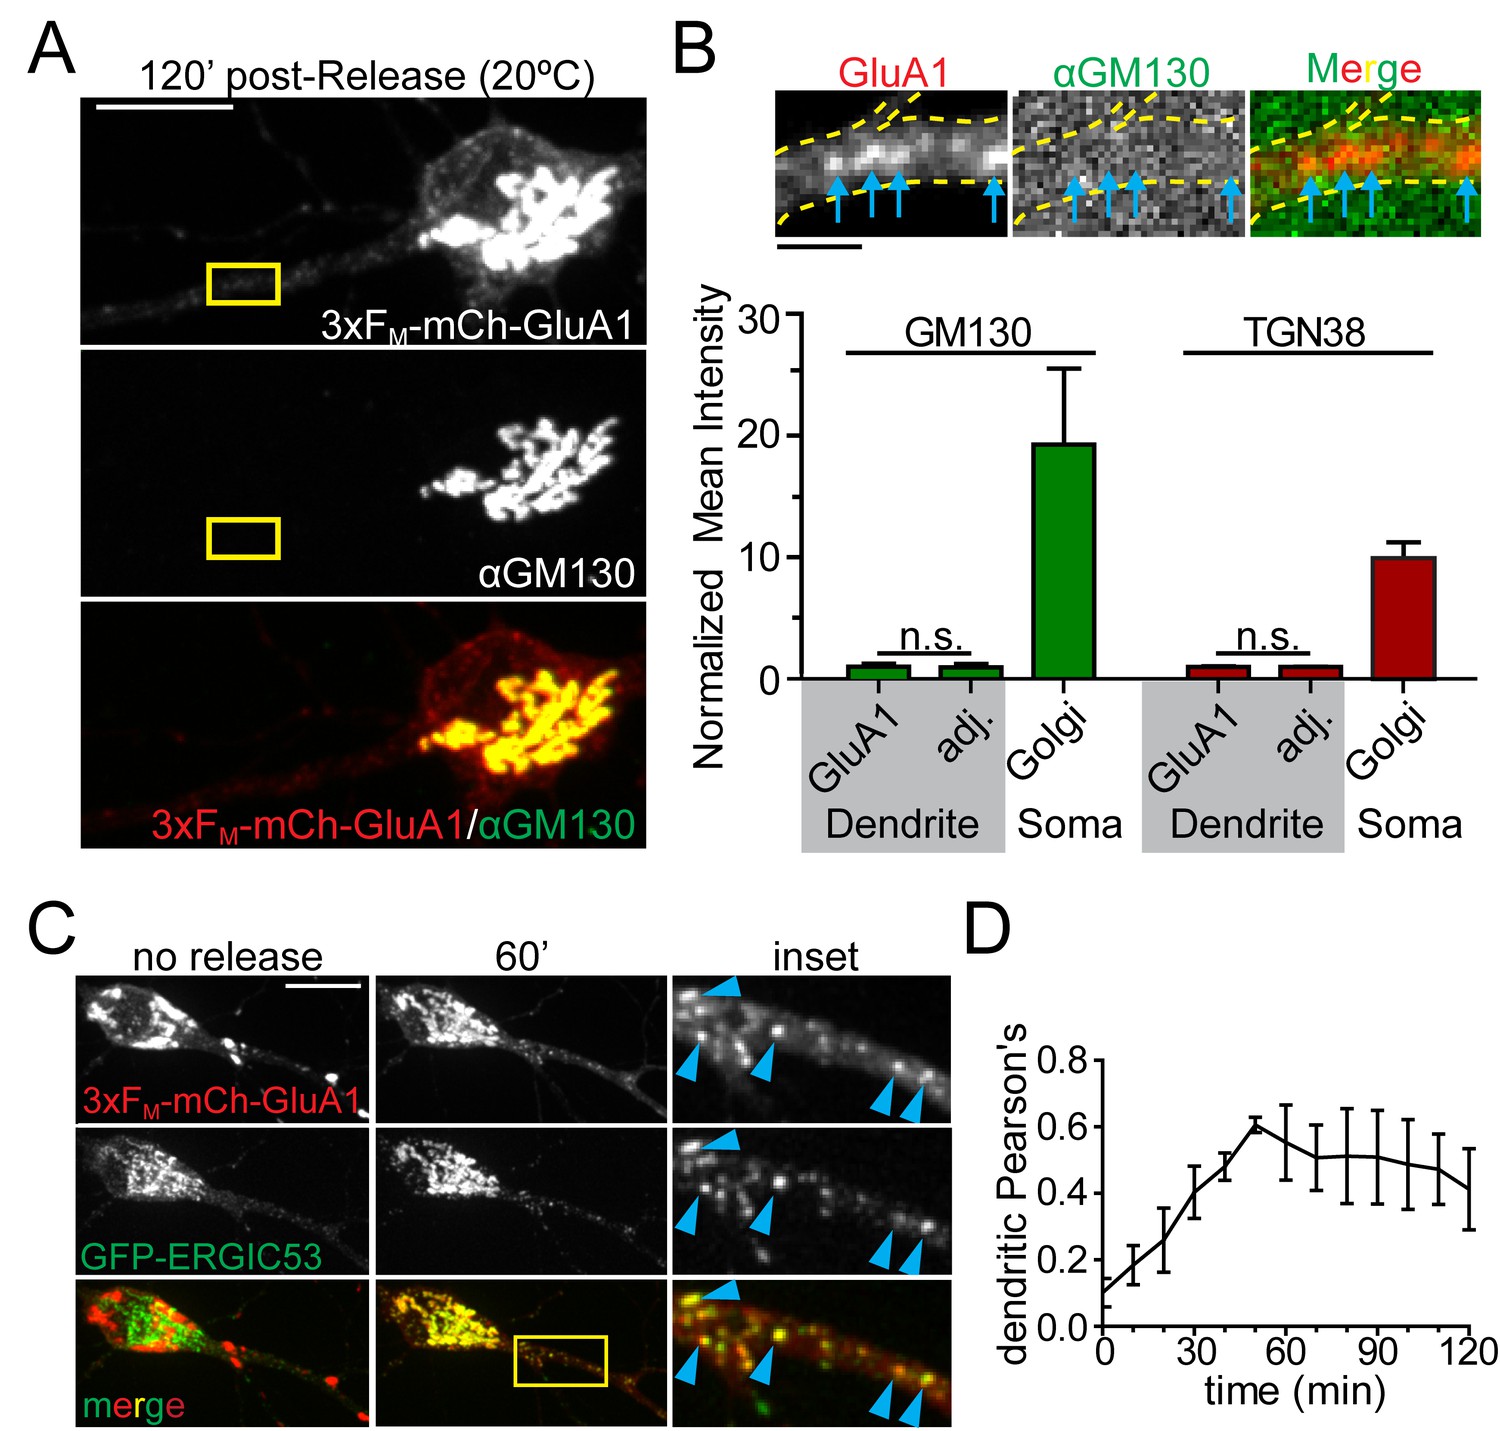
GluA1 accumulates in dendritic ER-Golgi intermediate compartments.
(A) Dendritic trafficking organelles are negative for canonical GA markers. Shown is GM130 staining (middle panel) of neurons expressing 3xFM-GluA1-mCh (top panel) 120 min after ER-release at 20°C. Scale bar, 10 μm. (B) Images are from the inset in A and show the accumulation of 3xFM-GluA1-mCh in dendritic puncta (blue arrows) that contain no detectable GM130 signal (the brightness of these images has been linearly adjusted to visualize lack of GM130 signal in dendrites). GluA1 puncta (blue arrows) do not stain with GM130. Bottom graph shows quantification of cis- (GM130) and trans- (TGN38) Golgi markers at GluA1 puncta that form following ER release at 20 ˚C. The intensities of Golgi-marker staining at GluA1 puncta are compared to immediately adjacent dendritic ROIs negative for GluA1-positive trafficking organelles. Relative intensities of GM130 and TGN38 in the somatic Golgi are also plotted for comparison (mean ±SEM, n = 5 neurons/condition from 2 experiments, n.s. = not significant by unpaired two-tailed Student’s t-test.). Scale bar, 2 µm. (C) Colocalization of 3xFM-mCh-GluA1 and GFP-ERGIC53 before and 60 min after addition of DDS. Blue arrowheads denote colocalized dendritic puncta. (D) Colocalization between 3xFM-GluA1-mCh and ERGIC53-GFP within the dendrite was calculated using Pearson’s correlation and plotted as a function of time following ER release (mean ± SEM, n = 5 neurons from 2 experiments).
Figure 4—figure supplement 1
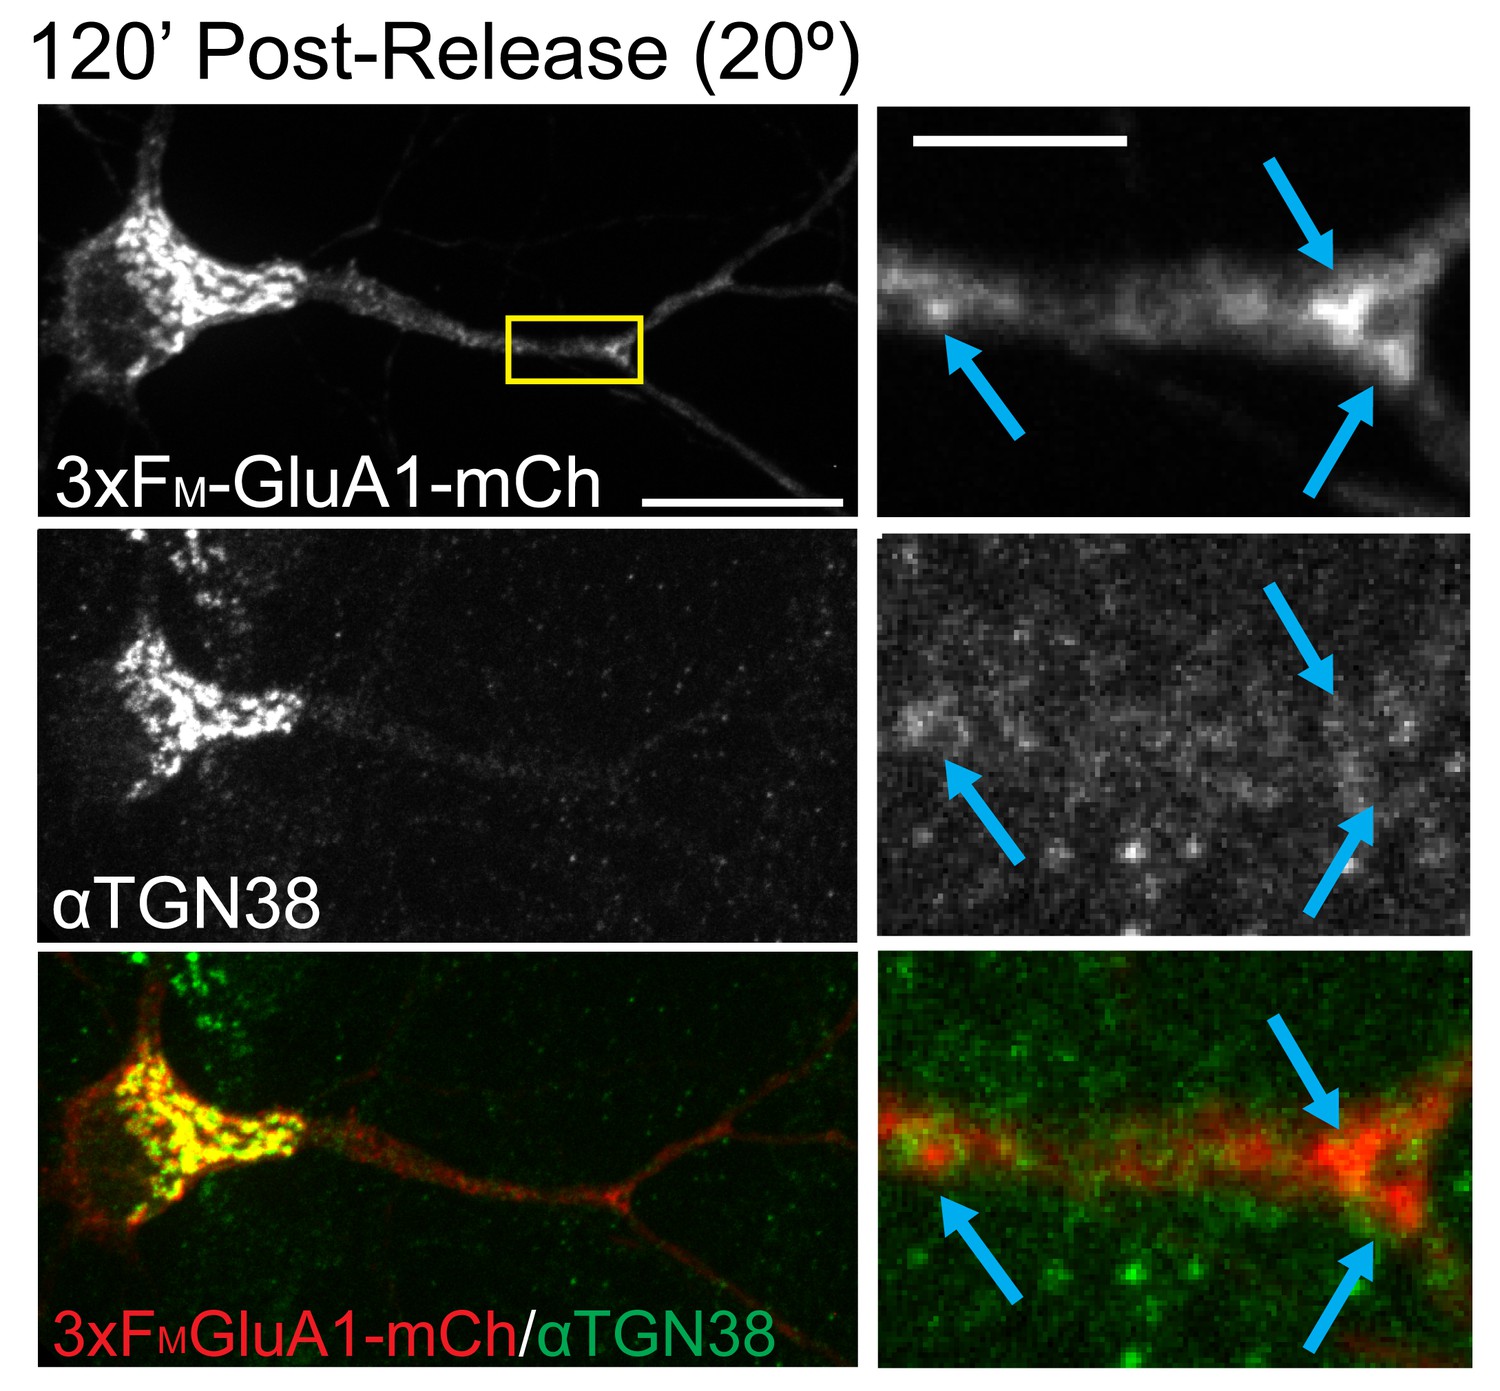
Dendritic GluA1 puncta are negative for TGN38.
Cortical neuron expressing 3xFM-mCh-GluA1 two hours after addition of DDS at 20°C and stained for TGN38 (as in Figure 4A). See quantification in Figure 4B. Scale bar, 25 μm. Inset scale, 5 μm.
Figure 4—figure supplement 2
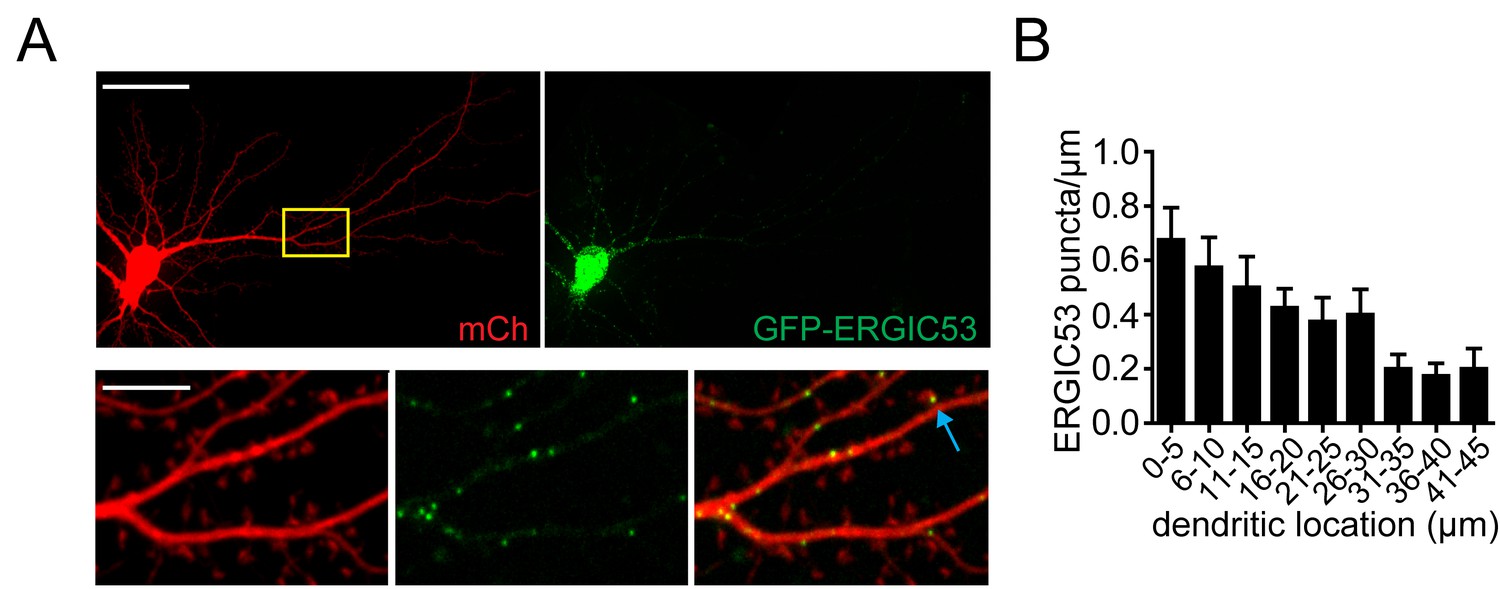
Dendritic localization of ERGIC53.
(A) Neuron expressing ERGIC53-GFP and mCh cell fill. Blue arrow indicates a rarely observed spine-localized ERGIC puncta. Scale bar top images, 50 µm; scale bar bottom images, 10 µm. (B) Histogram of ERGIC53-GFP puncta density as a function of distance from the neuronal soma (mean ±SEM n=5 neurons from 2 experiments).
Figure 4—figure supplement 3
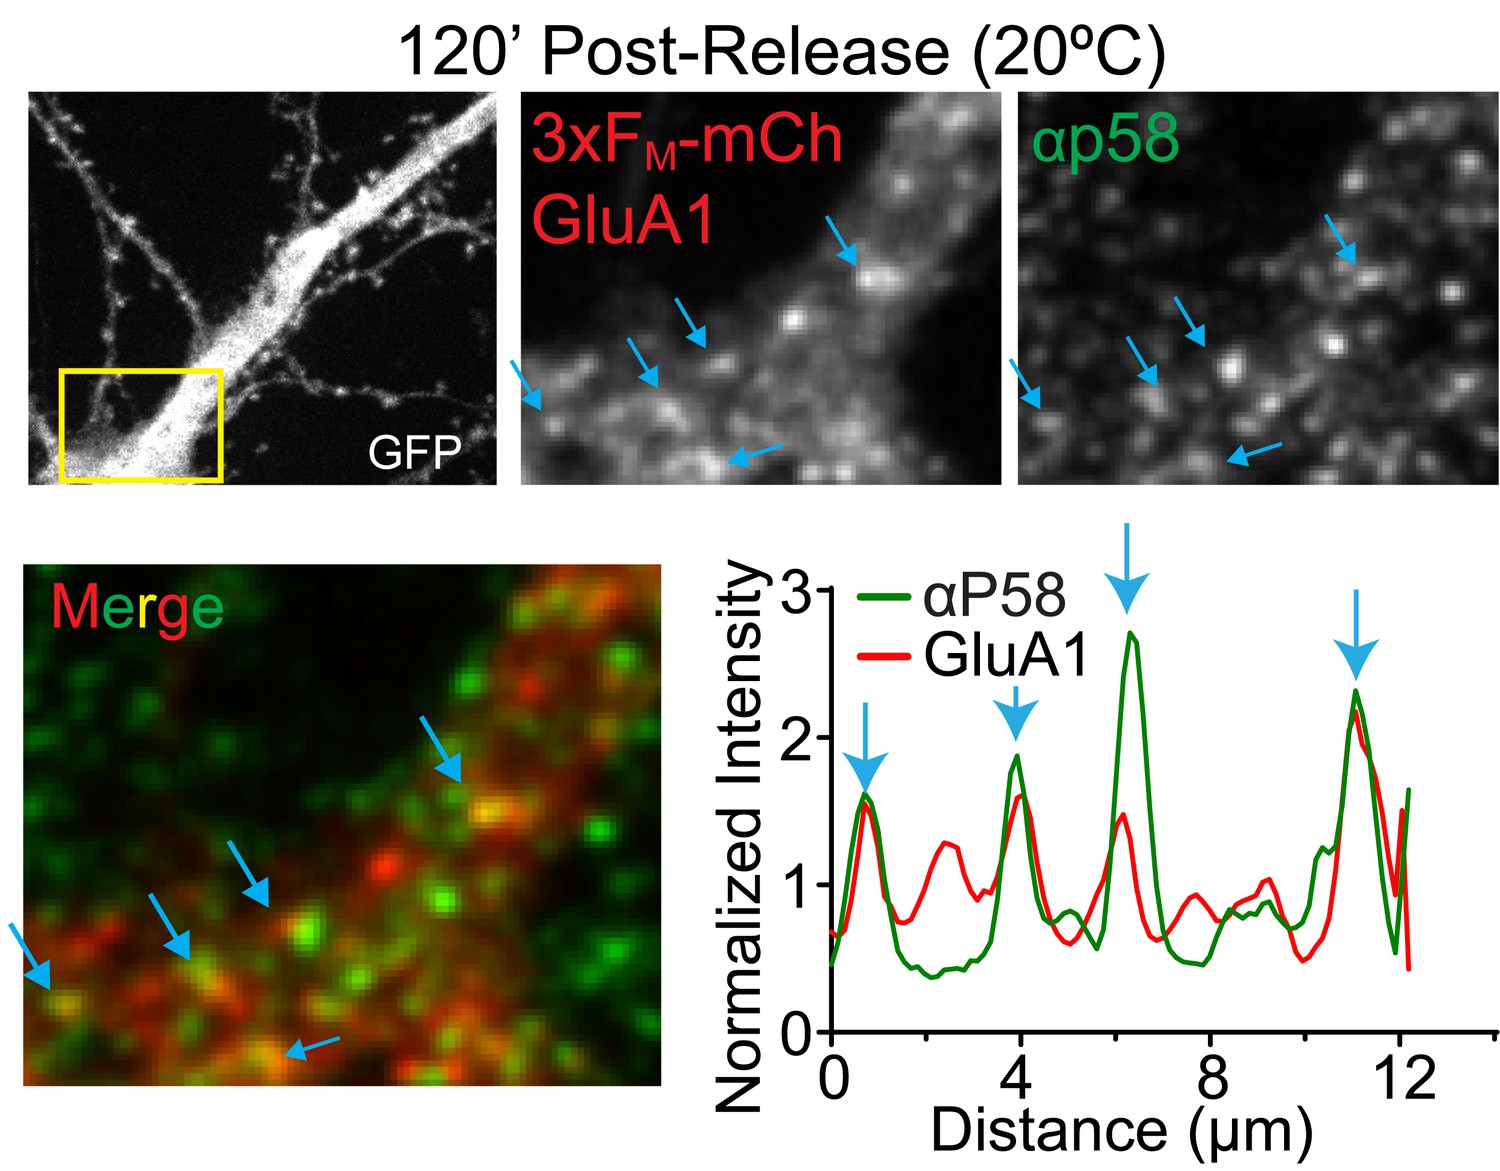
Colocalization between trafficking GluA1 and an endogenous ERGIC marker.
Staining for the endogenous ERGIC protein p58 in a neuron expressing 3xFM-mCh-GluA1 120 min after ER-release at 20°C. Blue arrows highlight the same set of colocalized puncta in the images and in the intensity profile.
Figure 4—figure supplement 4
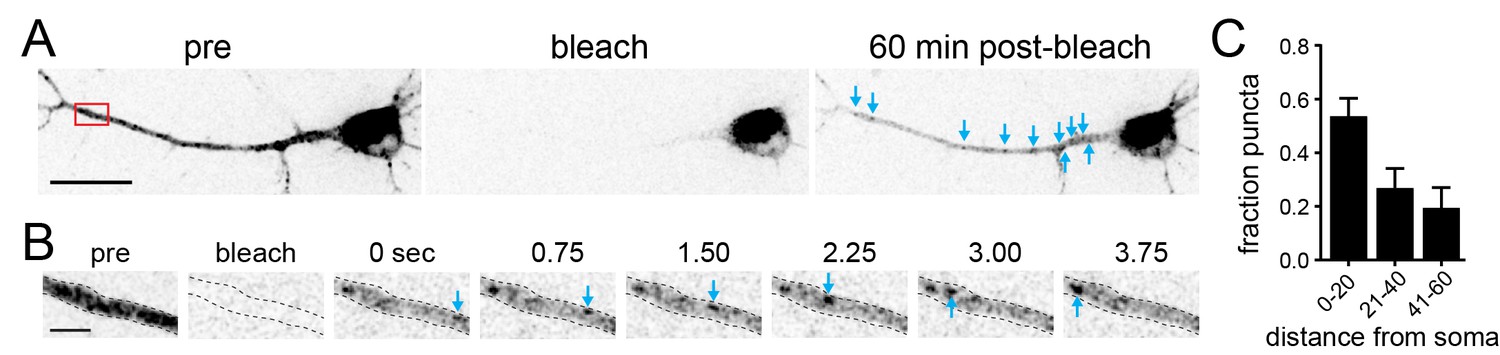
Post-GA transport from the soma to dendrites.
(A) Shown is a dissociated cortical neuron expressing 3xFM-mCh-GluA1 that had been allowed to accumulate in the GA and dendritic ERGICs for 60 min immediately before (left) immediately following (middle) and 1 hr following (right) targeted photobleaching of all detectable signal in the dendritic arbor. Images are displayed at high intensity so that the recovered dendritic signal 60 min post bleach (blue arrows) can be observed. Scale bar 30 µm. (B) Example of a mobile vesicle containing mCh-GluA1 that had entered the dendritic domain following photobleaching. Imaging series was initiated 1 hr post-photobleaching. Scale bar 5 µm. (C) Quantification of the fraction of dendritic puncta that appeared 1 hr following photobleaching. Data was compiled from 5 different neurons. The plot shows the normalized (fraction of total) number of stationary puncta in dendrites as a function of their distance (in µm) from the soma.
Figure 5 with 3 supplements

REs are located in close proximity to dendritic ERGICs.
(A) Shown is a section of dendrite from a cultured cortical neuron coexpressing GFP-ERGIC53 and TfR-mCh. Blue arrows indicate adjacent/overlapping puncta. Scale bar, 5 μm. (B) The coordinates of the maximum pixel intensity for identified TfR (red) and ERGIC53 (green) puncta are shown. The right panel displays an equally dense but randomized set of TfR coordinates. (C) Quantification of the percentage of ERGIC puncta that have at least one TfR punctum within 500 nm relative to a randomized data set with an equal density. (mean ± SEM, n = 8 neurons from 2 experiments *p=0.011 by unpaired two-tailed Student’s t-test). (D) The cumulative distribution of the minimum distance between each TfR-positive puncta and the nearest ERGIC puncta (***p<0.0001 Kolmogorov-Smirnov test). (E) Confocal (left pair) and STED (right pair) imaging of cortical neuron expressing TfR-mCh/ERGIC53-GFP stained with α-mCh (2° STAR580) and α-GFP (2° STAR635p). Scale bar, 5 μm. (F) Several examples showing TfR and ERGIC spatial coordination. White lines indicate location for intensity profiles plotted below. Intensity profiles were normalized to the maximum value under each line. The left panels show the confocal images for the first STED example for comparison. Scale bar, 400 nm.
Figure 5—figure supplement 1
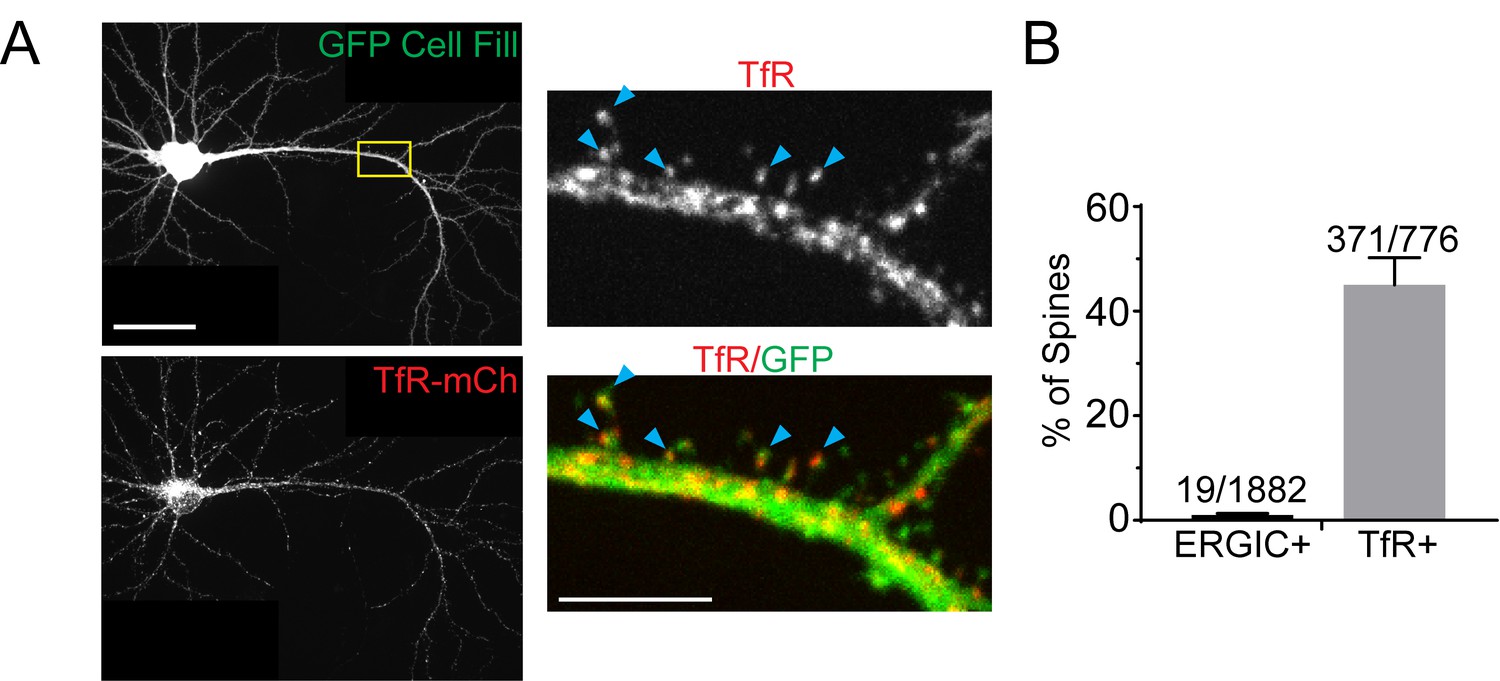
Spine and dendritic localization of REs.
(A) Neuron expressing GFP cell fill and TfR-mCh. Yellow box indicates inset on right. Blue arrowheads highlight spine recycling endosomes. Scale bar, 50 µm. Inset scale bar, 20 µm. (B) Quantification of the percent of spines containing ERGIC or TfR (mean ± SD, n = 5 neurons for ERGIC and 4 neurons for TfR, numbers on graph show raw numbers of spines containing ERGIC or RE signal vs the total number of spines analyzed).
Figure 5—figure supplement 2
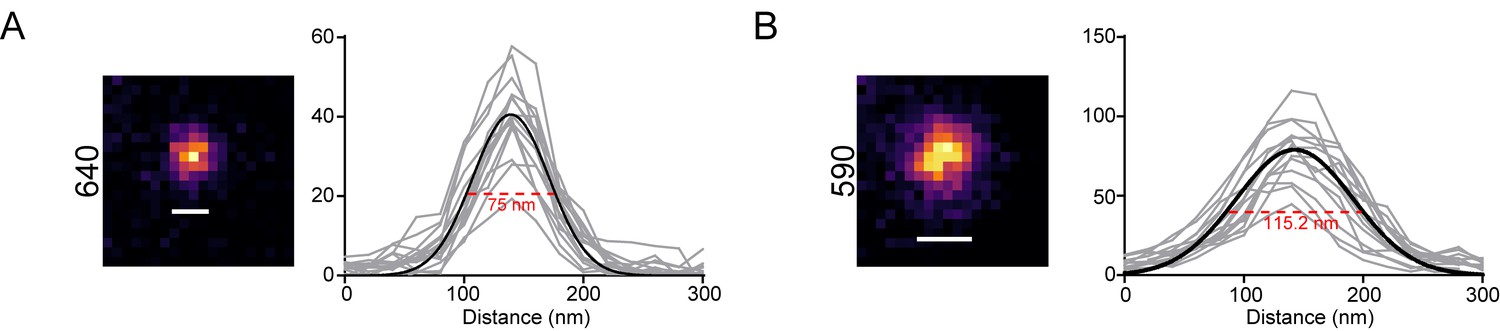
Characterization of STED FWHM.
(A) STED image of fluorescent beads in the 640 channel. Inset shows an individual bead relative to a bar showing the calculated full width at half maximum (FWHM). The plot shows Gaussian fit (black line) based on the intensity profiles (grey lines) of 15 individual beads. Red dotted line indicates FWHM. Resolution was derived from FWHM as described in the methods. (B) STED image of fluorescent beads in the 590 channel. Inset shows an individual bead relative to a bar showing the calculated FWHM. The plot shows Gaussian fit (black line) based on the intensity profiles (grey lines) of 15 individual beads. Red dotted line indicates FWHM. Resolution was derived from FWHM as described in the methods.
Figure 5—figure supplement 3
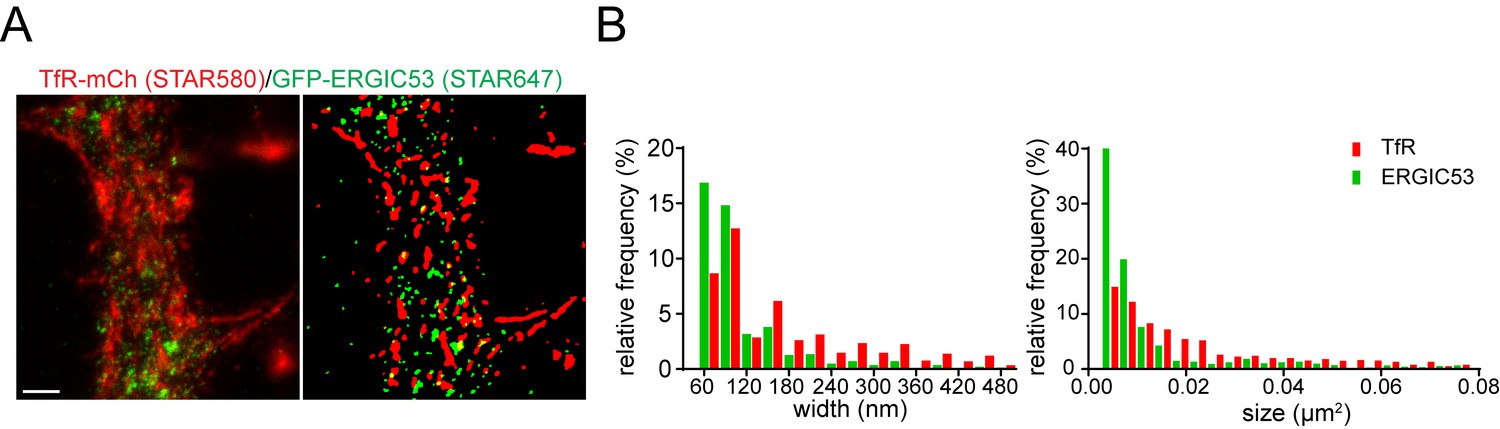
Segmentation analysis of organelle size from STED images.
(A) Left panel shows a STED image of a dendritic segment from a neuron expressing TfR-mCh and GFP-ERGIC53, stained with αmCh and αGFP and the indicated STAR dye conjugated secondary antibodies. Right panel shows segmentation of the image using Squassh (see experimental Materials and methods). Scale bar, 1 μm. (B) Histograms showing organelle width and area based on Squassh segmentation. The left histogram plots the distribution of ERGIC (green) and TfR (red) maximum widths. Similarly, the histogram to the right plots the distribution of organelle area.
Figure 6 with 4 supplements
Recycling endosomes mediate anterograde trafficking in dendrites.
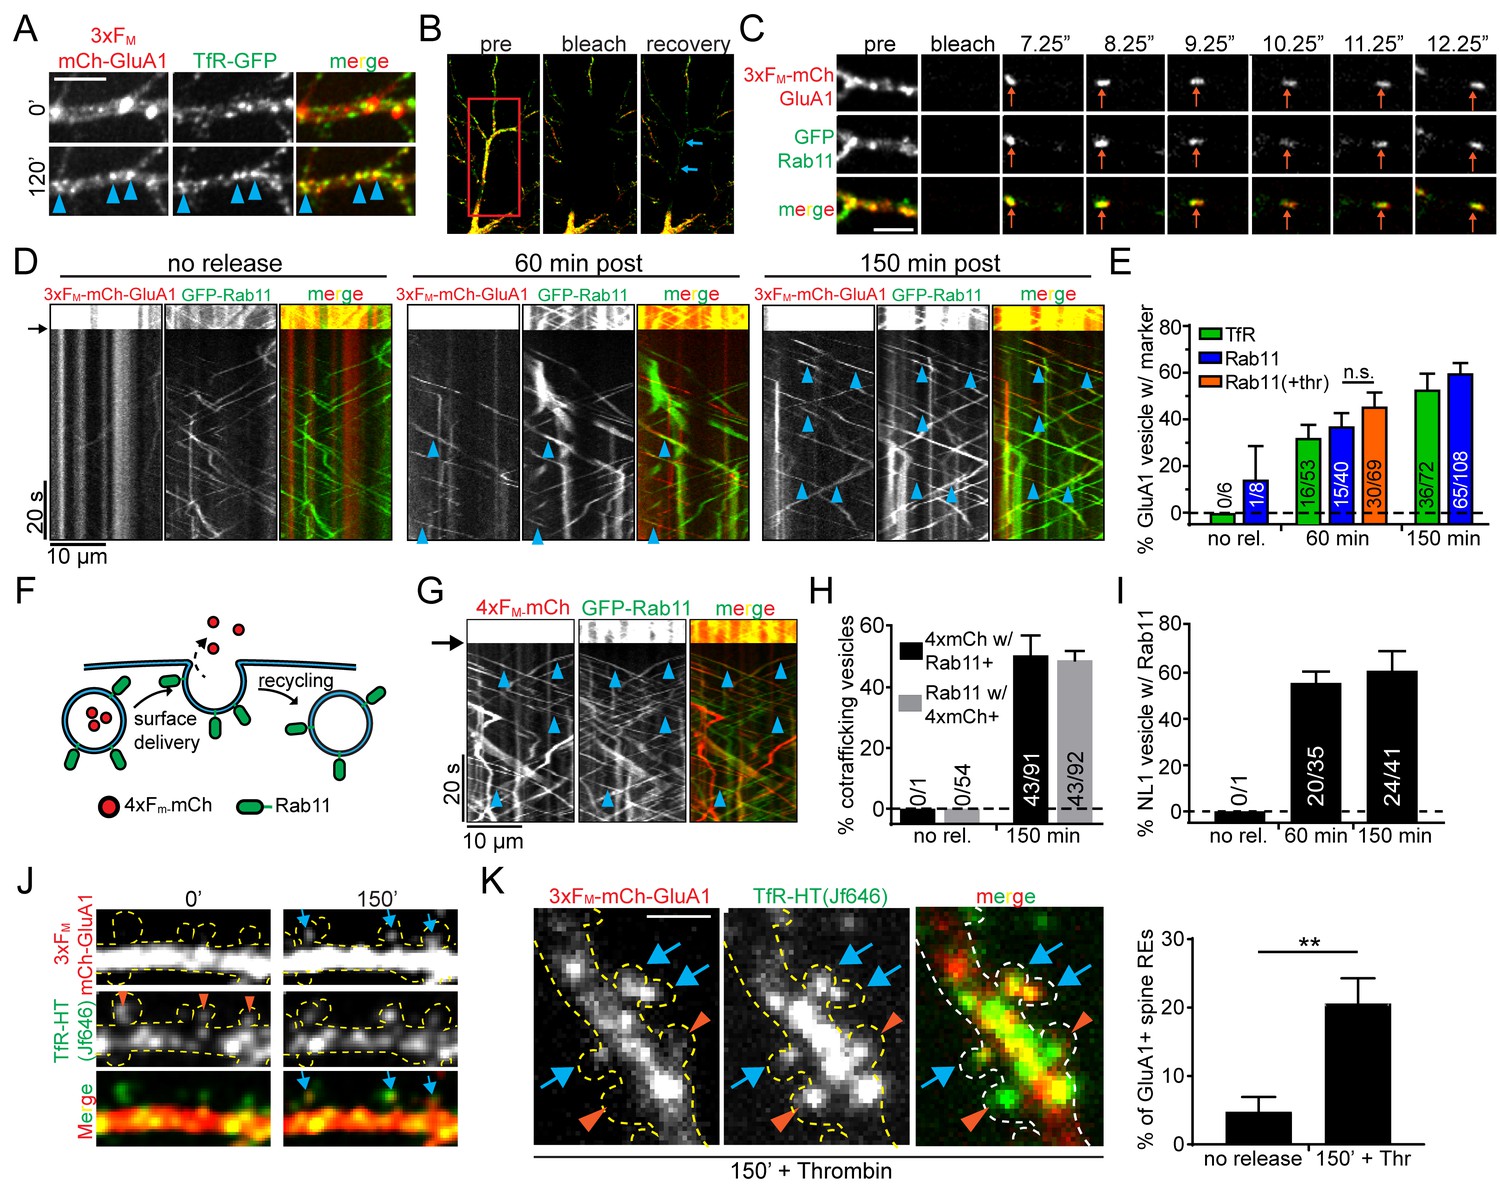
(A) Live-cell imaging of a cortical neuron expressing 3xFM-GluA1-mCh and TfR-GFP before ER-release (top panels) and 120 min after ER-release (bottom panels). Blue arrowheads indicate locations where GluA1 has redistributed to TfR-GFP positive endosomes. Scale bar, 10 µm. (B) Experimental paradigm to visualize individual vesicles trafficking in neurons expressing 3xFM-GluA1-mCh and a green RE marker (either GFP-Rab11 or TfR-GFP). The middle panel shows photobleaching of a dendritic segment (indicated by red square). The right panel is a frame taken 20 s after photobleaching showing endosomes entering the bleached area (blue arrows) Also see Videos 3 and 4. (C) Representative example of a mobile vesicle (orange arrows) associated with both Rab11 and 3xFM-GluA1. Individual frames are taken from 4 Hz dual-color imaging of a dendritic segment following photobleaching. Scale bar, 5 µm. (D) Kymographs of dendritic segments following photobleaching showing the movement of Rab11 and GluA1 vesicles at various times following 3xFM-mCh-GluA1 release from the ER. The amount of time elapsed between addition of DDS and imaging is indicated above the kymographs. The black arrow indicates the time of photobleaching. Blue arrowheads denote double-positive mobile vesicles. (E) Quantification of the percentage of GluA1 vesicles that also contain the indicated RE marker. The orange bar (+Thr) indicates the inclusion of 1 U/ml thrombin along with DDS. (mean ± SEM, n = 6–8 neurons/timepoint/marker from 3 experiments per marker; 2 independent experiments for thrombin n.s. p=0.31 by unpaired two-tailed Student’s t-test). Numbers on each bar indicate the raw number of double-positive vesicles/total GluA1 vesicles. (F) Schematic of soluble anterograde trafficking marker (4xFM-mCh). During vesicle exocytosis, the soluble marker is released from the cell and therefore cannot be recycled. (G) Kymographs showing cotrafficking between anterograde soluble marker (4xFM-mCh) and GFP-Rab11 within a segment of dendrite 150 min after DDS addition. Blue arrowheads highlight individual cotrafficking vesicles. (H) Quantification of the percentage of vesicles cotrafficking Rab11 and 4xFM-mCh before and 150 min after ER-release (mean ± SEM, no rel. n = 5 neurons; 150 minutes n = 8 neurons from 2 experiments). (I) Quantification of cotrafficking between NL1 and Rab11. Numbers on bars indicate raw numbers of vesicles positive for both markers divided by the total number positive for NL1 (mean ± SEM, n = 5–6 neurons/condition from 2 experiments). (J) GluA1 accumulates in a subset of spine endosomes following ER release. Shown is a stretch of dendrite from a neuron expressing 3xFM-mCh-GluA1 along with TfR-HaloTag labeled with JF646 before and 150 min following addition of DDS. Orange arrowheads denote spines containing REs. Blue arrows indicate accumulation of GluA1 in spine-resident REs. Dotted yellow outline drawn based on GFP cell fill (not shown). (K) Images are of a neuron coexpressing 3xFM-mCh-GluA1 and TfR-HaloTag (JF646) fixed 150 min after addition of DDS in the presence of thrombin (1 U/ml) to prevent visualization of recycled proteins. As in F, blue arrows highlight spine REs that contain trafficking GluA1. Orange arrowheads indicate GluA1-negative spine REs. The right panel is the quantification of the percentage of spines with REs that also contain GluA1 before and 150’ after release in the presence of thrombin. (mean ± SEM, n = 5 neurons/condition from 2 experiments, **p=0.006 unpaired two-tailed Student’s t-test.) Scale bar, 2 μm.
Figure 6—figure supplement 1
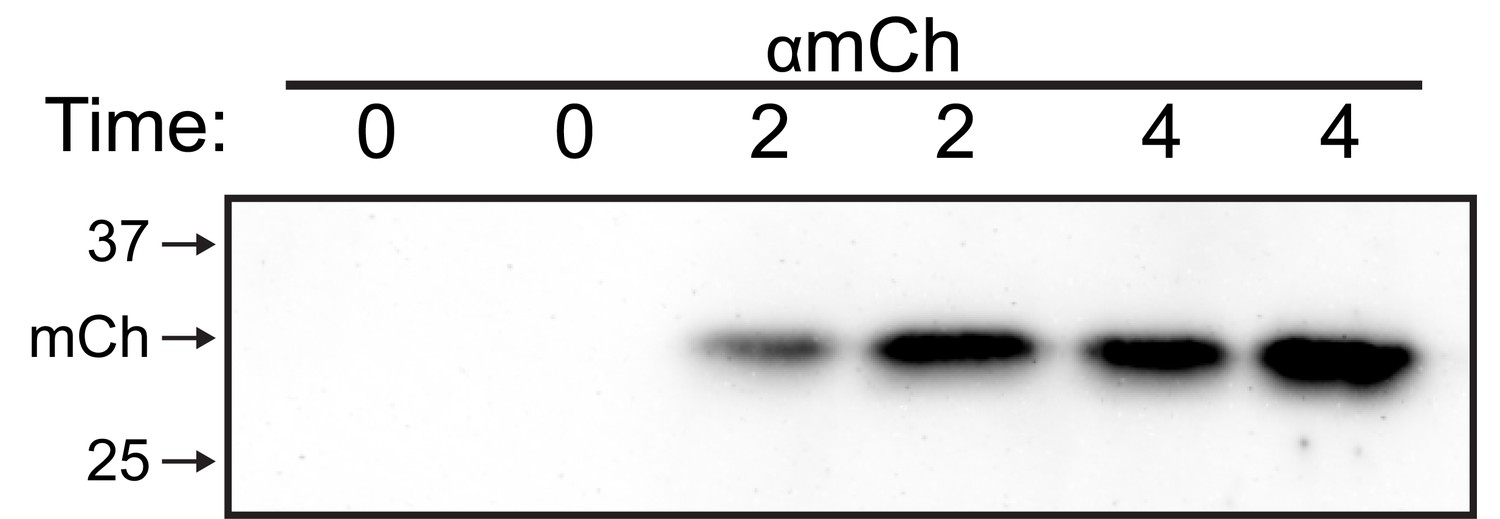
Verification of soluble anterograde trafficking marker.
Immunoblot of supernatant from COS7 cells expressing 4xFM-mCh collected at the indicated time after addition of DDS and probed with αmCh.
Figure 6—figure supplement 2
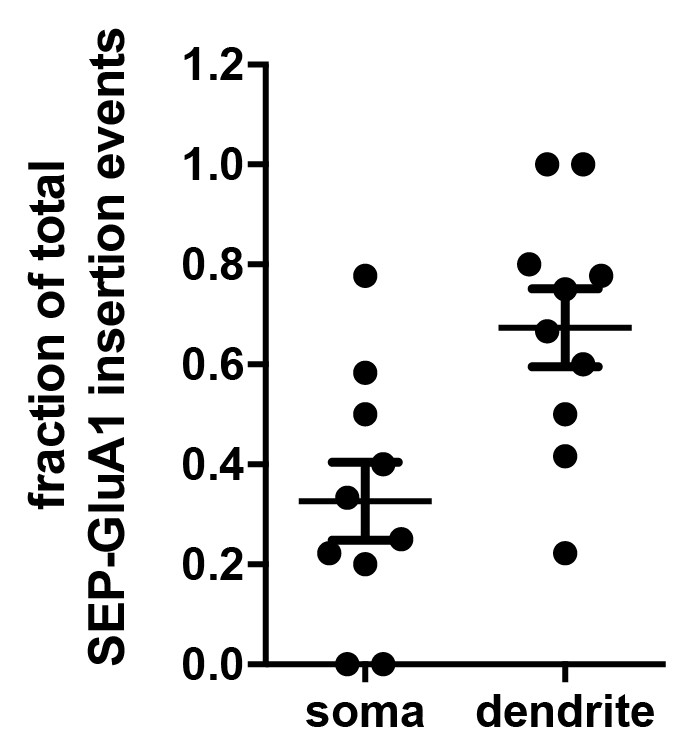
Fraction of GluA1 insertion events in the soma and dendrites.
Dissociated neurons expressing 3xFM-SEP-GluA1 were imaged at 3 Hz in 2 min time window 150 min following ER release to visulize the cellular location (dendrites vs. soma) of SEP-GluA1 PM insertion events. The experiment was carried out in the presence of extracellular thrombin (which removes SEP) to avoid visualization of recycled receptors. The scatter plot shows the relative fraction of events that occurred in either the dendritic arbor or the soma (67 events from 10 different neurons).
Figure 6—figure supplement 3
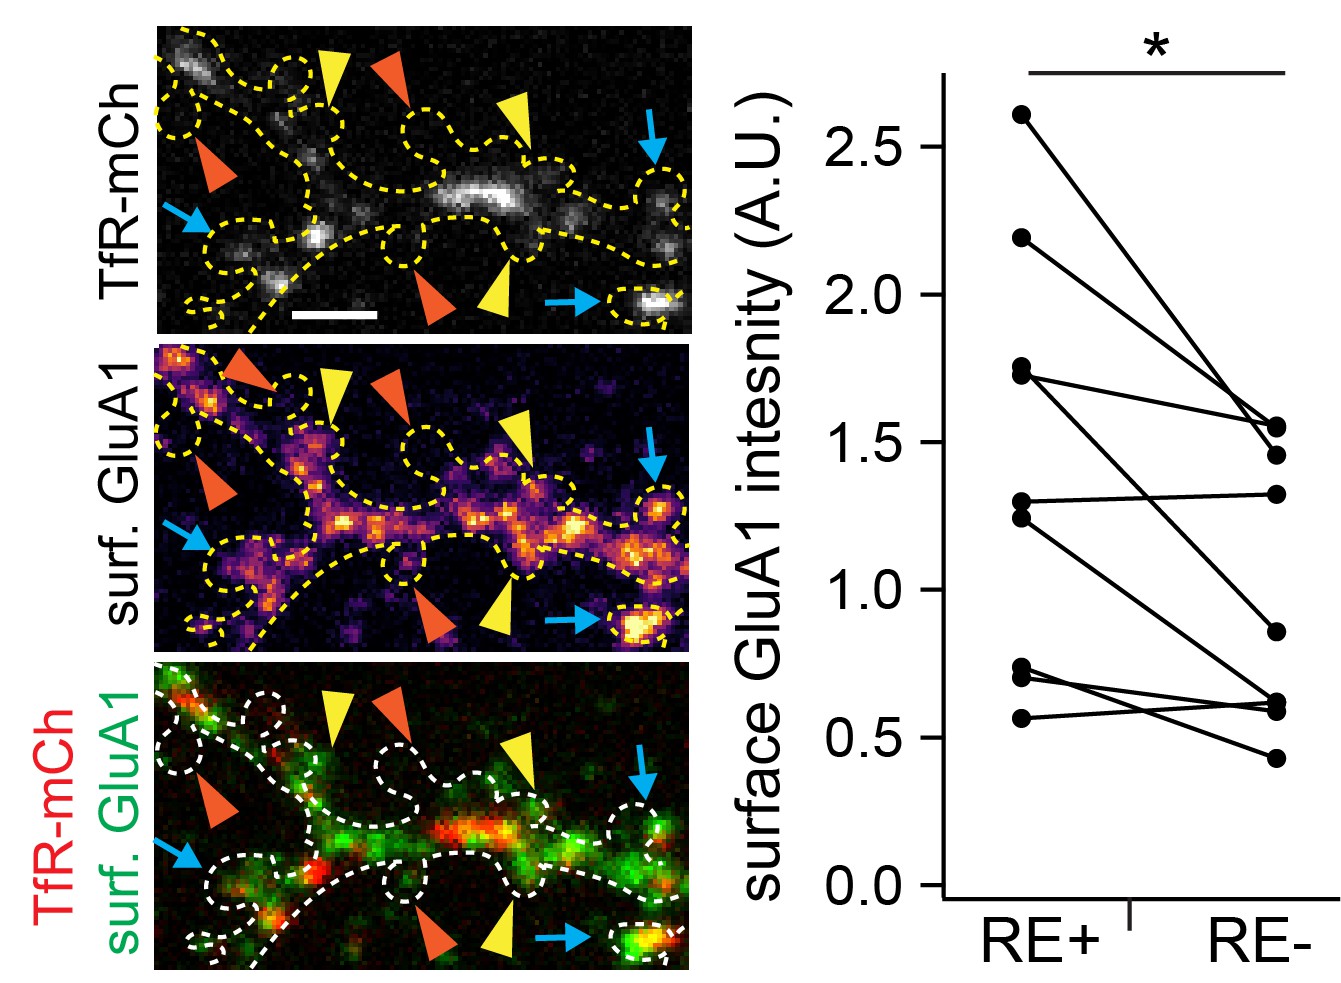
Surface GluA1 is increased at spines with REs compared to neighboring RE-negative spines.
Shown is a dendritic segment of a cultured cortical neuron expressing TfR-mCh (top panel) along with 3x-FM-GluA1 and surface labeled for GluA1 (middle panel) using an HA epitope tag engineered into its N-terminus. Surface labeling was performed 120 min following ER release. The outline of the cell was drawn based on a GFP cell fill (not shown). The blue arrows denote spines with REs and detectable surface GluA1 signal, the yellow arrowheads denote spines without REs with detectable surface GluA1 signal and the orange arrowheads denote spines without REs without detectable surface GluA1 signal. The plot to the right displays the paired surface GluA1 signal for RE-positive vs. size-matched (±25% of the mean size of RE-containing spine size) neighboring RE-negative spines on the same dendritic arbor. Data were normalized to the mean level of surface GluA1 at RE-negative spines. Compiled data is from 200 spines from 9 neurons and two independent experiments. *p=0.017 using a paired (comparing surface GluA1 on RE positive vs. negative spines on the same dendritic arbors) Student’s t-test. Scale bar 2 µm.
Figure 6—figure supplement 4
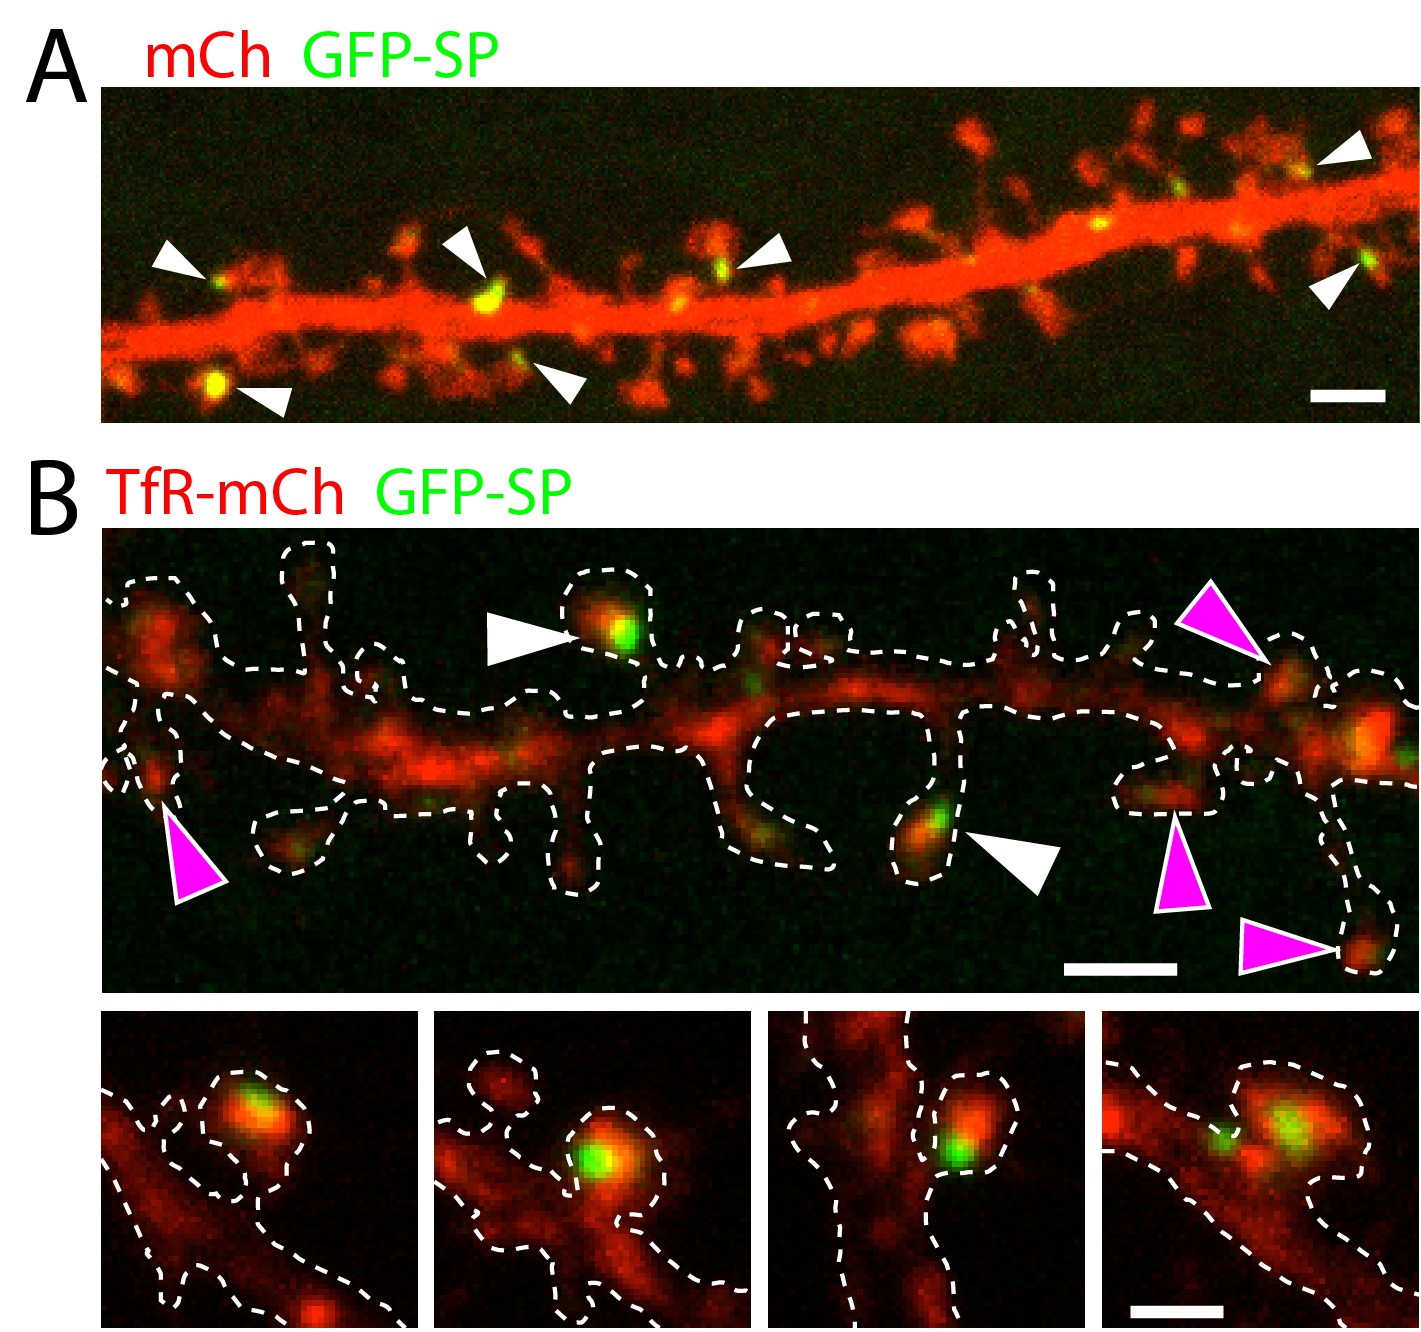
Relationship between the spine apparatus and REs.
(A) Shown is a dendritic segment from a cultured neuron expressing mCh along with GFP-SP to label the spine apparatus. Note the punctate appearance of GFP-SP in a subset of dendritic spines (white arrowheads). Scale bar, 3 µm. (B) Shown is a dendritic segment from a cultured neuron expressing TfR-mCh to label REs along with GFP-SP. Examples of spines containing REs (marked by TfR-mCh) and GFP-SP are marked with white arrowheads. While nearly every (97 ± 3%, 554 RE-containing spines analyzed from 4 neurons) spine with detectable GFP-SP also contained RE signal, not all RE-containing spines were positive for GFP-SP (magenta arrowheads). Several examples of RE/SP-positive spines are shown in the bottom panels. Scale bar, top panel 3 µm, bottom panels 2 µm.
Figure 7
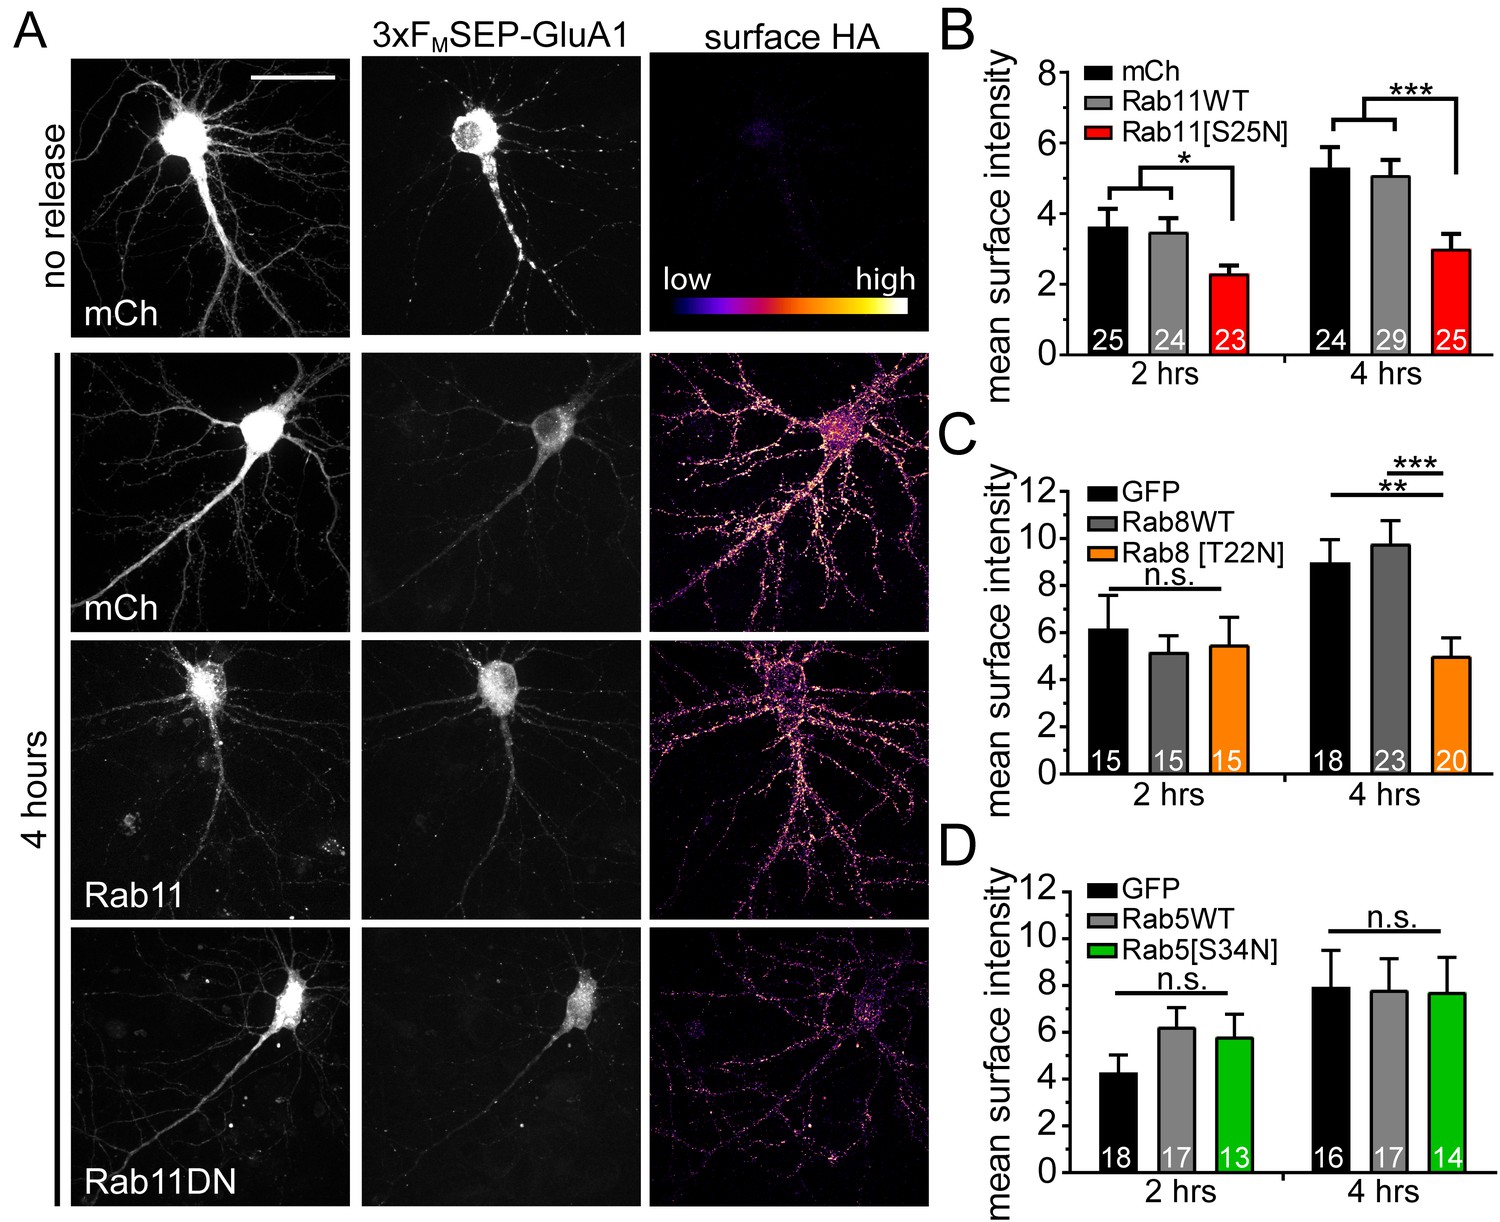
Disrupting recycling endosomes, but not early endosome function, inhibits surface GluA1 delivery.
(A) Surface delivery of 3xFM-SEP-GluA1 two or four hours after addition of DDS in cells co-expressing mCh, mCh-Rab11WT or mCh-Rab11DN. Scale bar, 50 μm. (B) Quantification of mean surface GluA1 intensity (assayed by surface staining for HA-epitope as in A) for Rab11-variant expressing neurons (mean ± SEM, n = number of neurons displayed on bars from 4 independent experiments, *p=0.0239 (mCh) and 0.0129 (Rab11WT) at 2 hr; *** p 0.0021 (mCh) 0.0012 (Rab11WT) at 4 hr by unpaired two-tailed Student’s t-test; error bars represent SEM). All values were normalized to the no release condition. (C) Quantification of mean surface GluA1 intensity (assayed by surface staining for HA-epitope as in A) for Rab8-variant expressing neurons (mean ± SEM, n = number of neurons displayed on bars from 3 independent experiments, **p=0.0026, ***p=0.0006, n.s. = not significant by unpaired two-tailed Student’s t-test; error bars represent SEM). All values were normalized to the no-release condition. (D) Surface delivery of GluA1 in neurons co-expressing GFP, GFP-Rab5WT or GFP-Rab5DN (mean ± SEM, n values displayed on bars from 3 independent experiments, n.s. by unpaired two-tailed Student’s t-test). All values were normalized to the no-release condition.
Figure 8 with 4 supplements
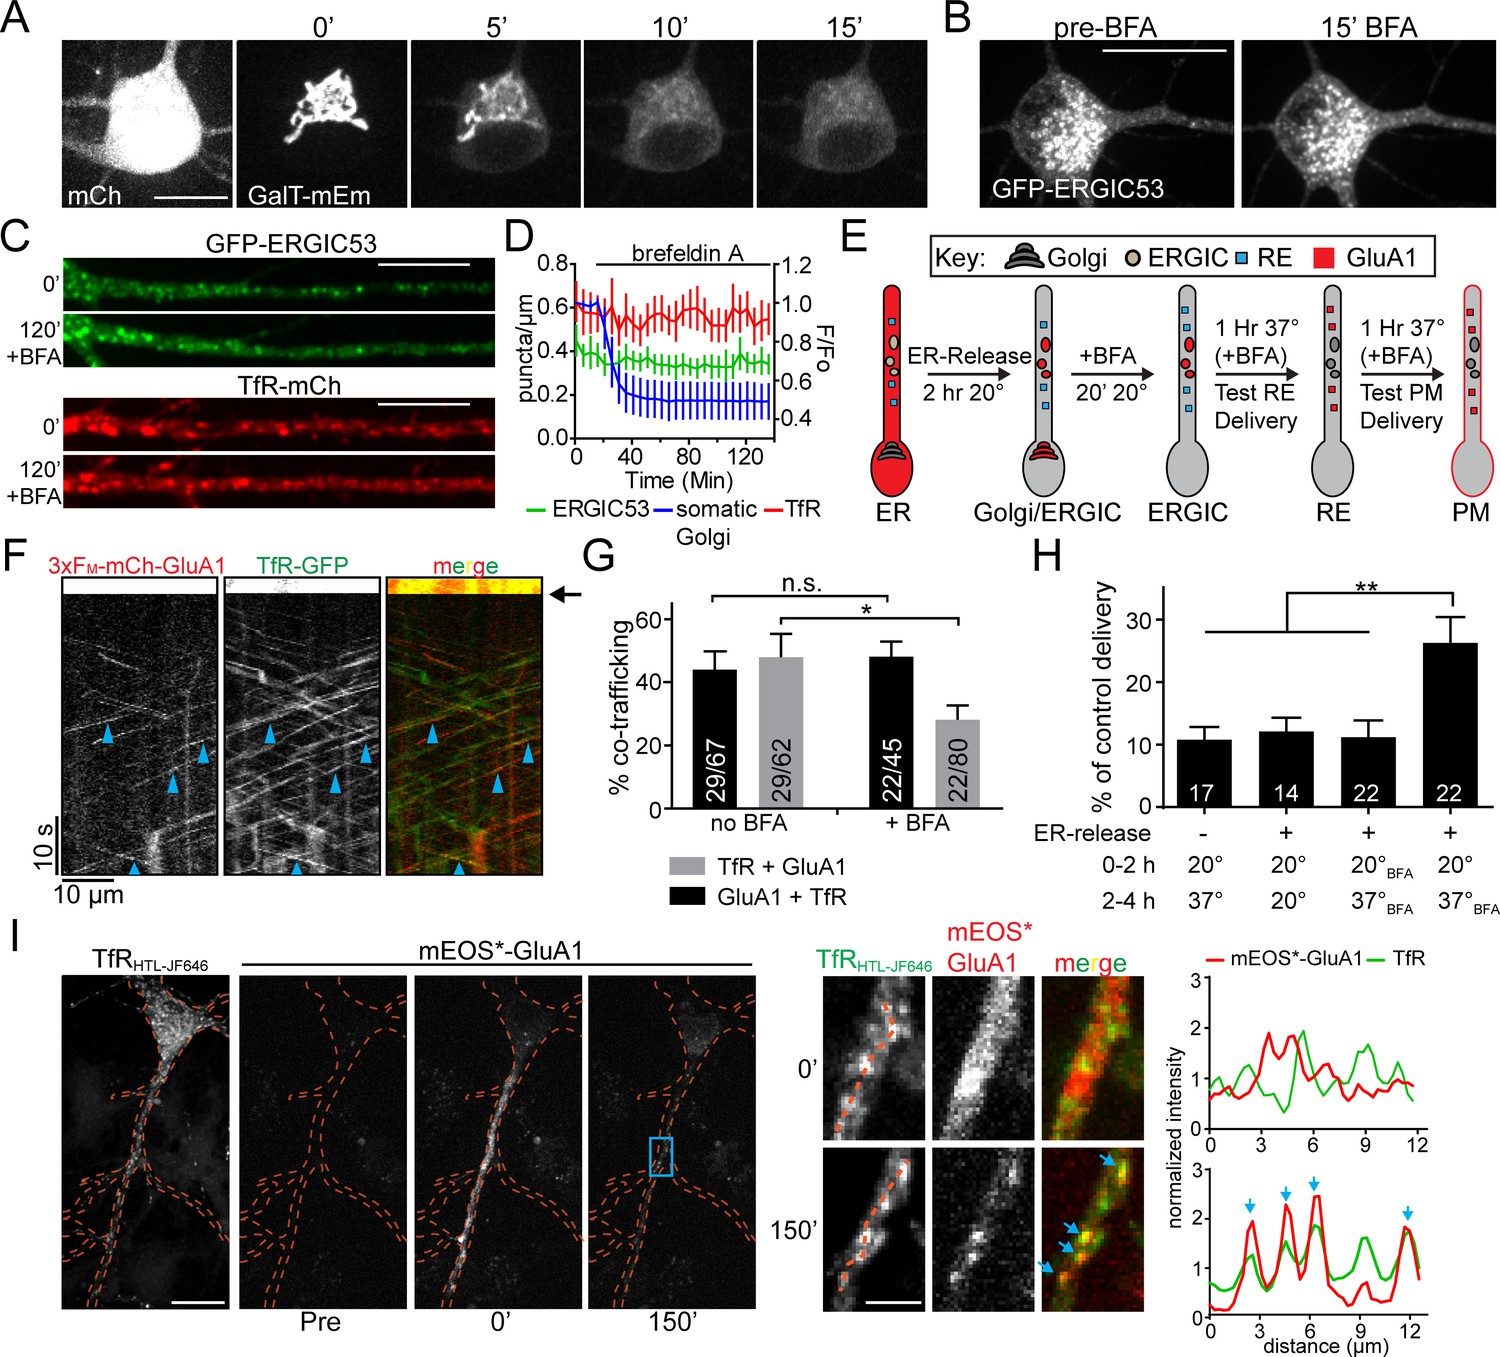
Golgi-independent trafficking of GluA1 in dendrites.
(A) The Golgi apparatus (labelled with galactosyl-transferase fused to mEmerald) rapidly disperses upon BFA (5 μg/ml) application. Scale bar, 15 µm. (B) Distribution of somatic GFP-ERGIC53 before and 15 min after application of BFA. Scale bar, 25 µm. (C) Dendritic segments from neurons expressing GFP-ERGIC53 (top pair) or TfR-mCh (bottom pair) before and 120’ after the application of BFA. Scale bar, 15 µm. Dendrites computationally straightened in ImageJ. (D) Quantification of the number of TfR (red) and ERGIC53 (green) puncta after treatment with BFA (mean ± SEM, n = 7 neurons from 2 independent experiments) plotted on the left axis. The dispersal of fluorescent signal from the somatic Golgi is plotted on the right axis normalized to the pre-BFA value (blue, mean ± SEM, n = 5 neurons from 2 independent experiments). (E) Schematic of the experimental design to investigate Golgi-independent trafficking. Organelle distribution of GluA1 is highlighted in red. Before ER-release, GluA1 is distributed throughout the ER (ER). 2 hr after addition of DDS at 20°C GluA1 accumulates in the dendritic ERGIC and somatic Golgi compartments (ERGIC/Golgi). Addition of BFA disrupts the somatic Golgi, but leaves dendritic ERGIC intact (ERGIC). Cells are returned to 37°C and after a 1 hr incubation, RE-localization is assessed (panels F,G). 2 hr after returning to 37°C, cells are surface labeled to assess membrane delivery (panel H). (F) Shown is a kymograph from a dendritic segment showing cotrafficking between mCh-GluA1 and TfR-GFP in the presence of BFA, 60 min following return to 37 ˚C. (see ‘RE’ panel in diagram from 8E). Black arrow denotes timing of the bleach. Blue arrowheads indicate cotrafficking vesicles. (G) Quantification of cotrafficking between GluA1 vesicles and TfR signal (black bars) and TfR vesicles and GluA1 signal (grey bars) after application of BFA (mean ± SEM, n = 5–6 neurons/condition from 3 experiments, *p=0.041 and n.s. p=0.59 based on unpaired two-tailed Student’s t-test). Numbers on each bar indicate the total number of vesicles. (H) Surface delivery of GluA1 occurs when the GA is disrupted. Surface GluA1 was measured in cells incubated at 20 ˚C, then shifted to 37 ˚C without DDS; cells treated with DDS but maintained at 20 ˚C; cells treated with BFA prior to DDS addition; or cells treated with DDS at 20 ˚C to allow ER release, followed by BFA treatment and 37 ˚C incubation. Values are reported as a percentage of maximal delivery that occurs in neurons treated with DDS, but not treated with BFA; control condition n = 25 neurons. The number of neurons measured for each experimental condition are displayed on the bar graph from 2 independent experiments (values are reported as mean ± SEM; ** p 0.0077, 0.0043 and 0.007 respectively (left to right) by unpaired two-tailed Student’s t-test.). (I) Cortical neuron coexpressing TfR-HaloTag(JF646) and 3xFM-mEOS3.2-GluA1 before (pre) and immediately after dendritic photoconversion (0’) as well as 150 min after addition of DDS. Expanded images (from blue rectangle) showing dendritic mEOS*-GluA1 and TfR-HT localization before and 150 min following ER release are shown to the right. The intensity plots were generated using the dotted orange lines. Blue arrows indicate the overlapping intensity peaks present in both the mEOS*-GluA1 channel and in the TfR channel. Scale bar, 20 μm; Inset scale bar, 5 μm.
Figure 8—figure supplement 1
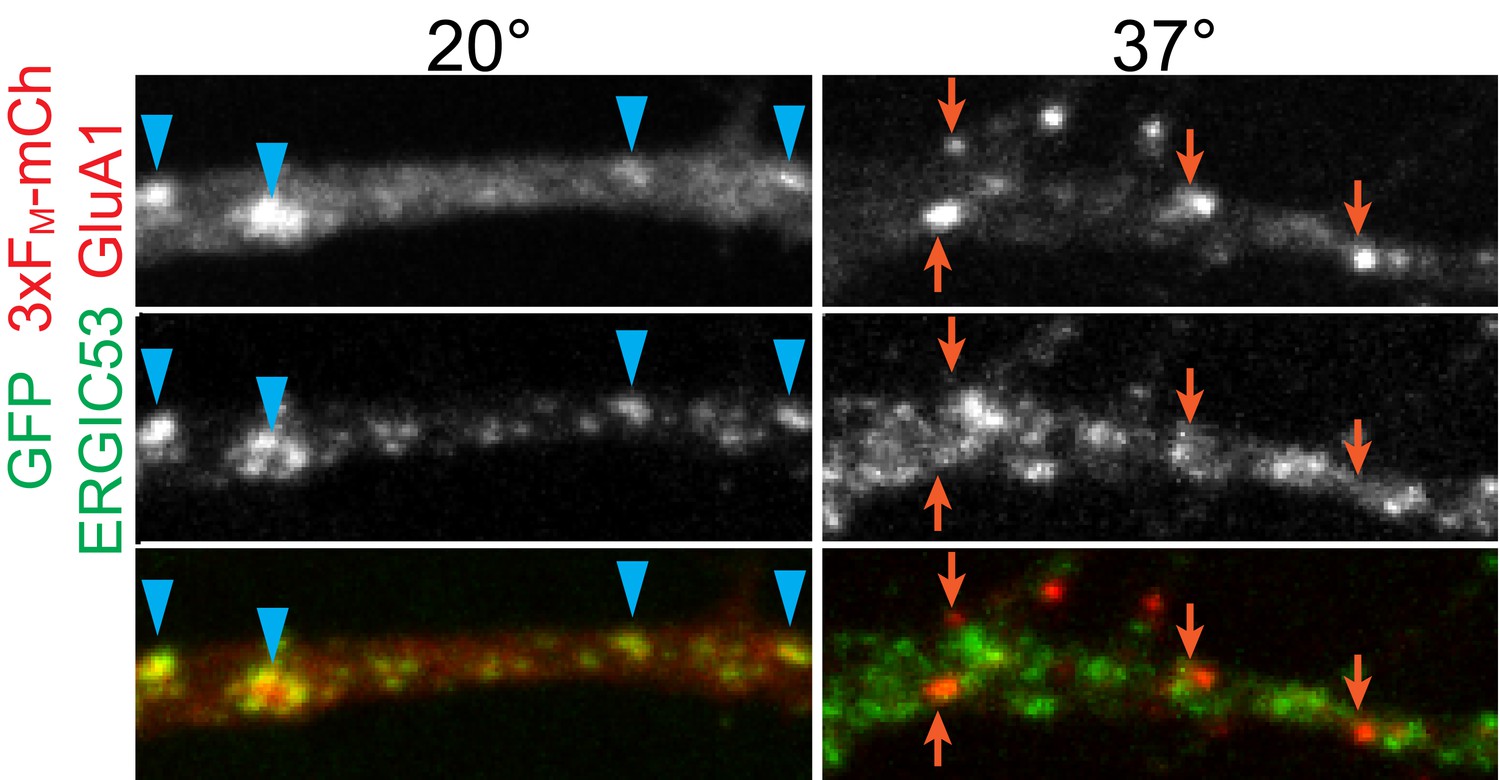
Temperature sensitivity of GluA1 trafficking through ERGIC.
Neurons expressing 3xFM-mCh-GluA1 and GFP-ERGIC53 were incubated at either 20°C or 37°C for 4 hr after addition of DDS and fixed. Blue arrowheads highlight overlap between GluA1 and ERGIC53 signals while orange arrows indicate GluA1 puncta that are not ERGIC53 positive.
Figure 8—figure supplement 2
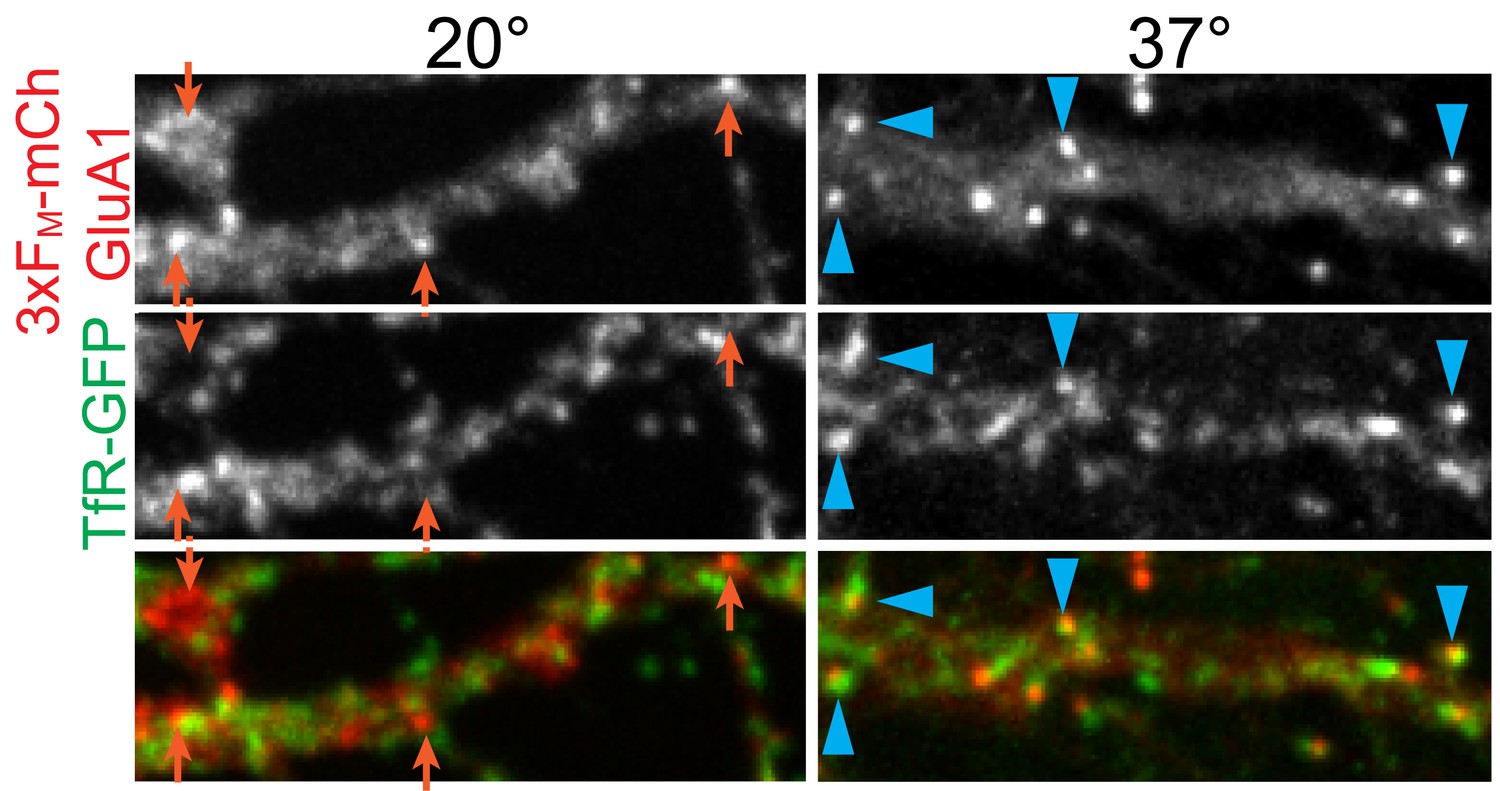
Temperature sensitivity of GluA1 entry into recycling endosomes.
Neurons expressing 3xFM-mCh-GluA1 and TfR-GFP were incubated at either 20°C or 37°C for 4 hr after addition of DDS and fixed. Blue arrowheads highlight overlap between GluA1 and TfR signals while orange arrows indicate GluA1 puncta that are not TfR positive.
Figure 8—figure supplement 3
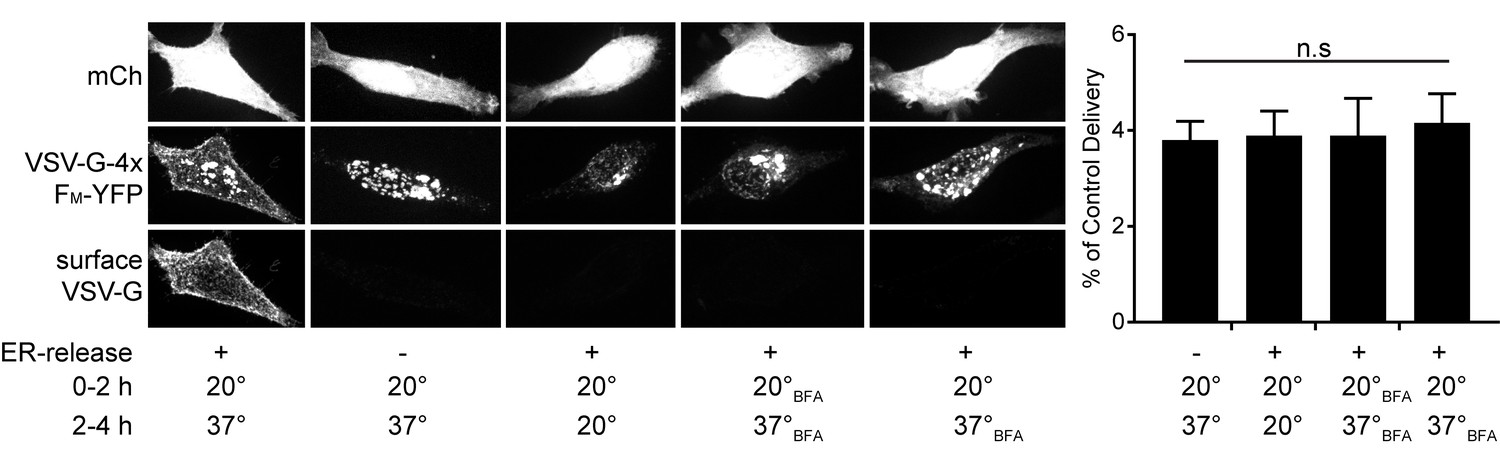
BFA sensitivity of surface trafficking in HeLa cells.
Surface delivery of VSV-G-YFP-4xFM in HeLa cells after various combinations of temperature and BFA treatment. Experimental conditions are indicated under the images and are the same as in Figure 8E. The right panel shows the quantification of surface labelling for VSV-G in each of the conditions on the left. Surface intensity expressed as a percentage of control (left panel in HeLa images). Values are reported as mean relative to control ± SEM (n = 20 cells/condition from 2 experiments; n.s. = not significant by unpaired two-tailed Student’s t-test).
Figure 8—figure supplement 4

BFA sensitivity of VSV-G and NL1 surface trafficking in cortical neurons.
Surface delivery of VSV-G-YFP-4xFM (left) and 4xFM-mCh-NL1 (right) was measured in dissociated cortical neurons after various combinations of temperature and BFA treatment. Experimental conditions are indicated under the bars and are the same as in Figure 8E. Surface intensity is expressed as a percentage of control (37 ˚C, no BFA) surface delivery. Values are reported as mean relative to control ± SEM (n = 5–8 cells/condition, n.s. = not significant by one way ANOVA/Bonferonni post hoc test). Both NL1 and VSV-G experiments were independently repeated with similar results.
Figure 9
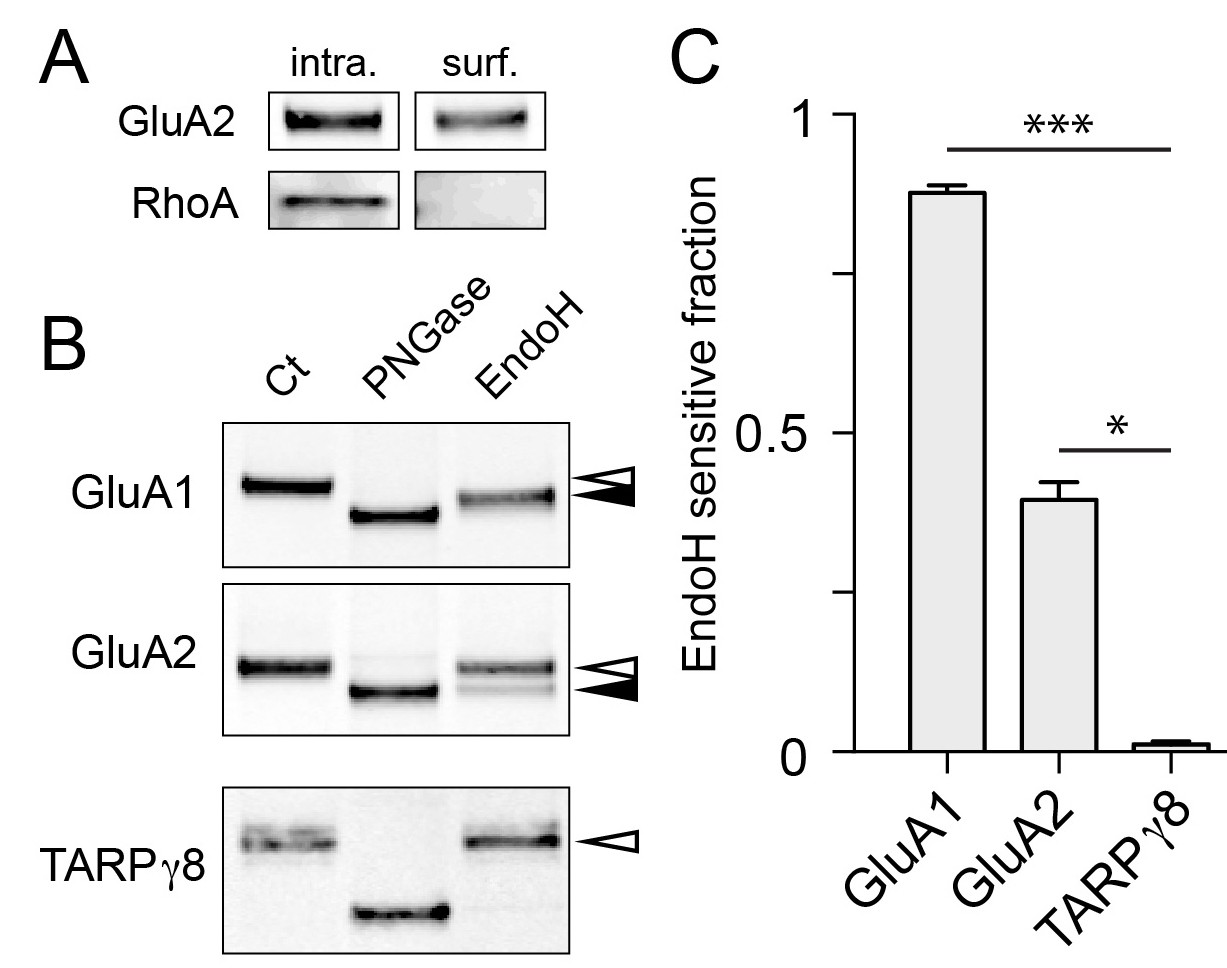
Surface AMPA receptor subunits display immature glycosylation.
(A) Control experiment for surface biotinylation. Shown are immunoblots against a surface AMPA receptor (GluA2) and a cytosolic protein (RhoA) following surface biotinylation and purification over streptavidin. Note the exclusion of RhoA from the surface fraction confirming the integrity of the cells during surface biotinylation. (B) Surface AMPA receptors are sensitive to endoH. Shown are immunoblots against surface GluA1 (top), GluA2 (middle), and TARPγ8 (bottom). Purified biotinylated surface fractions were either untreated (first lane) or treated with either PNGase (middle lane) or endoH (third lane). Note the mobility shift of endoH treated GluA1 and GluA2 but not TARPγ8. The black arrowheads denote the endoH-shifted species while the white arrowheads mark the mobility of the untreated native surface protein. (C) The fraction of endoH sensitive GluA1, GluA2 and TARPγ8 are plotted. Values are reported as mean ±SEM from 4, 5 and 4 independent experiments for GluA1, GluA2 and TARPγ8 respectively. *, p<0.05; ***, p<0.01, ANOVA and Dunn’s multicomparison test.
Figure 10
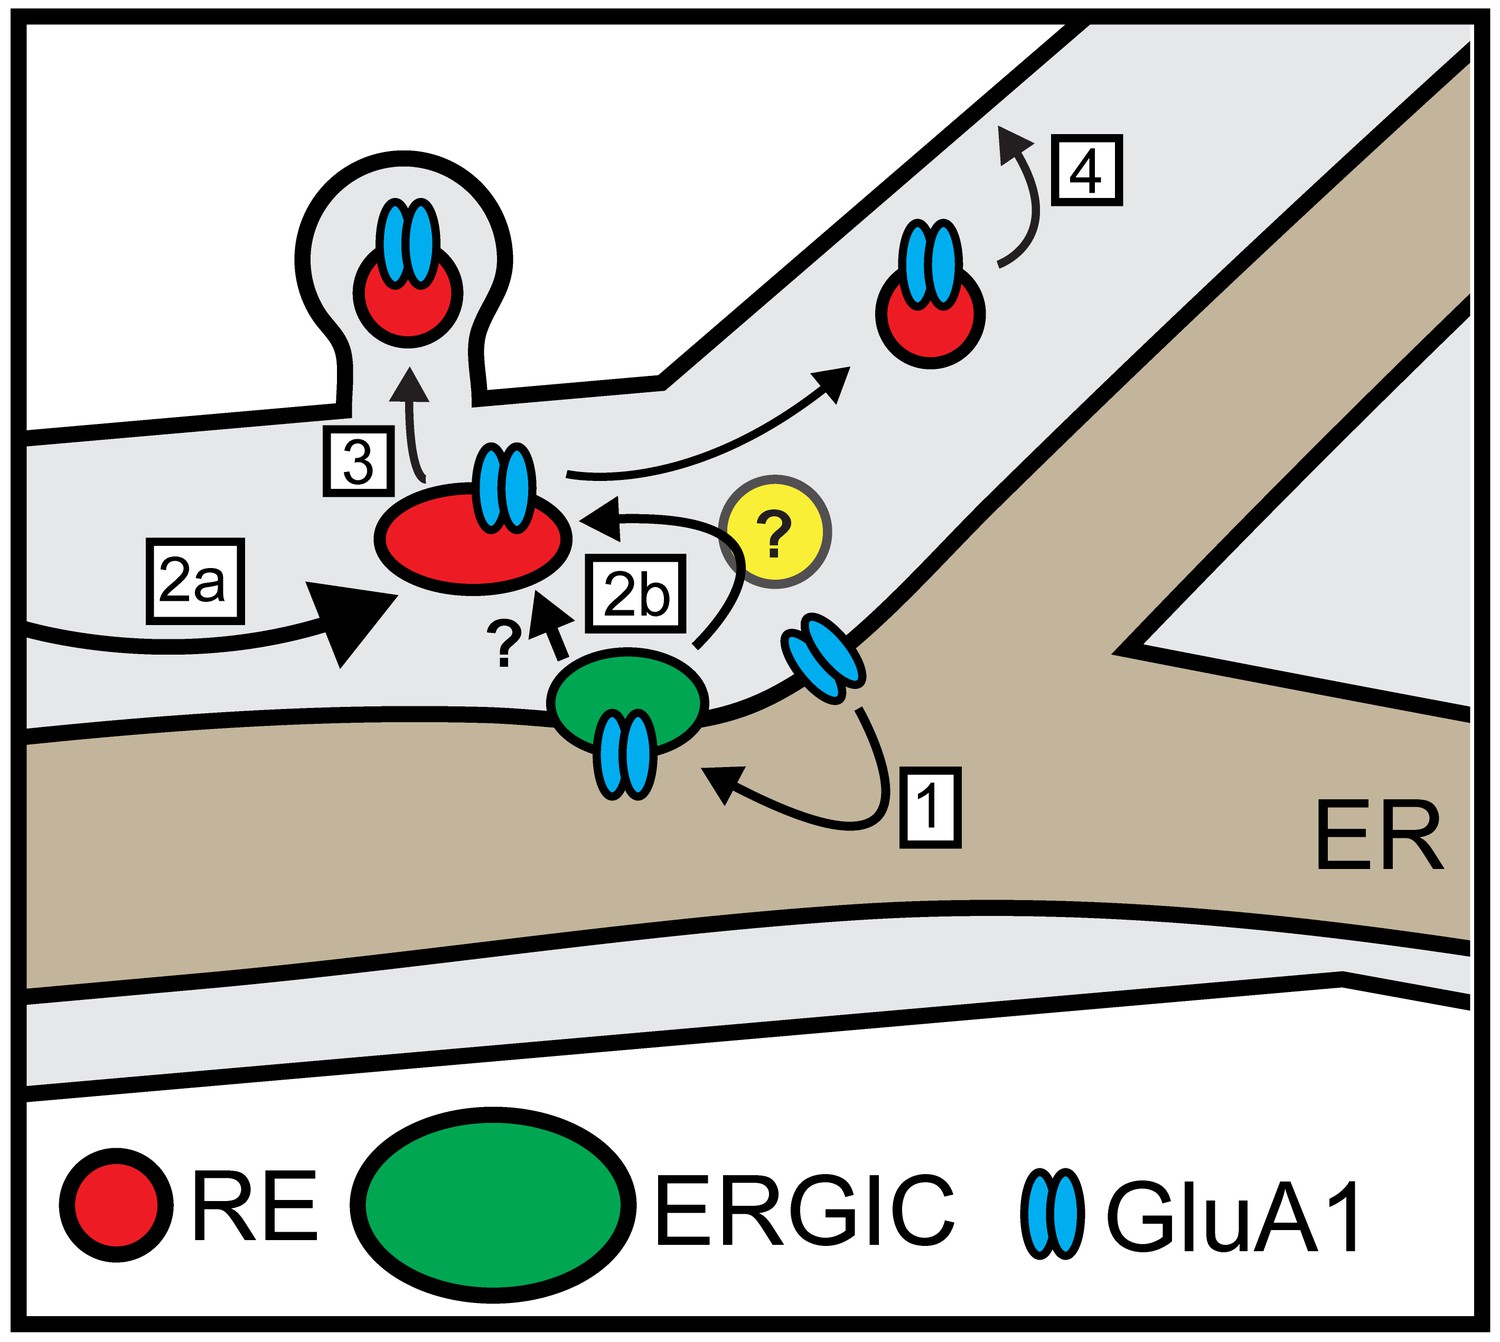
Model for local dendritic trafficking.
GluA1 exiting the dendritic ER undergoes local entry into nearby ERGIC (step 1). GluA1 subsequently enters the recycling compartment, either through direct ERGIC/RE coupling or through an unidentified intermediate organelle that does not contain conventional GA markers (yellow circle) (step 2b). Cargo can also enter REs through conventional post-GA trafficking that takes place in the soma, followed by long-range transport to dendrites (step 2a). In addition to mobile REs in the dendritic shaft, GluA1 is also directed to spine-resident REs (step 3). The RE compartment mediates a substantial fraction of surface delivery of GluA1 (step 4).
Videos
Video 1
Spatially restricted trafficking of mEOS-GluA1 photoconverted in the dendritic ER.
Shown is a cultured cortical neuron expressing 3xFM-mEOS3.2-GluA1. Left panel shows total GluA1 (green channel), middle panel shows photoconverted GluA1 (red channel) and right panel shows the merge. Focal photoconversion targeted to a segment of dendrite occurred between frames 1 and 2. DDS was added immediately after frame 2. Z-stacks were then acquired every 10 min. Scale bar, 20 μm.
Video 2
Spatially restricted trafficking of mEOS-GluA1 photoconverted in the somatic ER.
Same as Video 1 except photoconversion targeted the neuronal soma. Scale bar, 20 μm.
Photobleaching assay for tracking secretory cargo.
Photobleaching assay in a neuron expressing GFP-Rab11 and 3xFM-mCh-GluA1 150’ following ER release. Left panel shows GFP-Rab11, middle shows 3xFM-mCh-GluA1 and right shows the merge. Rapid (4 Hz), single plane imaging was carried out before and after photobleaching. Scale bar, 20 μm.
Video 4
Forward trafficking GluA1 accumulates in REs.
Zoomed in section of dendrite from the photobleaching assay shown in Figure 6 and Video 3. A high proportion of mobile vesicles harbored both GFP-Rab11 (green) and 3xFM-mCh-GluA1 (red) 150’ following ER release. Scale bar, 2 μm.
Additional files
-
Transparent reporting form
- https://doi.org/10.7554/eLife.27362.038
Download links
A two-part list of links to download the article, or parts of the article, in various formats.
Downloads (link to download the article as PDF)
Open citations (links to open the citations from this article in various online reference manager services)
Cite this article (links to download the citations from this article in formats compatible with various reference manager tools)
Golgi-independent secretory trafficking through recycling endosomes in neuronal dendrites and spines
eLife 6:e27362.
https://doi.org/10.7554/eLife.27362


