Asymmetric recognition of HIV-1 Envelope trimer by V1V2 loop-targeting antibodies
- California Institute of Technology, United States
- Beth Israel Deaconess Medical Center, United States
- The Rockefeller University, United States
Figures
Figure 1 with 1 supplement
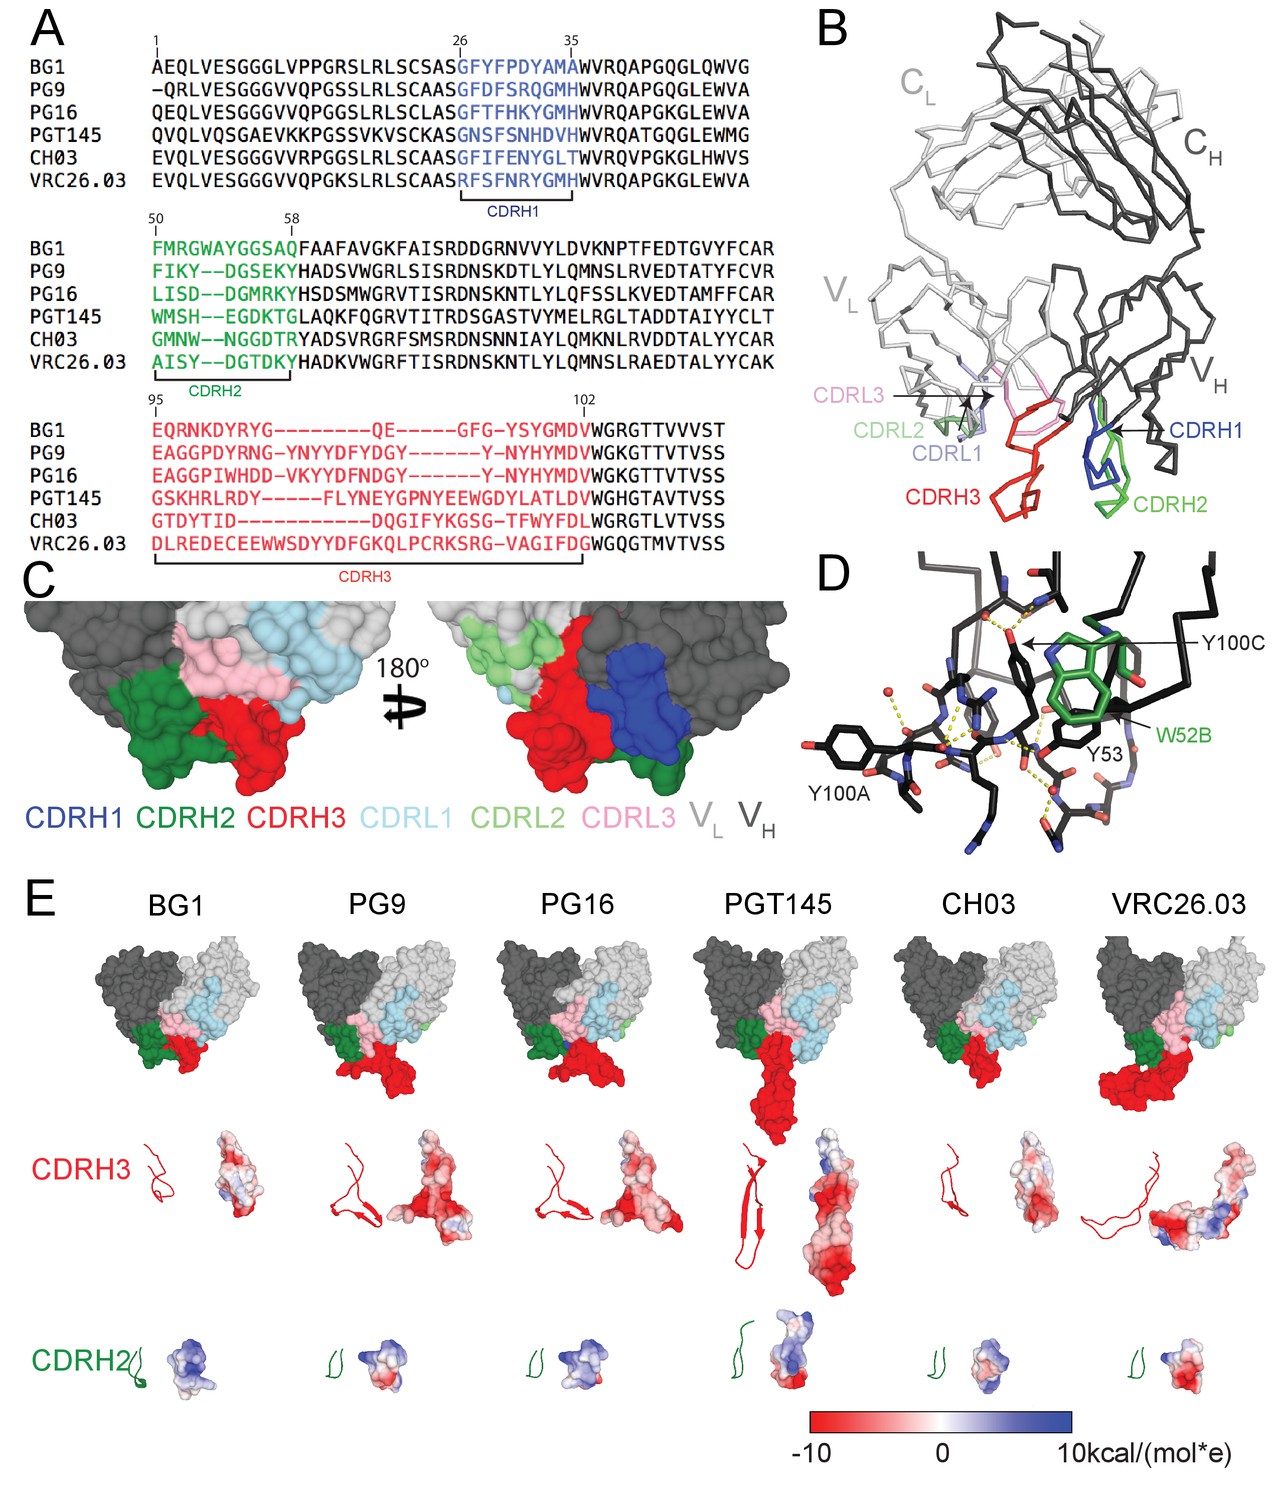
Comparison of BG1 and other V1V2 bNAbs.
(A) Sequences of the HCs of BG1 and representative other V1V2 bNAbs. Residue numbering (Kabat) refers to BG1, and the CDRs were defined using AbM (Swindells et al., 2017). (B) Crystal structure of BG1 Fab with highlighted CDRs. (C) Space-filling representations of antigen-binding site of BG1 in two orientations with CDRs highlighted. (D) Hydrogen bonds (dotted yellow lines) contributing to compact structure of CDRH3. Water molecules shown as red spheres. (E) Top: Space-filling representations of VH-VL domains of selected V1V2 bNAbs (BG1: this study; PG9: PDB 3U4E; PG16: PDB 3 MUG; PGT145: PDB 3U1S; CH03: PDB 5ESV; VRC26.03: PDB 4OD1). Residues within CDRs are highlighted. CDRH3 (middle) and CDRH2 (bottom) loops shown in ribbon (left) and space-filling (right) representations. Electrostatic potentials are shown on the space filling representations using blue and red for positive and negative electrostatic potentials, respectively.
Figure 1—figure supplement 1
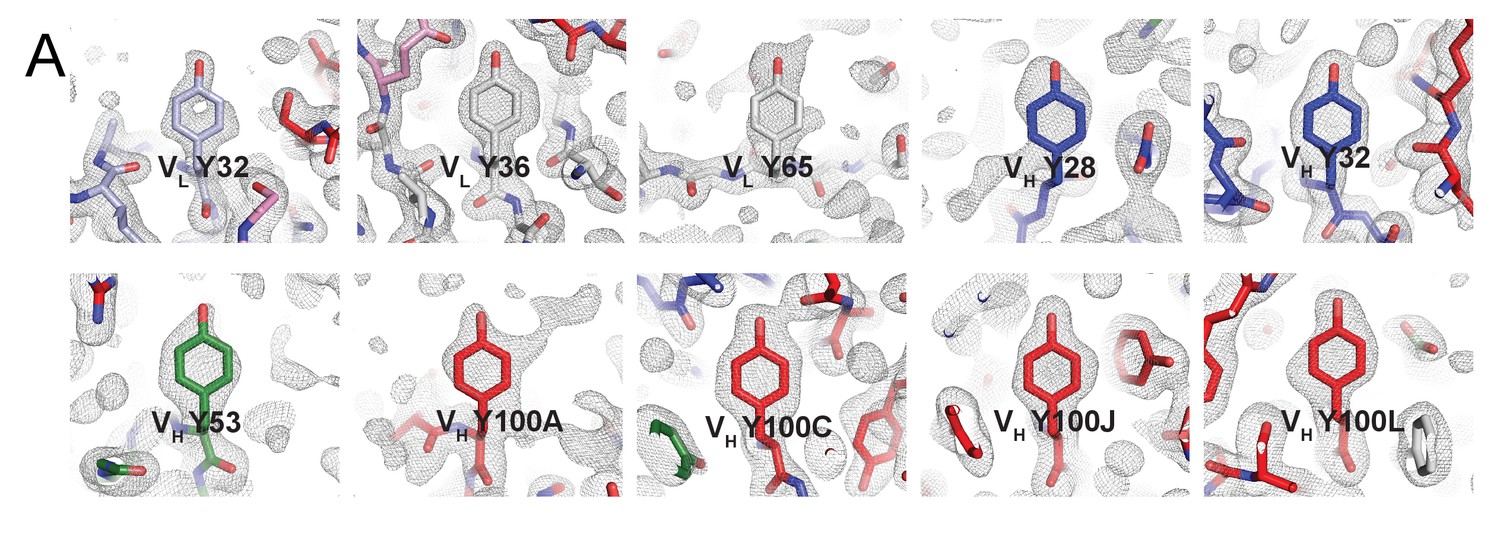
Electron densities for tyrosines within BG1 Fab CDRs.
(A) Tyrosine residues located within the antigen binding site are shown in stick representation together with their electron densities (contoured at 1.0 σ) from a 2Fo–Fc simulated annealing composite omit map.
Figure 2 with 1 supplement
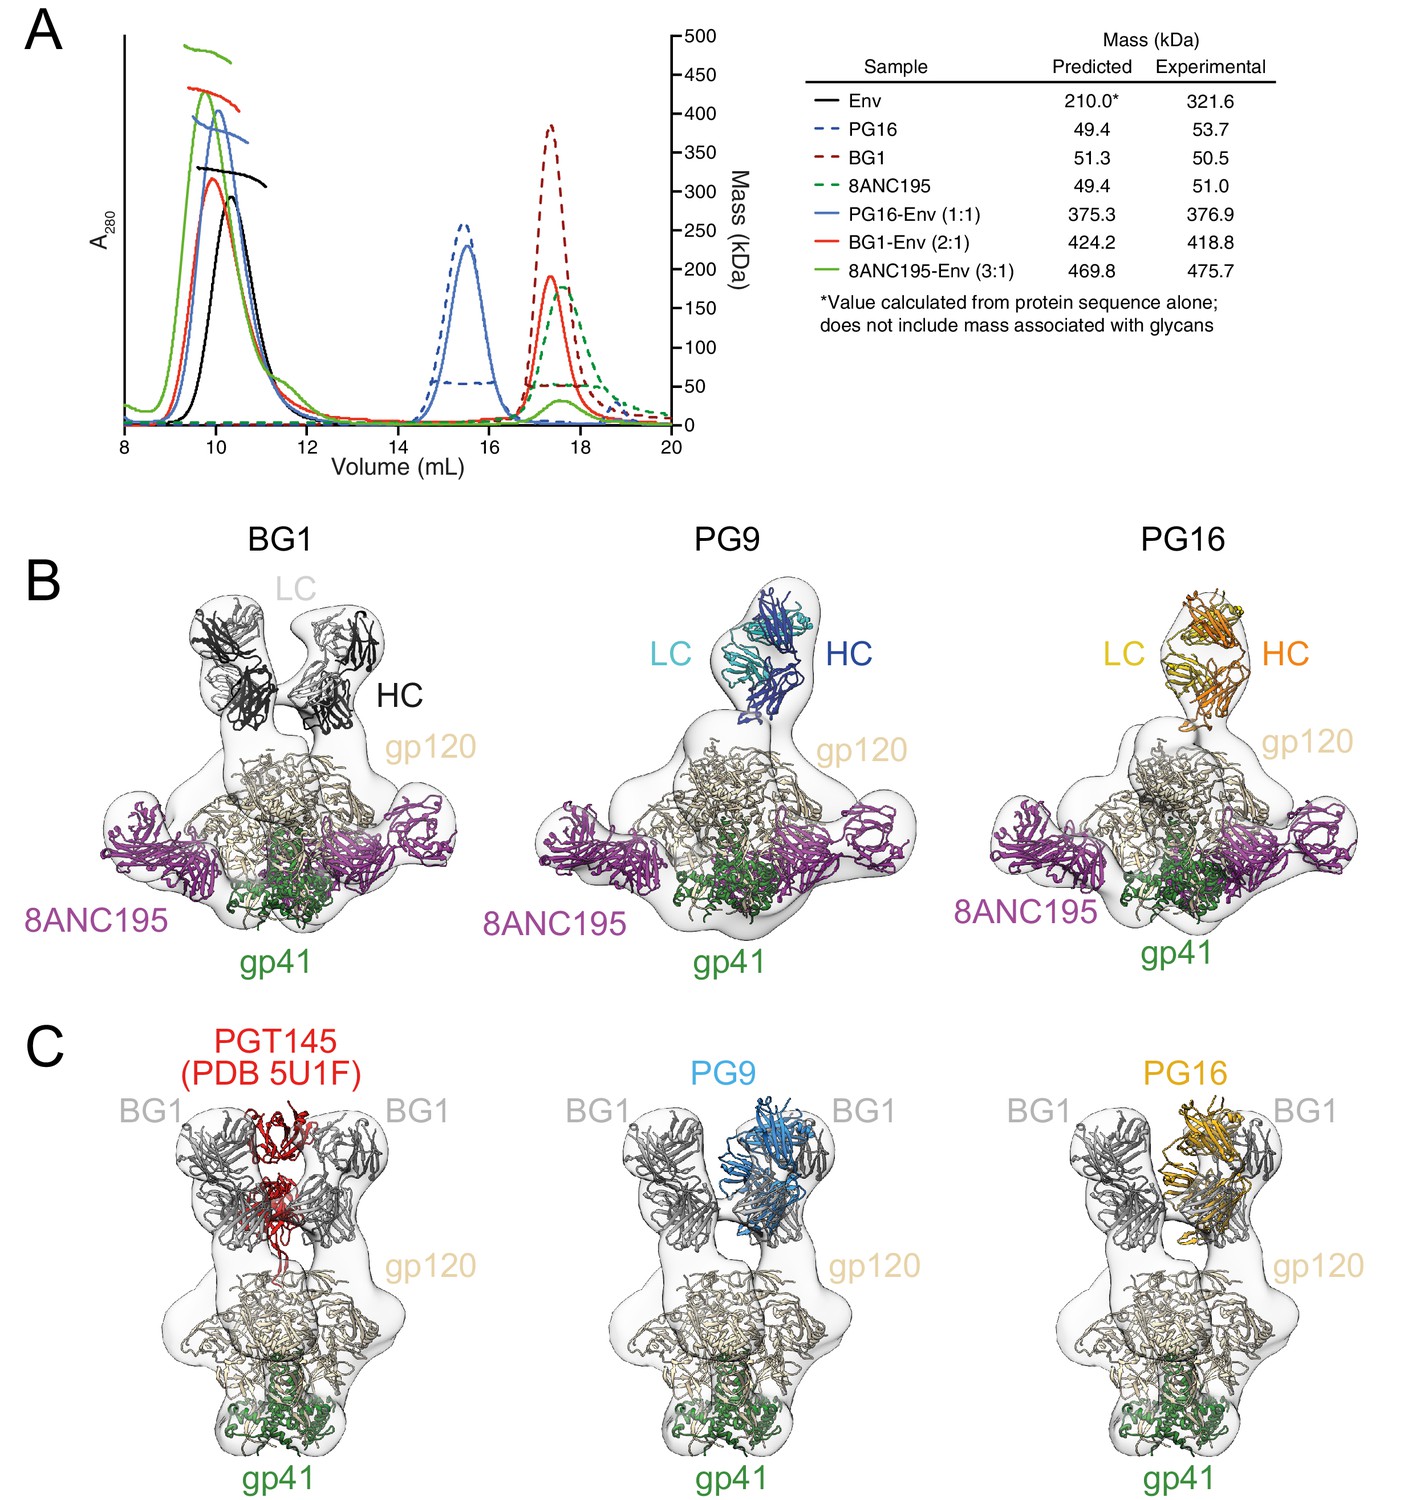
Fab-Env binding stoichiometries for V1V2 bNAbs.
(A) SEC-MALS profiles for BG505 SOSIP.664 Env trimer and complexes of Env trimer with BG1, PG16, and 8ANC195 Fabs. The absorbance at 280 nm (left y-axis) is plotted against elution volume from a Superdex 200 10/300 GL gel filtration column and overlaid with the molar mass determined for each peak (right y-axis). Predicted and calculated molecular masses are shown in the table. (B) Negative-stain single particle EM reconstructions BG1-Env-8ANC195, PG9-Env-8ANC195, and PG16-Env-8ANC195 complexes. EM density was fit with coordinates for the indicated Fabs and for BG505 Env trimer. (C) Density and coordinates from the BG1-Env portion of the BG1-Env-8ANC195 reconstruction (density for 8ANC195 Fabs removed) with coordinates for the indicated Fabs superimposed. The Env trimer portion from EM structures of complexes of PGT145-Env (PDB 5U1F), PG9-Env (panel B), or PG16-Env (panel B) were superimposed with the Env trimer portion of the BG1-Env-8ANC195 structure (panel B).
-
Figure 2—source data 1
Molar neutralization ratios (MNRs) for select bNAbs (MNR = [IC50 Fab (nM)/IC50 IgG (nM)].
The geometric mean MNR was calculated for each bNAb on a set of 25–30 HIV-1 strains with measured IC50s values for both Fab and IgG forms. The measure of variation of the MNRs across strains is the geometric standard deviation, which is the exponential of the standard deviation of the logarithms of the individual MNRs.
- https://doi.org/10.7554/eLife.27389.006
Figure 2—figure supplement 1
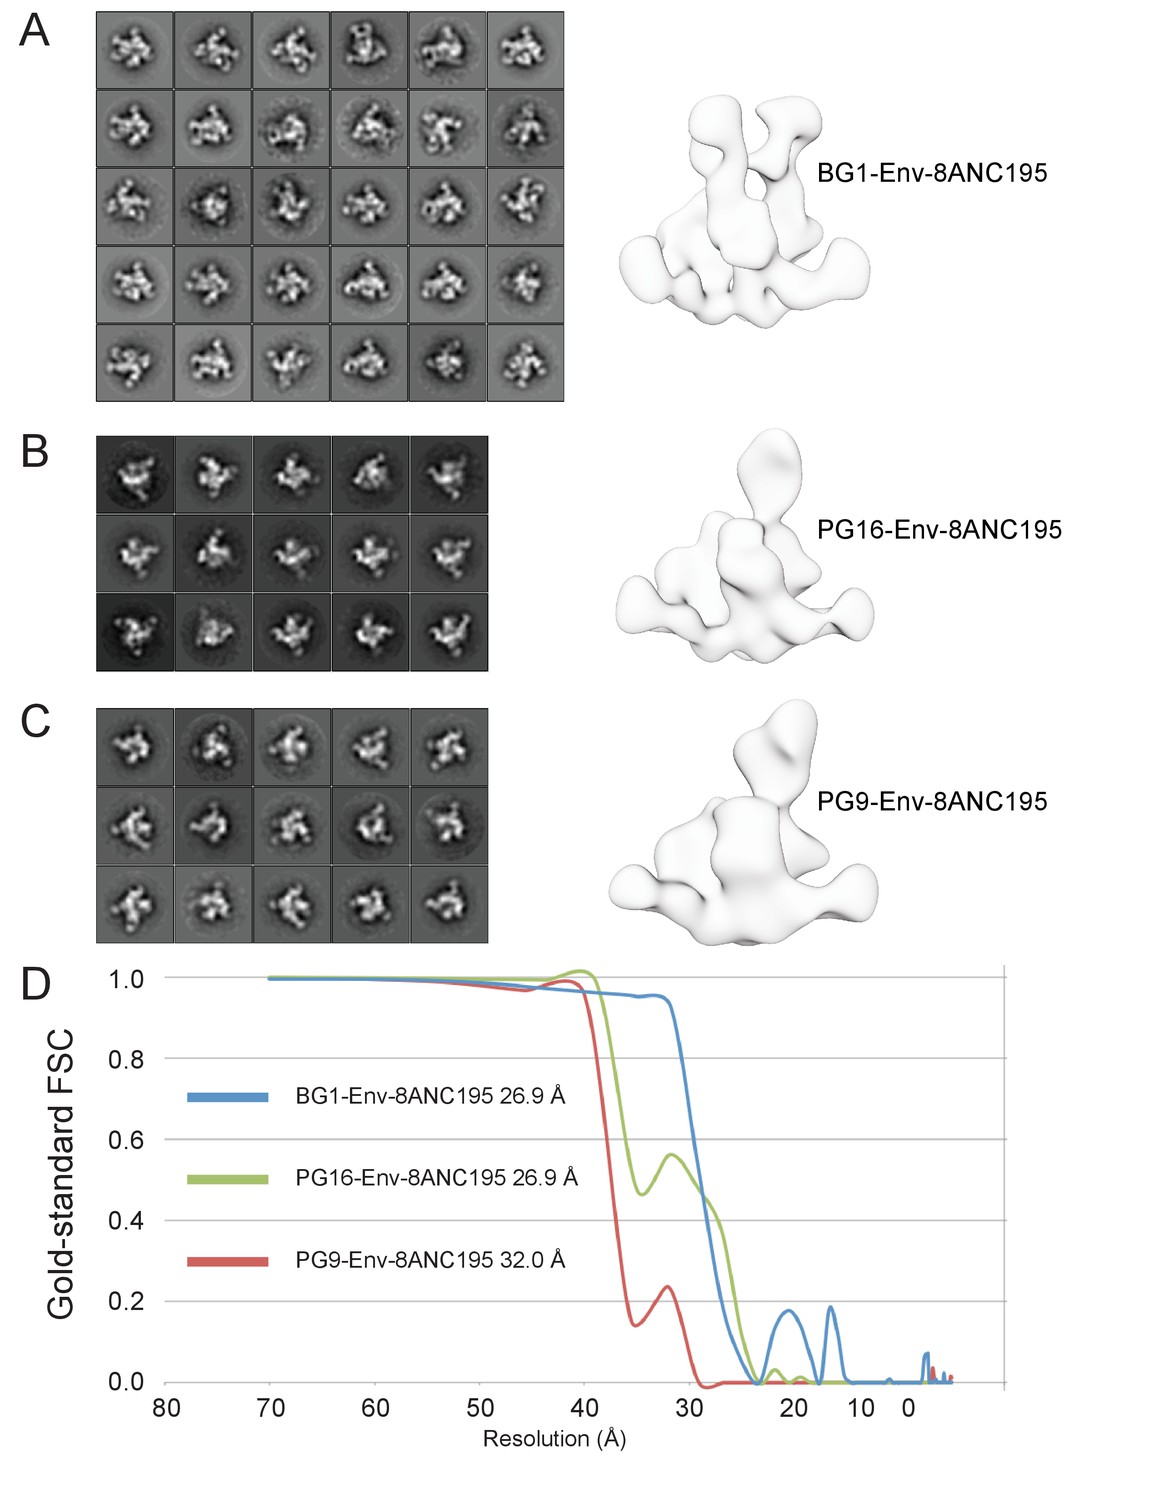
Negative-stain EM structures of V1V2 bNAb-Env-8ANC195 complexes.
(A–C) 2D class averages and the final structures after refinement for BG1-Env-8ANC195 (panel A), PG16-Env-8ANC195 (panel B), and PG9-Env-8ANC195 (panel C). (D) Gold-standard FSC for each structure.
Figure 3 with 2 supplements

~6.2 Å cryo-EM reconstruction of a BG1-Env-8ANC195 complex.
(A) EM density fit by coordinates for BG1_A (HC in brown; LC in yellow), BG1_B (HC in dark gray; LC in light gray), gp120s associated with BG1_A and BG1_B Fabs in purple and cyan, respectively; gp120_C in green, gp41 in orange, and 8ANC195 Fabs in dark blue (HC) and light blue (LC). (B) Close-up views of densities contoured at 6.0σ (0.0378 e/Å3) for glycans attached to Asn156gp120 and Asn160gp120 in the three gp120 protomers of Env trimer. Glycan residues built into the cryo-EM map densities are shown as sticks with oxygen atoms in red and nitrogen atoms in blue. (C, D) Close-up views of densities contoured at 6.0σ (0.0378 e/Å3) surrounding CDRH3 (panel C) and CDRH2 (panel D) in BG1-gp120_A and BG1_B-gp120_B interactions. Asn156gp120 and Asn160gp120 glycans are shown as sticks. CDRH2 residue Trp54 (Figure 1D) is identified with an arrow.
Figure 3—figure supplement 1
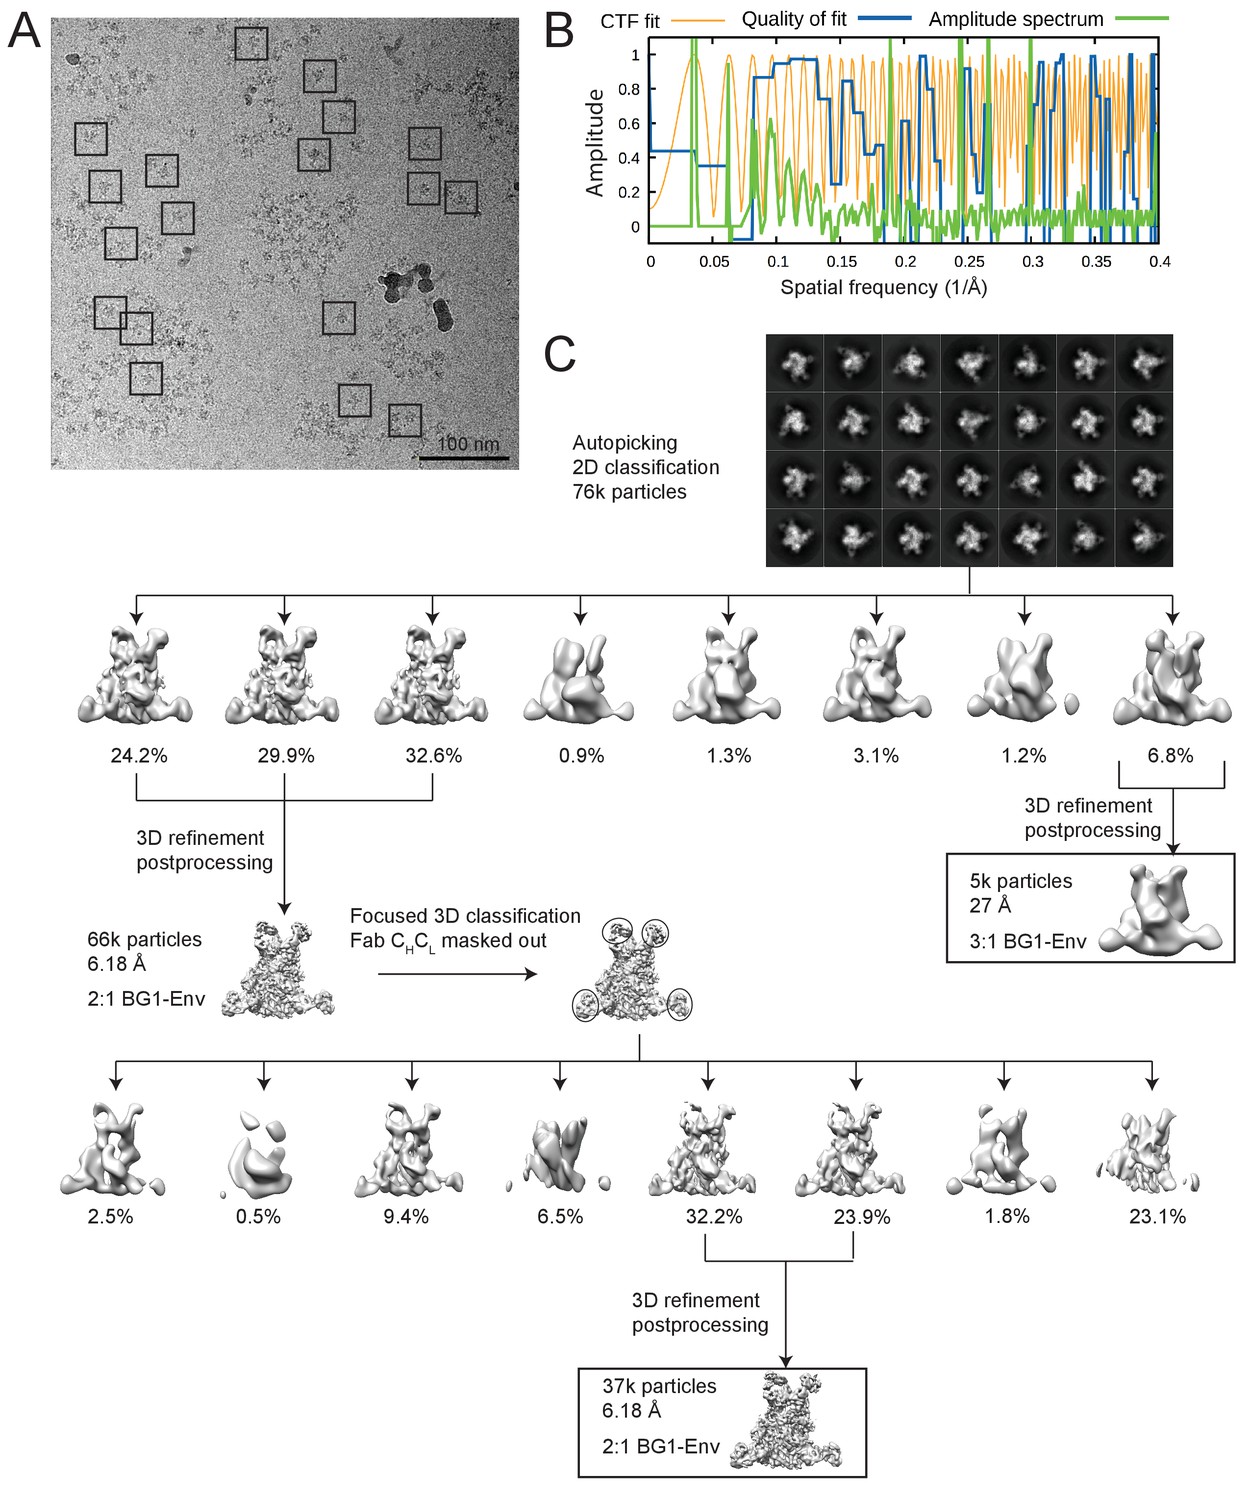
Cryo-EM data processing for the BG1-Env-8ANC195 complex structure.
(A) Representative micrograph. Examples of complex particles are boxed. The accumulated dose and defocus values were ~80 e-/Å2 and ~1.8 µm underfocus. (B) CTF fitting of the left micrograph (generated using CTFFIND4) shows a good fit to 4.9 Å. (C) Data processing scheme. 2D classification of autopicked particles resulted in 76K particles that were 3D classified using a low-pass-filtered negative-stain 2:1 BG1-Env EM structure as a reference model. The particles from the best three 3D classes were refined to 6.18 Å resolution. One 3D class showed three BG1 bound to each Env trimer (see Figure 3—figure supplement 2). The particles in 6.18 Å reconstruction were further 3D classified with the Fab CHCL domains masked out. Then the best two 3D classes were refined to 6.18 Å resolution. (E) Gold-standard FSCs of reconstructions generated using different strategies (see Figure 3—figure supplement 2). (F) Local resolution estimation. The complex is shown from top (left), side (middle), and bottom (right) views.
Figure 3—figure supplement 2
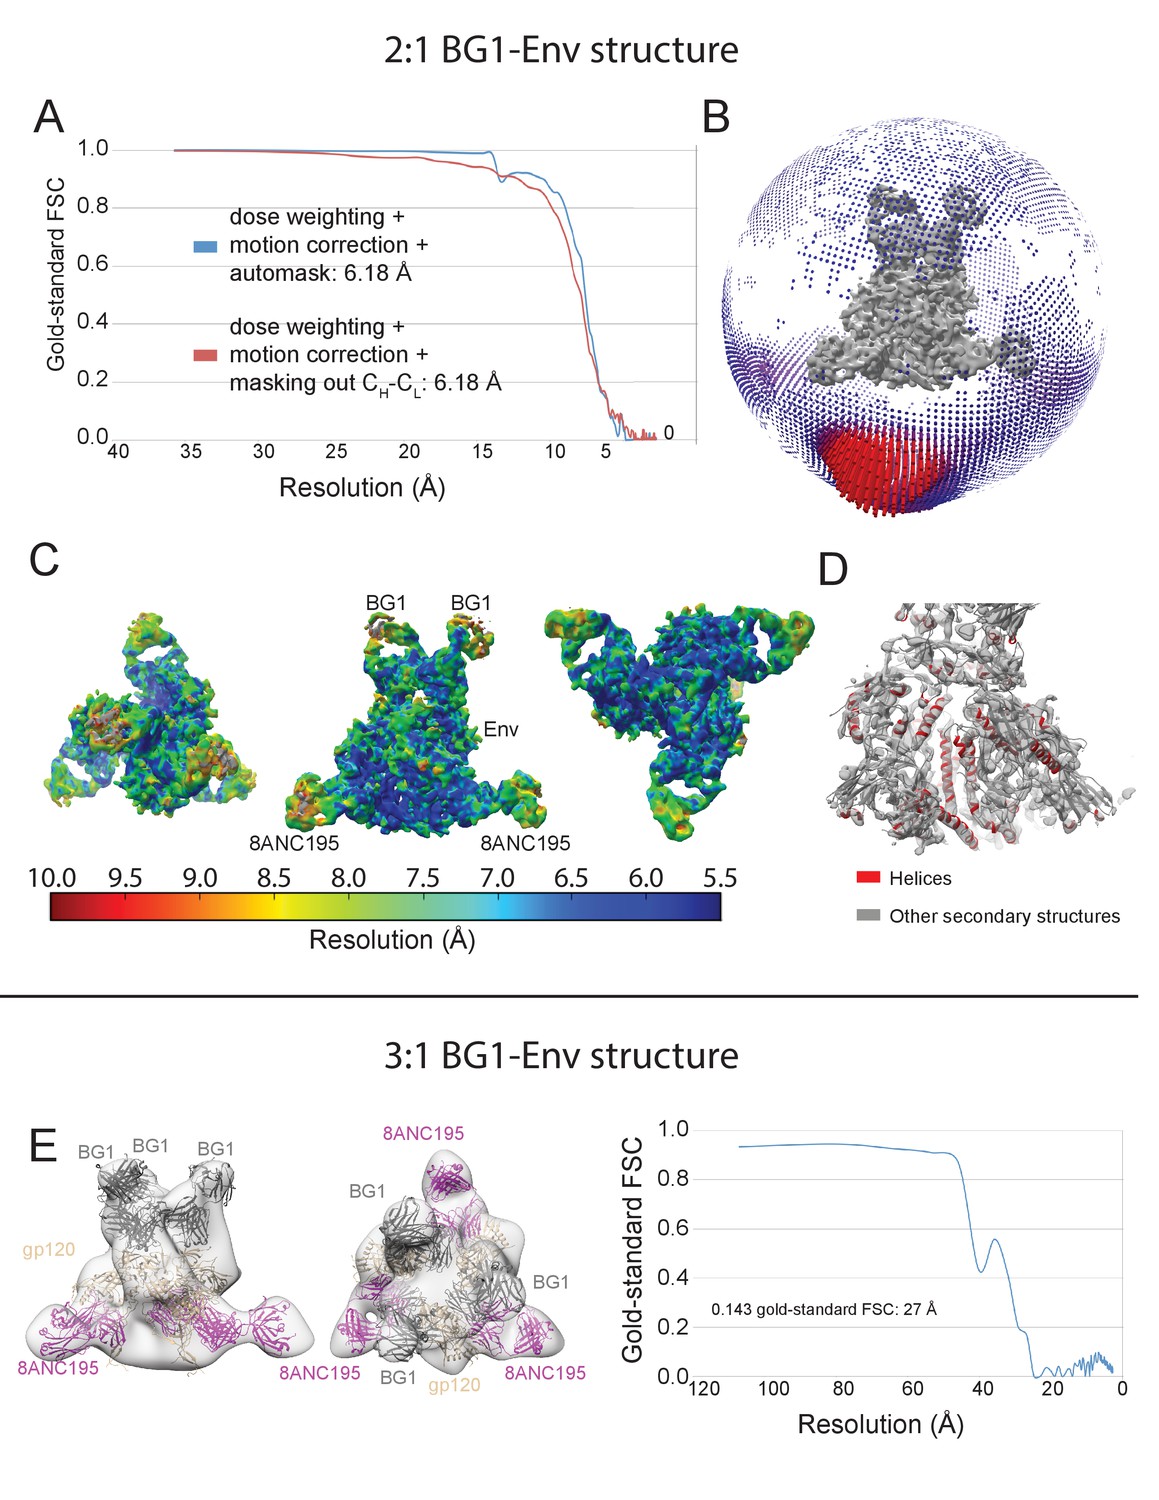
Validation of the 2:1 and 3:1 BG1-Env structures.
(A) Gold-standard FSCs of 2:1 BG1-Env reconstructions generated using different strategies. (B) Orientation distribution of the 6.2 Å 2:1 BG1-Env reconstruction without masking out Fab CHCL domains. (C) Local resolution estimation for the 2:1 BG1-Env structure. The complex is shown from top (left), side (middle), and bottom (right) views. (D) Cryo-EM map contoured to show densities for α-helices (red); other secondary structures shown in grey. (E) 27 Å cryo-EM structure of a 3:1 BG1-Env complex. Cryo-EM map with fitted components are shown from side (left) and top (middle) views. Right: Gold-standard FSC indicating 27 Å resolution for the reconstruction.
Figure 4 with 1 supplement
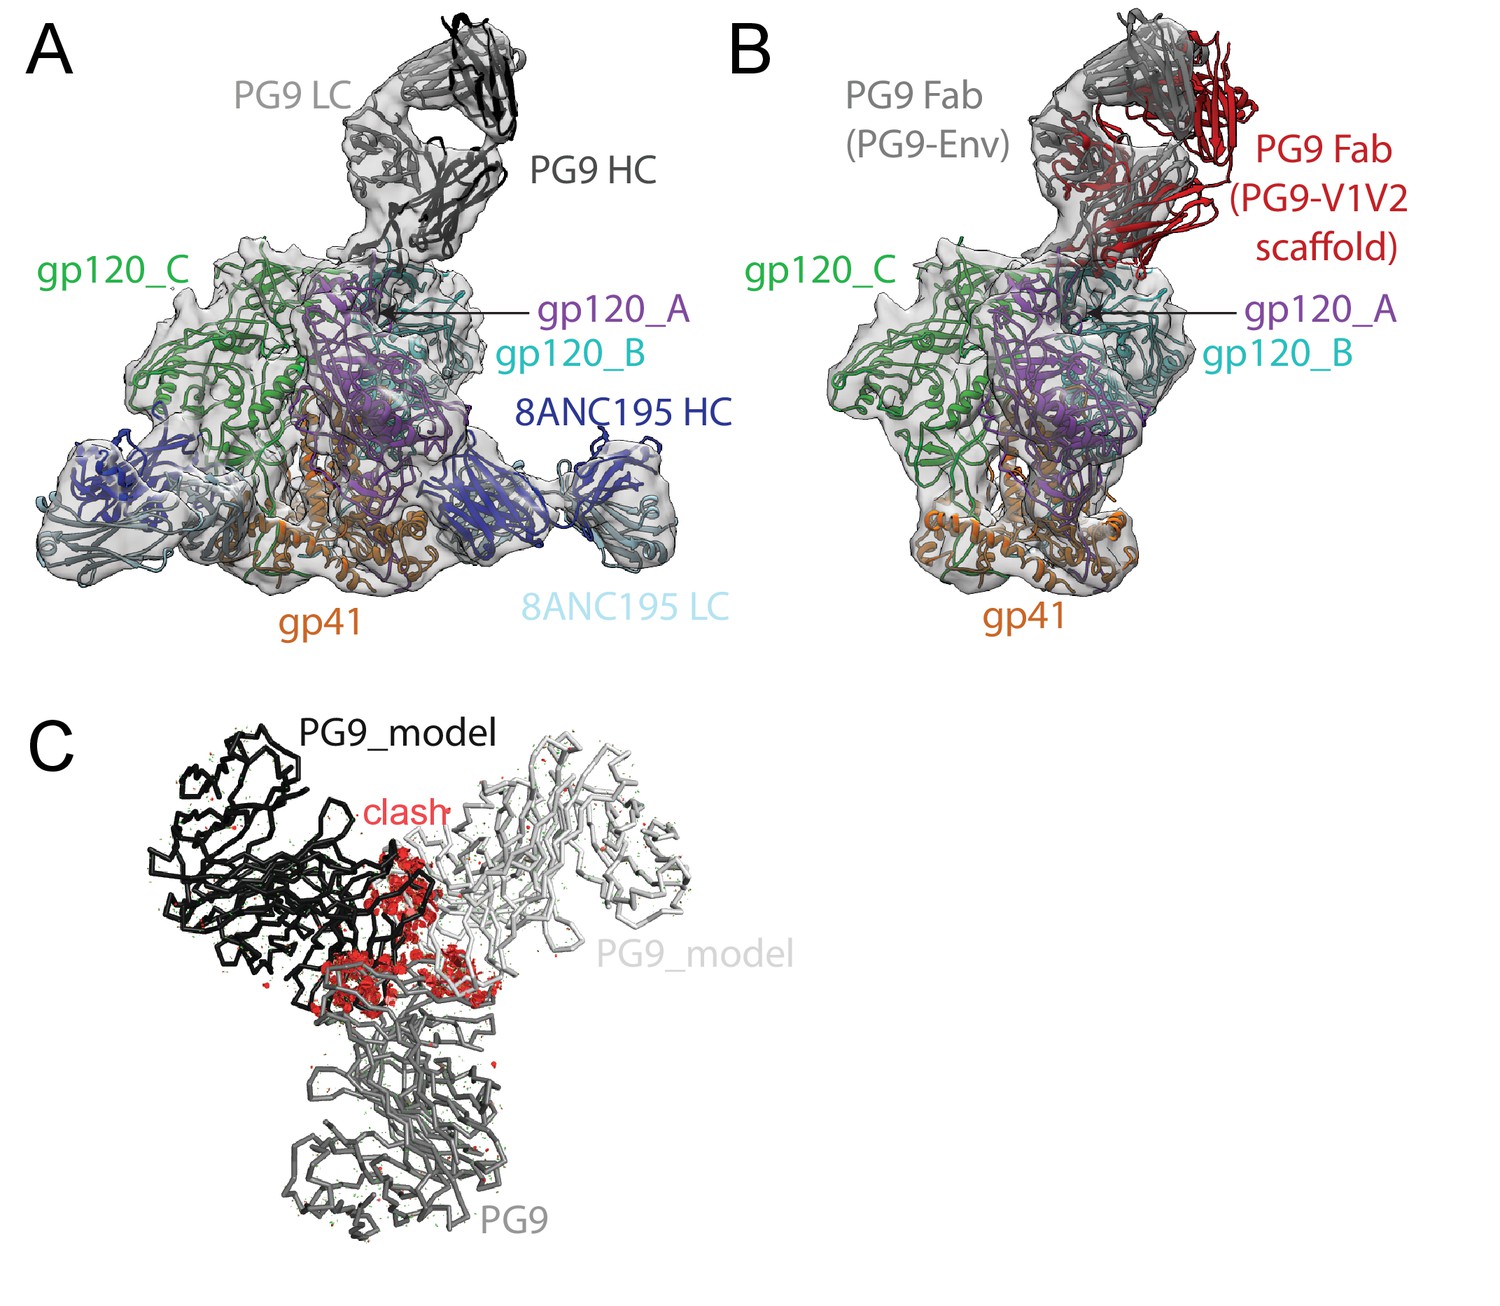
~11.5 Å cryo-EM reconstruction of a PG9-Env-8ANC195 complex.
(A) EM density fit by coordinates for PG9 (HC in dark gray; LC in light gray), gp120 subunits in dark blue, cyan, and green, gp41 in orange, and 8ANC195 Fabs in dark blue (HC) and light blue (LC). (B) Density and coordinates from the PG9-Env portion of the PG9-Env-8ANC195 reconstruction (density for 8ANC195 Fabs removed) with coordinates for the PG9 Fab from the PG9-V1V2 scaffold structure (PDB 3U4E) superimposed. When the V1V2 scaffold from the PG9-V1V2 complex structure was superimposed with the V1V2 portion of the PG9-Env-8ANC195 structure (panel A), the angle of approach of the PG9 Fab differs from the angle observed in the PG9-Env structure. (C) Hypothetical model of three PG9 Fabs bound per Env trimer. One PG9 Fab (PG9_A) is shown its experimentally-determined position from the PG9-Env-8ANC195 structure interacting mainly with gp120_A on Env trimer (view looking down the trimer three-fold axis). The VH-VL domains for second and third PG9 Fabs (PG9 model) were positioned onto the gp120_B and gp120_C subunits assuming the interaction observed for PG9_A with gp120_A. Predicted van der Waals clashes (red dots) were calculated using the show_bumps module in Pymol (Schrödinger, 2011).
Figure 4—figure supplement 1
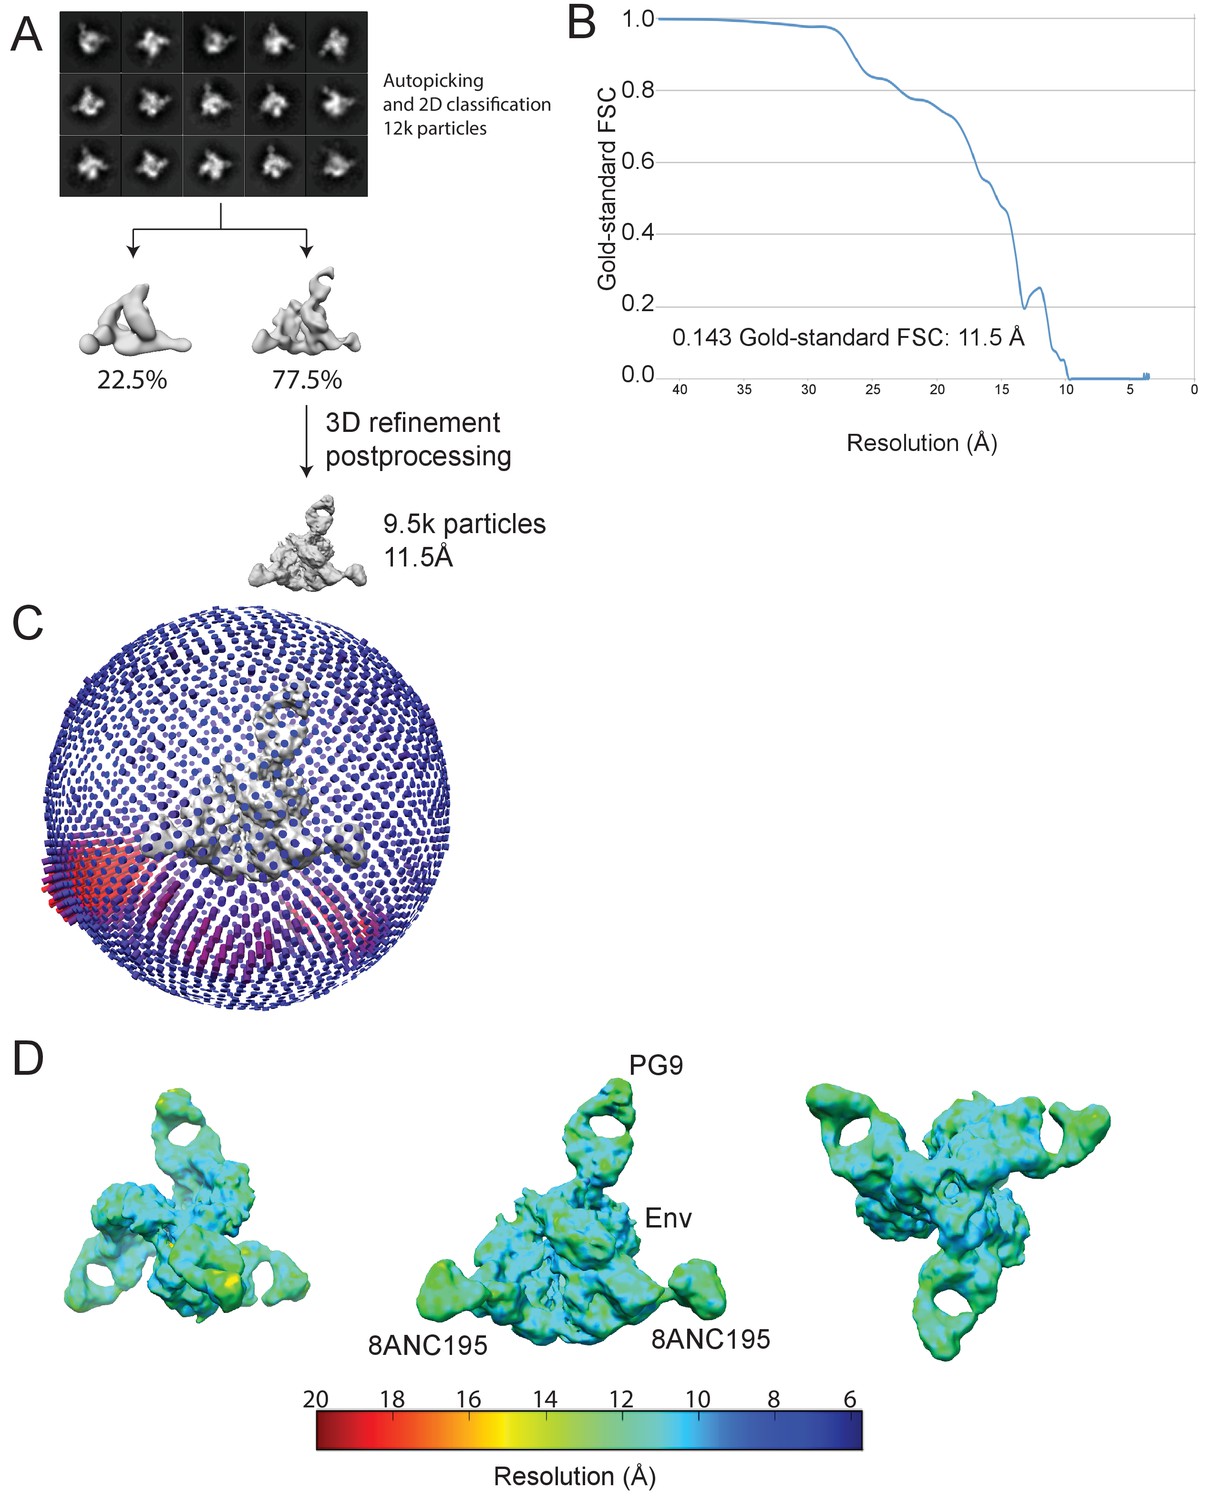
Cryo-EM data processing for PG9-Env-8ANC195 complex structure.
(A) Data processing scheme. 2D classification of autopicked particles resulted in 12 K particles that were 3D classified using a low-pass-filtered negative-stain PG9-Env-8ANC195 EM structure as a reference model. The particles from the best class were refined to 11.5 Å resolution. (B) Orientation distribution of the reconstruction. (C) Local resolution estimation. The complex is shown from top (left), side (middle), and bottom (right) views. (D) Gold-standard FSC indicating 11.5 Å resolution for the reconstruction.
Figure 5 with 1 supplement
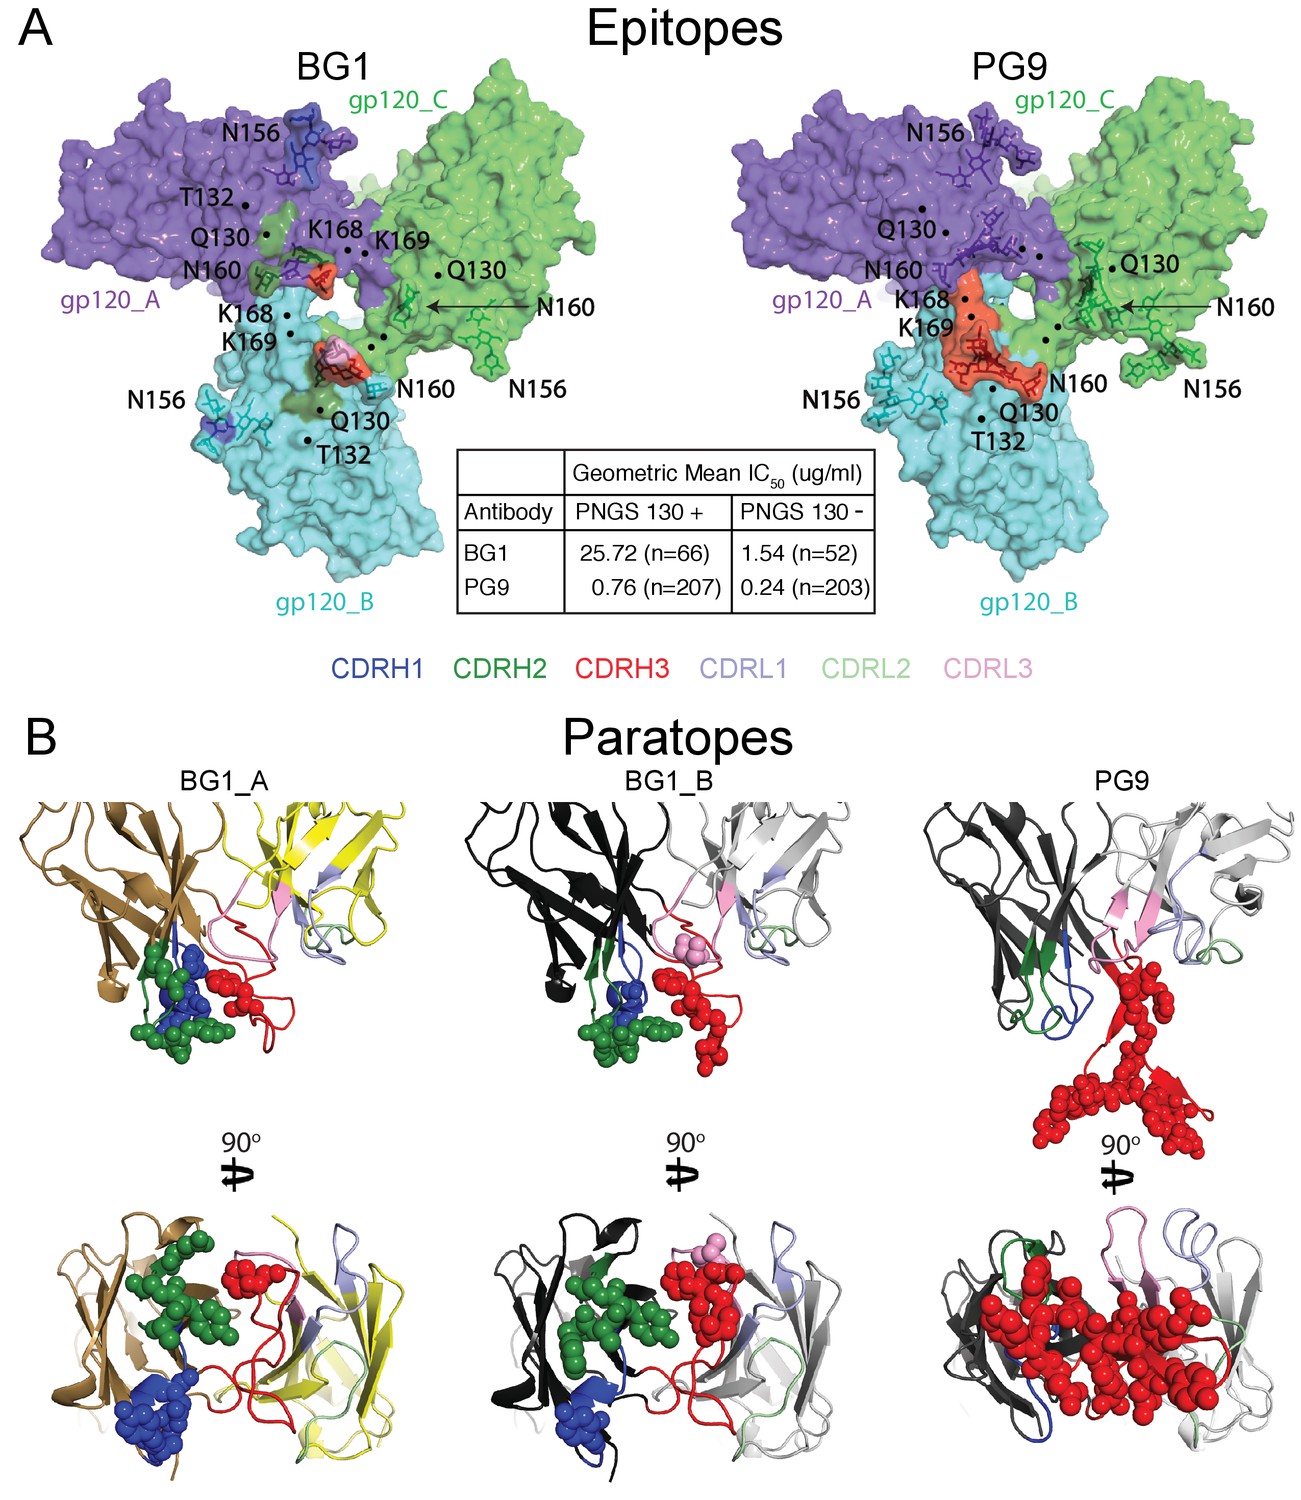
Comparison of BG1 and PG9 epitopes and paratopes.
(A) Epitopes on Env trimer (top view surface representations) were defined as protein or glycan residues whose Cα (for protein) or C1 (for glycans) atom was within 7 Å of the bound Fab. Contacts on Env are color-coded to indicate which CDR loop made the contact (CDRH3 in red, CDRH2 in green, and CDRH1 in dark blue). Glycans are shown as sticks with a nearby label to identify the glycan as attached to either Asn156gp120 or Asn160gp120, and locations of residues of interest (Lys168gp120, Lys169gp120, and Gln130gp120) are indicated by black dots. Center box compares geometric mean IC50 values for BG1 and PG9 IgGs evaluated against HIV-1 strains either containing or not containing a PNGS at position 130 (number of HIV-1 strains indicated in the parentheses). IC50values > 50 µg/mL set to 50 µg/mL for geometric mean calculations. (B) Paratopes on BG1_A, BG1_B, and PG9 Fabs indicated by spheres on ribbon representations of VH-VL domains shown in two orientations related by a 90˚ rotation. CDRs are color coded as in panel A.
-
Figure 5—source data 1
In vitro neutralization data for BG1 and PG9 strains with and without N130 glycan.
- https://doi.org/10.7554/eLife.27389.016
Figure 5—figure supplement 1
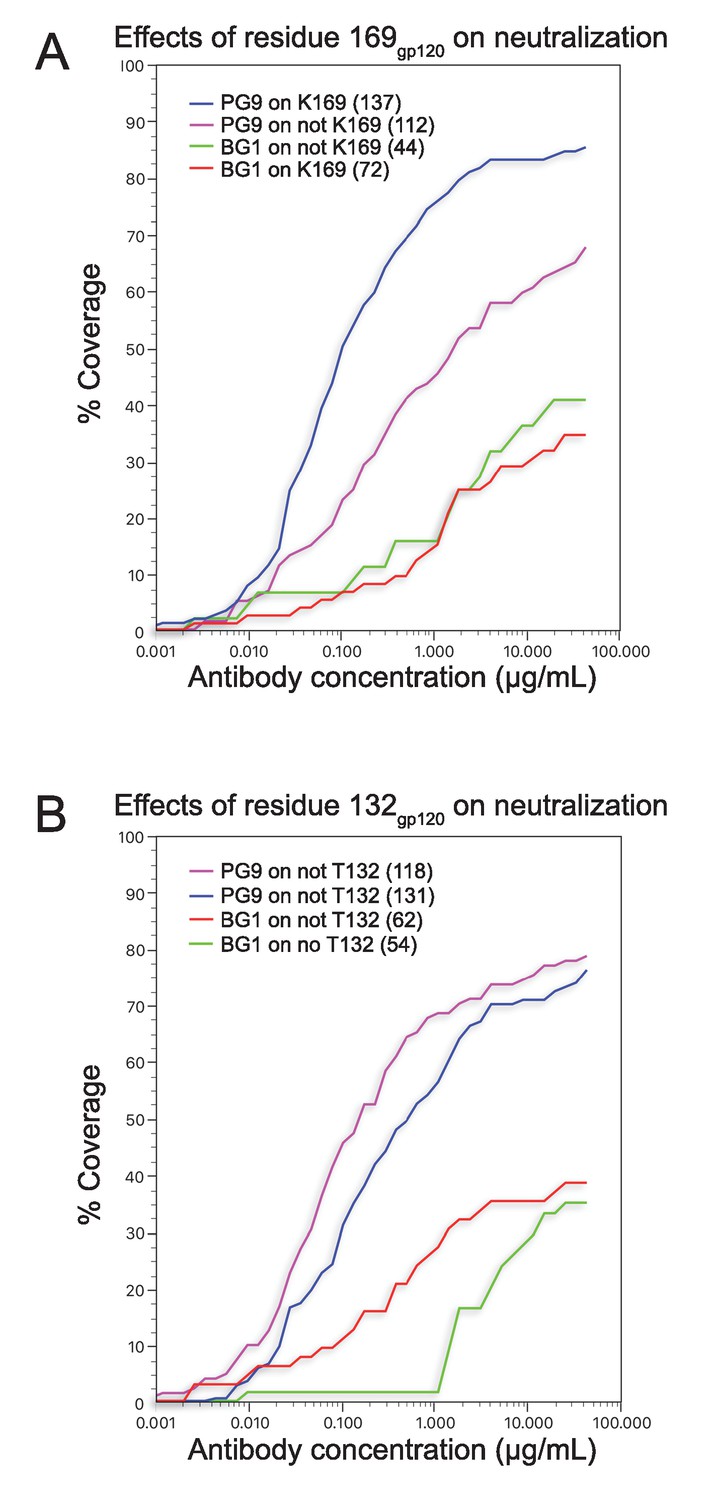
Coverage curves for results of in vitro neutralization across panels of viruses that do or do not include a lysine at position 169gp120 (panel A) or a threonine at position 132gp120 (panel B).
The number of strains used to calculate each curve is shown in parentheses in the key inside each graph.
Figure 6

BG1 and PG9 interactions with V1V2.
(A) BG1 interactions with N-linked glycans attached to Asn156gp120 and Asn160gp120 shown for BG1_A (left) and BG1_B (right). (B) PG9 interactions with N-linked glycans attached to Asn156gp120 and Asn160gp120 from PG9-Env cryo-EM structure reported here (left) and from the crystal structure of PG9-V1V2 scaffold (PDB 3U4E) (right). The position of the CDRH3 loop in the PG9-Env cryo-EM structure is shown by a dashed line representing the position of CDRH3 in the PG9-V1V2 scaffold structure.
Figure 7
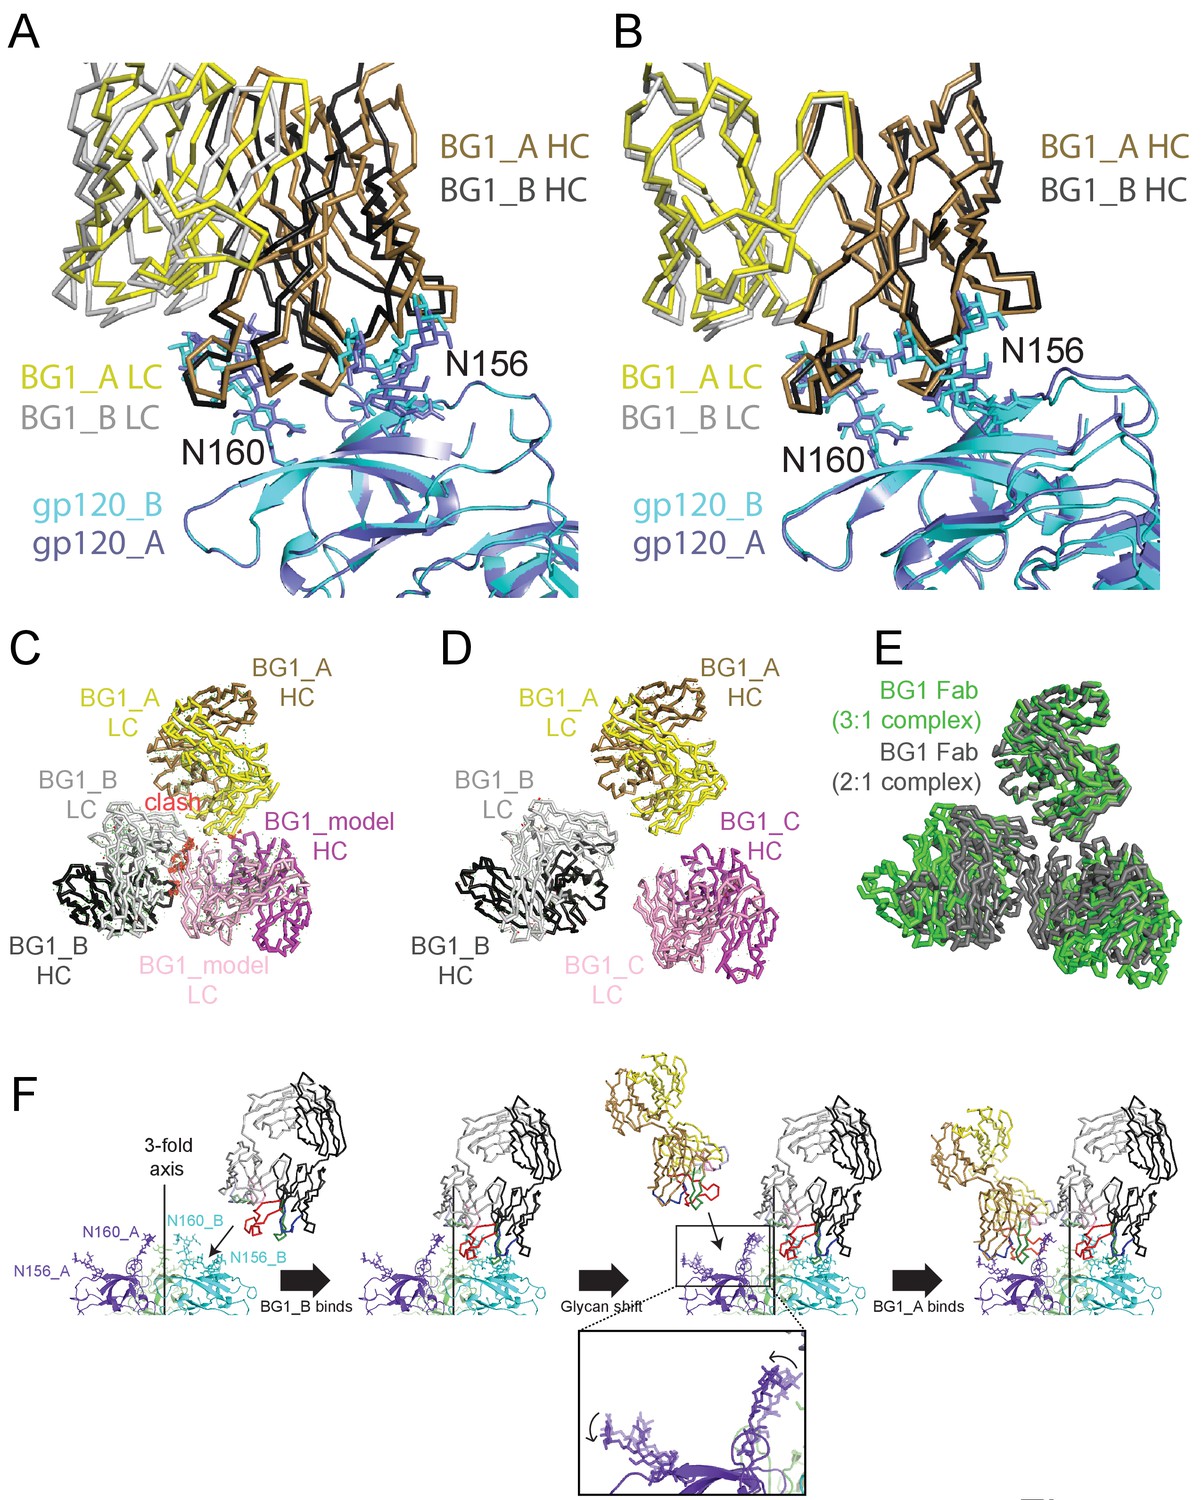
Asymmetry of BG1 interactions with Env trimer.
(A,B) Superposition of the two BG1 binding sites in the 2:1 BG1-Env structure by aligning either the V1V2 regions of gp120_A and gp120_B (panel A) or the Asn156gp120 and Asn160gp120 glycans within gp120_A and gp120_B (panel B). (C) Hypothetical model of three BG1 Fabs bound per Env trimer based on Fab orientations in the 2:1 BG1-Env structure. The BG1_A and BG_1 B Fabs are shown in their respective positions on the gp120_A and gp120_B subunits of Env trimer (view looking down the trimer three-fold axis). A third BG1 Fab (BG1 model) was positioned onto the gp120_C subunit assuming that it would interact with the Asn156gp120 and Asn160gp120 glycans in the common interaction observed for BG1_A and BG1_B (panel B). Predicted van der Waals clashes (red dots) were calculated using the show_bumps module in Pymol (Schrödinger, 2011). (D) Positions of three BG1 Fabs in the 27 Å 3:1 BG1-Env structure (no predicted van der Waals clashes). (E) Comparison of BG1 Fab positions in the 2:1 BG1-Env structure (gray; the third Fab is from the model shown in panel C) and the 3:1 BG1-Env structure (green) after superimposing the BG1_A Fabs. (F) Model for binding of two BG1 Fabs to form the 2:1 BG1-Env structure. Panels 1 and 2: BG1_B binds first to the V1V2 epitope on gp120_B such that its CDRL1 interacts with the Asn160gp120 glycan from gp120_A. Panels 3 and 4: BG1_A recognizes the Asn156gp120 and Asn160gp120 glycans from gp120_A. The flexible glycans are shifted away from the trimer 3-fold axis (indicated by arrows in the close-up view of the third panel) such that a potential clash with BG1_B is avoided.
Author response image 1
Videos
Video 1
~6.2 Å Cryo-EM reconstruction of BG1-Env-8ANC195 complex.
Color scheme follows Figure 3A: BG1 Fabs are shades of yellow (BG1_A) and gray (BG1_B); gp120s are purple (gp120_A), cyan (gp120_B), and green (gp120_C); gp41 is orange, and 8ANC195 Fabs are shades of blue.
Tables
Table 1
BG1 Fab crystal structure data collection and refinement statistics.
| 354BG1 | |
|---|---|
| Data collection | |
| Beamline | SSRL 12–2 |
| Wavelength | 0.9795 Å |
| Temperature (°K) | 100 |
| Space group | P3221 |
| Cell dimensions | |
| a, b, c (Å) | 95.6, 95.6, 103.9 |
| α, β, γ (°) | 90, 90, 120 |
| Resolution (Å) | 82.82–2.00 (2.05–2.00)* |
| Rmerge | 0.11 (.98) |
| Rpim | 0.07 (.72) |
| I / σI | 7.9 (1.6) |
| CC (1/2) | 0.99 (.63) |
| Completeness (%) | 100 (100) |
| Redundancy | 5.5 (5.5) |
| Refinement | |
| Resolution (Å) | 38.5–2.0 (2.05–2.00) |
| No. reflections Rfree Reflections | 37,357 3724 |
| Rwork / Rfree | 0.208/0.238 |
| No. atoms | |
| Protein | 3257 |
| Ligand/Solvent | 252 |
| B-factors | |
| Protein | 42 |
| Ligand/Solvent | 44 |
| Average | 42 |
| R.m.s. deviations | |
| Bond lengths (Å) | 0.007 |
| Bond angles (°) | 0.96 |
-
*Values in parentheses are for highest-resolution shell.
Table 2
BG1-Env-8ANC195 complex cryo-EM structure data collection and model statistics.
| Data collection/processing | |
|---|---|
| Microscope | Titan krios |
| Voltage | 300 kV |
| Camera | Gatan K2 Summit |
| Camera mode | counting |
| Defocus range | 1.5–3.5 |
| Exposure time | 15 s |
| Dosage rate | 2.92 electrons⋅pixel−1⋅subframe−1 |
| Magnified pixel size | 1.35 |
| Total Dose (e/A2) | 80 |
| Reconstruction | |
| Software | Relion-1.4 |
| Symmetry | C1 |
| Particles refined | |
| Resolution(automask, Å) | 6.18 |
| Resolution(masked out Fab CHCL domains, Å) | 6.18 |
| Map sharpening B-factor (Å2) | −24.7274 |
| Model Statistics | |
| Map CC (whole unit cell): | 0.931 |
| Map CC (around atoms): | 0.731 |
| All-atom clashscore | 17.66 |
| Ramachandran plot: | |
| outliers: | 0.44% |
| allowed: | 7.44% |
| favored: | 92.12% |
| rmsd (bonds): | 0.01 |
| rmsd (angles): | 1.11 |
| Rotamer outliers: | 0.85% |
| C-beta deviations: | 0 |
Download links
A two-part list of links to download the article, or parts of the article, in various formats.
Downloads (link to download the article as PDF)
Open citations (links to open the citations from this article in various online reference manager services)
Cite this article (links to download the citations from this article in formats compatible with various reference manager tools)
Asymmetric recognition of HIV-1 Envelope trimer by V1V2 loop-targeting antibodies
eLife 6:e27389.
https://doi.org/10.7554/eLife.27389


