A recombinant BBSome core complex and how it interacts with ciliary cargo
- Max Planck Institute of Molecular Physiology, Germany
Figures
Figure 1 with 3 supplements

Subcomplexes of the BBSome.
(A) Coomassie-stained SDS-PAGE of binary and multimeric BBSome complexes purified by Strep/Flag tandem affinity purification. The BBS proteins are indicated with color-coded marks. Variances in gel mobility of the individual components is caused by different affinity tags, as is most pronounced for BBS18. (B) Schematic subunit organization model that is consistent with expression and stability of subcomplexes (Components of the most stable core complex in color, and the two missing subunits in grey).
Figure 1—figure supplement 1

Coomassie-stained SDS-PAGE on individual BBSome subunits.
(A) Cell lysates of baculovirus-infected Hi5 insect cells expressing the BBS proteins 1–12 (three days post-infection). For BBS1, both the full length (FL) and a C-terminally truncated version (residues 1–430) were tested, and for BBS7 two different transcript variants (t1 and t2) are shown. (B) Purified BBS subunits after single-step Streptactin-affinity purification.
Figure 1—figure supplement 2
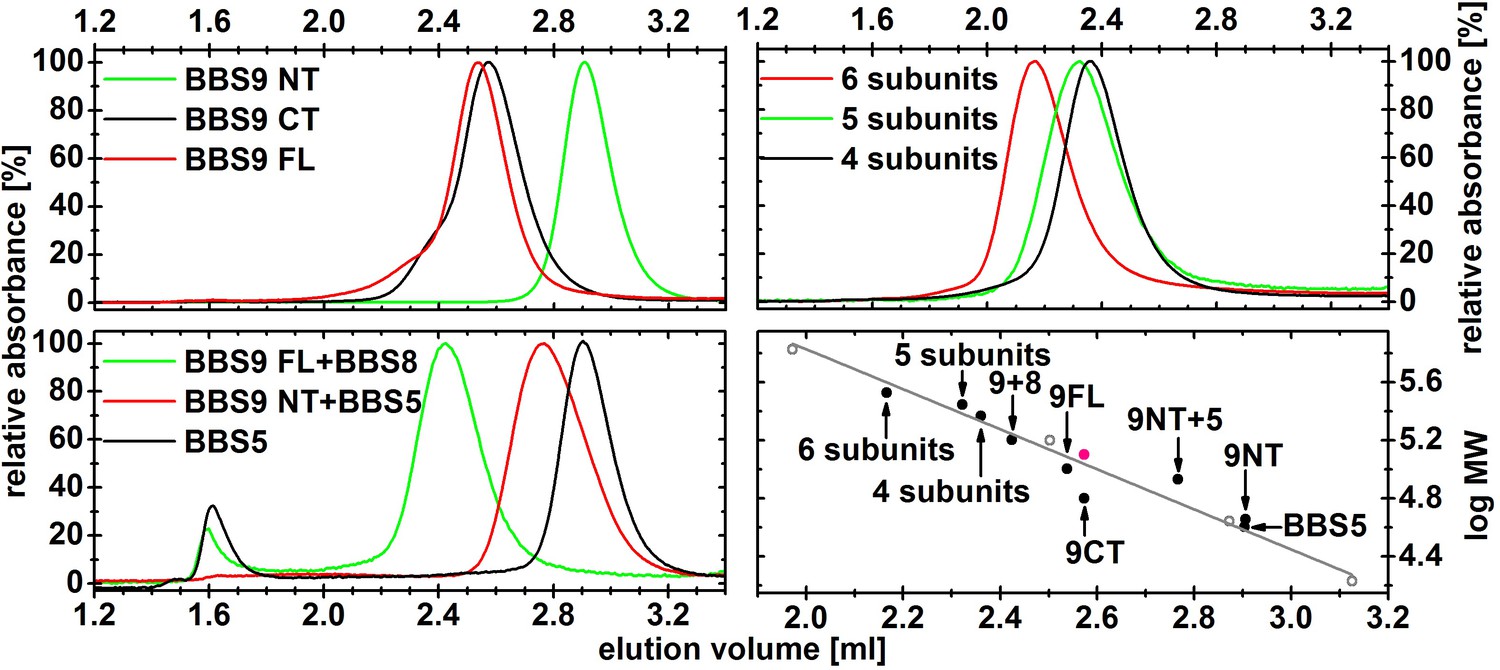
Normalized gel filtration profiles of different BBS complexes.
The samples were purified by affinity chromatography and subsequent gel filtration, and 2.5–10 µg of the peak fraction was then analyzed on a Superdex 200 5/20 column. The complexes containing 4, 5 and 6 subunits are composed of BBS 4,8,9,18; BBS 1,5,8,9,18 and BBS 1,4,5,8,9,18, respectively. Their elution volumes were plotted against the theoretical molecular weight of the monomeric complex (black circles) and compared with standard proteins (open grey circles, and a grey line for the linear fit line). The elution volume of the C-terminal domain of BBS9 fits better to a dimeric species, which is shown as a red circle.
Figure 1—figure supplement 3
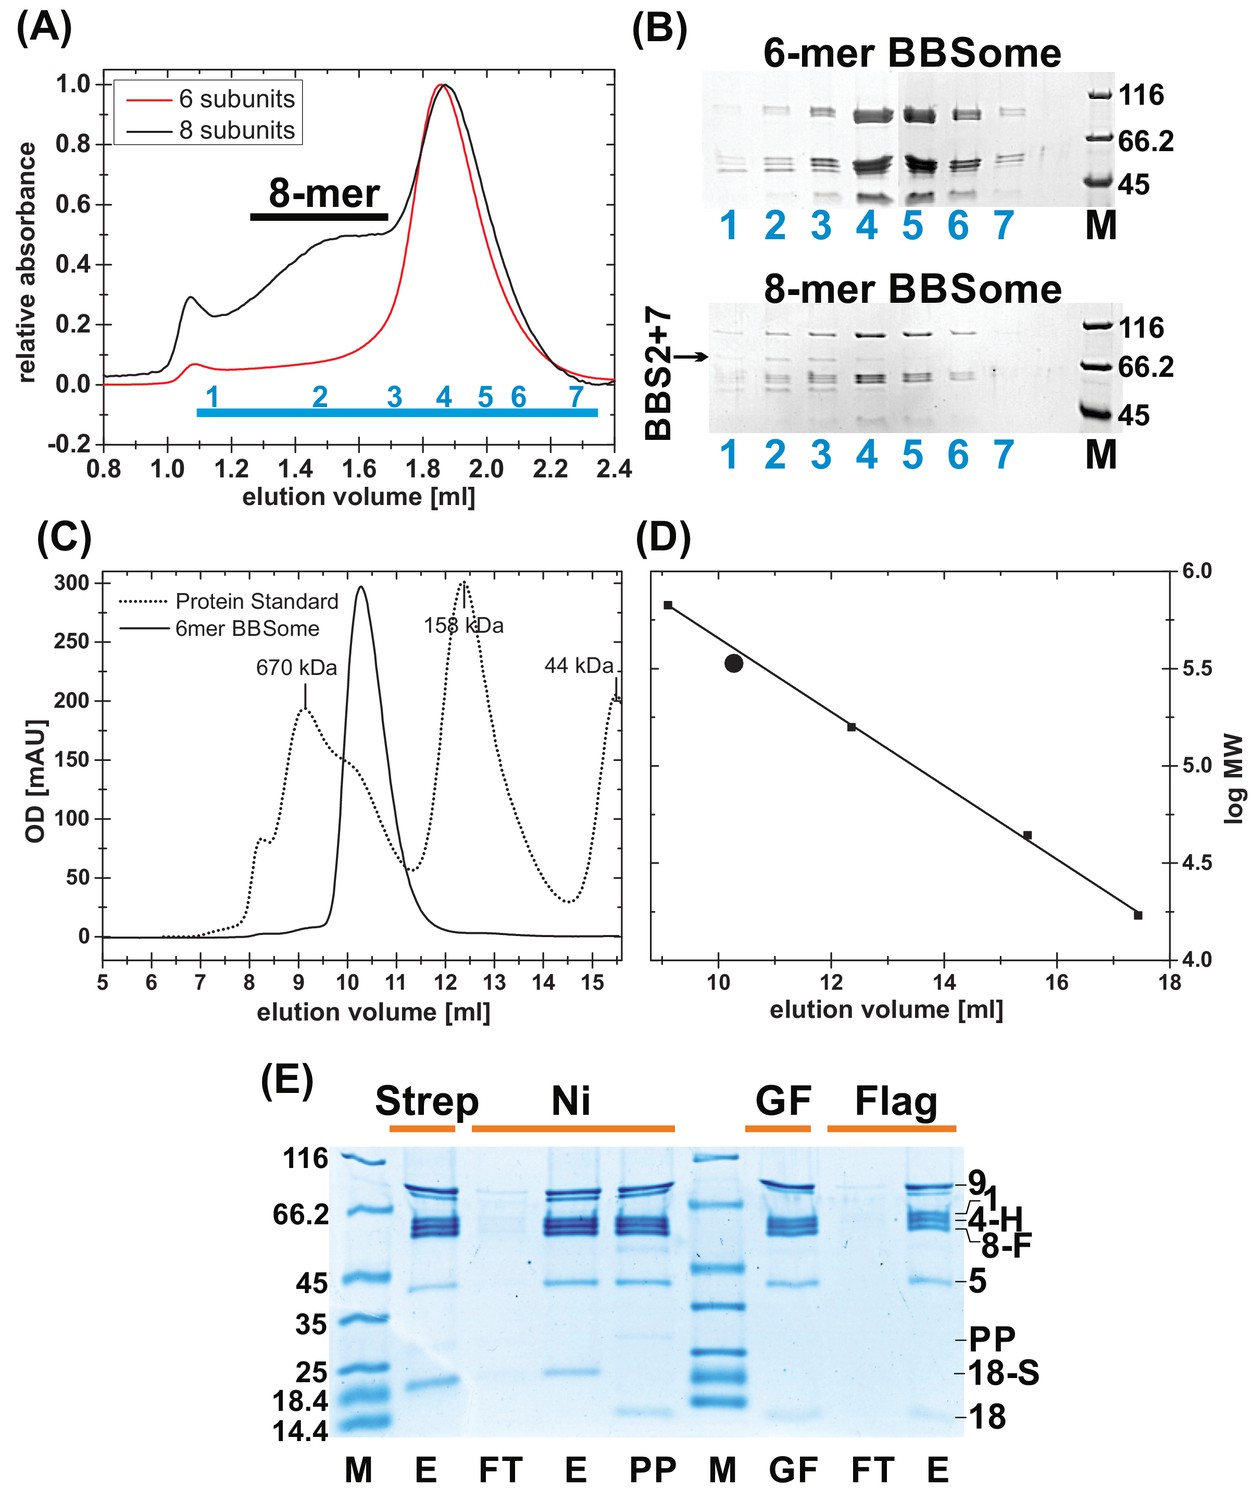
Purification of BBSome complexes.
(A) Gel filtration profile of BBSome complexes with 6 and 8 subunits. As can be seen in coomassie-stained SDS-PAGE of the gel filtration (GF) fractions (B), the affinity-purified core BBSome complex (six subunits) elutes as a monomeric species, while BBS2 and BBS7 only partially incorporate in the full eight subunit complex that elutes as an oligomeric species, separated from the 6mer. (C) Calibration of the gel filtration profile of the core BBSome with a standard mixture of proteins with known molecular weight. (D): The apparent molecular weight of the core BBSome (large sphere), as determined by a comparison with standard proteins (small squares) is slightly larger than its theoretical molecular weight. (E) Coomassie-stained SDS-PAGE of samples from the triple-affinity purification of the core BBSome complex. After initial Streptactin-affinity (Strep) and Nickel affinity (Ni) purifications, Prescission Protease (PP) was added to cleave off the tag on BBS18. After incubation for 12 hr at 4°C, aggregates were removed by gel filtration, and the pooled monomeric complex (GF) was further purified in a final Flag affinity purification step (E: Elution, FT: Flowthru). The three tags used for purification are a cleavable dual-Strep tag on BBS18 (18 s), a His-tag on BBS4 (4 hr) and a Flag-tag on BBS8 (8 F).
Figure 2 with 1 supplement
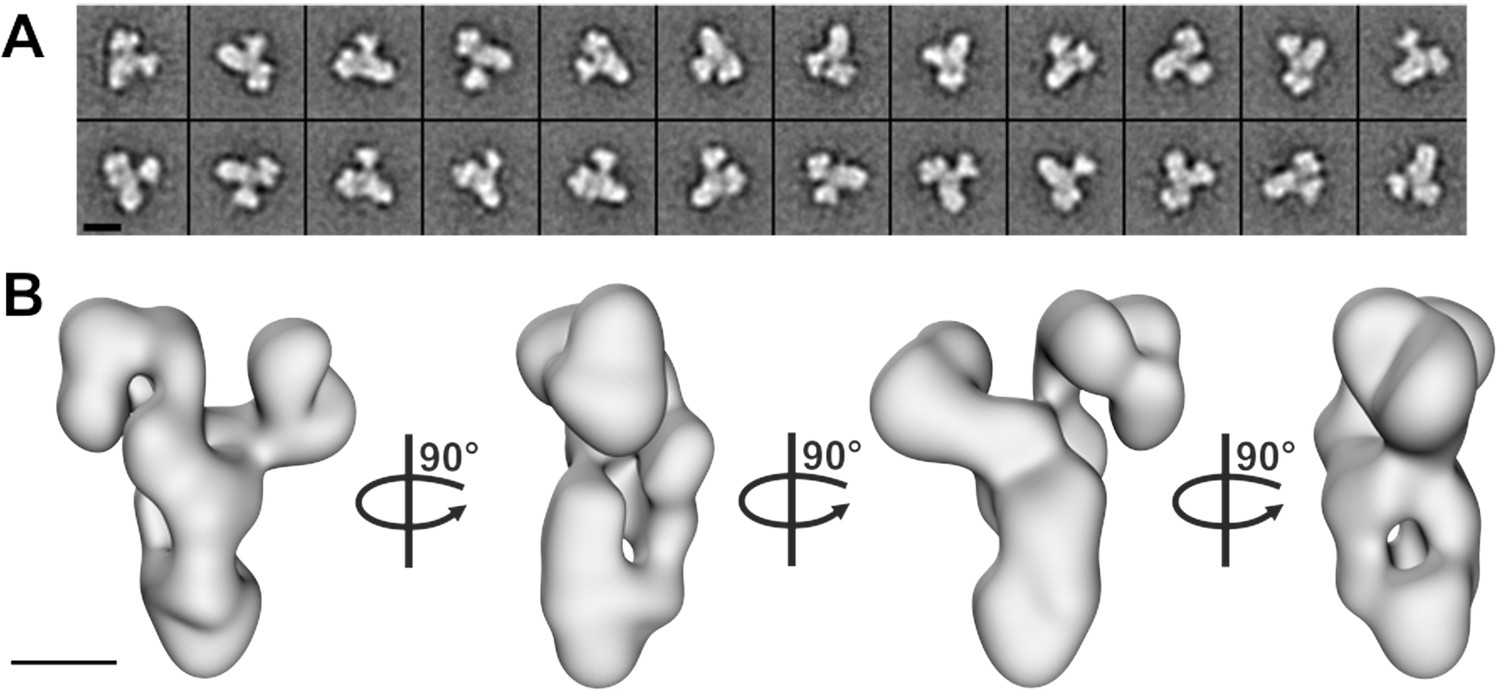
Negative stain electron microscopy analysis of the core BBSome complex.
(A–B) Representative 2-D class averages (scale bar, 10 nm) (A) and a 3-D reconstruction (B) of the core BBSome (scale bar, 5 nm).
Figure 2—figure supplement 1
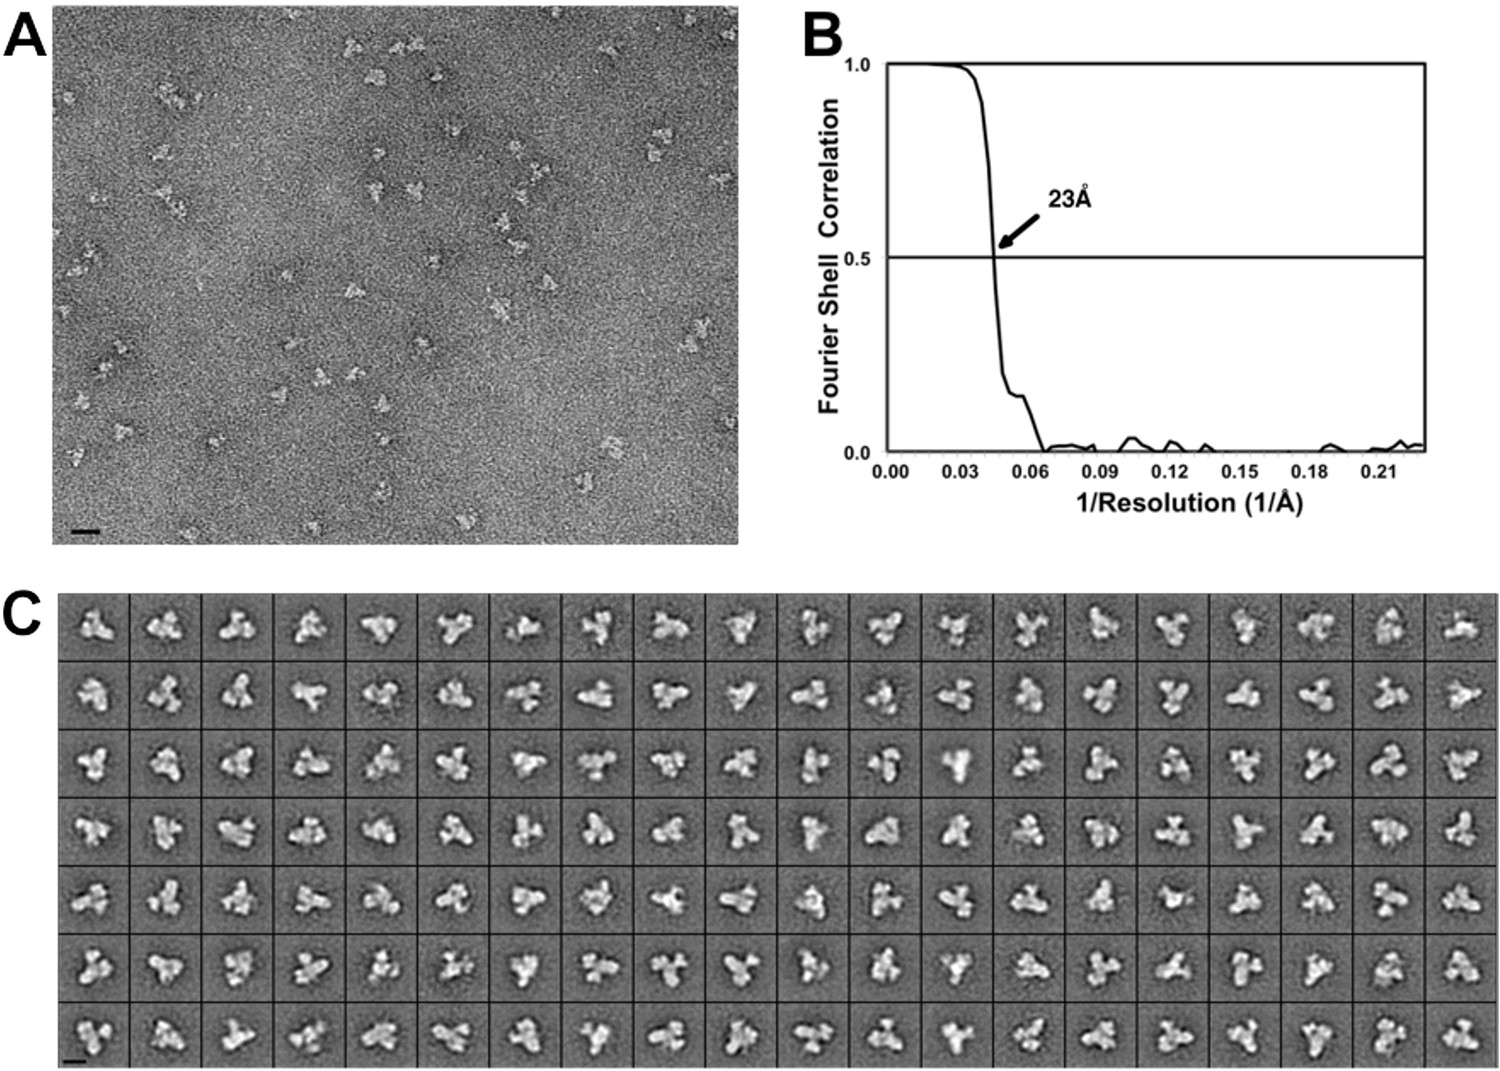
Negative stain EM of the core BBSome complex.
(A) Typical digital micrograph area of negatively stained BBSome particles (scale bar, 20 nm). (B) Fourier shell correlation of the 3-D reconstruction (prior to masking) (C) Class averages of negatively stained BBSome particles, each containing 11–86 particles (scale bar, 10 nm).
Figure 3

Pulldown of core BBSome with immobilized Arl6 and Smoothened domain R546-L665.
Purified core BBSome samples were pulled down by a 7.5 fold molar excess of Arl6•GDP, Arl6•GppNHp or Smo(R546-L665) immobilized to Streptactin-coupled Sepharose beads. While no interaction of the BBSome with Arl6•GDP was detectable, Arl6•GppNHP captured most of the BBSome sample. Smo(R546-L665) bound weaker, but still captured >2% of the BBSome sample. This was approximated by a comparison of the 1:50 diluted Arl6•GppNHp elution with the undiluted Smo(R546-L665) elution in a Flag-blot against Flag-BBS8 from the BBSome core complex.
Figure 4 with 1 supplement
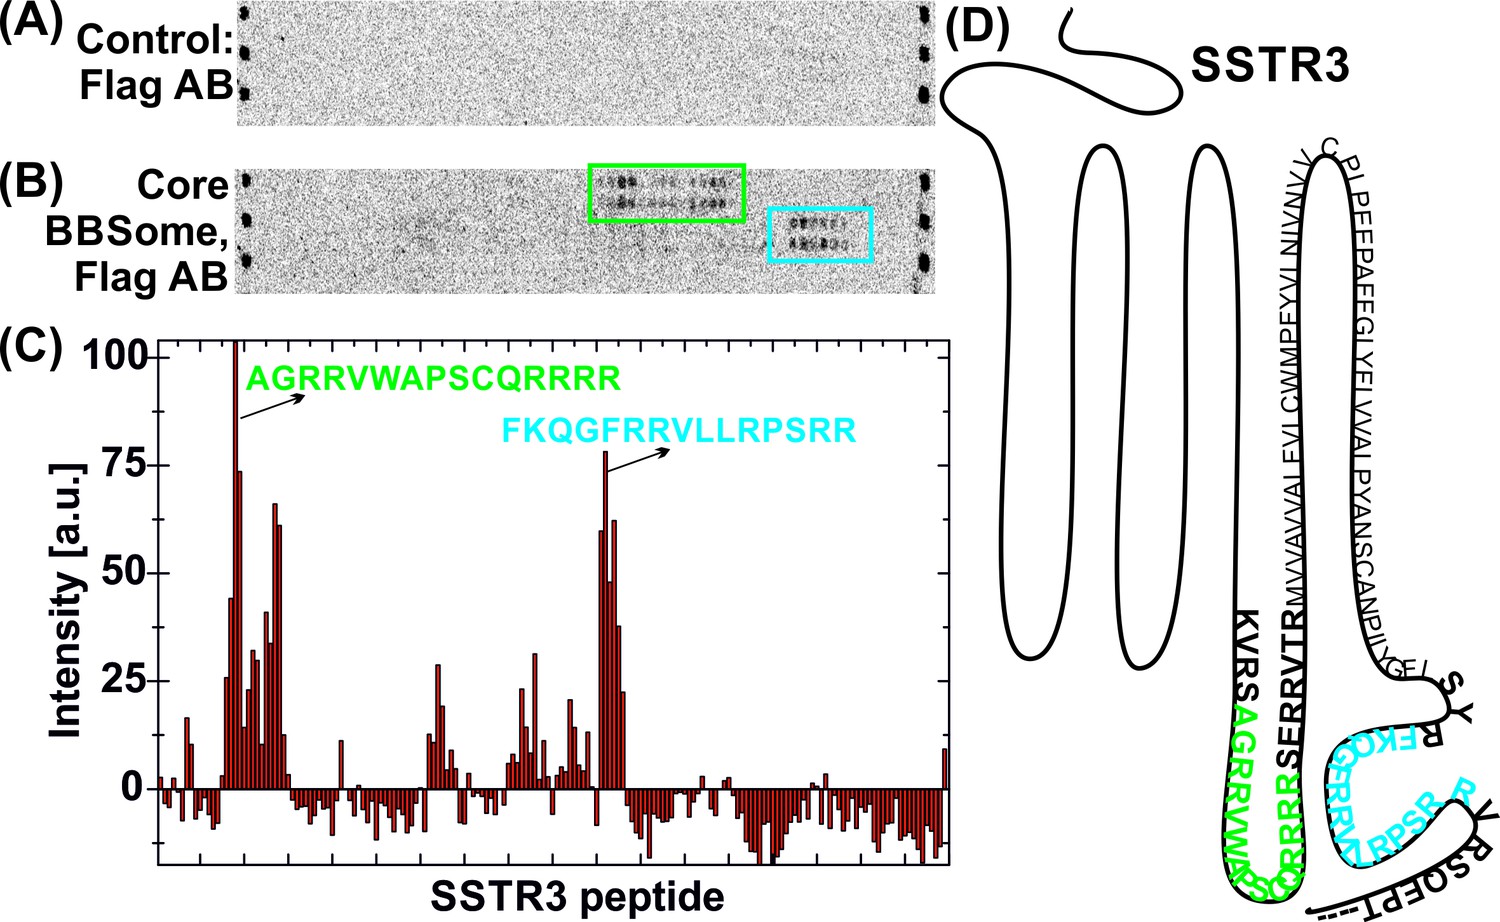
Interaction of core BBSome with SSTR3 peptides.
Immobilized 15-residue peptides of SSTR3 were incubated with Flag antibody alone (A) or with the core BBSome and subsequently with Flag-antibody (B). The Flag-antibody detected either the Flag-tag on the BBS8 subunit or the Flag control peptides located at the corners of the arrays. (C) Averaged and normalized intensity of the Flag-signal from (B). The positioning of the two strongest peptide hits is presented within a schematic SSTR3 plot (D).
Figure 4—figure supplement 1

Peptide microarray with core BBSome.
15-residue peptide fragments of different potential BBSome-binding proteins were immobilized on a microarray in duplicate and analyzed for their affinity to the core BBSome. The captured BBSome was detected by a fluorescent Flag-antibody (labelled with Dylight800, PepPerPrint, Germany) that was targeted to the Flag-tagged BBS8 subunit. As a control, the microarray was first incubated with Flag-antibody alone and the corresponding fluorescence image was used to identify any direct interactions of the antibody with immobilized peptides (yellow boxes indicate these potentially false-positive signals). Relevant BBSome interactions with the third intracellular loops of GPCRs are marked as blue boxes, while interactions with the C-terminal cytoplasmic domains are marked with green boxes.
Figure 5 with 2 supplements
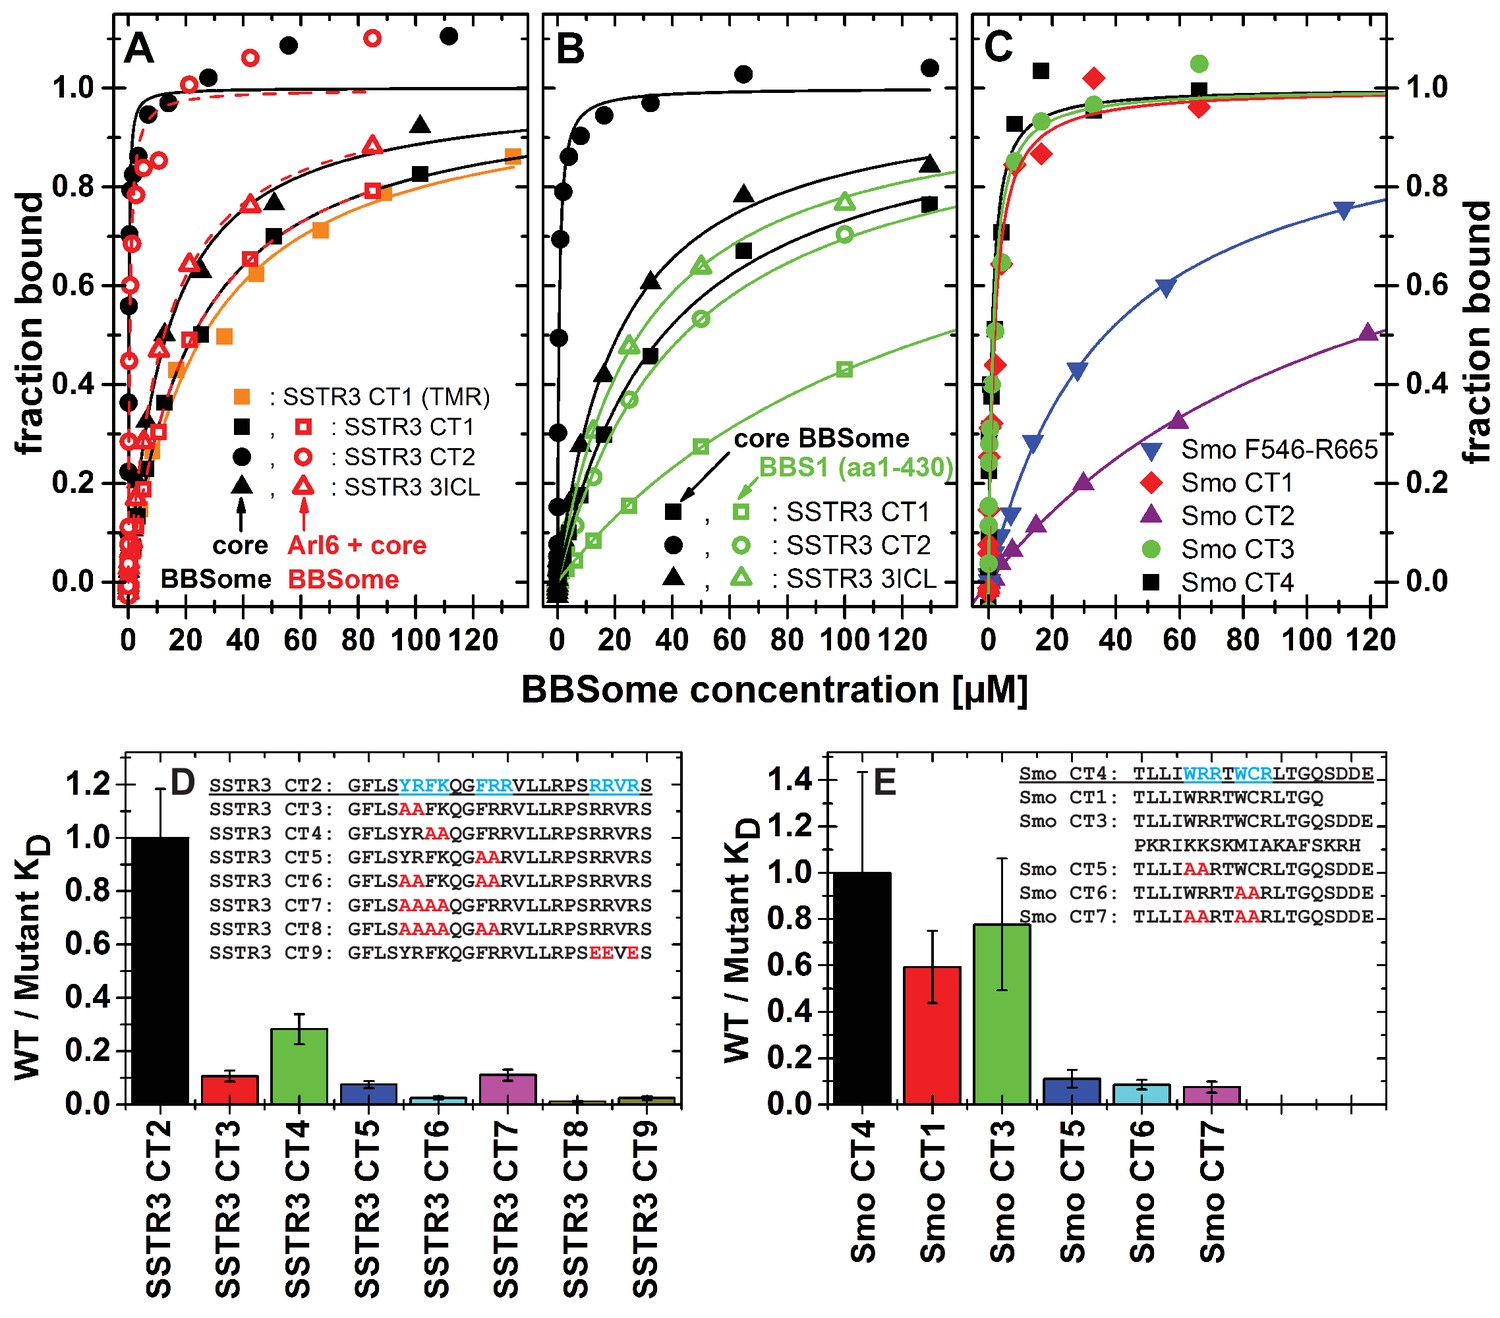
Cargo binding to the core BBSome with fluorescence polarization, measured by using fluorescently labeled peptides and the purified core BBSome.
(A,B) Fluorescent peptides, synthesized as described in methods, from the third intracellular loop of SSTR3 (SSTR3 CT1, SSTR3 CT2) or its C-terminal region (SSTR3 3ICL) were titrated with increasing concentrations of the core BBSome (filled black symbols) or equimolar mixtures of core BBSome with Arl6•GppNHp (open red symbols, A) or BBS1 (aa1-430) (open green symbols, B). All peptides were N-terminally labeled with fluorescein, with an exception of a C-terminally TMR-labeled SSTR3 CT1 peptide (orange squares) that was used as a control to exclude nonspecific binding events due to the used fluorophore. The increase in fluorescence polarization was fitted to a binding curve as described in the methods section, and the resulting maximal polarization from the fit was defined as 100% of peptide bound to the complex (fraction bound = 1). (Data points exceeding this mark might indicate secondary binding events at high BBSome concentrations). (C) Fluorescent peptides from the C-terminus of Smo (Smo CT1-4) and a truncated Smoothened construct (Smo F546-R665) were analyzed as described above. (D) The peptide SSTR3 CT2 that bound with highest affinity to the core BBSome was used as a template for the design and analysis of mutant peptides (SSTR3 CT3-9) with substitutions of one or multiple residues as indicated. Polarization experiments were performed as described above and dissociation constants (KD) are presented as ratios to the KD of the wild type peptide as a bar diagram. (E) Bar diagram of the relative affinities of SmoCT1 and CT3 relative to SmoCT4, as determined in C, and of mutant Smo CT4 peptides with substitutions as indicated.
Figure 5—figure supplement 1
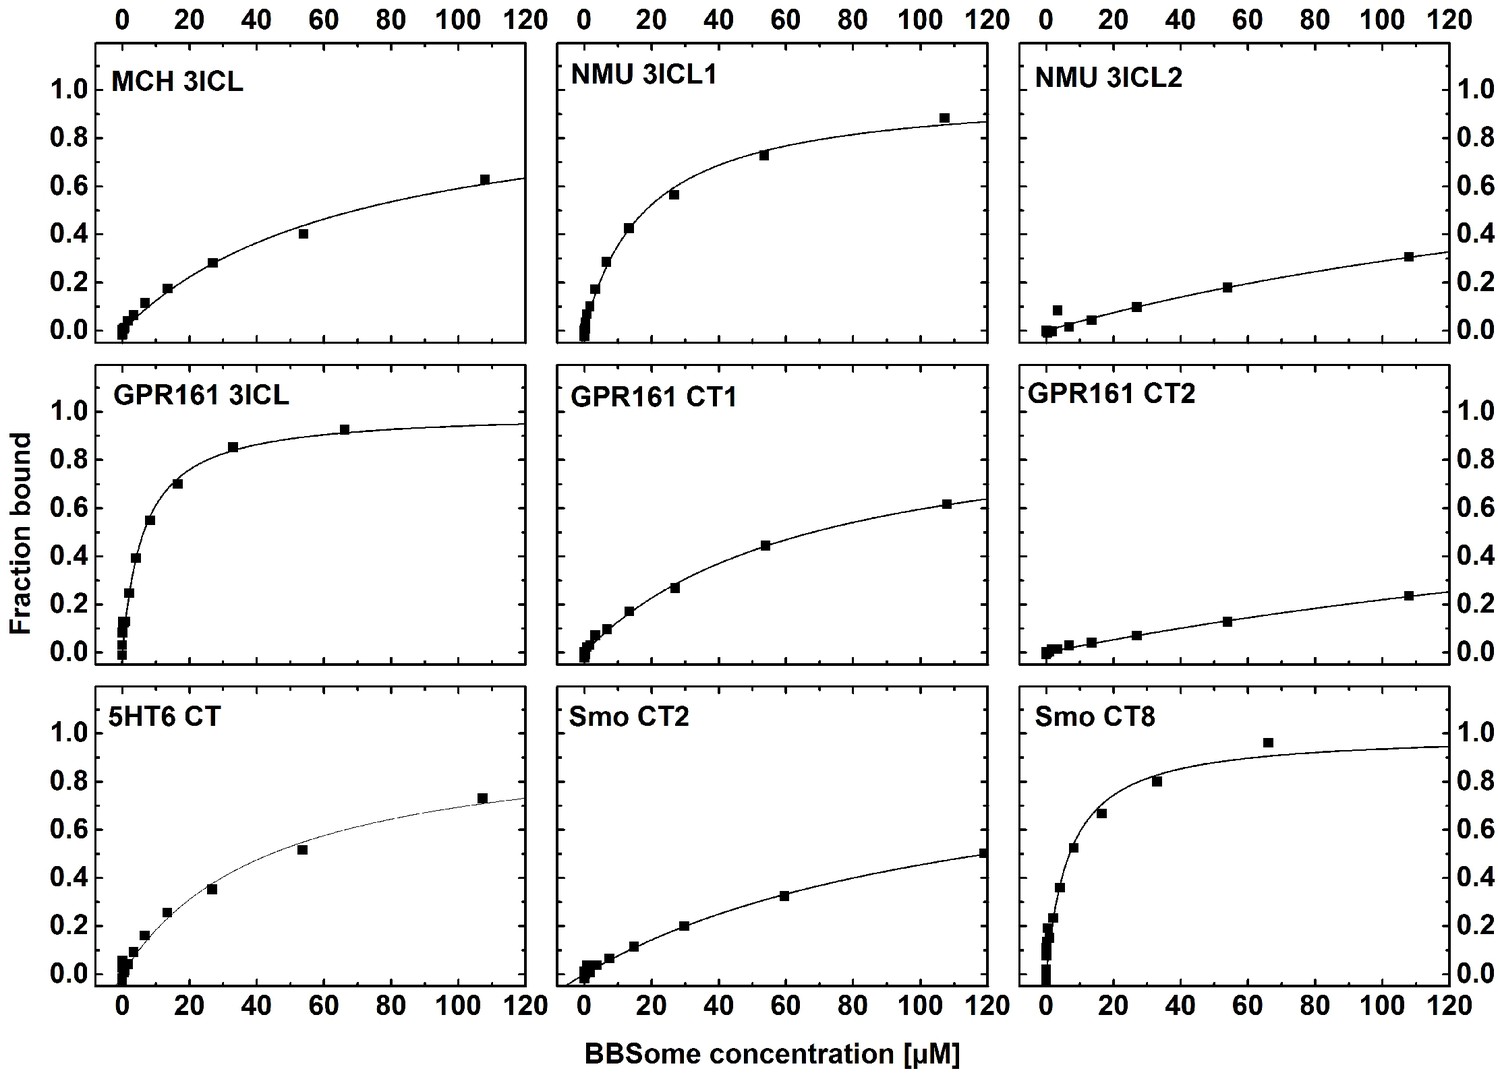
Cargo binding to the core BBSome.
Fluorescence polarization experiments with fluorescent peptides at concentrations of 0.1–1 µM. Core BBSome was added at the indicated concentrations and the increase in fluorescence polarization was monitored as a measure for the peptides binding to the protein complex. The binding curves were fit as described in the methods section, and the resulting maximal polarization from the fit was defined as 100% of the peptide bound to the complex (fraction bound = 1).
Figure 5—figure supplement 2
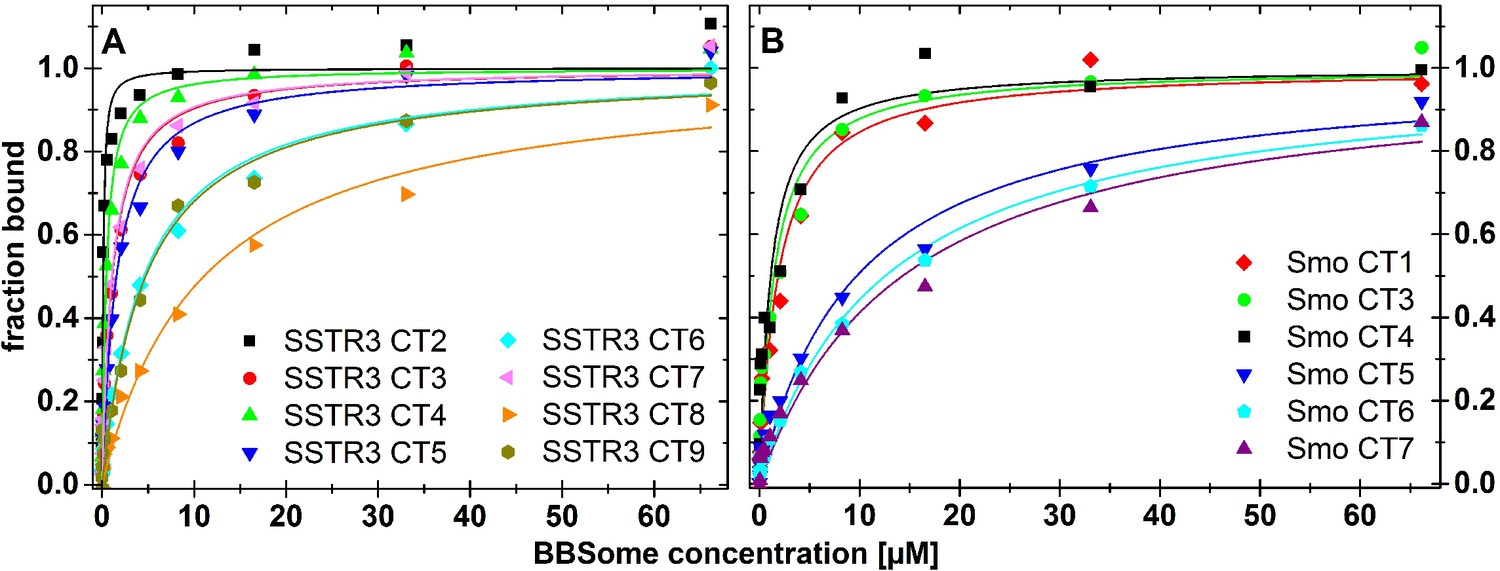
Mutational analysis of the BBSome binding peptides.
Fluorescence polarization experiments with fluorescent peptides at concentrations of 0.1 µM. The peptides SSTR3 CT2 (A) and of Smo CT4 (B) that bound with highest affinity to the core BBSome were used as templates for the design of mutant peptides with one or multiple aromatic/basic residue motifs changed to alanines as summarized in Table 1. Core BBSome was added at the indicated concentrations and the increase in fluorescence polarization was monitored as a measure for the peptides binding to the protein complex. The binding curves were fit as described in the methods section, and the resulting maximal polarization from the fit was defined as 100% of the peptide bound to the complex (fraction bound = 1).
Figure 6
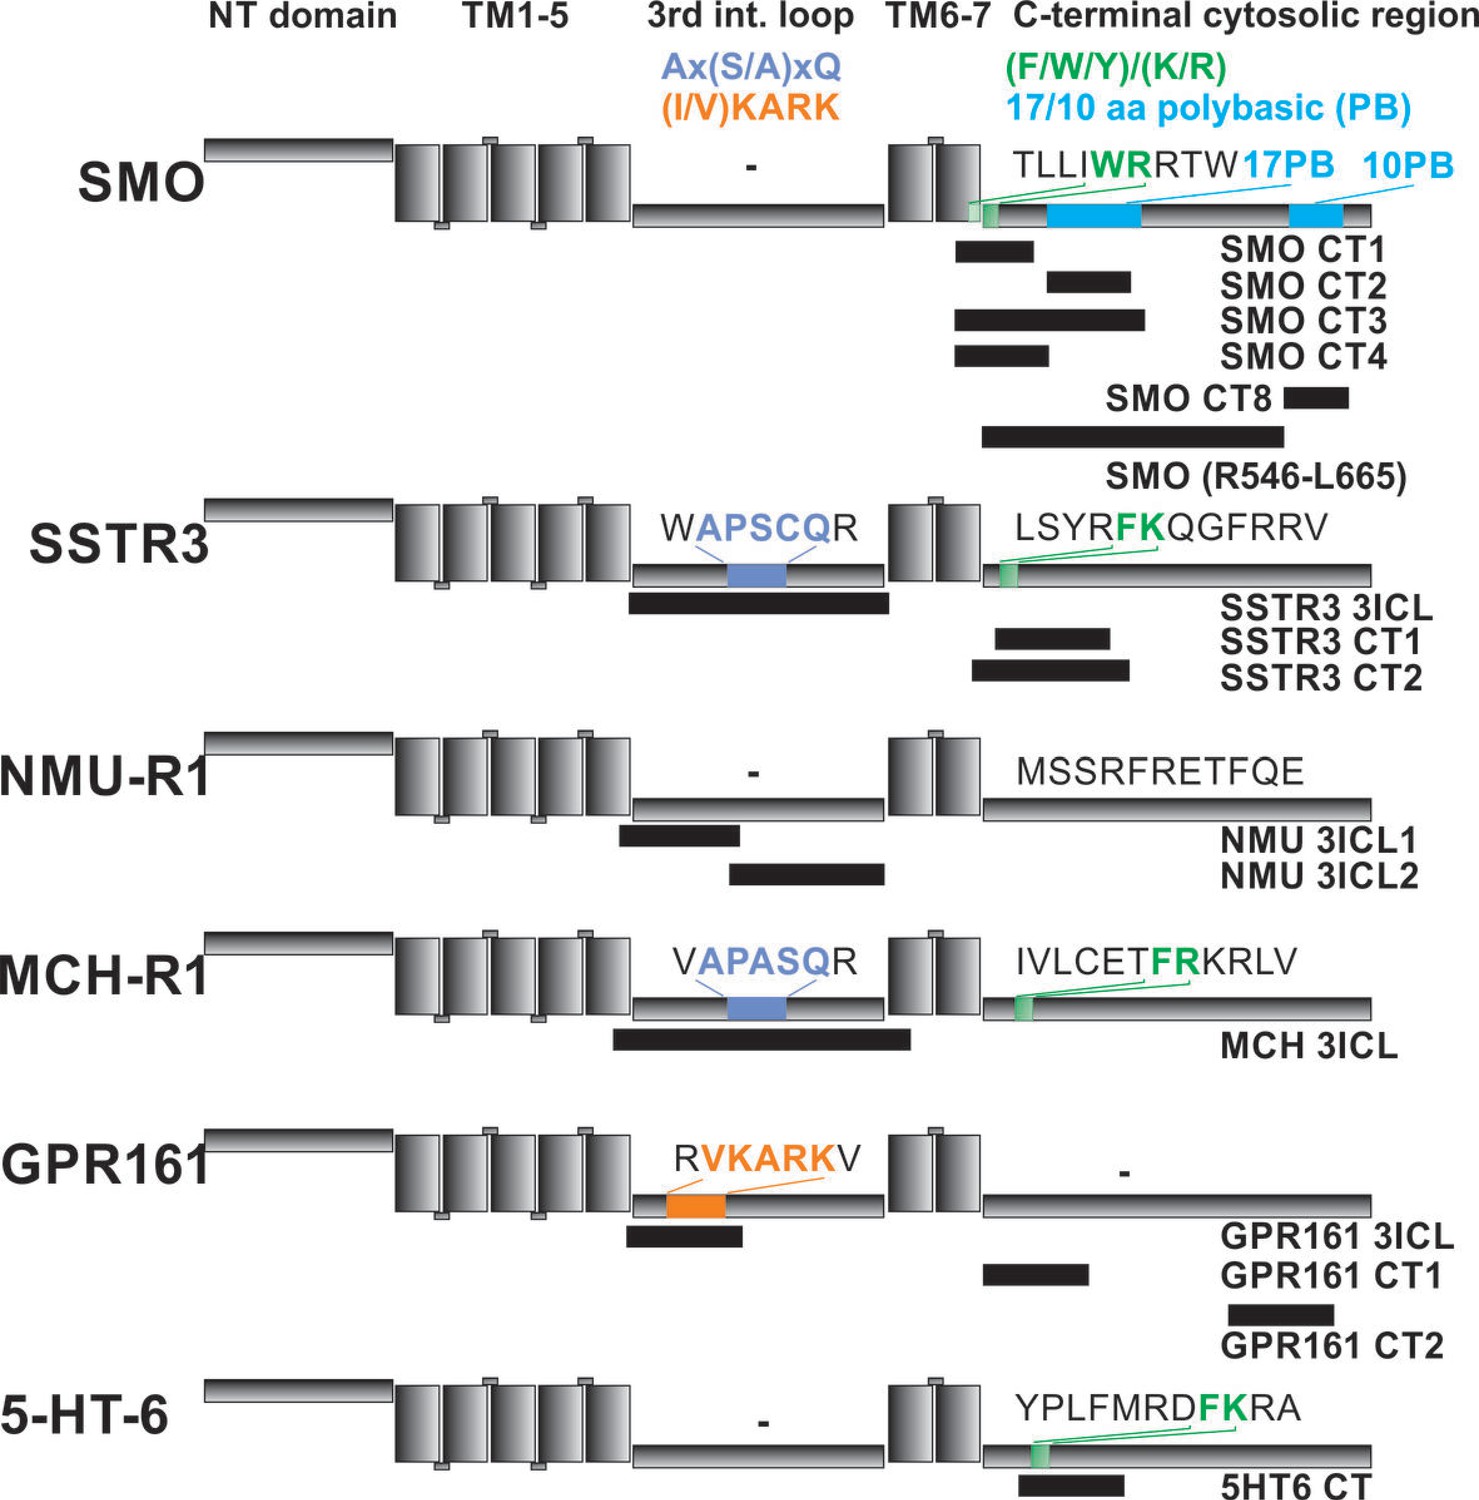
Localization of FITC-labeled peptides from various GPCRs used in binding studies and their relation to previously identified CTS motifs.
The schematic drawing of the analyzed GPCRs shows the structural elements: NT: N-terminal extracellular domain, TM: transmembrane helices, third intracellular loop and C-terminal cytosolic region). Peptides (for their full sequences see Table 1) were designed based on the results of the peptide microarray (Figure 4 and Figure 4—figure supplement 1), and were tested for binding to the core BBSome. Black blocks indicate the approximate position of the peptides relative to the primary sequence, with the corresponding names to the right. The sequences of polybasic regions in Smoothened and of known CTS motifs within the third loop and the C-terminal domain of each GPCR are highlighted in color.
Tables
Table 1
Interactions of GPCR peptides with the core BBSome.
https://doi.org/10.7554/eLife.27434.011| GPCR | Uniprot accession number | Tested residues | BBSome binding: trend from microarray | Validated peptides | Peptide sequences | KD [µM] |
|---|---|---|---|---|---|---|
| 5-HT-6 | P50406 | 195–440 | 3ICL: weak | not tested | ||
| CT: strong | 5HT6 CT | RDRALGRFLPCPRCPRER | 44.2 ± 10.9 | |||
| MCH-R1 | Q99705 | 288–422 | 3ICL: strong | MCH 3ICL | RILQRMTSSVRSIRLRTKRVTRT | 68.8 ± 11.3 |
| CT: weak | not tested | |||||
| NMU-R1 | Q9HB89 | 243–426 | 3ICL: strong | NMU 3ICL1 NMU 3ICL2 | LLIGLRLRRERLLLMQEAKGRG GRGSAAARSRYTCRLQQHDRGRRQ | 18.1 ± 1.6 >100 |
| CT: weak | not tested | |||||
| SSTR3 | P32745 | 44–418 | 3ICL: strong | SSTR3 3ICL | VKVRSAGRRVWRRRRSERRVTRM | 12.8 ± 1.07 |
| CT: medium | SSTR3 CT1 SSTR3 CT2 SSTR3 CT3 SSTR3 CT4 SSTR3 CT5 SSTR3 CT6 SSTR3 CT7 SSTR3 CT8 SSTR3 CT9 | RQGVLLRPS GFLSQGVLLRPSS GFLSQGVLLRPSS GFLSQGVLLRPSS GFLSQGVLLRPSS GFLSQGVLLRPSS GFLSQGVLLRPSS GFLSQGRVLLRPSS GFLSQGVLLRPSVS | 22.1 ± 1.4 0.11 ± 0.02 1.1 ± 0.2 0.40 ± 0.08 1.5 ± 0.3 4.5 ± 1.1 1.0 ± 0.2 11.0 ± 3.3 4.7 ± 1.4 | |||
| Smo | Q99835 | 234–787 | 3ICL: weak | not tested | ||
| CT: strong | Smo CT1 Smo CT2 Smo CT3 Smo CT4 Smo CT5 Smo CT6 Smo CT7 Smo CT8 Smo (R546-L665) | TLLITLTGQ KRIKKSKMIAKAFSK TLLITLTGQSDDEPKRIKKSKMIAKAFSKRH TLLITLTGQSDDE TLLITLTGQSDDE TLLITLTGQSDDE TLLIRTRLTGQSDDE KRLGRKKKRRKRKKE R546-L665 | 1.8 ± 0.5 >100 1.4 ± 0.5 1.1 ± 0.5 9.7 ± 3.3 12.5 ± 3.0 14.3 ± 4.7 6.8 ± 2.5 36.1 ± 3.9 | |||
| GPR161 | Q8N6U8 | 31–529 | 3ICL: strong | GPR161 3ICL | FIFRVARVHCG | 6.3 ± 1.5 |
| CT: strong | GPR161 CT1 GPR161 CT2 | NKTVRKELLGMCFGDRYYREPFVQRQR VTARTVPGGGFGGRRGSRTLVS | 67.4 ± 7.3 >100 |
-
Summary of qualitative and quantitative analysis of binding data for peptides, indicated by their sequence, from those GPCRs for which significant BBSome interactions were found in the peptide microarrays and analyzed for affinity by fluorescence polarization. Basic/aromatic residues in SSTR3 and Smo were mutated to alanine are shown in red, and the corresponding wild type sequences in purple. Previously described CTS sequences are marked in blue (; Mukhopadhyay et al., 2013; Zhang et al., 2012a).
Additional files
-
Transparent reporting form
- https://doi.org/10.7554/eLife.27434.016
Download links
A two-part list of links to download the article, or parts of the article, in various formats.
Downloads (link to download the article as PDF)
Open citations (links to open the citations from this article in various online reference manager services)
Cite this article (links to download the citations from this article in formats compatible with various reference manager tools)
A recombinant BBSome core complex and how it interacts with ciliary cargo
eLife 6:e27434.
https://doi.org/10.7554/eLife.27434


