Regulation of sleep homeostasis by sexual arousal
- Imperial College London, United Kingdom
Figures
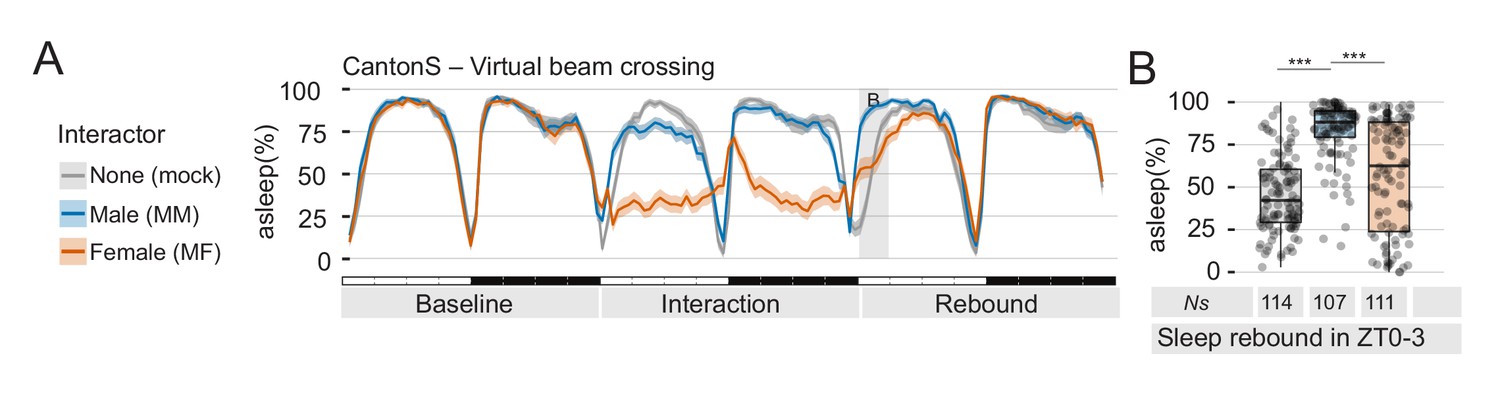
Figure 1 with 3 supplements

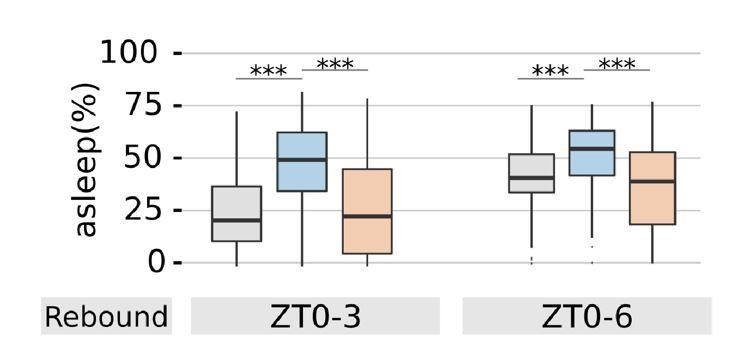
Social interaction leads to paradoxical effects on sleep rebound.
(A) Sleep profile of socially isolated male CantonS flies that were forced to interact for 24 hr with wild-type virgin females (MF, peach), white eyed males (MM, cyan) or sham manipulated (mock, grey). The shaded grey background indicate the area analysed in B, C and D. The vertical dash line indicates the time point for brain dissections shown in E,F. (B) Quantification of sleep rebound during ZT0-3 on rebound day for the experiments shown in A. Ns under the bar plots indicate the number of animals used. (C) Quantification of sleep amount on the interaction day for flies shown in A. On interaction day, mock were estimated to be asleep 40.6 ± 13% of the time; MM 16 ± 8%; MF 1.1 ± 2% – mean ±SD. (D) Representative behavioural classification of the interaction day for MM coupling (upper panel n = 11) or MF coupling (lower panel n = 11). Each row shows the behavioural profile of a male during 24 hr of social interaction. (E) Representative image of whole-mount anti-GFP immunostained flies expressing CaLexA in the ellipsoid bodies using the R30G03 driver. Scale bar 10 µm. (F) Quantification of the experiment in E. In all figures, * indicates a p<0.05; **p<0.01; ***p<0.001 – pairwise Wilcoxon rank sum test with Benjamini and Hochberg correction. In all ethograms, the dark coloured lines indicate the mean values for sleep while the opaque borders indicate 95% bootstrap resampling confidence interval (see Materials and methods).
Figure 1—figure supplement 1
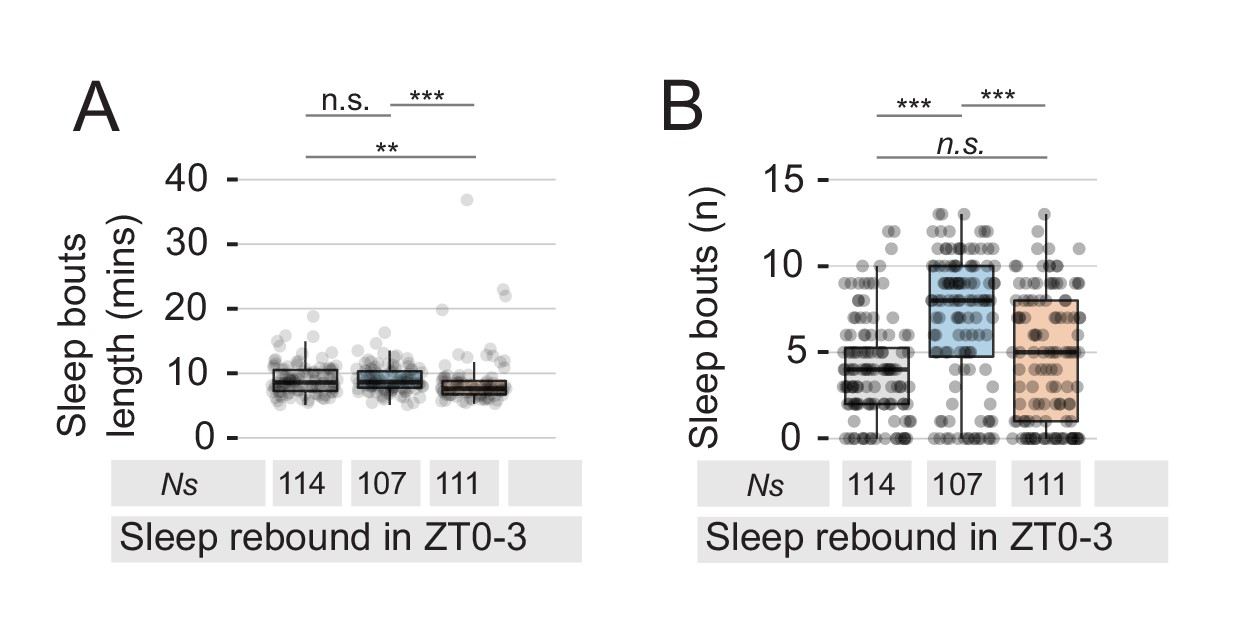
Analysis of sleep rebound.
(A) The mean length of sleep bouts in the window ZT0-3 is reduced after MF interaction but not after MM interaction (Mock: 9.11 ± 0.24; MM: 9.07 ± 0.19; MF: 8.48 ± 0.29; mean minutes ± SE). (B) The number of sleep episodes is increased after MM, but not after MF interaction (Mock: 4.03 ± 0.27; MM: 7.55 ± 0.37; MF: 4.75 ± 0.35; mean ±SE).
Figure 1—figure supplement 2
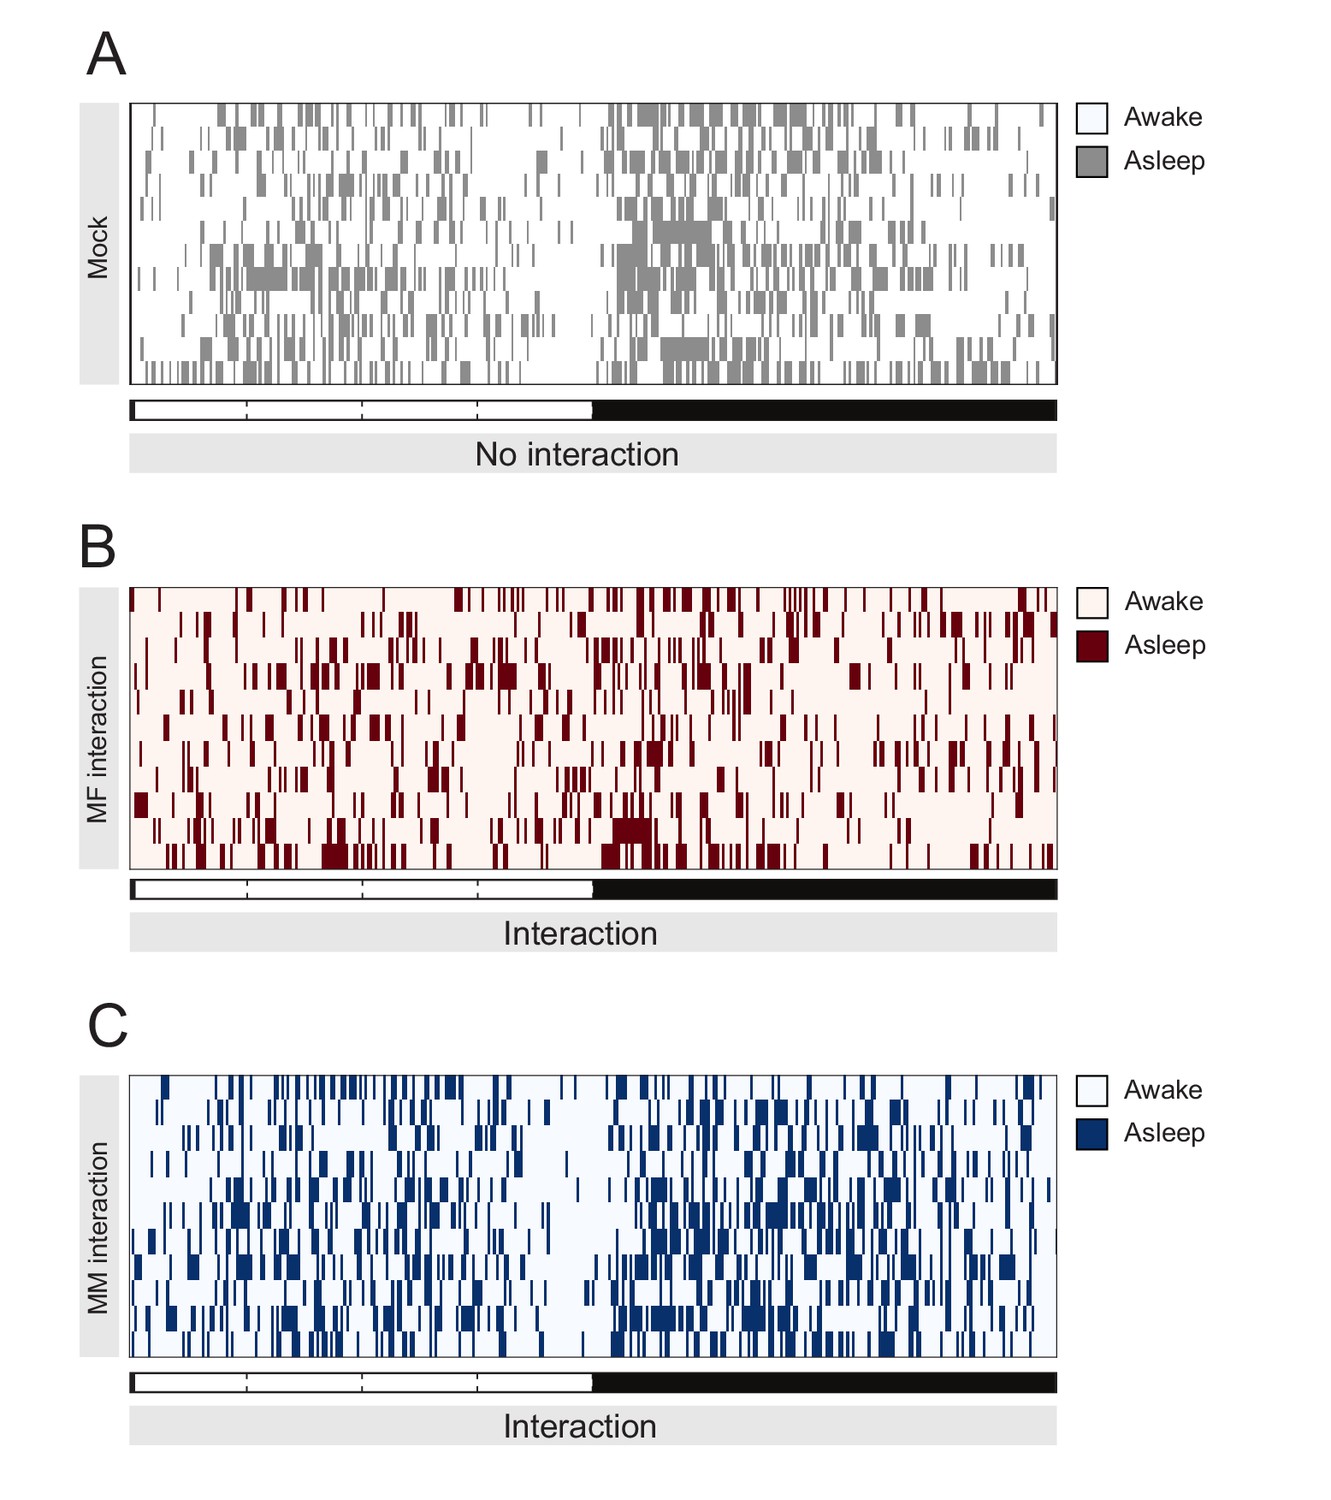
Human assisted behavioural scoring of single fly sleep in Mock, solitary condition (A), during MF interaction (B), or MM interaction (C) to validate automatic scoring.
Fly position was scored once every 240 s and bins with movement smaller than half a fly body size (30 pixels) were scored as asleep. Each row shows data for a single male fly.
Figure 1—figure supplement 3
DAM data of the main archetypical phenotype of this work, published for sake of reproducibility.
Activity and sleep were calculated using the infrared beam split criteria (virtual beam split). This figure shows what users should expect when running the same paradigm in Trikinetics monitors (Trikinetics inc.).
Figure 2 with 2 supplements
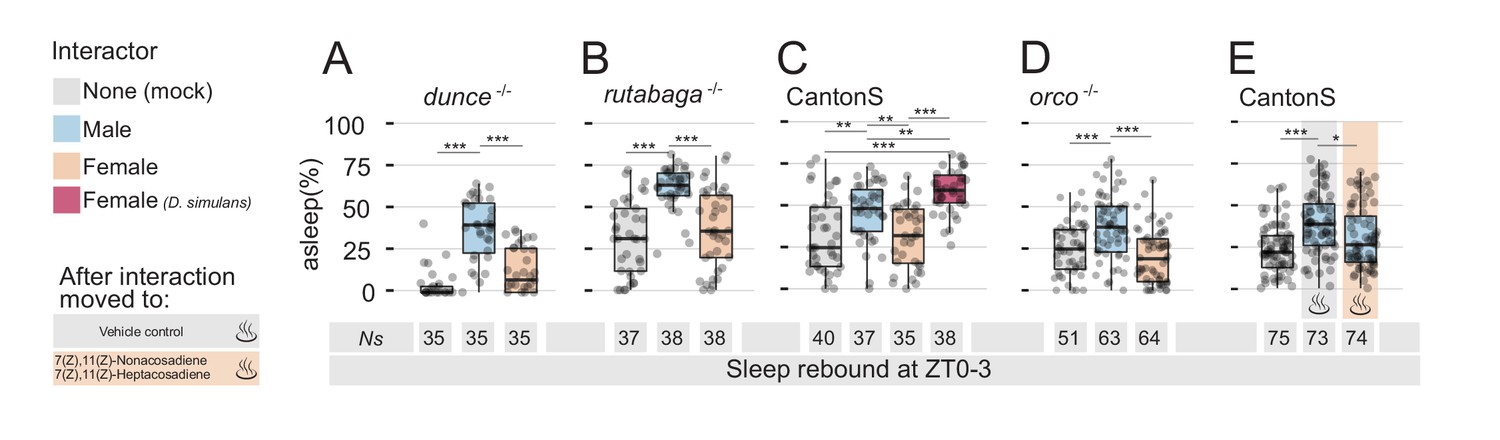
Detection of non-volatile female pheromones is sufficient to suppress sleep rebound after sleep deprivation.
All graphs show quantification of sleep rebound during ZT0-3 on rebound day. Total number of animals is shown under the box plots. Rebound sleep in the memory defective dunce1 (A) and in rutabaga1 (B) mutants after Mock, MM, or MF. Legend on the left of (A) applies to the entire figure. (C) CantonS male flies after 24 hr of interaction with other males, D. melanogaster females, D. simulans females or in mock control. (D) Rebound sleep in anosmic orco1 mutants after Mock interaction, MM, or MF. (E) CantonS male flies after mock interaction or interaction with white eyed males followed, at rebound, by vehicle control or by female pheromones.
Figure 2—figure supplement 1
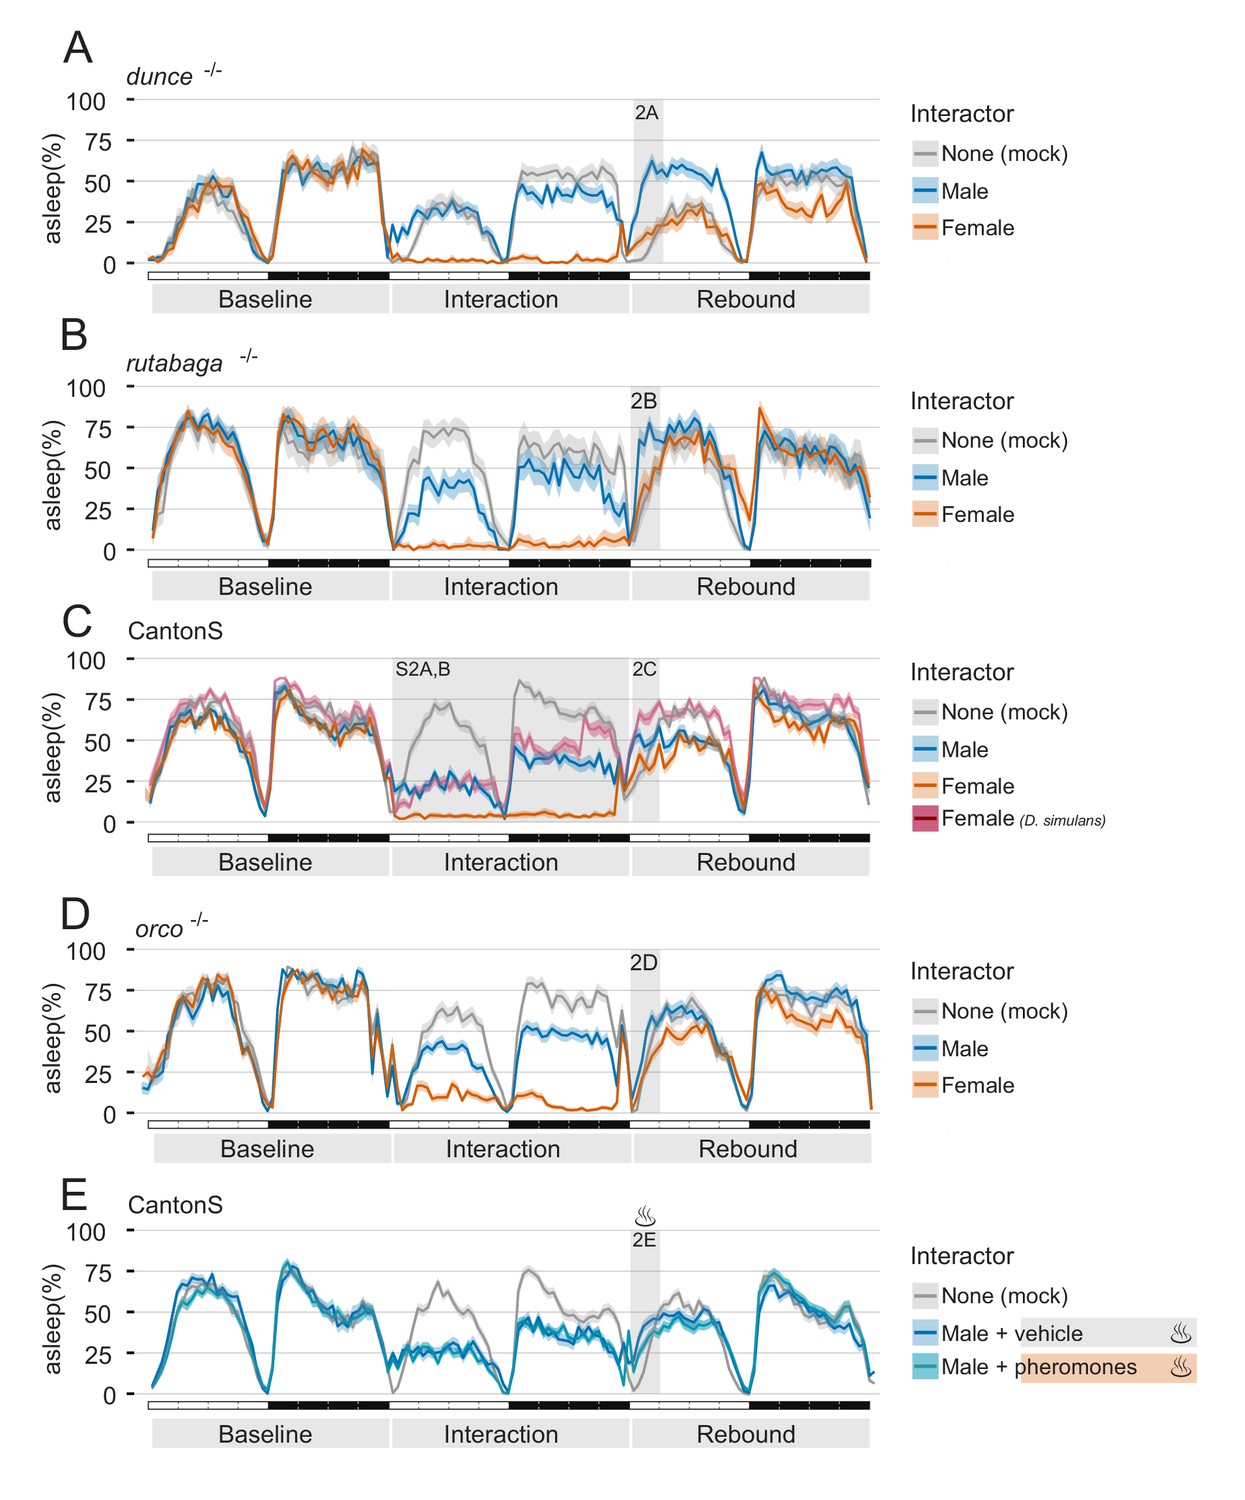
Three day sleep ethograms of the experiments described in Figure 2.
The graphs include one day of baseline, one day of interaction and one day of recovery. In all panels, the grey area indicates the correspondent window of data shown in Figure 2. Effects of MM and MF interaction in the memory mutants of the dunce (A) and rutabaga (B) genes. (C) Effects of interaction between CantonS males and wild type females (peach), wild type males (cyan) or wild type D. simulans females (mauve). (D) Same experimental paradigm, in anosmic orco1 mutant males. (E) CantonS male flies after mock interaction or interaction with white eyed males followed, at rebound, by vehicle control (dark blue) or by female pheromones (light blue).
Figure 2—figure supplement 2
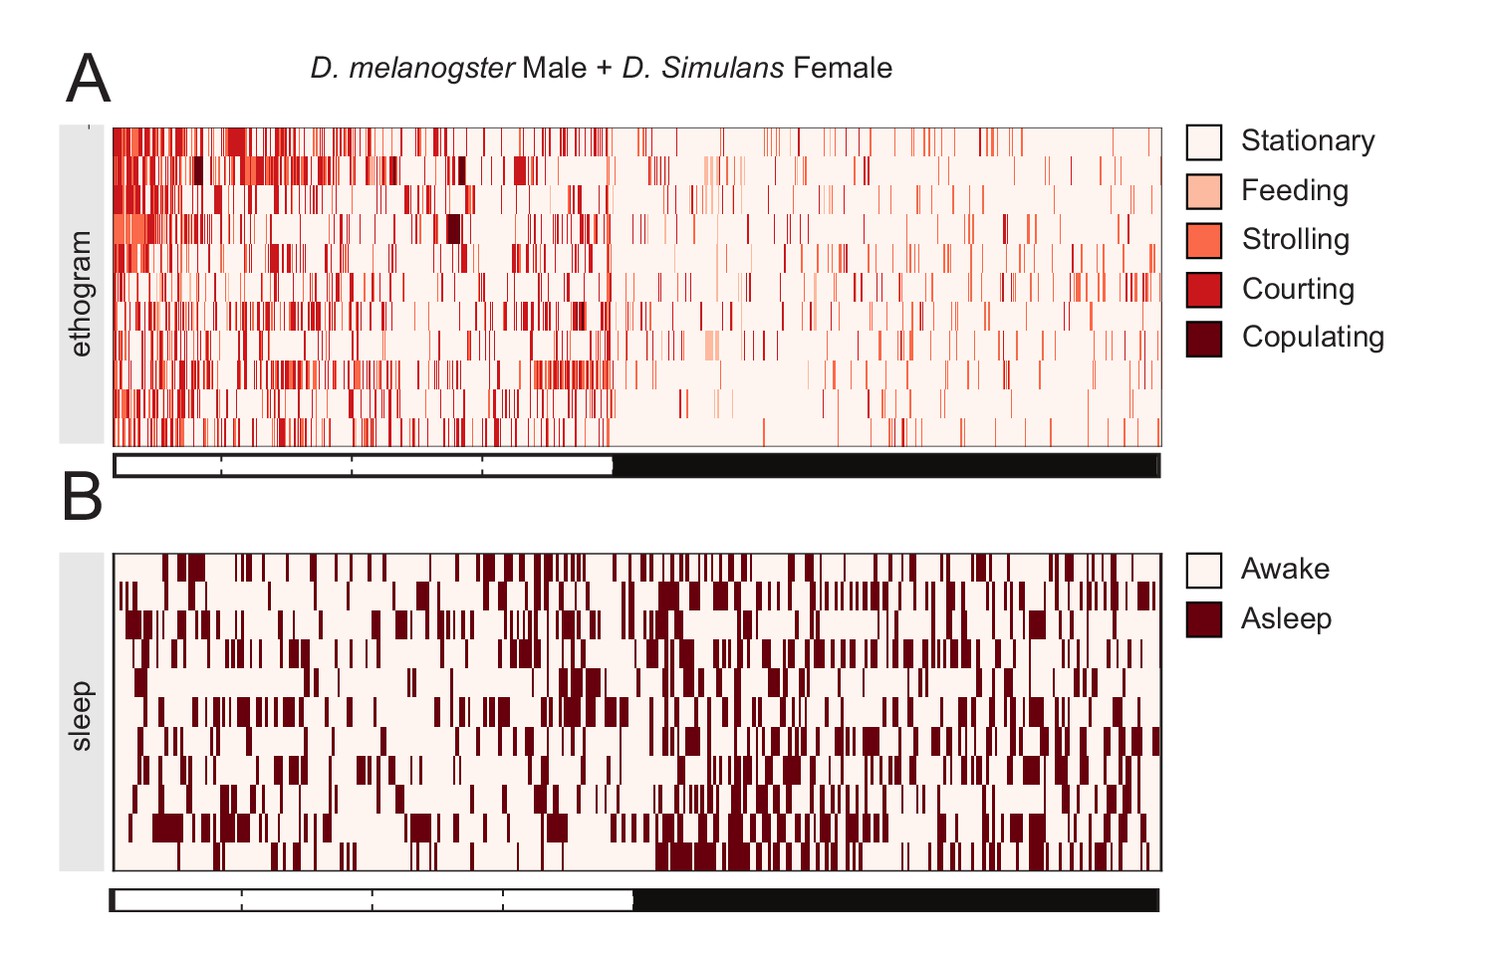
Inter-specific male-female interaction.
(A) Representative behavioural classification of the interaction day for coupling of a male D. melanogaster with a female D. Simulans (N = 11). Each row shows the behavioural profile of a male during 24 hr of social interaction. (B) Human assisted behavioural scoring of single male fly sleep of the same data set shown in A.
Figure 3
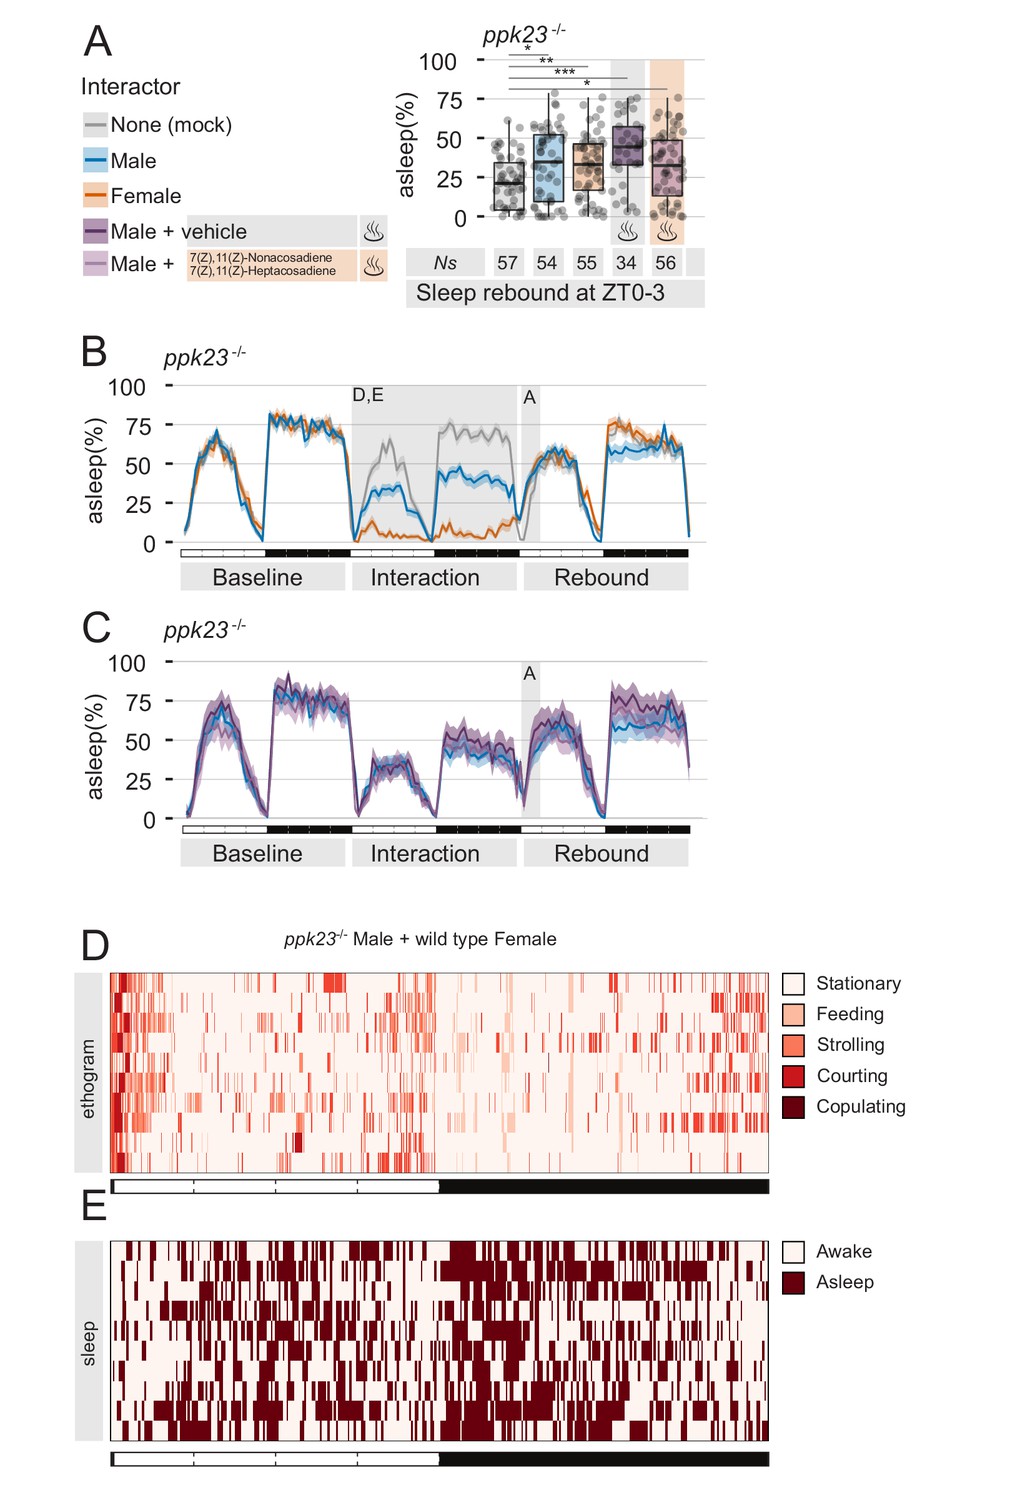
The pheromone receptor Ppk23 is necessary for sleep suppression after sleep deprivation.
(A) Rebound during ZT0-3 in ppk23Δ mutants after Mock interaction, MM, MF, MM followed by control vehicle, or MM followed by female pheromones. Legend on the left applies to A,B,C. (B,C) Three day sleep ethograms of the experimental conditions shown in (A). The data are split in two panels for sake of visualisation. The same MM line (blue) is reproduced in both. (D) Representative behavioural classification obtained with human scoring in MF interaction between ppk23Δ mutant males and wild type females. Compare with wild-type MF in Figure 1D. (E) Human scoring of single fly sleep for a subset (N = 10) of the flies shown in C.
Figure 4
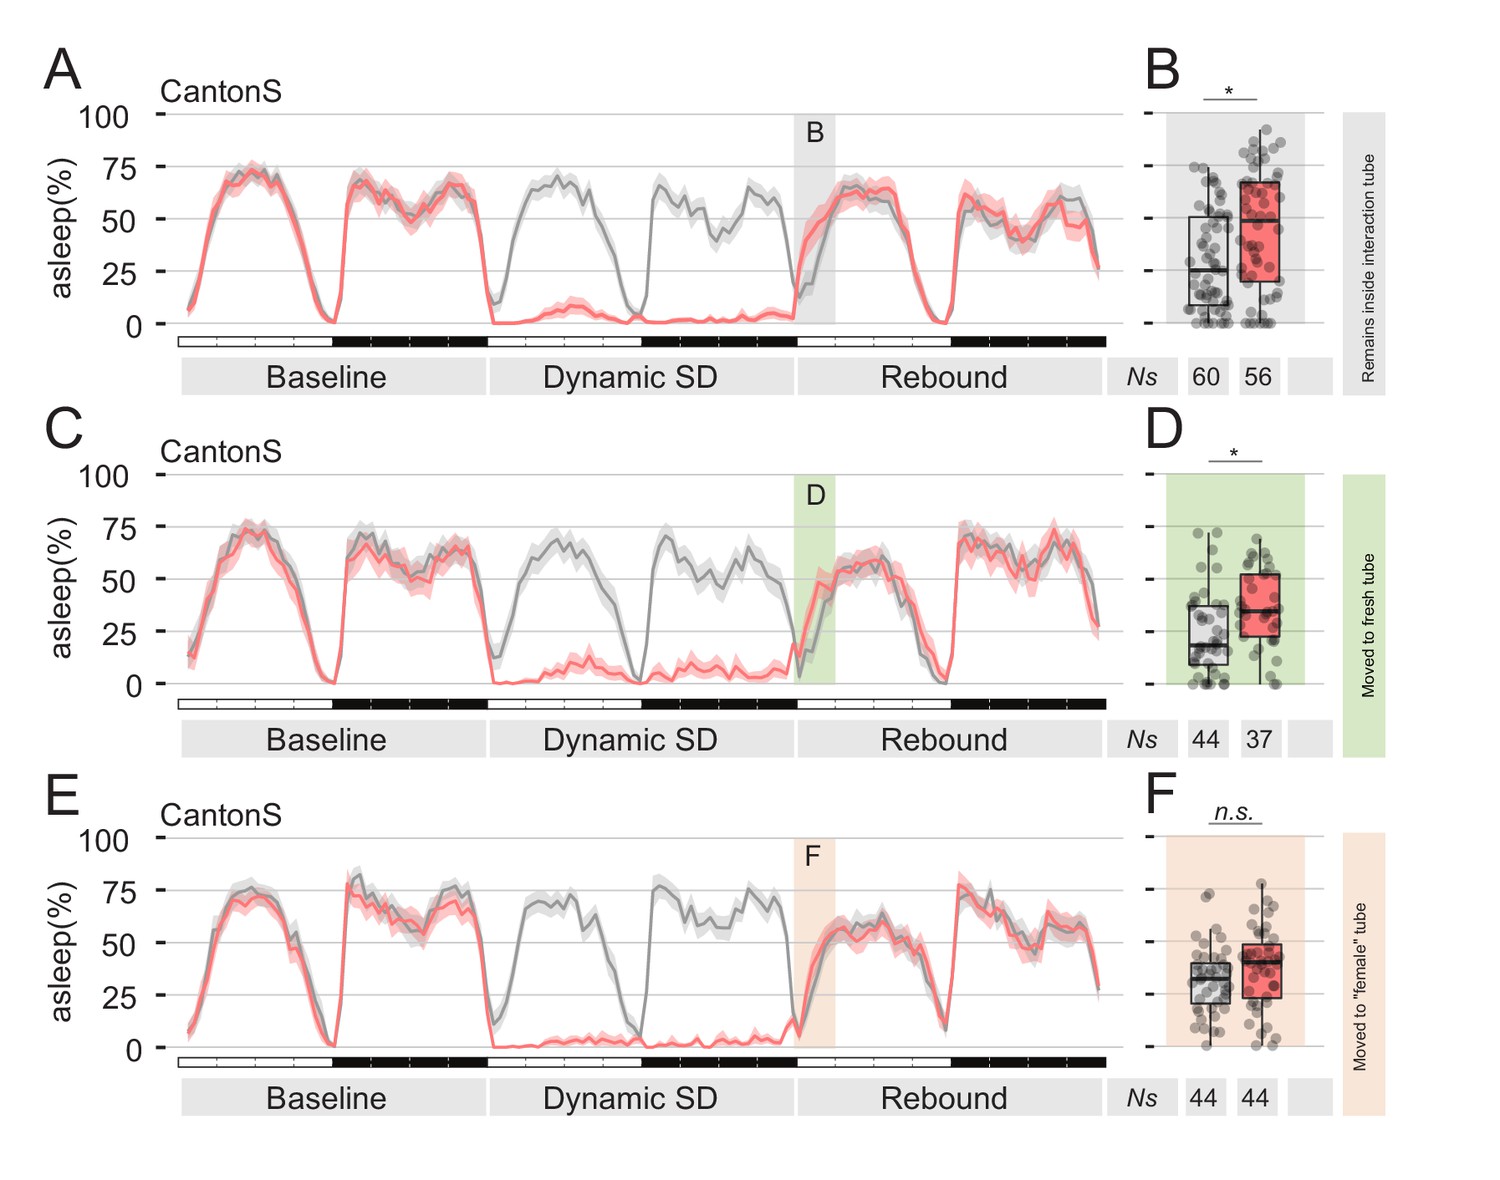
Presence of female pheromones is sufficient to suppress sleep rebound after sleep deprivation.
(A,C,E) Sleep profile of Cantons S flies that, immediately after sleep deprivation, were sham transferred into the same tube (A), into a clean fresh tube (C), or into an empty tube were a virgin female fly was previously housed for 24 hr (E, ‘female tube’). In all panels, grey lines show mock conditions that underwent the same treatment but were not sleep deprived. (B, D and F) Quantification of ZT0-3 rebound for A, C, and E respectively.
Figure 5 with 1 supplement
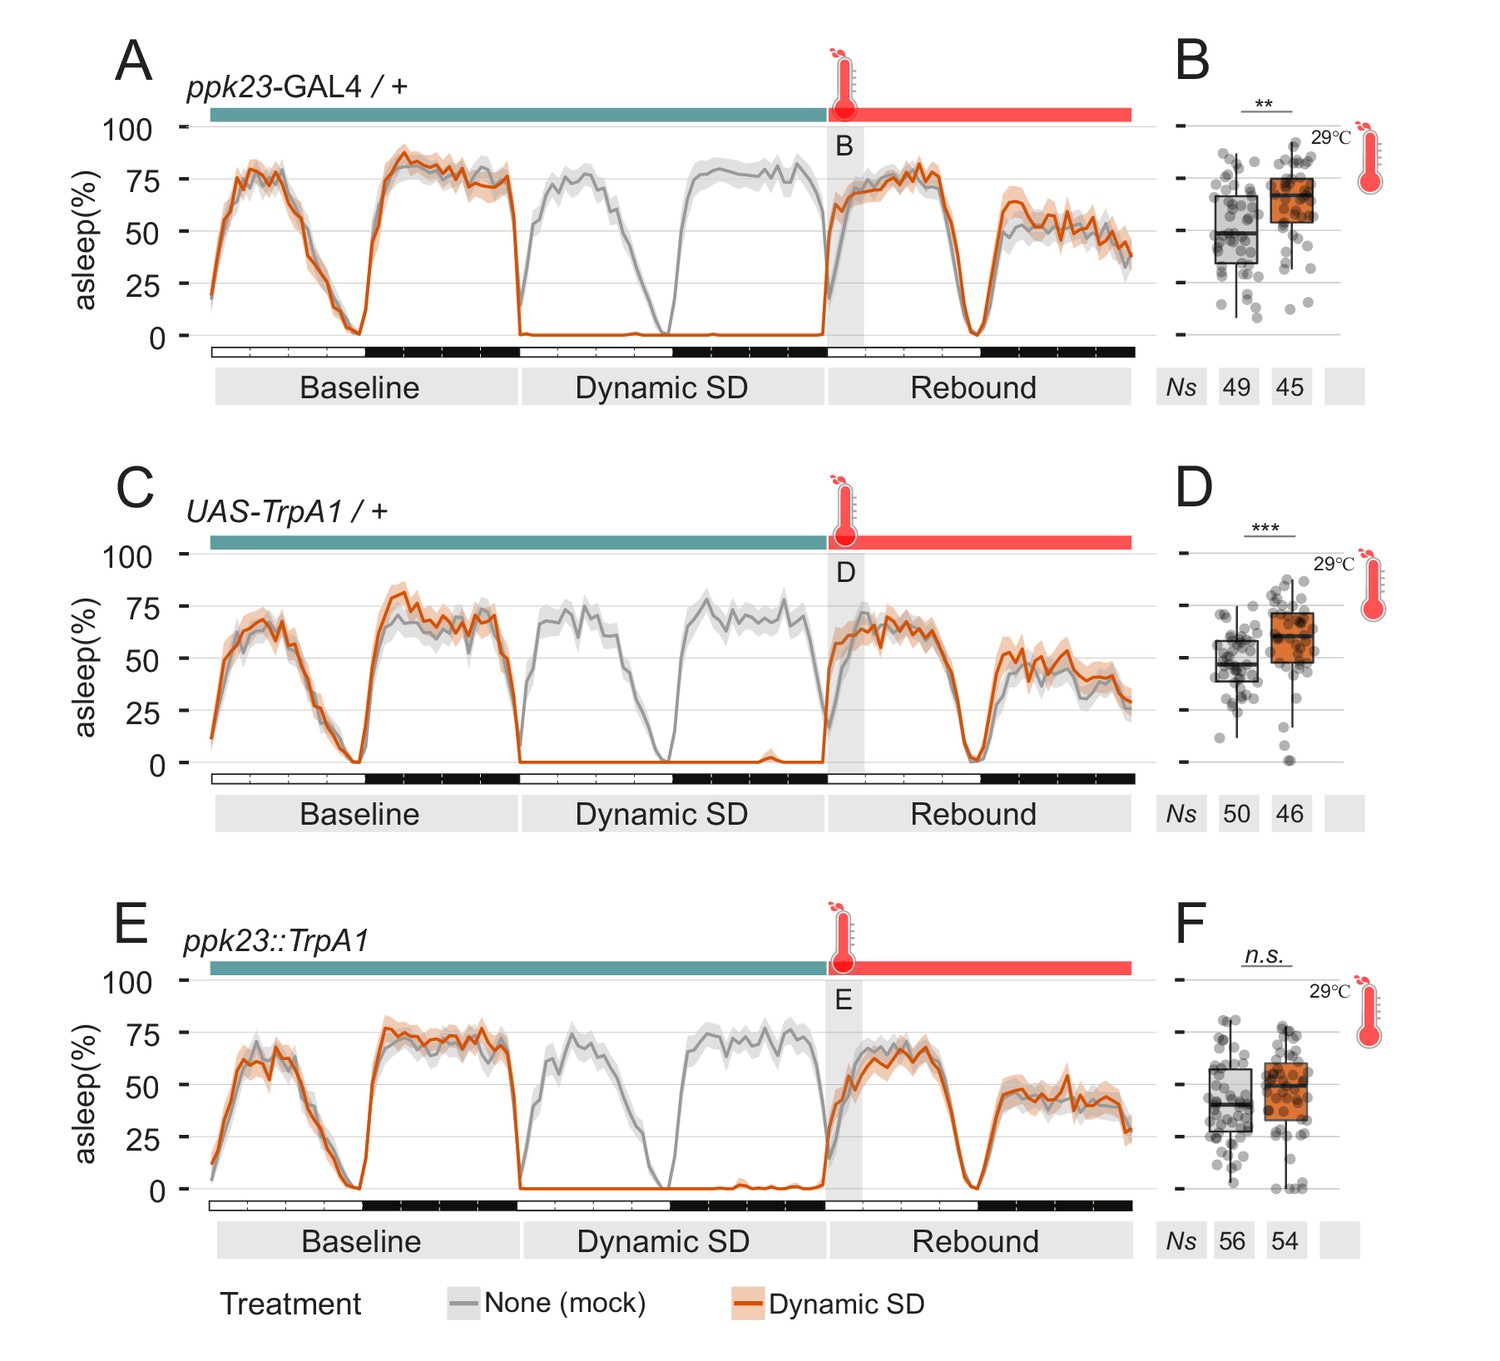
Manipulation of pheromones sensing cells is sufficient to suppress sleep.
(A–D) Parental control genotypes (E,F) flies expressing the thermo-activated channel TrpA1 under control of ppk23 GAL4. Red traces indicate the sleep pattern of flies subjected to mechanical sleep deprivation at the non-activating temperature (22°C); during rebound time ZT0-3, temperature was raised to 29°C. Grey lines indicate the sleep profile of mock control flies that underwent the same temperature treatment but were not sleep deprived. (B, D, F) Quantification of sleep rebound during ZT0-3 of rebound day for flies shown in A, C, and E, respectively.
Figure 5—figure supplement 1
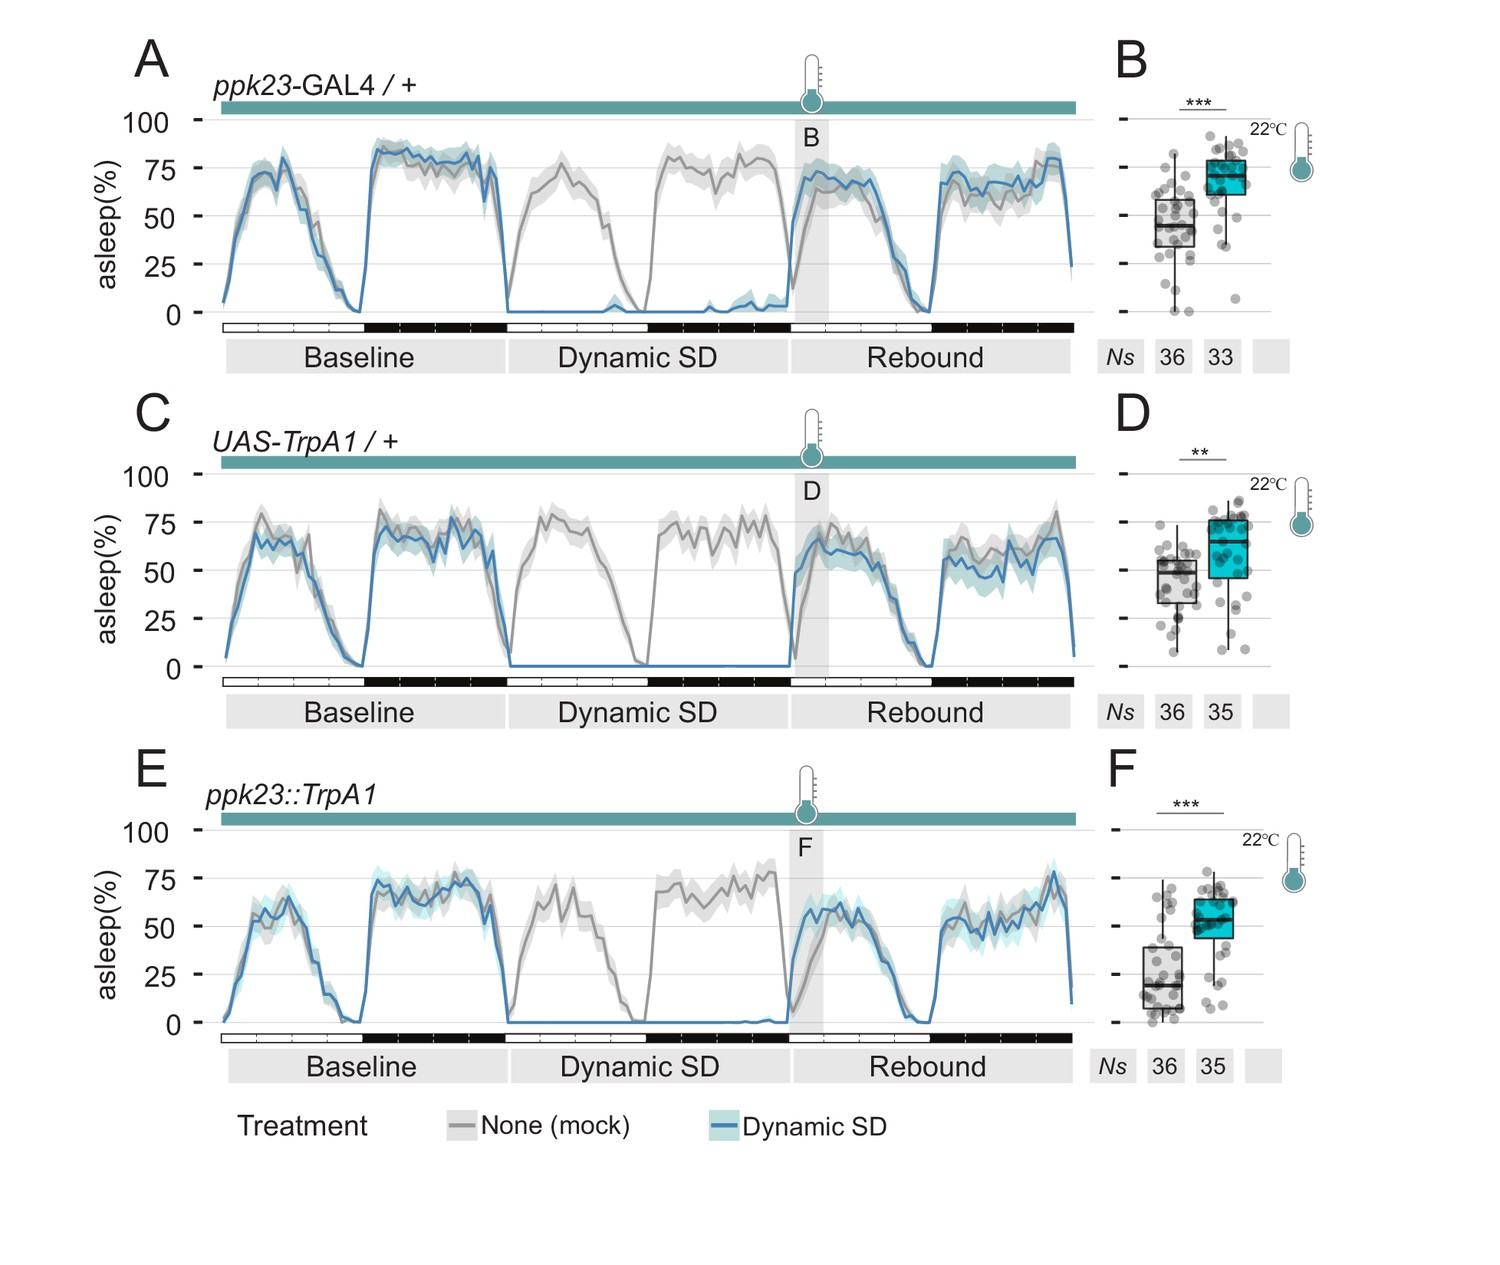
Temperature control conditions for experiments shown in Figure 5.
(A, C, E) Same genotypes and treatment shown in Figure 5. Temperature is kept constant at 22°C for the length of the experiment. (B, D, F) Quantification of sleep rebound during ZT0-3 of rebound day for flies shown in A, C, E respectively.
Figure 6
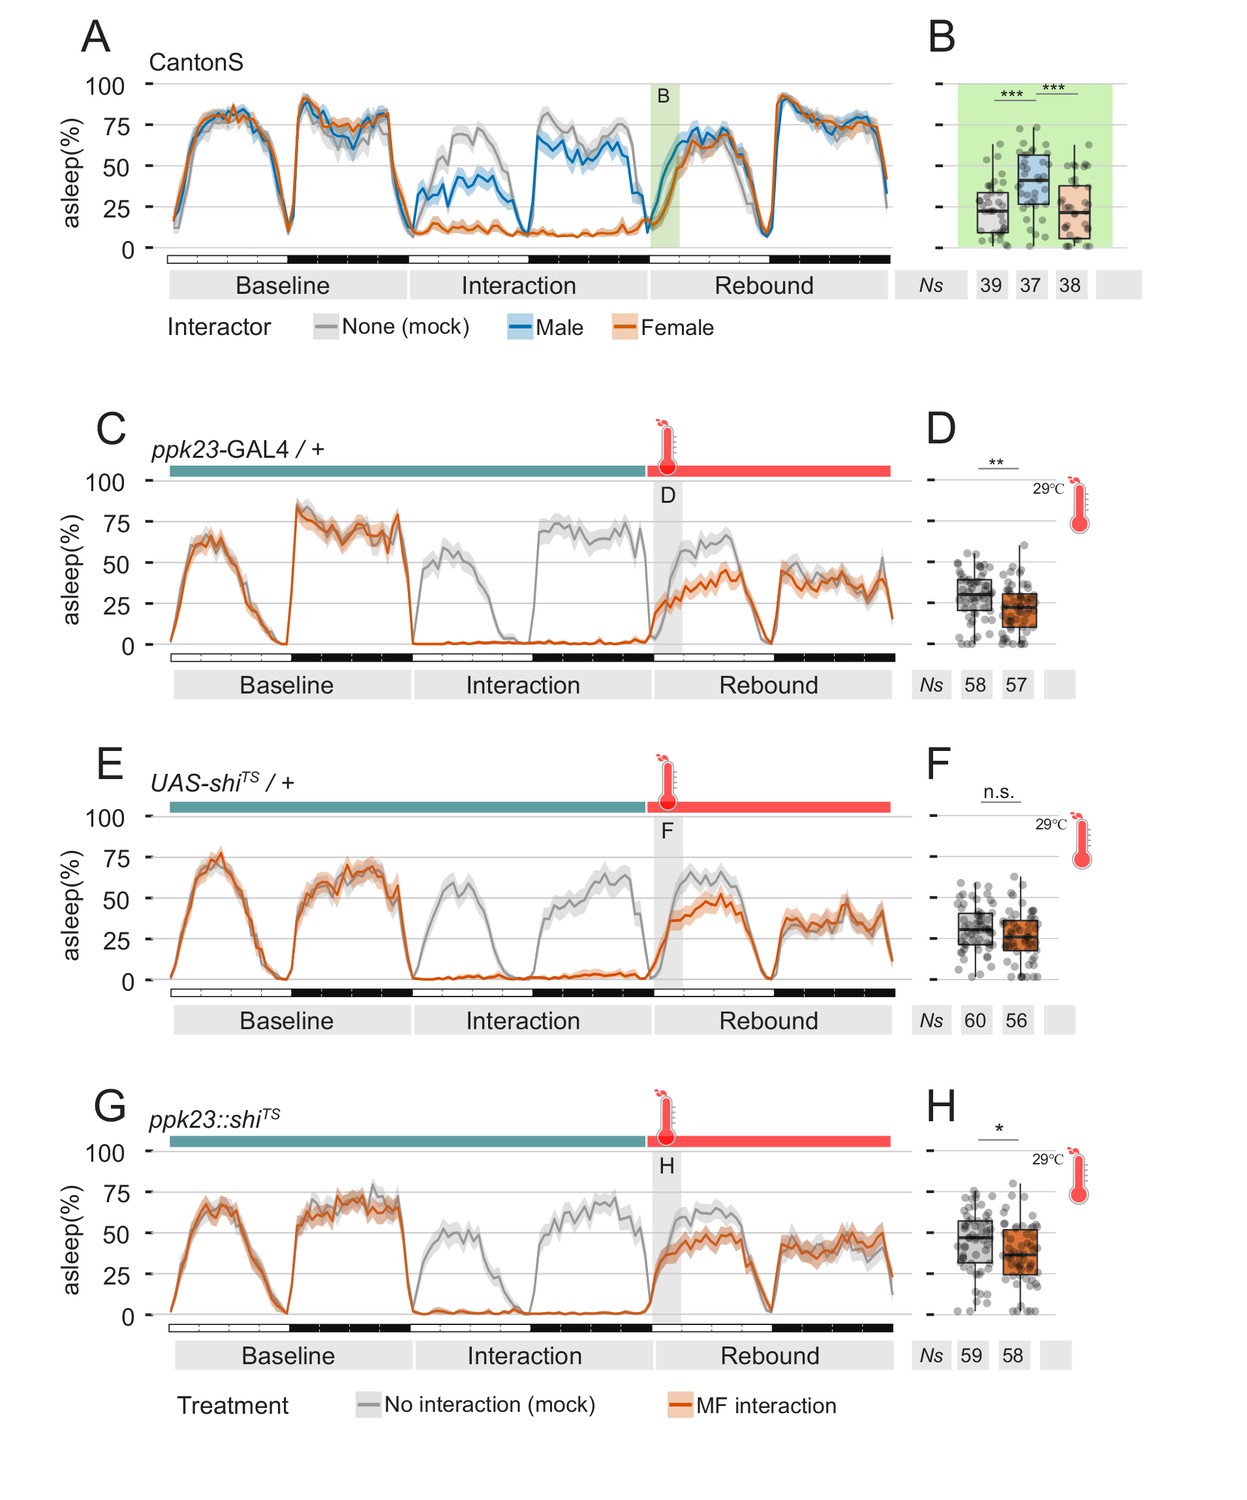
Perception of female pheromones after social interaction is not required to suppress sleep.
(A) Three day sleep profile of CantonS flies, showing baseline day, interaction day and rebound day. At the end of interaction day, flies were mock transferred into a clean, fresh tube. (B) Quantification of rebound at ZT0-3 for the experiment shown in A. (C–H) Inactivation of ppk23 cells during rebound does not rescue the sleep phenotype. Parental control genotypes (C–E) flies carrying either the ppk23 GAL4 insertion (C,D) or the UAS-shiTS insertion (E,F). Experimental flies carrying both (G,H). Red traces indicate the sleep pattern of flies subjected to MF interaction at non-activating temperatures (22°C); on rebound day, temperature was raised to 29°C. Grey lines indicate the sleep profile of mock control flies that underwent the same temperature treatment but did not experience social interaction. (D, F, H) Quantification of sleep rebound during ZT0-3 of rebound day for flies shown in C, E. and G, respectively.
Figure 7

Residual sexual arousal after P1 activation leads to suppression of sleep rebound.
(A) Diagram of the pheromone pathway. Signal from peripheral ppk23 sensory neurons is transferred to PPN1 first and central P1 neurons ultimately. (B, D) Sleep profile of parental control lines (light and dark grey) or experimental line expressing the thermo-activated channel TrpA1 under control of the P1-split-GAL4 driver (green). Experimental flies (D) experienced a raise in temperature from 22°C to 29°C for 24 hr. On the following day, temperature was set again to 22°C. Control flies do not experience any temperature change. (C, E) Quantification of rebound at ZT0-3 for B and D respectively.
Figure 8
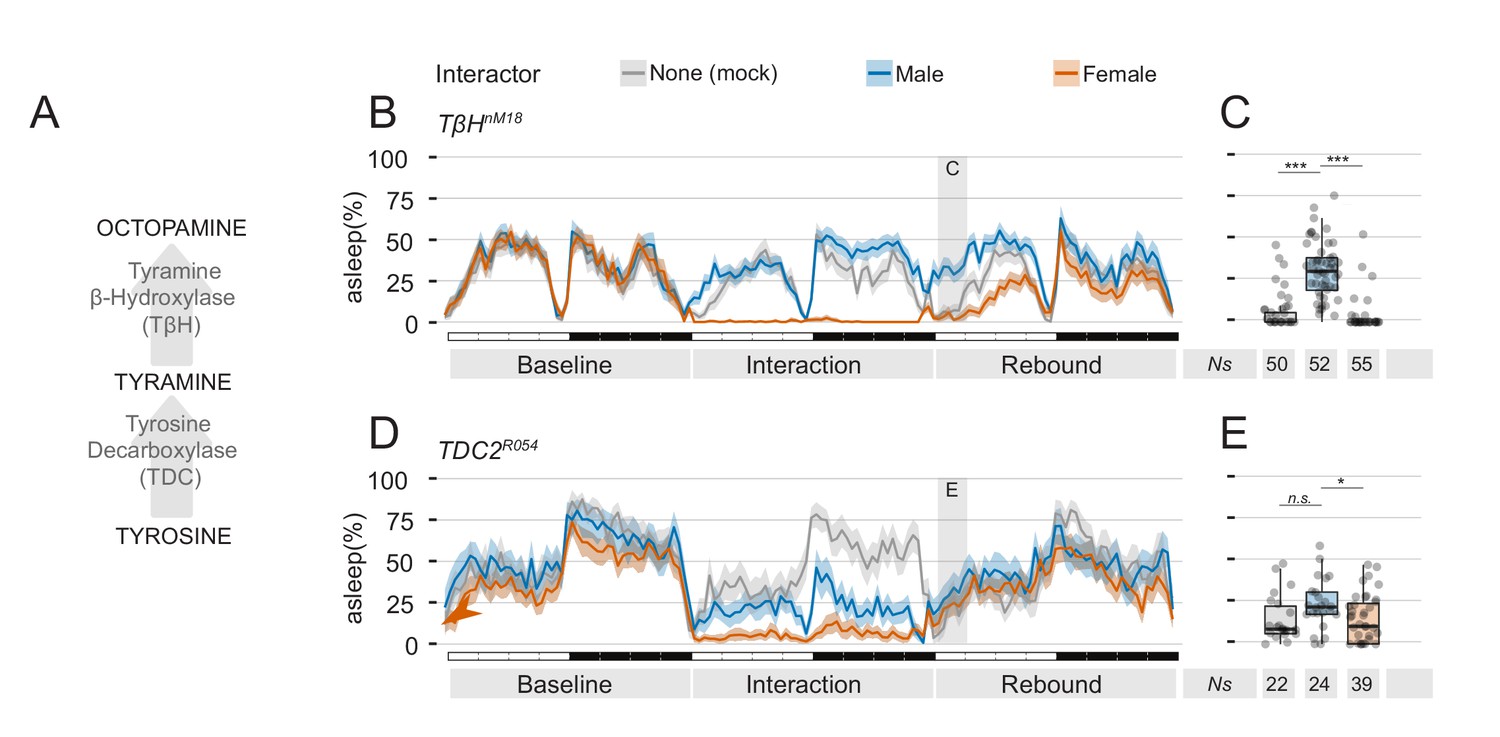
Mutants in the tyramine, octopamine pathway can be employed to manipulate quantity and quality of sexual arousal.
(A) Diagram of the known pathway for generation of octopamine from tyrosine. (B) Three day ethogram plot for the sleep profile of TβHnM18 mutant males subjected to social interaction. In these flies, the effect of MF interaction on sleep rebound is exacerbated. (C) Same experiment, using TDC2R054 mutant male flies. In these flies, MM interaction also leads to suppression of sleep rebound. (C,E) Quantification of ZT0-3 for the experiments shown in B and D respectively.
Author response image 1
Additional files
-
Supplementary file 1
Details of all statistical comparisons.
A text file containing the statistical details of all statistical comparisons.
- https://doi.org/10.7554/eLife.27445.017
-
Transparent reporting form
- https://doi.org/10.7554/eLife.27445.018
Download links
A two-part list of links to download the article, or parts of the article, in various formats.
Downloads (link to download the article as PDF)
Open citations (links to open the citations from this article in various online reference manager services)
Cite this article (links to download the citations from this article in formats compatible with various reference manager tools)
Regulation of sleep homeostasis by sexual arousal
eLife 6:e27445.
https://doi.org/10.7554/eLife.27445


