Protein-mediated RNA folding governs sequence-specific interactions between rotavirus genome segments
- School of Molecular and Cellular Biology, University of Leeds, United Kingdom
- Center for NanoScience, Nanosystems Initiative Munich (NIM) and Center for Integrated Protein Science Munich (CiPSM), Ludwig-Maximilian University of Munich, Germany
- University of York, United Kingdom
Figures
Figure 1 with 6 supplements
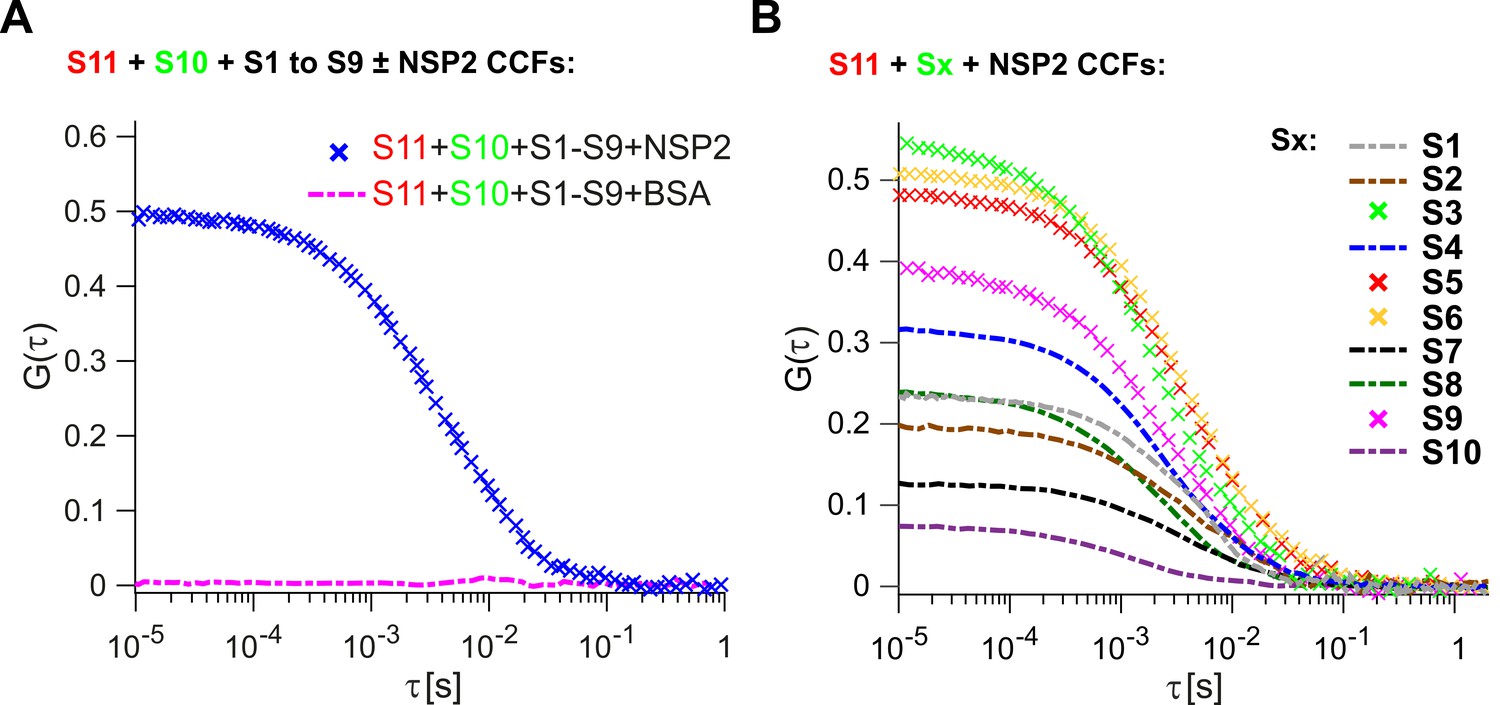
Inter-segment RNA-RNA interactions in rotaviruses examined by FCCS.
(A) Interactions between fluorescently labelled ssRNAs S10 and S11, incubated in the presence of an equimolar set of unlabelled ssRNAs S1 to S9, were probed by FCCS, as described in Materials and methods. A full set of S1-S11 ssRNAs does not associate into a higher order RNA complex (cross-correlation function amplitude, CCF ≈ 0, shown as a dashed magenta line). In contrast, incubation of the mixture of all eleven genomic ssRNAs in the presence of NSP2 results in a strong interaction between S10 and S11 (high amplitude of CCF shown in blue). (B) Pairwise inter-segment RNA-RNA interactions in RVs. Fluorescently labelled ssRNA S11 (red), incubated with RNA Sx (where x – any other genomic ssRNA S1-S10) in the presence of NSP2, as described in Materials and methods. CCF amplitudes were normalised by their respective auto-correlation functions (ACFs), reflecting the differences in the affinities between S11 and other ssRNAs, with the strongest interactions detected for the RNA-RNA combinations S11:S3, S11:S5 and S11:S6.
-
Figure 1—source data 1
Normalised CCFs of the non-interacting fluorescently labelled ssRNAs S10 and S11, incubated with BSA in the presence of an equimolar set of unlabelled ssRNAs S1 to S9 (CCF = 0), and the CCFs of the interacting S10 and S11 co-incubated with NSP2.
- https://doi.org/10.7554/eLife.27453.010
-
Figure 1—source data 2
Normalised CCFs of the interacting RNAs S11 and Sx (x – any other RNA S1-S10) in the presence of NSP2.
- https://doi.org/10.7554/eLife.27453.011
Figure 1—figure supplement 1
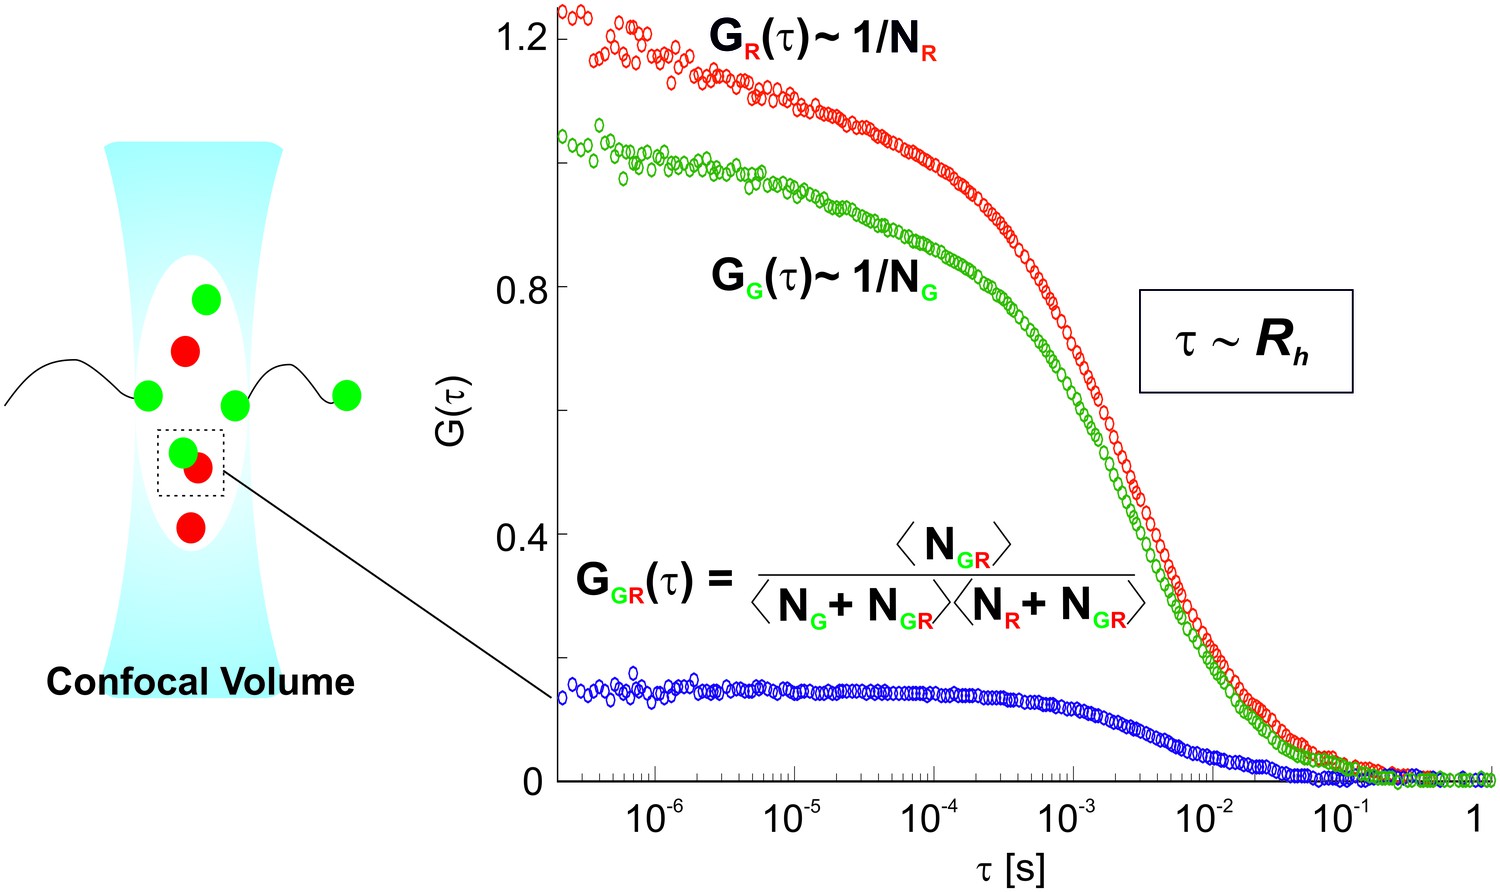
Principles of Dual-color Fluorescence Cross-Correlation Spectroscopy (FCCS).
In Fluorescence Correlation Spectroscopy (FCS), the fluorescent signal is collected from fluorescently labelled molecules passing through the confocal volume. This results in fluctuations in the fluorescent signal, which are detected by single photon avalanche photodiodes (APDs). The fluctuations are analyzed using an autocorrelation analysis. Typical autocorrelation functions (ACFs) for the red-labelled RNA S11 (red particles) and green-labelled RNA S5 (green particles) are shown on the right. The diffusion time values, τ, reflect the average dwell times of the labelled molecules, which are proportional to their hydrodynamic radii (Rh), i.e. sizes. The amplitude of the ACF, G(τ), is inversely proportional to the total number (N) of green and red labelled particles, NG and NR respectively. Dual-color Fluorescence Cross-correlation spectroscopy (FCCS) is a powerful extension of FCS technique that detects interactions of two differently labelled molecules. A cross-correlation signal is observed when green- and red-labeled molecules are interacting, thus diffusing together through the detection volume as a single species. This results in a CCF amplitude, GGR(τ), that is directly proportional to the number of the interacting molecules NGR. The fraction of double-labeled species (i.e., interacting RNA molecules) in a sample can be then extracted from the ratio of the amplitudes of the cross-correlation (CCF, shown in blue) to the auto-correlation functions (ACFs, in green and red).
Figure 1—figure supplement 2
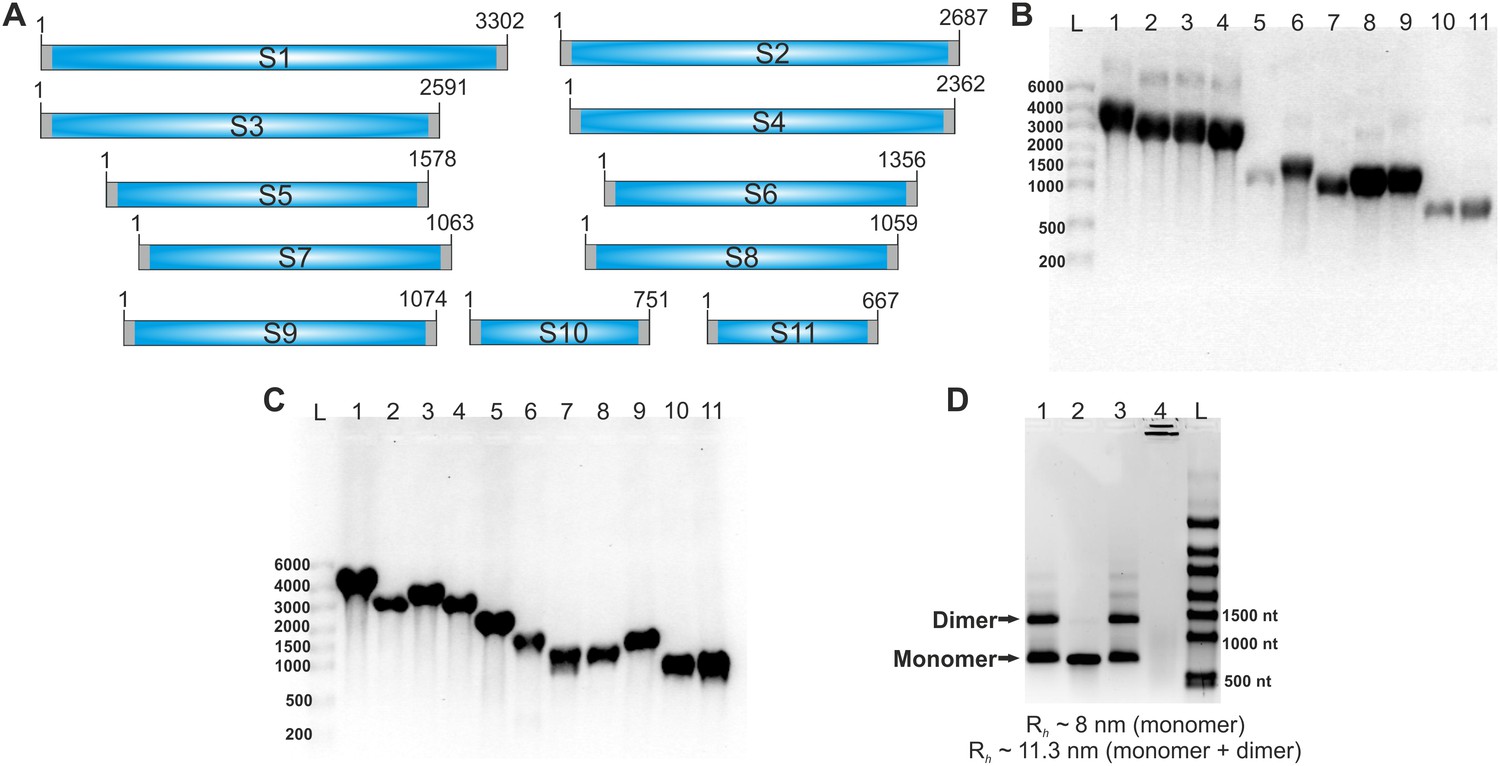
RV genomic segment ssRNAs used in the study.
(A) A schematic of eleven positive-sense ssRNAs genome precursors of RVA. Terminal untranslated regions (UTRs) are shown as grey bars. Note that the UTRs are different for different segments: 9–48 nt of the 5’ UTR, and 17–182 nt for the 3’ UTR. For the FCCS assay, RNAs were labelled with either ATTO647 or ATTO565 dyes, as described in Materials and methods. (B) Denaturing formaldehyde agarose gel electrophoresis of 11 ssRNA transcripts. In vitro transcribed RNAs were separated on a formaldehyde agarose gel (1% w/v) and visualized by staining with ethidium bromide. Lanes 1–11 - segment precursors S1-S11. (C) ATTO-dye-labelled RNA transcripts visualised by fluorescence scanning. Lanes 1–11 – segment precursors S1-S11. L – RNA ladder (High Range RiboRuler, Thermo Scientific), sizes shown in number of nucleotides. (D) Mg2+-dependent multimerization of S11 ssRNA. Native (1% agarose, 0.5 x Tris-borate buffer) gel of S11 RNA transcripts prepared and purified as described in Materials and methods. Lane 1 – S11 RNA sample with residual Mg2+ ions after in vitro transcription prior to heat-denaturation. Lane 2 – S11 RNA after heat-annealing (70°C, 5 min, followed by snap-cooling in a low-salt buffer, 10 mM HEPES, pH 7.4). Lane 3 – RNA sample in the presence of 10 mM Mg2+. Lane 4 – RNA sample, heat-annealed in the presence of 10 mM Mg2+ (notable Mg2+-dependent RNA hydrolysis and RNA aggregation). Sizes are given in number of nucleotides, RNA loading concentration – 1 μg/lane. A similar behaviour is also observed in FCS experiments with fluorescently labelled S11 RNA samples. The S11 ssRNA, after heat annealing, has a smaller hydrodynamic radius (Rh ~ 8 nm) compared to non-heat treated RNA (~13 nm). A prolonged incubation of s11 RNA in the presence of 10 mM Mg2+ leads to an increase of Rh, indicating RNA oligomerization.
Figure 1—figure supplement 3
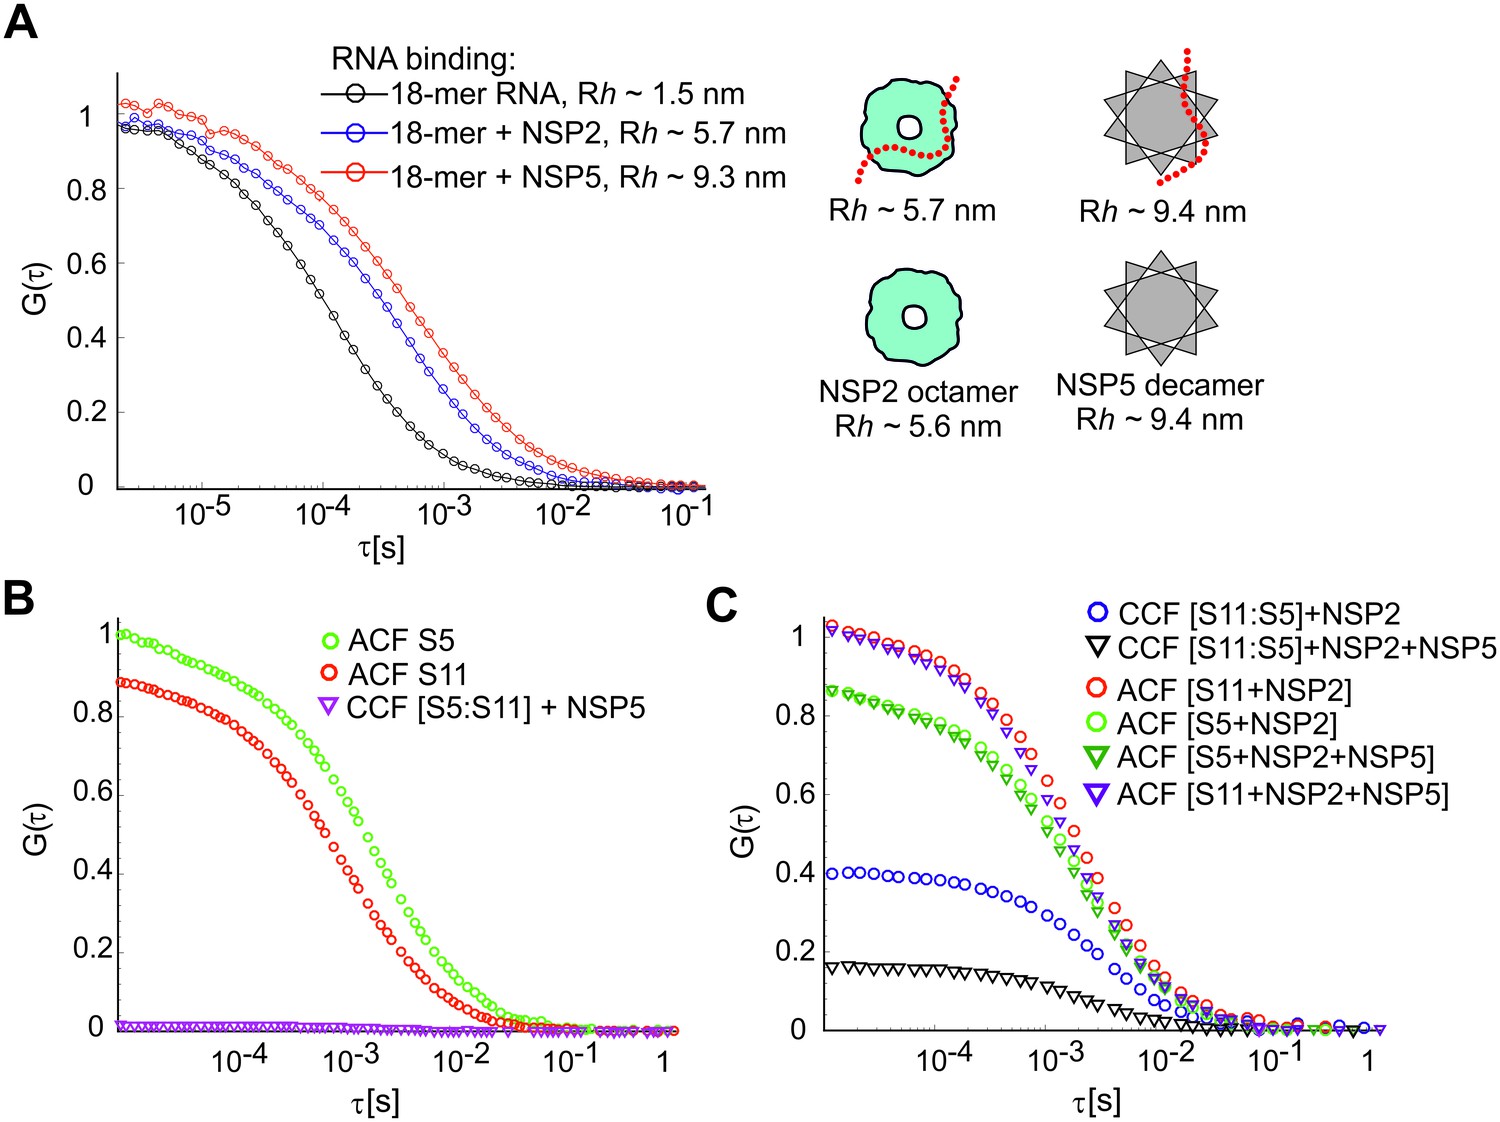
RNA-RNA interactions examined by FCCS in the presence of NSP2 and NSP5.
(A) ssRNA-binding of NSP2 and NSP5 to a Cy5-dye labelled 18-nt long ssRNA. Dye-labelled ssRNA probe (1 nM) was incubated with 0.5 μM NSP5 or NSP2, and examined by FCS. Normalised ACFs for the ssRNA alone (black), RNA:NSP2 complex (blue), and RNA:NSP5 (red) are shown along with the respective fits (shown as solid lines, see Materials and methods), yielding the apparent hydrodynamic radii, Rh, shown next to the fits. Sizes of NSP2-bound and NSP5-bound ssRNAs are in close agreement with the previously estimated hydrodynamic radii of NSP2 octamer (Zeng et al., 1998) and NSP5 decamer (Jiang et al., 2006). (B) ssRNA-binding protein NSP5 does not promote interactions between S5 and S11 RNAs. Both fluorescently labelled RNAs were incubated with NSP5 instead of NSP2, and assayed by FCCS, as described above. The resulting CCF ≈ 0 (magenta) indicates lack of detectable interactions between the two RNAs. (C) Co-incubation of NSP2 (20 μM) and 0.5 μM NSP5 with ssRNAs S5 and S11 results in significantly decreased amplitude of CCF (black triangles), compared to the CCF of the S11:S5 RNA complex formed in the presence of NSP2 alone.
Figure 1—figure supplement 4
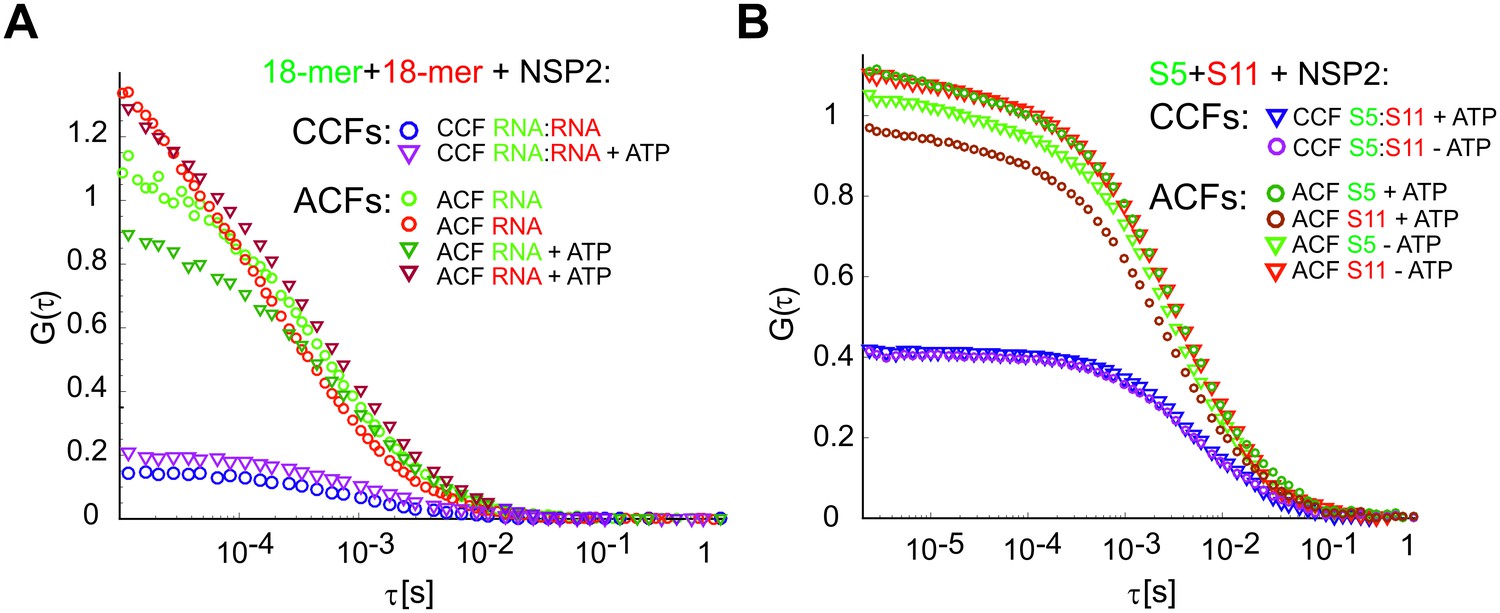
Effect of ATP on the RNA-binding properties of NSP2.
(A) RNA-binding properties of NSP2 were examined with two non-complementary Cy5 (red) and Cy3 (green)-labelled ssRNAs (18 nt-long). Non-interacting RNA strands (10 nM each strand) were incubated with 10 nM NSP2 octamer and examined by FCCS. The non-zero CCF (blue circles) suggest that both differently labelled RNAs may bind a single NSP2 octamer with high affinity, consistent with the previously reported binding of two 20-mer RNAs per single NSP2 octamer (Schuck et al., 2001). Addition of 1 mM ATP to the reaction has very little effect on the CCF amplitude (purple triangles). (B) Pairwise S5:S11 interactions assay, as described in Materials and methods, carried out in the presence of 1 mM ATP (CCF shown as blue triangles), and without ATP (CCF shown as purple circles). The resulting CCF amplitudes are similar in both cases, suggesting that addition of 1 mM ATP does not affect the formation of the RNA-RNA contacts.
Figure 1—figure supplement 5
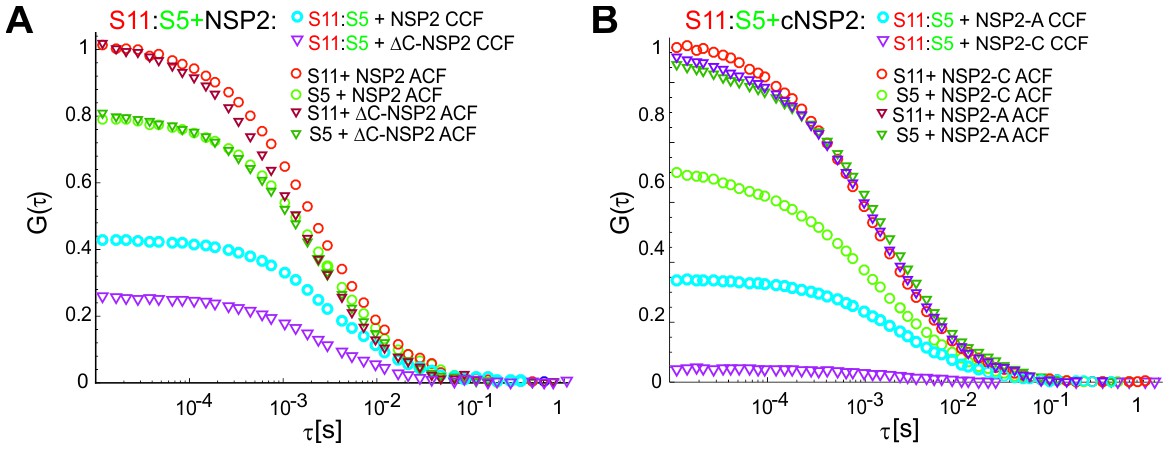
S5:S11 RNA-RNA interactions examined in the presence of RV group A NSP2 mutant ΔC-NSP2 and RV group C NSP2.
(A) Substitution of a full-length NSP2 with its C-terminally truncated mutantΔC-NSP2 with reduced affinity for ssRNA (see Materials and methods), results in significantly lower efficiency of S5:S11 complex formation (CCF in blue and the reduced CCF in purple). (B) RV group C NSP2 (NSP2-C) was used instead of RV group A NSP2 (NSP2-A) in the RNA-RNA interaction assay as described in (A). The differences in the resulting CCF amplitudes (shown in blue for NSP2-A and in purple for NSP2-C) reveal that NSP2-C has low efficiency in promoting RNA-RNA contacts formation between S5 and S11 ssRNAs.
Figure 1—figure supplement 6
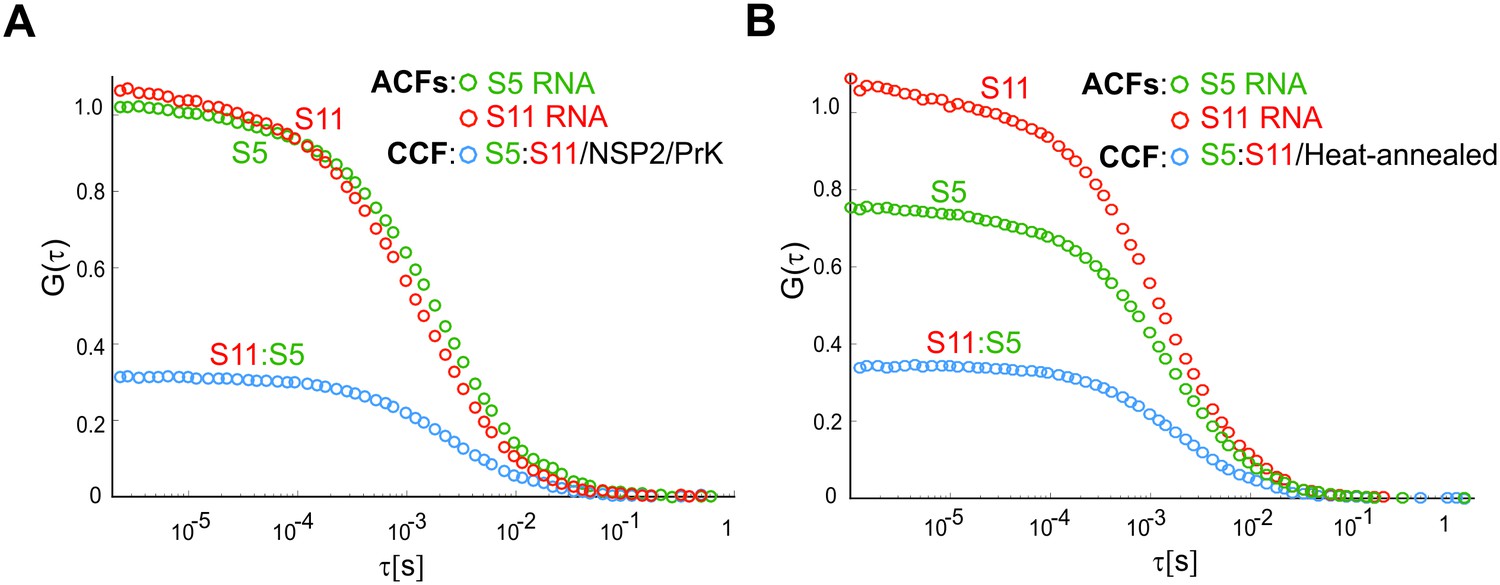
Interactions of ssRNAs S5 and S11 after proteolytic removal of NSP2.
(A) Fluorescently labeled S5 (green) and S11 (red) (equimolar ratio, both green and red ACFs ~ 1) were incubated with NSP2 as described in Materials and methods. After incubation, the RNA sample was extensively digested with proteinase K (PrK, see Materials and methods) and then further diluted to 1 nM RNA concentration of each strand. A noticeably longer diffusion time of ATTO565-labelled S5, compared to S11, reflects their differences in sizes (e.g., diffusion times ~ Rh, see Table 1 and Figure 1—figure supplement 2D). After dilution and prolonged incubation in low ionic strength buffer at 37°C, the apparent amplitude of the CCF between S5 and S11 (dark blue) after NSP2 removal is reduced, compared to the NSP2-bound RNA samples (Figure 1B). The non-zero CCF amplitude confirms that the two RNAs remain associated after the removal of NSP2. (B) A control reaction of the heat-annealed fluorescently labelled S5 and S11 RNAs, interacting after heat-annealing, with a CCF amplitude, comparable to the CCF shown in panel (A).
Figure 2 with 2 supplements
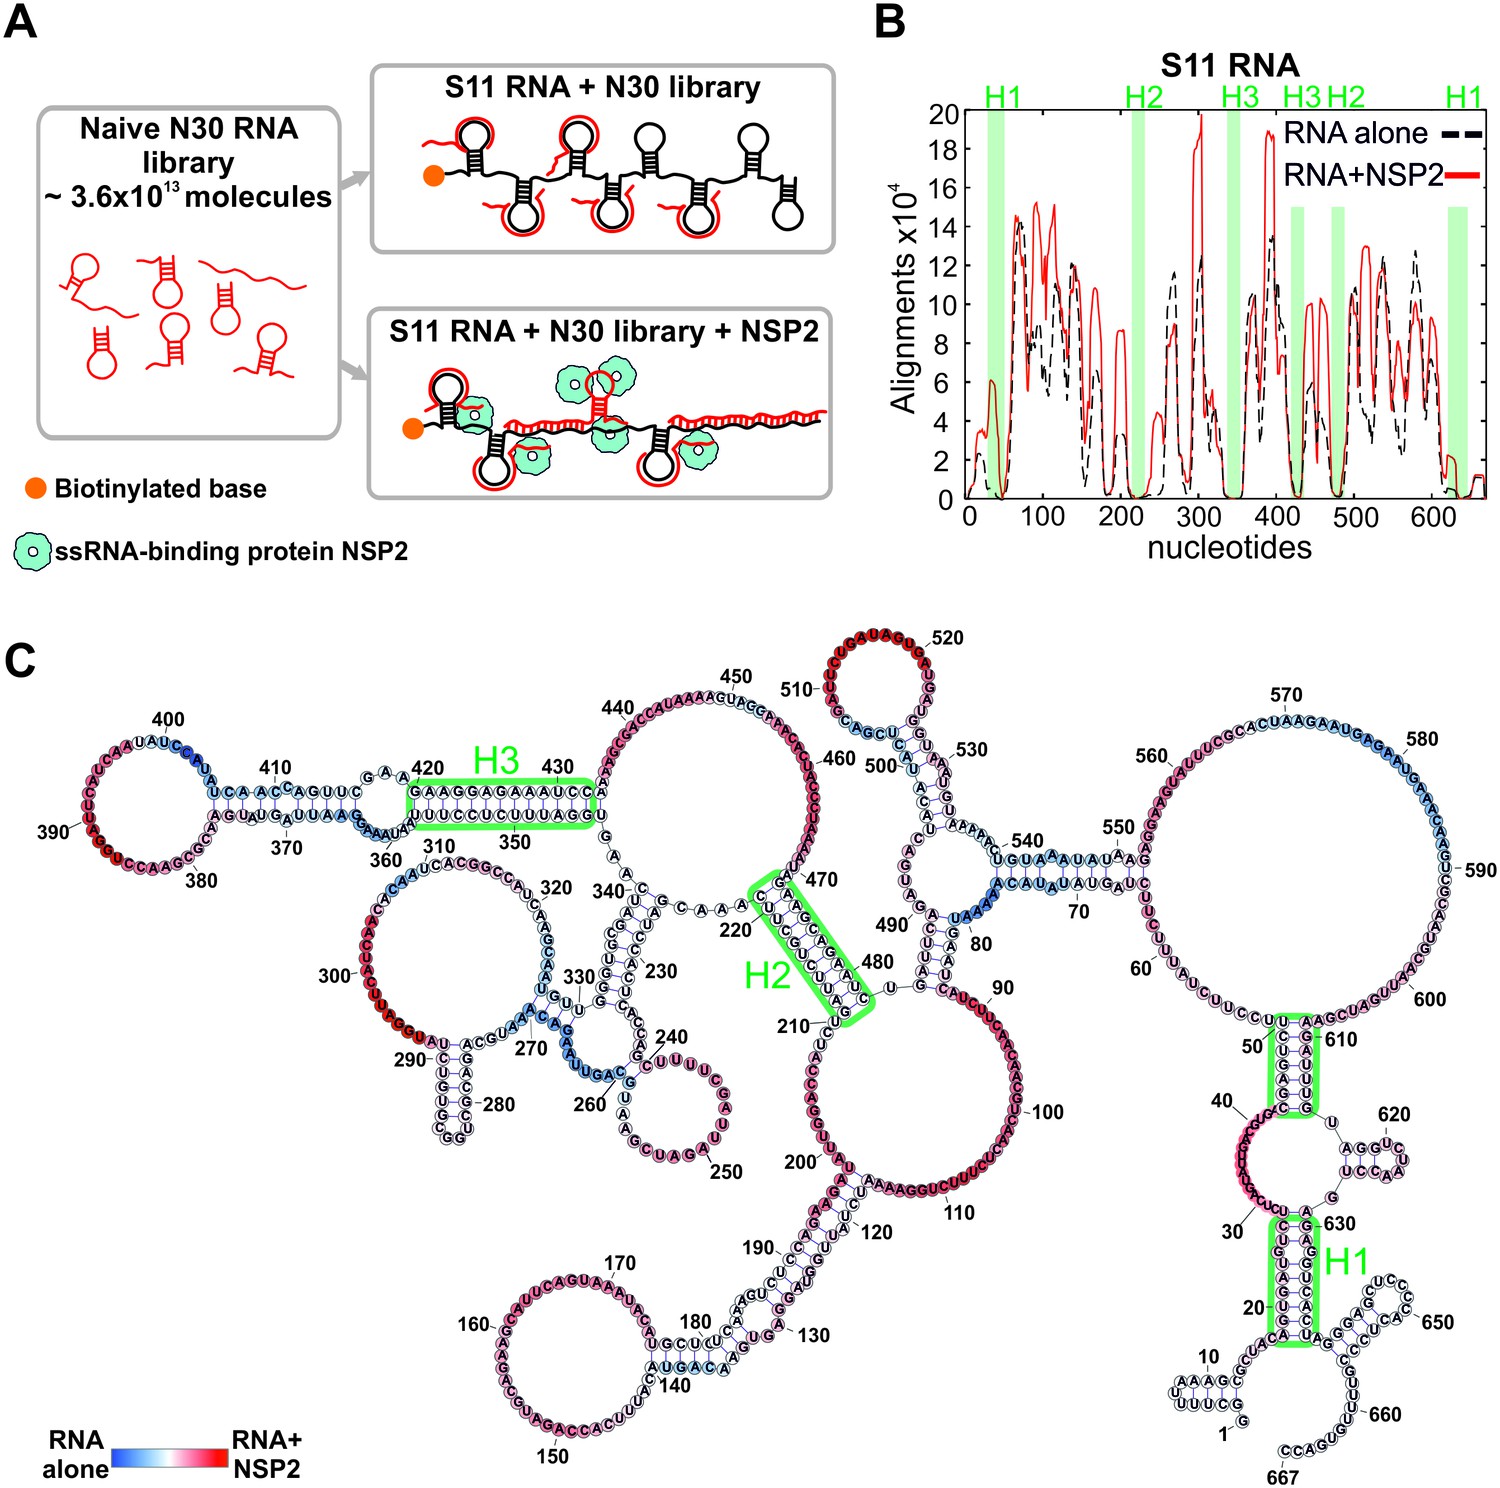
An RNA-RNA SELEX approach for mapping inter-segment interactions.
(A) A naïve 30-nt ssRNA library contains a subset of RNAs (shown as red stem-loops) that can interact with the target RNA (schematically shown in black). In parallel, the naïve RNA library is incubated with S11 RNA in the presence of the RNA-binding protein NSP2 (schematically shown as blue spheres). Both RNA libraries are subject to an RNA-RNA SELEX procedure, combined with high-throughput sequencing, as described in Materials and methods. Analysis of the recovered sequences allows identification of multiple RNA-binding sites present in S11 RNA. (B) Histogram plots of the sequences recovered from the RNA-RNA SELEX against S11 RNA, which were aligned to the sequence of S11 (Materials and methods). The numbers of sequences aligning to a given nucleotide of S11 are normalised to the overall number of alignments in both RNA libraries (S11 RNA alone – black dashed line, S11 +NSP2 – solid red line). Highlighted in green are regions with low accessibilities that correspond to stable helices H1-H3, yielding poor sequence enrichment during the RNA-RNA SELEX procedure. (C) NSP2-induced structural rearrangements of S11 RNA. The refolded RNA structure was computed using folding constraints derived from the RNA-RNA SELEX experiment. The colour map shows changes in accessibilities in S11 RNA upon NSP2 binding. Highly exposed areas of the S11 RNA alone are shown in blue, while the sequences predominantly enriched in the presence of NSP2 are shown in red.
-
Figure 2—source data 1
The number of sequences recovered from the RNA-RNA SELEX against S11 RNA alone, which were aligned to the sequence of S11 RNA and filtered using Bernouli score of 12.
- https://doi.org/10.7554/eLife.27453.016
-
Figure 2—source data 2
The number of sequences recovered from the RNA-RNA SELEX against S11 RNA in complex with NSP2, which were aligned to the sequence of S11 RNA and filtered using Bernoulli score of 12.
- https://doi.org/10.7554/eLife.27453.017
-
Figure 2—source data 3
A connectivity table (CT) file of the S11 RNA structure computed using folding constraints derived from the RNA-RNA SELEX experiment performed in the presence of NSP2.
- https://doi.org/10.7554/eLife.27453.018
Figure 2—figure supplement 1
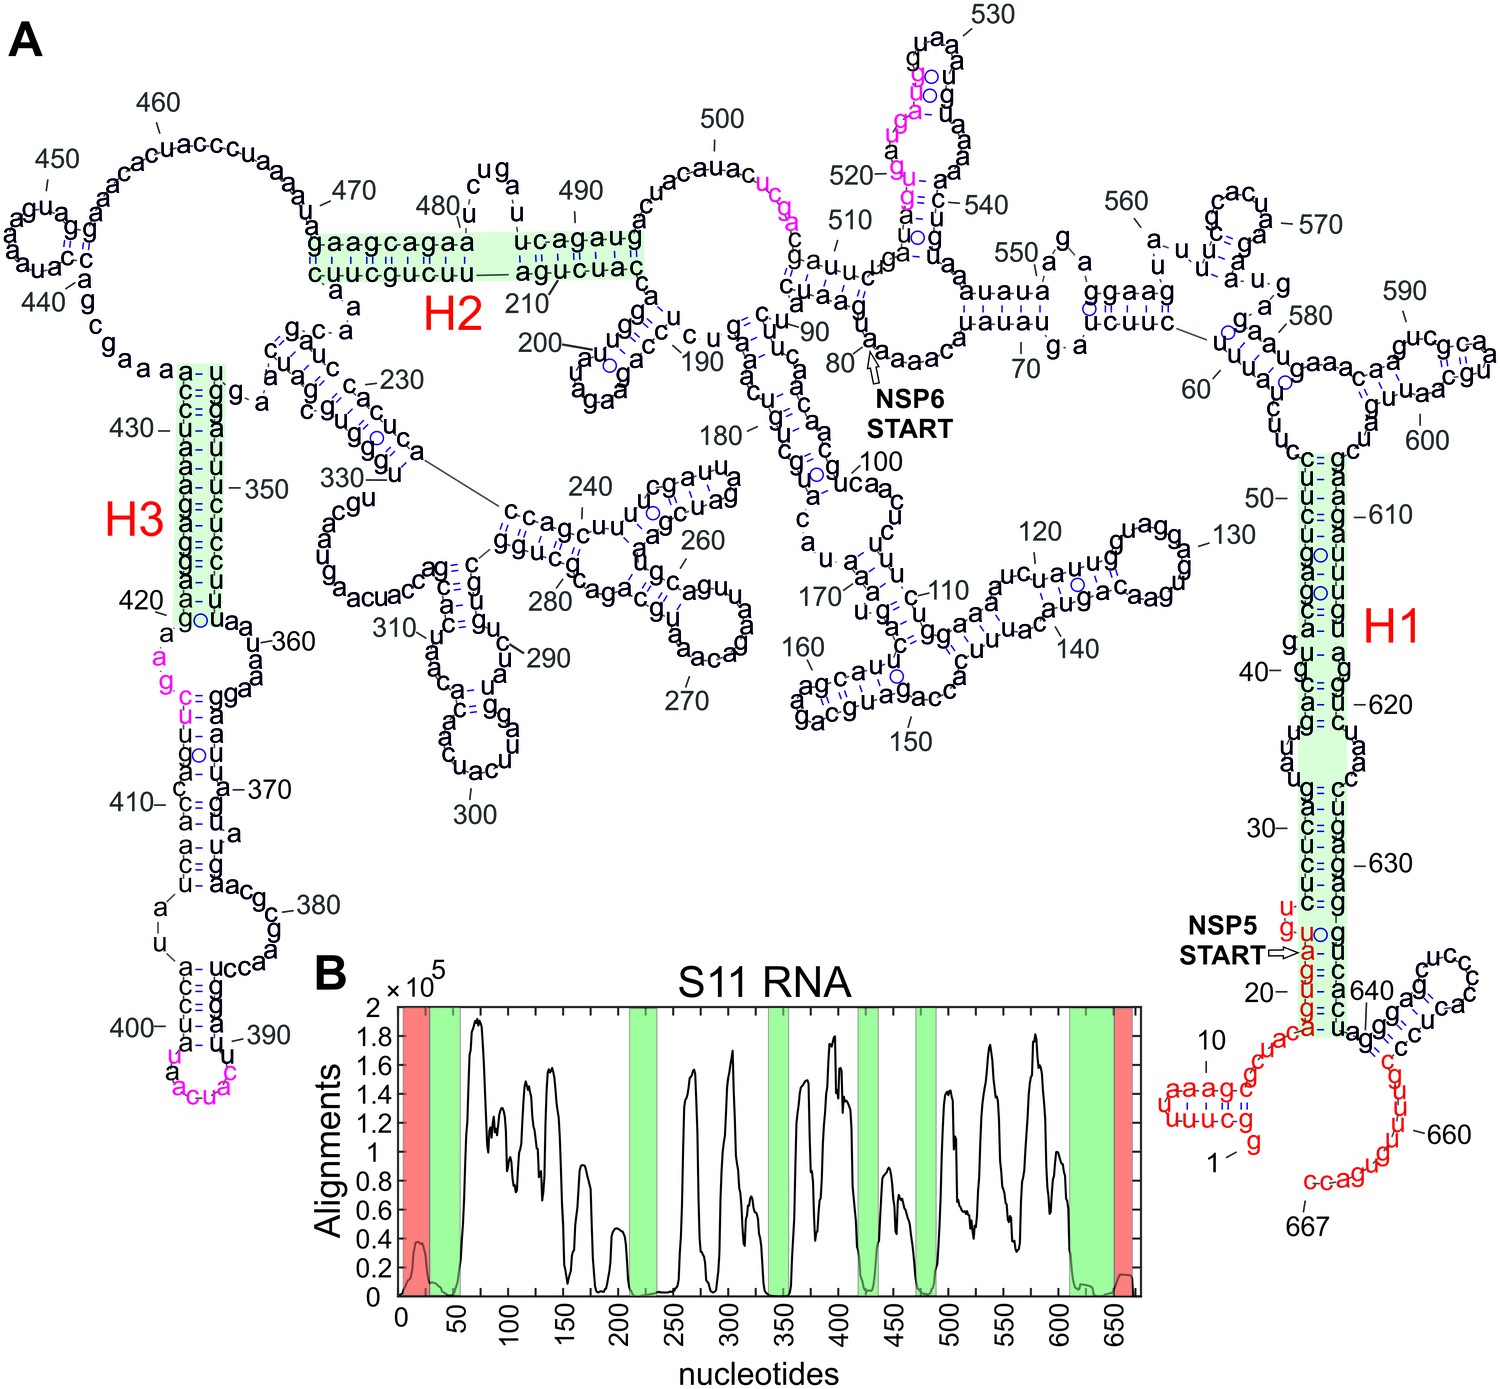
Secondary structure model of S11 RNA.
(A) Minimum free energy (MFE) secondary structure model of S11 RNA, computed using the constraints derived from enzymatic RNA probing and covariation analysis, as described in Li et al. (2010). The terminal sequences and regions, previously predicted to form tertiary contacts, are shown in red and magenta, respectively. The conserved helices H1-H3 are highlighted in blue. (B) Accessibility of the S11 RNA probed by RNA-RNA SELEX. Regions with a high number of alignments correspond to highly exposed areas (e.g., loops), while regions with the lowest sequence enrichment (shown in blue) correspond to the highly stable helices H1-H3. The conserved terminal regions (highlighted in red) and loop regions are in good agreement with the structure shown in (A).
Figure 2—figure supplement 2
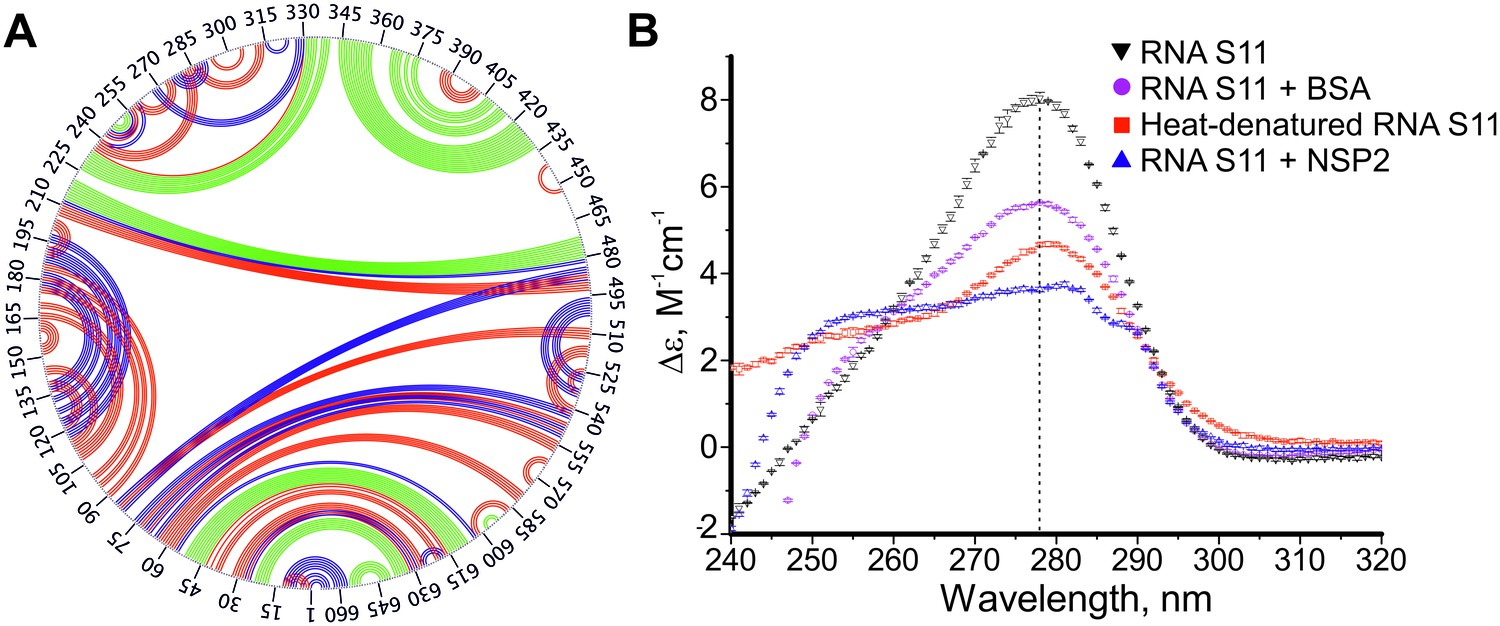
Conformational changes in S11 RNA upon NSP2 binding.
(A) Overlaid circular plots of S11 RNA structures probed by RNA-RNA SELEX in the absence and in the presence of NSP2. Green arcs indicate stable base pairs that are present in the S11 RNA structure and remain unchanged upon NSP2 binding. Upon incubation with NSP2, multiple base-paired regions are destabilized and exposed (red arcs), or become less accessible due to re-formation of new intra-molecular contacts (blue arcs). (B) Circular dichroism (CD) spectra analysis of S11 ssRNA confirms RNA secondary structure destabilization in the presence of NSP2 (blue). The CD spectra of folded RNA at 37°C and thermally unfolded RNA (90°C) are shown in black and red, respectively, along with the spectra of the RNA in the presence of bovine serum albumin (BSA, shown in magenta), with an extinction coefficient similar to NSP2.
Figure 3 with 4 supplements
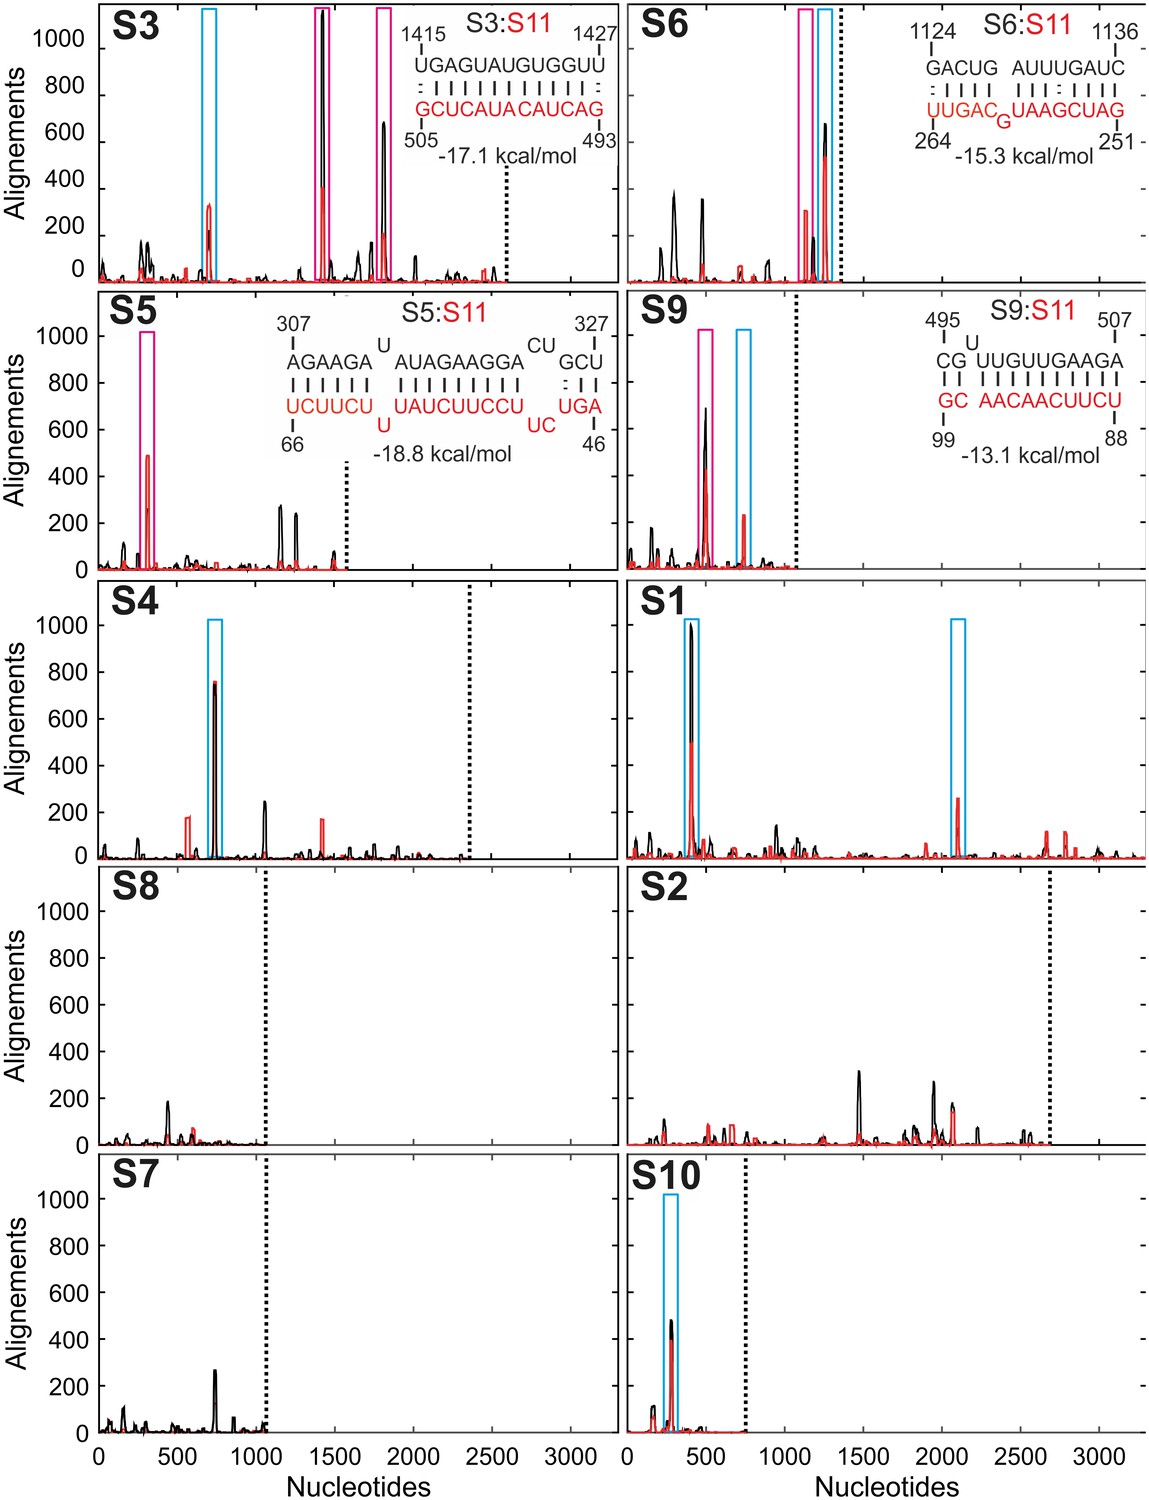
Inter-segment interactions between ssRNAs S11 and S1-S10, identified via RNA-RNA SELEX.
SELEX-enriched sequences were aligned against S1-S10 genomic segments using probabilistic score-based filtering (Materials and methods) to construct the resulting histogram plots. Each histogram peak corresponds to a sequence with a potential to interact with the S11 RNA alone (shown as black peaks), or in the presence of NSP2 (peaks shown in red). These histograms are plotted in the order of decreasing CCF amplitudes (see Figure 1B). Each plot is scaled to the size of the longest segment S1 (3302 nts), and the 3’-end of each RNA segment is marked with a vertical dotted line. Sequences that can stably base-pair with S11 RNA in the presence of NSP2 are highlighted (magenta boxes). A number of genomic sequences identified in the RNA-RNA SELEX experiments may be sequestered by stable local secondary structures (peaks identified by cyan boxes). Insets – RNA-RNA interaction sites between RNA S11 (bottom strand shown in red), and its interacting partners S3, S6, S5 and S9 (top strand, shown in black).
-
Figure 3—source data 1
Histogram plots (S1–S10) of SELEX-enriched sequences aligned against S1-S10 RNA segments using probabilistic score-based filtering (Bernoulli score of 14) from the RNA-RNA SELEX experiment against S11 RNA target.
- https://doi.org/10.7554/eLife.27453.024
-
Figure 3—source data 2
Histogram plots (S1–S10) of SELEX-enriched sequences aligned against S1-S10 RNA segments using probabilistic score-based filtering (Bernoulli score of 14) from the RNA-RNA SELEX experiment against S11 RNA in the presence of NSP2.
- https://doi.org/10.7554/eLife.27453.025
Figure 3—figure supplement 1
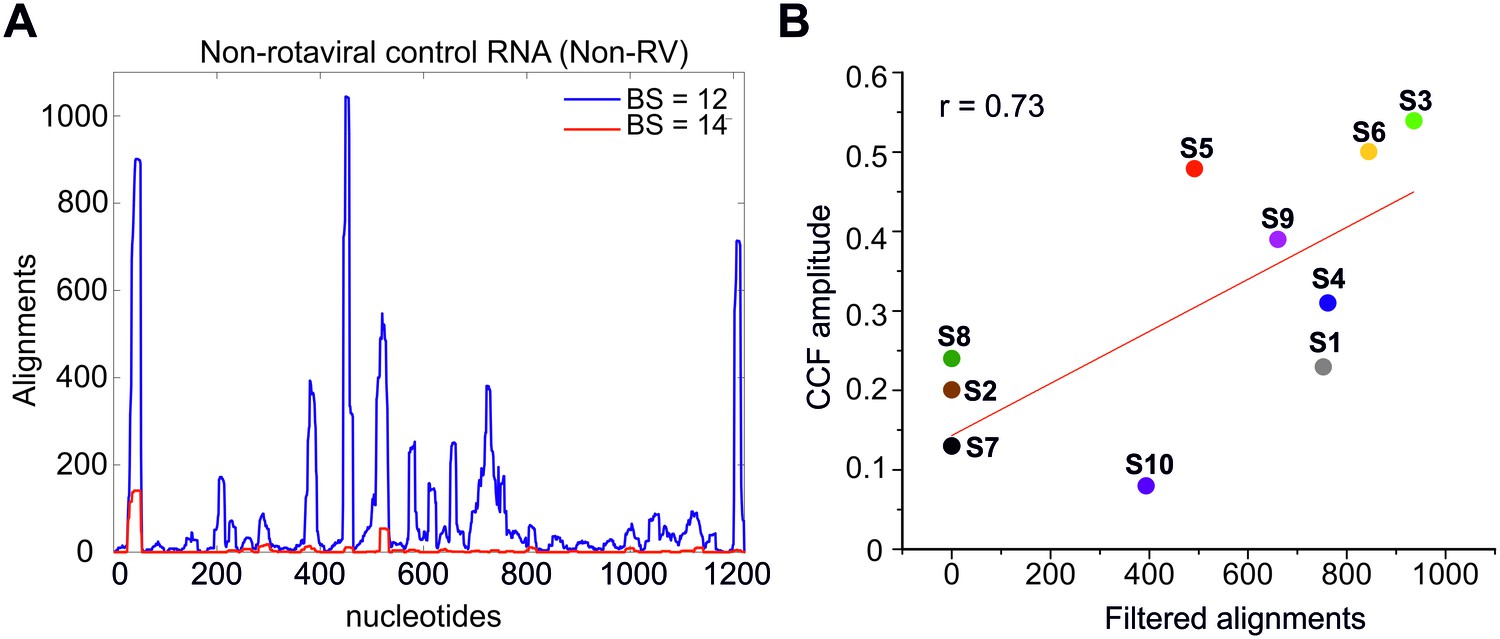
Sequence alignments of SELEX-enriched RNAs against a non-rotavirus control RNA (Non-RV).
(A) Multiple RNAs interacting with S11 enriched in the presence of NSP2 were aligned to Non-RV RNA sequence using a Bernoulli score of 12 (blue line) or 14 (red line). Only a small number of sequences (~170) with a score of 14 or above align to the Non-RV sequence, suggesting that this region could potentially interact (albeit weakly) with S11 RNA. This result is consistent with a non-zero CCF amplitude, observed for S11:Non-RV control RNA, incubated in the presence of NSP2 (Figure 4A, CCF shown as a dashed magenta line). (B) A correlation between the CCF amplitudes of pairwise RNA-RNA interactions examined by FCCS (Figure 1B) and the number of ‘filtered’ sequence alignments (using a Bernoulli score of 14 or above over 200 hits per identified peak) from the RNA-RNA SELEX against S11 RNA. At the 0.05 level, the slope is significantly different from zero, with a Pearson’s r = 0.73.
Figure 3—figure supplement 2
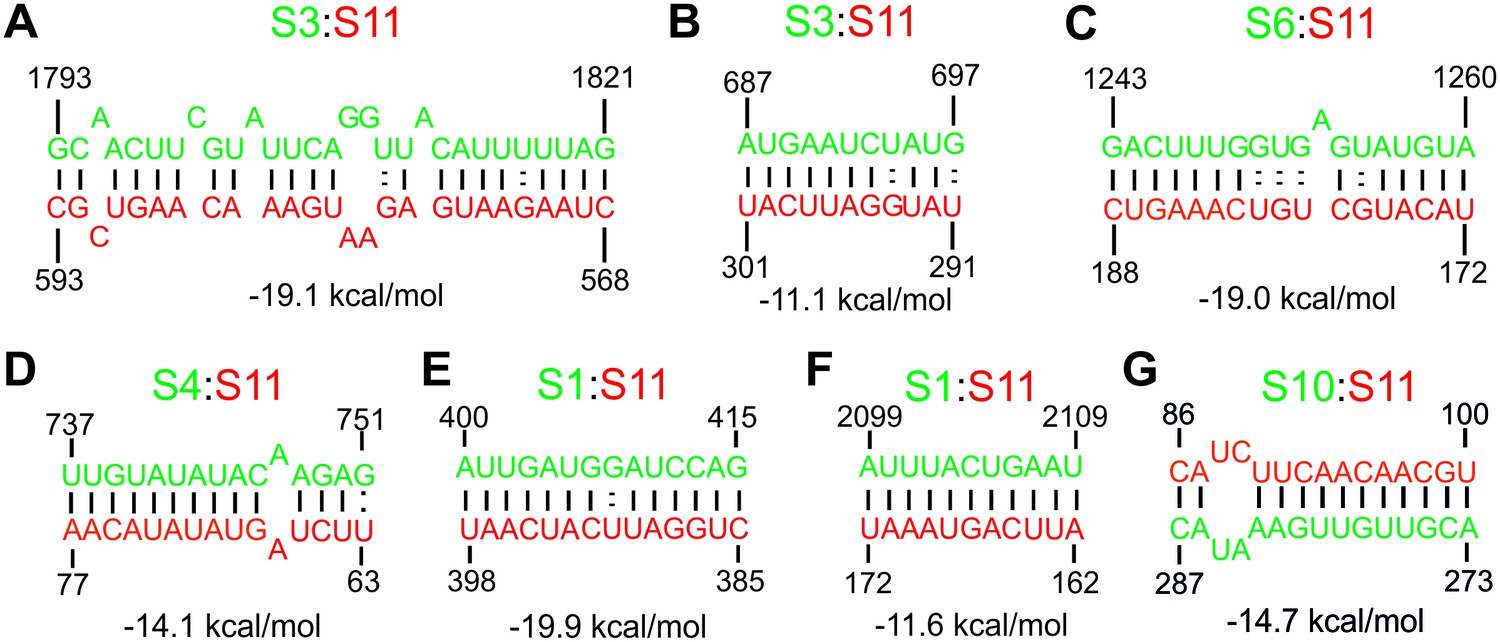
RNA sequences identified in the RNA-RNA SELEX experiments, with a potential to interact with S11 RNA.
RNA strands shown in green correspond to the genomic sequences represented by the peaks shown in Figure 3, identified using the Bernoulli score of 14 or above. (A) RV genomic sequences, involved in S11:S3 inter-segment interactions, confirmed by mutagenesis studies and FCCS (see Figure 4—figure supplement 1A). (B) An additional peak identified in S3 RNA that may also pair with S11, albeit with a significantly lower stability of the resulting RNA-RNA contact (−11.1 kcal/mol, corresponding to a Kd value of ~10 nM). (C–G) RNA sequences present in S6, S4, S1 and S10 RNAs (strands shown in green) with a potential to base-pair with S11 RNA. These sequences are expected to be sequestered by secondary structures and/or tertiary contacts, which may preclude these interactions with S11 RNA (see Figure 3—figure supplement 4).
Figure 3—figure supplement 3
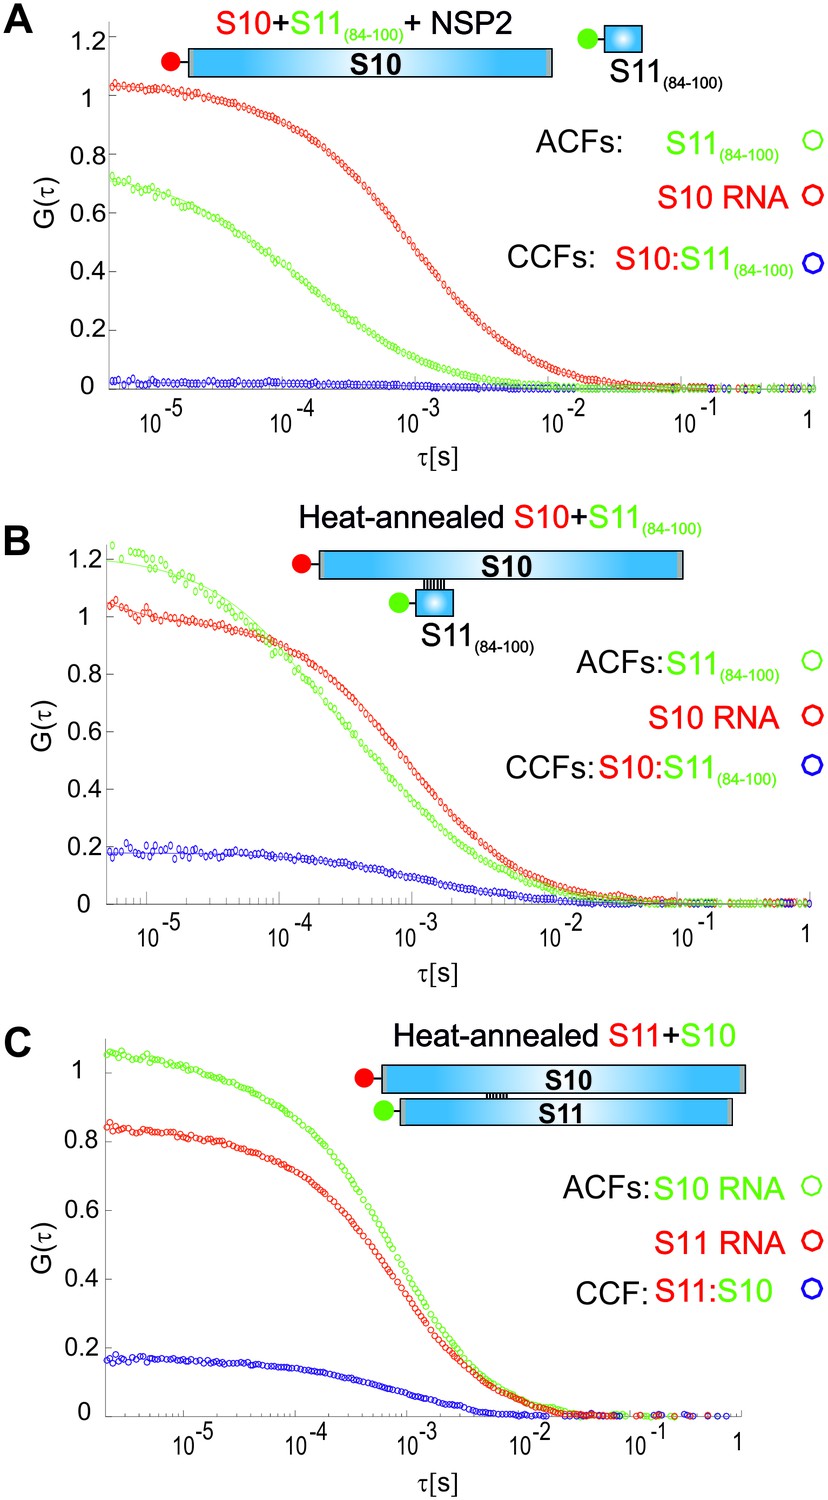
Accessibility of the region 272–287 of S10 RNA probed using a complementary RNA sequence, derived from S11 RNA.
(A) ATTO647-labelled S10 RNA was incubated with the Cy3-labelled 17-mer RNA Seq11_84–100 (Supplementary file 2) in the presence of NSP2, as described in Materials and methods. No significant interactions between the two RNAs were observed (CCF = 0, in blue), suggesting that the probed region 272–287 is sequestered. (B) A control heat-annealing reaction of the two labelled RNA samples, resulting in a non-zero cross-correlation (CCF ~0.2), confirming that the sequence 84–100 of S11 RNA can base-pair with S10 RNA, only after heat-annealing of a mixture of the two RNAs. (C) Heat-annealing of labelled RNAs S10 and S11 results in similar CCF amplitude as in (B), suggesting that region 272–287 of S10 RNA has low accessibility for base-pairing with S11 RNA in the presence of NSP2.
Figure 3—figure supplement 4
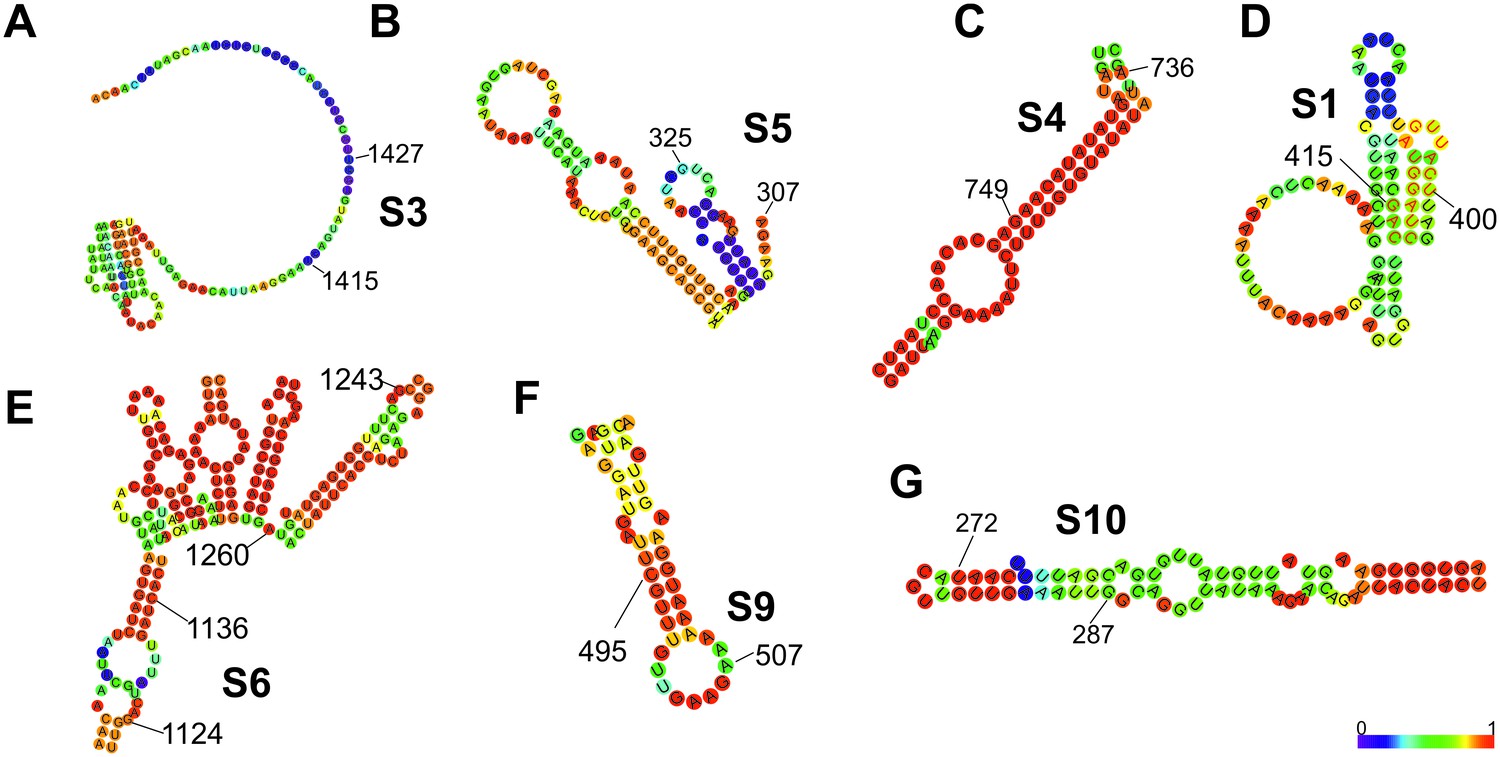
The minimum free energy (MFE) secondary structure calculations of the complementary sequences with a potential for stable base-pairing with S11 RNA.
Thermodynamic ensemble of secondary structures and base-pairing probabilities were calculated for the entire genomic segment sequences using RNAfold, as described in Materials and methods. These RNA sequences were extracted from the computed centroid RNA structures, that is, showing minimal base pair distances to all other secondary structures in the Boltzmann ensemble. The identified S11 RNA-interacting sequences within RNAs S3 and S5 have high predicted accessibilities (regions 1415–1427 in S3 and 307–325 in S5), in agreement with the observed high CCF amplitudes for RNA combinations S3:S11 and S5:S11. Regions 1124–1136 in S6 RNA and 495–507 in S9 have lower accessibilities, while the region 1243–1260 in S6 is sequestered in a stable intra-molecular helix, consistent with the S6 RNA model proposed by Li et al. (2010), and thus is unlikely to stably base-pair with S11 RNA. RNA sequences of S4, S1 and S10 segments, identified as peaks in the RNA-RNA SELEX, showing low accessibilities of the S11-interacting sequences. The colour map shows the calculated base-pairing probabilities of the analysed nucleotides (blue = 0, red = 1).
Figure 4 with 3 supplements
Probing the stability and specificity of inter-segment RNA-RNA interactions.
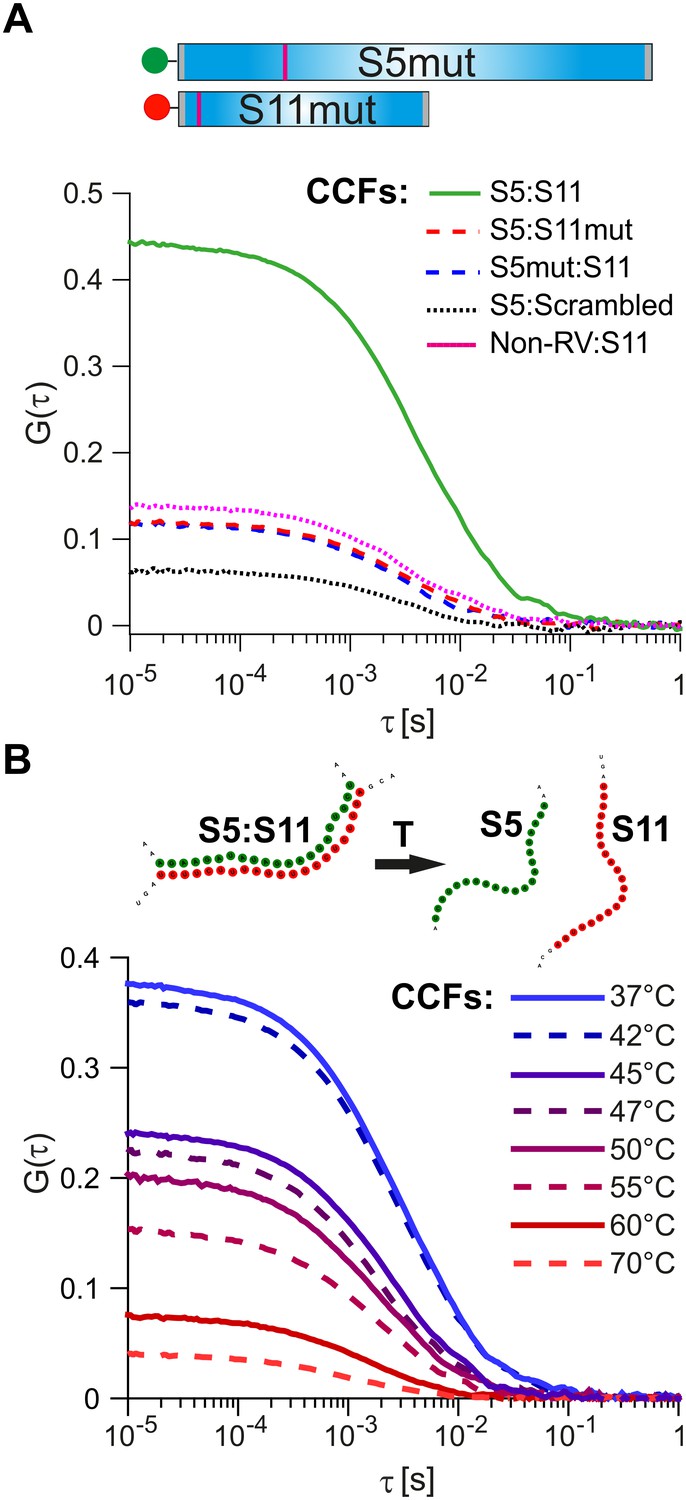
(A) A schematic of the mutated RNAs S5 and S11 (S5mut and S11mut, respectively), showing the sites of mutations that disrupt inter-segment interactions (magenta stripes). These RNAs were examined in pairwise RNA-RNA interaction assays, as described in Materials and methods. Below – normalized CCFs of the wild-type S5:S11 RNA:RNA complexes (solid green line, high amplitude CCF), and significantly weaker interacting S11 and S5mut (dashed blue line), or S5 and S11mut ssRNAs (dashed red line). The non-rotavirus control RNA (Non-RV, see Materials and methods) does not strongly bind S11 RNA upon incubation with NSP2, resulting in low CCF amplitude (dotted magenta line). Similarly, incubation of a ‘scrambled’ RNA, designed to have a minimal propensity to base-pair with S5 RNA, yields the lowest CCF amplitude (black dotted line). (B) Temperature melting experiments of the pre-formed S5:S11 RNA-RNA complexes, examined by FCCS. The observed melting temperature (Tm) of 46°C agrees well with the estimated Tm of the identified RNA duplex, formed between S5 and S11 RNAs upon incubation with NSP2 (Figure 3, inset).
-
Figure 4—source data 1
Normalized CCFs of the wild-type S5:S11 RNA:RNA complexes, and weakly interacting S11 and S5mut, S5 and S11mut ssRNAs, S11:Non-RV RNAs, and S5 RNA:‘scrambled’ RNA.
- https://doi.org/10.7554/eLife.27453.030
-
Figure 4—source data 2
Normalized CCFs of the wild-type S5:S11 RNA:RNA complexes, pre-incubated at different temperatures to determine the Tm of the preformed RNA-RNA complex S5:S11.
- https://doi.org/10.7554/eLife.27453.031
Figure 4—figure supplement 1
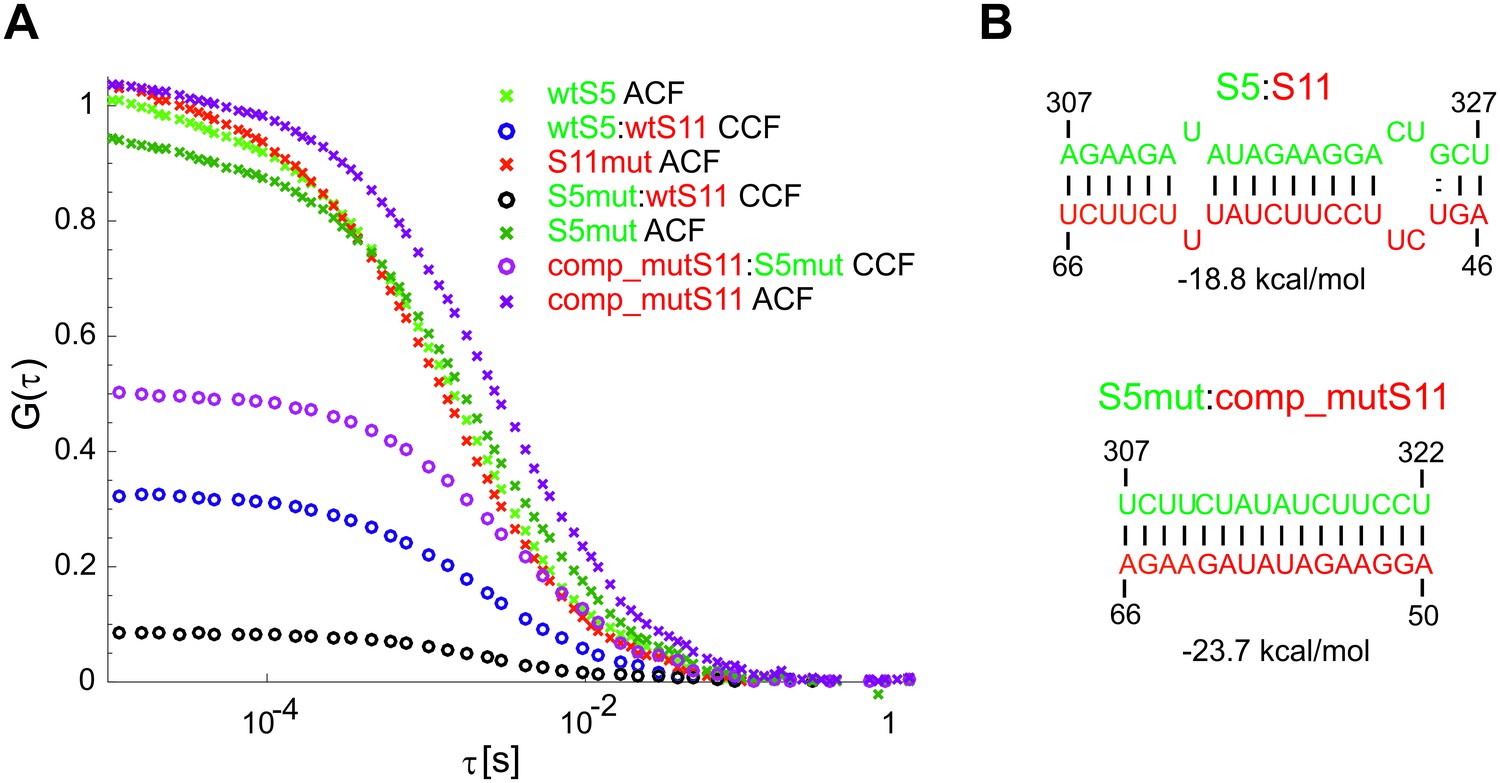
Compensatory mutations rescue stable interactions between mutated ssRNAs S5 and S11.
(A) Mutated wild-type (wt) ssRNAs S5 and S11 (S5mut and S11mut, respectively, Figure 4) were examined in pairwise RNA-RNA interaction assays, as described in Materials and methods. Below – normalized ACFs (shown as crosses) of the wild type RNAs S5 and S11, S5mut and comp_mutS11 RNAs, along with the normalised CCFs (shown as circles) of the wild-type S5:S11 RNA:RNA complex (blue), and a significantly weaker interacting S11 and S5mut (black CCF), and the ‘rescued’ CCF of the strongly interacting trans-complementary mutants comp_mutS11:S5mut (magenta CCF). (B) Stable base-pairing between the wtRNAs S5 and S11 and the trans-complementary mutated sequences S5mut:S11comp (below), which were examined in the pairwise RNA-RNA interaction assay shown in (A).
Figure 4—figure supplement 2
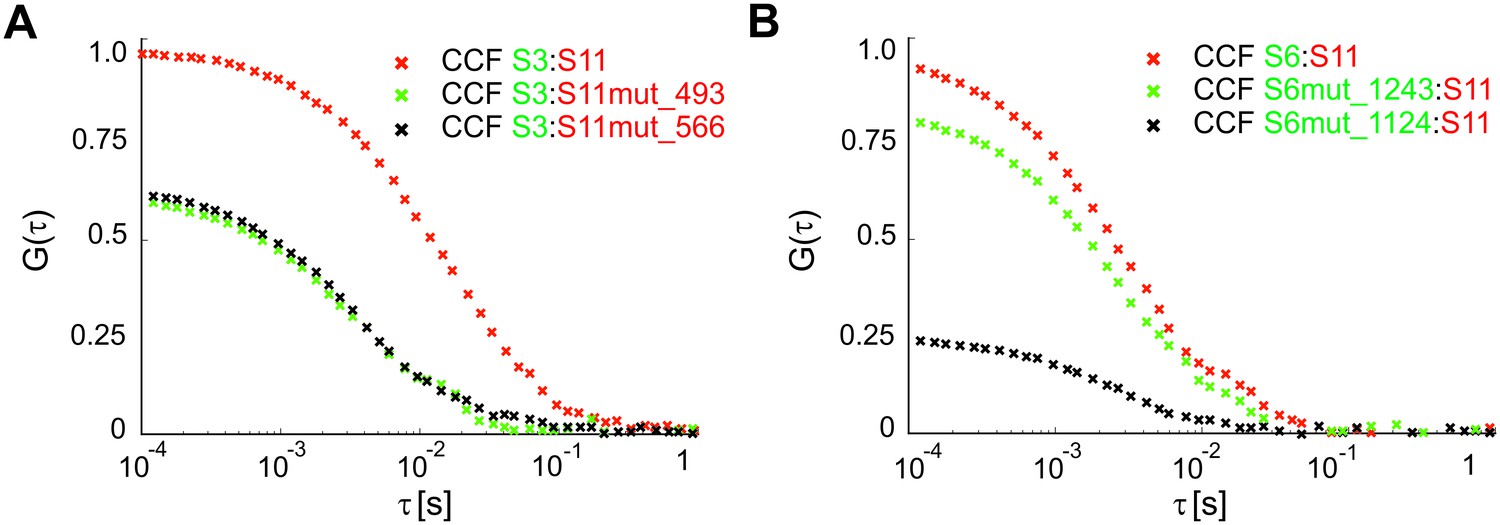
Investigating RNA-RNA interaction sites between S3 and S11, and S6 and S11.
Segment ssRNAs were analyzed in pairwise RNA-RNA interaction assays, as described in Materials and methods. CCF amplitudes were normalized by their respective ACFs, and the resulting relative CCF amplitudes of the mutated S11 or S6 sequences were further normalized to the highest CCF, characteristic for the wild-type S6:S11 RNA:RNA complex. (A) Mutations disrupting RNA-RNA interactions between S3 and S11 ssRNAs were introduced into S11 RNA sequences yielding S11mut_493 and S11mut_566 RNAs, as described in Materials and methods. These mutations affect inter-segment base-pairing, which involves regions 493–505 (green CCF) and 566–593 (black CCF), respectively. (B) Mutations disrupting RNA-RNA interactions between S6 and S11 ssRNAs were introduced into S6 RNA, yielding S6mut_1243 and S6mut_1124 RNAs. These mutations affect inter-segment base-pairing, which involves regions 1124–1136 of S6 RNA, impinging on the ability of S11 to interact with S6 (low CCF in black). In contrast, mutated S6 RNA region 1243–1262 did not significantly affect the S11:S6 interaction (CCF shown in green), confirming that this region does not contribute to the stability of the S11:S6 RNA:RNA complex, consistent with the low accessibility of this site (Figure 3—figure supplement 4).
Figure 4—figure supplement 3
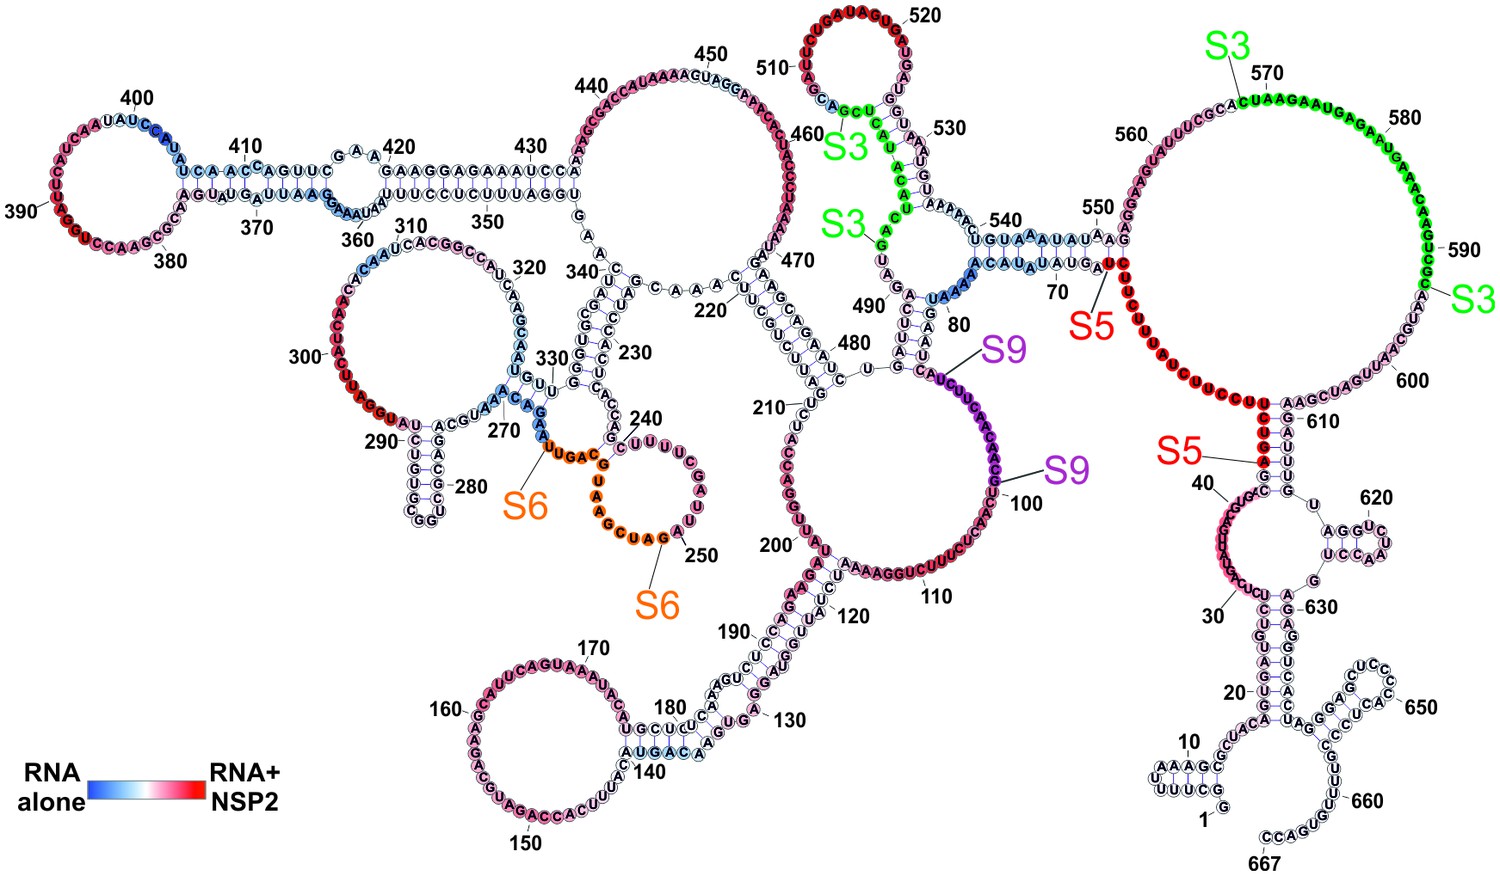
Putative sites of inter-segment interactions between S11 and S3, S5, S6 and S9.
S11 S11 RNA structure computed using folding constraints derived from the RNA-RNA SELEX experiment, as shown in Figure 2C, with mapped sites of inter-segment RNA-RNA interactions for S3 (green), S5 (red), S6 (orange) and S9 (purple). Highly accessible areas of the S11 RNA alone are shown in blue, while the sequences predominantly exposed in the presence of NSP2 are shown in red.
Figure 5

Proposed Model of the Mechanism of NSP2-mediated RNA Segment Assortment in Rotaviruses.
RV segment (+)ssRNAs (here only 3 RNAs are shown schematically as RNA1, RNA2 and RNA3) do not form stable RNA-RNA contacts with each other, consistent with the previously reported lack of oligomerization of ssRNA transcripts emerging from transcribing RV double-layered particles (Periz et al., 2013). NSP2 (doughnut-like cyan octamers) binding to ssRNAs results in their structural rearrangements concomitant with the exposure of otherwise sequestered complementary sequences (interspersed sequences shown in red, blue and green) capable of inter-segment base-pairing. The exposed complementary sequences form stable sequence-specific inter-segment contacts (RNA helices shown in red, green and blue) during the RNA assortment process. The resulting multi-RNA ribonucleoprotein complex (containing NSP2/NSP5 and multiple copies of the viral polymerase VP1/capping enzyme VP3, not shown here) may nucleate the VP2 core assembly around it. In this model, the core assembly is concurrent with further structural reorganisation of the RNA assortment complex, displacement of ssRNA-bound NSP2 octamers and (-)strand RNA synthesis by VP1.
Tables
Table 1
Apparent hydrodynamic radii (Rh) of the protein-free and NSP2-bound genomic ssRNAs
https://doi.org/10.7554/eLife.27453.012| Rh of S11 | Rh of S5 | |
|---|---|---|
| S11 + S5, no NSP2 | 9 ± 0.9 nm | 13.4 ± 0.95 nm |
| S11 + S5, heat-annealed | 13.3 ± 1.3 nm | 17.0 ± 3.0 nm |
| S11 + S5+NSP2 | 17.3 ± 2.9 nm | 20.8 ± 5.0 nm |
| S11 + S5+NSP2, proteinase K digested | 13.0 ± 1.4 | 17.0 ± 2.3 nm |
-
The Rh values are reported as mean ±SD computed from at least 6 measurements.
Additional files
-
Supplementary file 1
Estimated diffusion coefficients (D) and hydrodynamic radii (Rh) of the fluorescently labelled RV segment precursors ssRNAs.
RNA samples were measured at 25°C in 10 mM HEPES-Na, pH 7.4, 150 mM NaCl, 0.5 mM MgCl2. For each RNA sample, photon data were acquired and 20 autocorrelation functions (ACFs) were calculated, as described in Materials and methods. The ACF data were fitted to a one-component diffusion model with dark state dynamics (Materials and methods) to calculate their respective diffusion time values for each RNA sample, and their corresponding diffusion coefficients and hydrodynamic radii were computed assuming the diffusion coefficient of the free ATTO488 dye (D = 400 μm2/s at 25°C), as described in Materials and methods. Diffusion coefficients and hydrodynamic radii are reported as mean ±SD for at least 3 RNA samples preparations.
- https://doi.org/10.7554/eLife.27453.033
-
Supplementary file 2
DNA and RNA sequences used in the study.
DNA oligonucleotides used for site-directed mutagenesis and cloning purposes and RNA oligonucleotides used for FCS measurements. Genbank accession numbers are given for genome segment cDNA templates used for the in vitro transcription of S1-S11 and Non-RV control RNAs. All RNA and DNA oligonucleotides and gBlock DNA sequences were obtained commercially from Integrated DNA Technologies.
- https://doi.org/10.7554/eLife.27453.034
-
Source code 1
Source code for PAM - PIE Analysis with MATLAB, a GUI-based software package used for single-molecule fluorescence data analysis.
- https://doi.org/10.7554/eLife.27453.035
-
Transparent reporting form
- https://doi.org/10.7554/eLife.27453.036
Download links
A two-part list of links to download the article, or parts of the article, in various formats.
Downloads (link to download the article as PDF)
Open citations (links to open the citations from this article in various online reference manager services)
Cite this article (links to download the citations from this article in formats compatible with various reference manager tools)
Protein-mediated RNA folding governs sequence-specific interactions between rotavirus genome segments
eLife 6:e27453.
https://doi.org/10.7554/eLife.27453


