Complementary contributions of basolateral amygdala and orbitofrontal cortex to value learning under uncertainty
- University of California, Los Angeles, United States
Figures
Figure 1
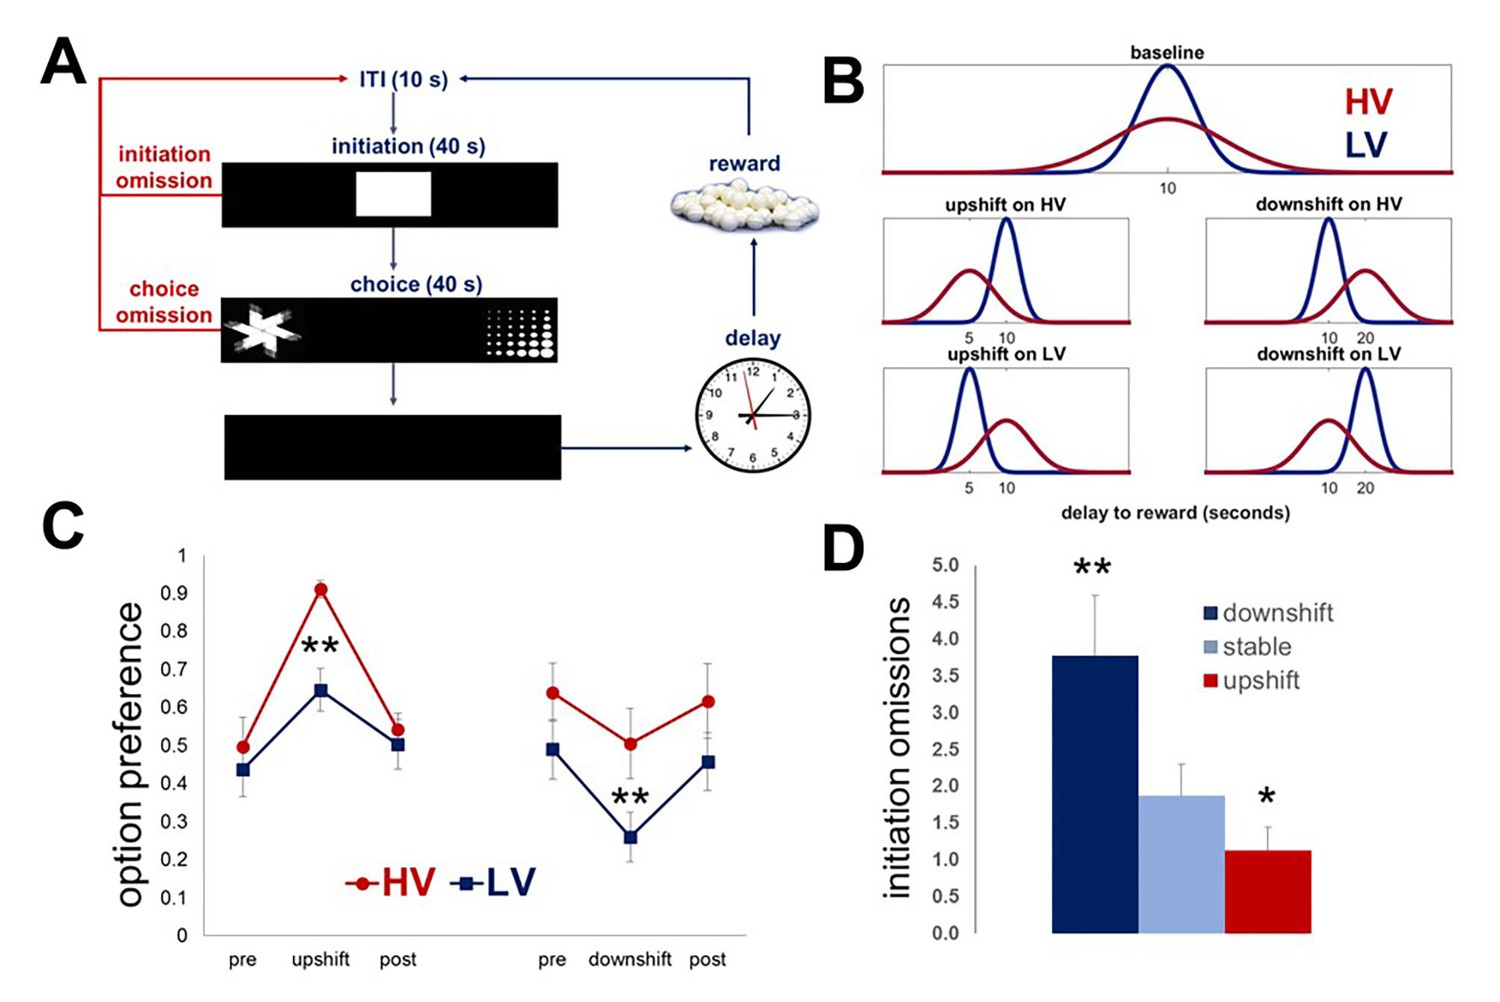
Task design and performance of intact animals.
Our task is designed to investigate the effects of expected outcome uncertainty on value learning. (A) Each trial began with stimulus presentation in the central compartment of the touchscreen. Rats (n = 8) were given 40 s to initiate a trial. If 40 s passed without a response, the trial was scored as an ‘initiation omission.’ Following a nosepoke to the central compartment, the central stimulus disappeared and two choice stimuli were presented concurrently in each of the side compartments of the touchscreen allowing an animal a free choice between two reward options. An animal was given 40 s to make a choice; failure to select an option within this time interval resulted in the trial being scored as ‘choice omission’ and beginning of an ITI. Each response option was associated with the delivery of one sugar pellet after a delay interval. (B) The delays associated with each option were pooled from distributions that are identical in mean value, but different in variability: LV (low variability, shown in blue) vs. HV (high variability, shown in red); ~N(µ, σ): μ = 10 s, σHV=4s, σLV=1s. Following the establishment of stable performance, rats experienced value upshifts (µ = 5 s; σ kept constant) and downshifts (μ = 20 s) on each option independently, followed by return to baseline conditions. Each shift and return to baseline phase lasted for five 60-trial sessions. (C) Regardless of the shift type, animals significantly changed their preference in response to all shifts (all p values<0.05). However, significant differences between HV and LV in choice adaptations were observed for both upshifts and downshifts: greater variance of outcome distribution at baseline facilitated behavioral adaptation in response to value upshifts (HV vs LV difference, p=0.004), but rendered animals suboptimal during downshifts (p=0.027); conversely, low expected uncertainty at baseline led to decreased reward procurement during upshifts in reward. The data are shown as group means for option preference during pre-baseline, shift and post-baseline conditions, ± SEM. The asterisks signify statistical differences between HV and LV conditions. (D) The number of initiation omissions was significantly increased during downshift (p=0.004) and decreased during upshifts (p=0.017) in value, regardless of the levels of expected uncertainty, demonstrating effects of overall environmental reward conditions on motivation to engage in the task. The data are shown as group means by condition +SEM. *p<0.05, **p<0.01. Summary statistics and individual animal data are provided in Figure 1—source data 1.
-
Figure 1—source data 1
Summary statistics and individual data for naïve animals performing the task.
- https://doi.org/10.7554/eLife.27483.004
Figure 2
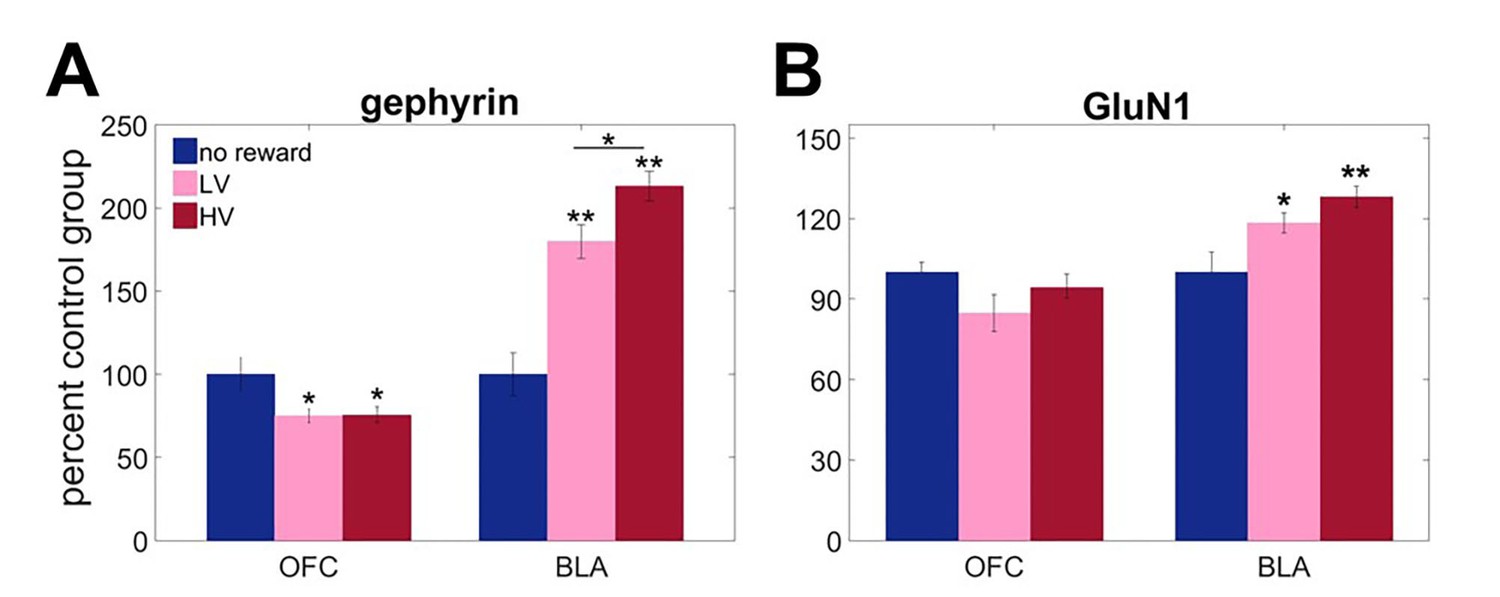
Region-specific alterations in gephyrin and GluN1 expression induced by experience with outcome uncertainty.
Three separate groups of animals were trained to respond to visual stimuli on a touchscreen to get a reward after variable delays. The values of outcomes were identical to the main task but no choice was given. One group was trained under LV conditions, the second under HV (matched in total number of rewards received), and the third control group received no rewards (n = 8 per group). We assessed expression of A gephyrin (a reliable proxy for membrane-inserted GABAA receptors mediating fast inhibitory transmission) and B GluN1 (an obligatory subunit of glutamate NMDA receptors) in BLA and ventral OFC. Biochemical analyses revealed uncertainty-dependent upregulation in gephyrin in BLA, that was maximal following HV training (p<0.0001). Similarly, GluN1 showed robust upregulation in response to experienced reward in BLA (no reward vs LV p=0.045; no reward vs HV p=0.002), however post hoc analyses failed to detect a significant difference between HV and LV training (p=0.637). In ventral OFC, gephyrin was downregulated in response to experiences with reward in general (no reward vs LV p=0.045; no reward vs HV p=0.042) and did not depend on variability in outcome distribution; no changes were observed in GluN1. The data are shown as group means by condition +SEM. *p<0.05, **p<0.01 Summary statistics and individual animal data are provided in Figure 2—source data 1.
-
Figure 2—source data 1
Summary statistics and individual data for GluN1 and gephyrin expression in BLA and OFC.
- https://doi.org/10.7554/eLife.27483.008
Figure 3
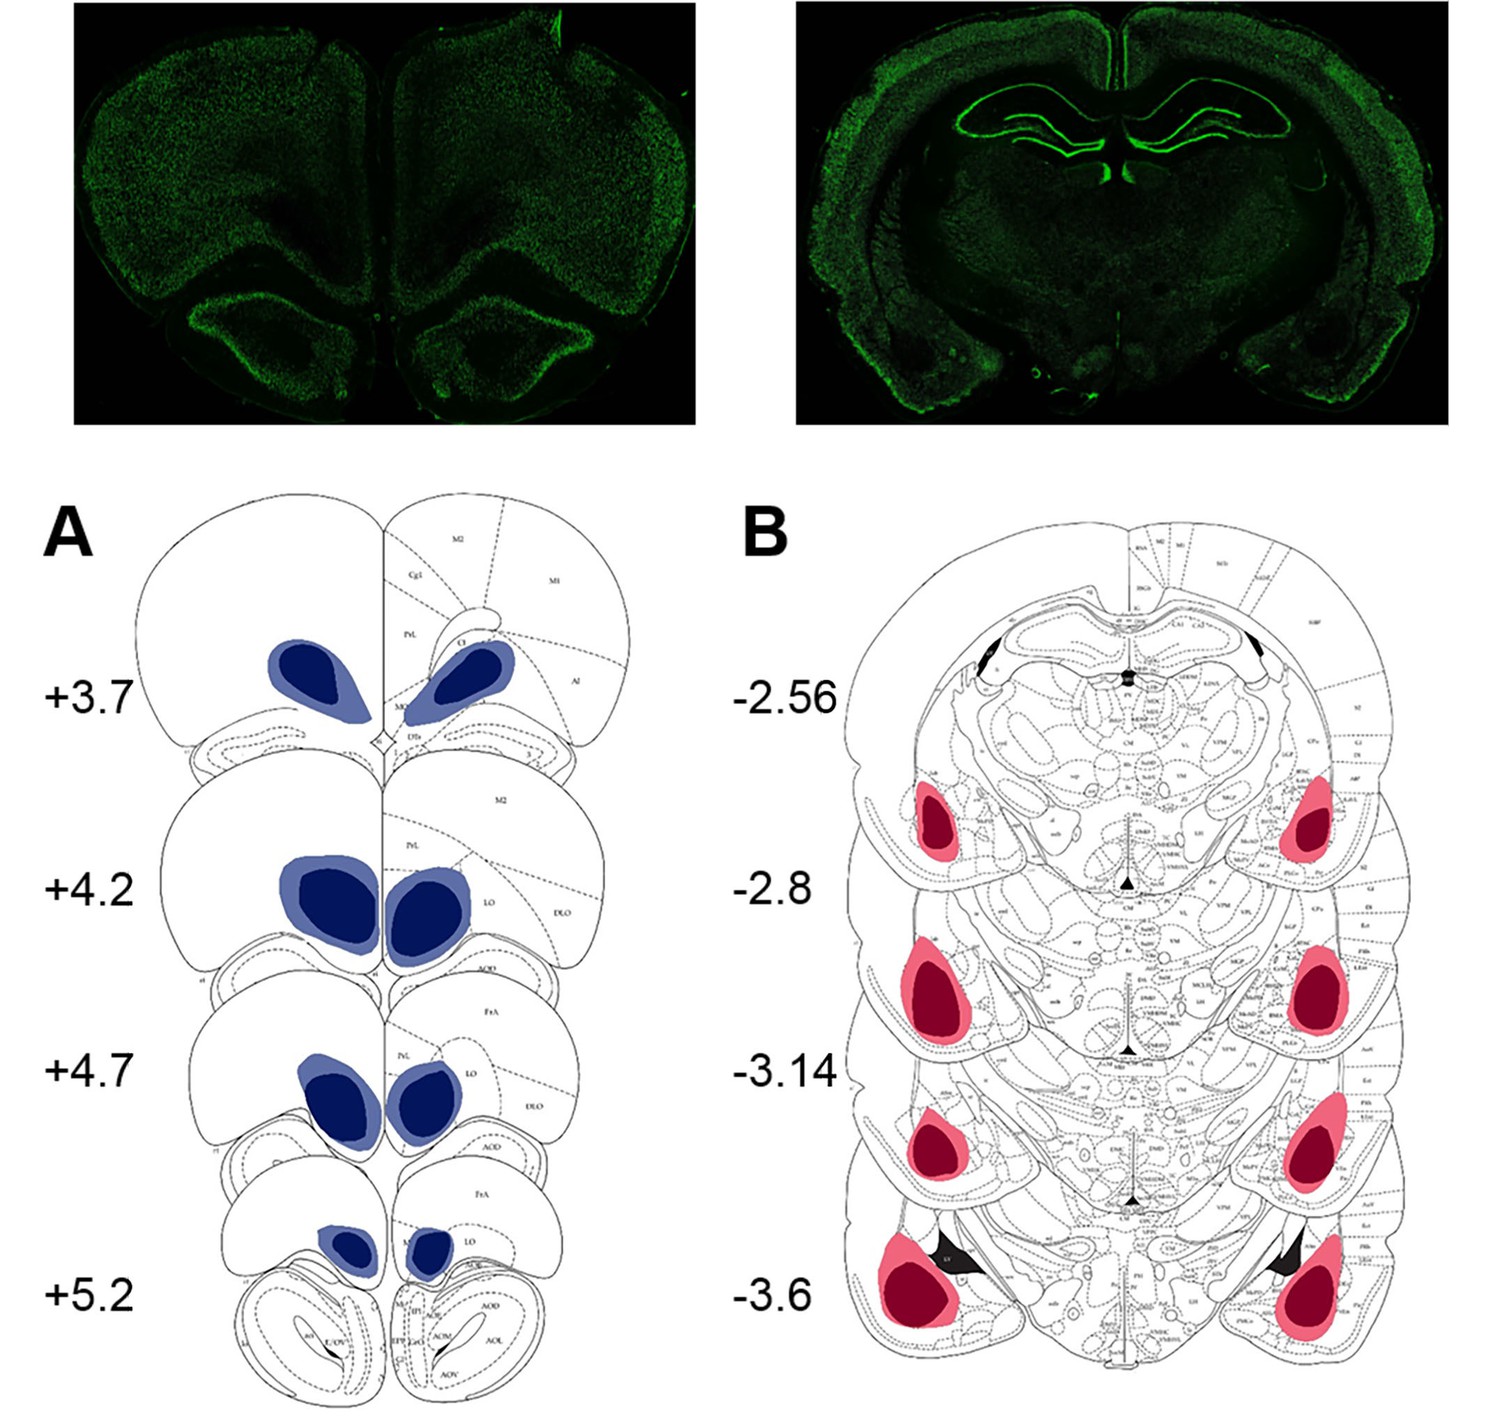
Location and extent of intended lesion (colored regions) on standard coronal sections through ventral OFC and BLA.
The extent of the lesions was assessed after the completion of behavioral testing by staining for a marker of neuronal nuclei, NeuN. (A) Top: representative photomicrograph of a NeuN stained coronal section showing ventral OFC lesion. Bottom: depictions of coronal sections adapted from (Paxinos and Watson, 1997). The numerals on the lower left of each matched section represent the anterior-posterior distance (mm) from Bregma. Light and dark blue represent maximum and minimum lesion area across animals, respectively. Though coordinates were aimed at the ventral orbital region, lesion extent includes anterior medial orbital cortex as well. (B) Top: representative photomicrograph of a NeuN stained coronal section showing BLA lesion. Bottom: depictions of coronal sections with numerals on the lower left of each matched section representing the anterior-posterior distance (mm) from Bregma. Light and dark red represent maximum and minimum lesion area across animals, respectively.
Figure 4 with 2 supplements
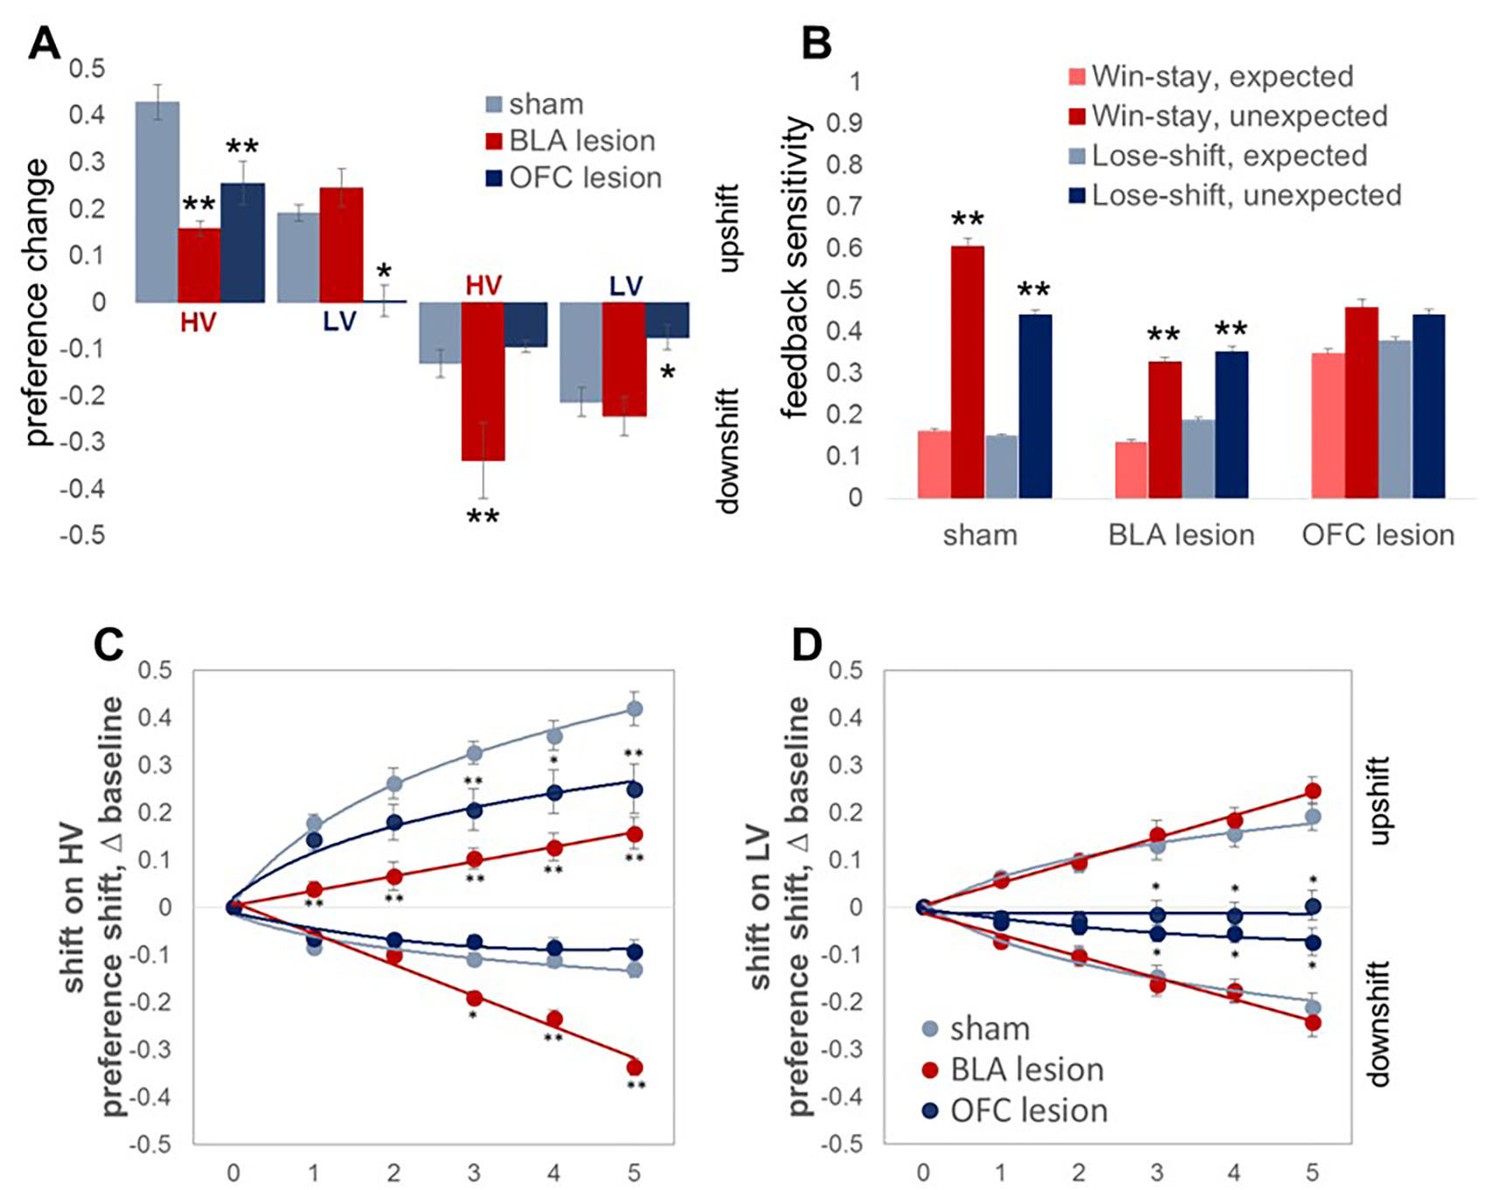
Changes in choice preference in response to value shifts and learning strategies in experimental groups.
(A) The OFC-lesioned rats (n = 8) were less optimal on our task: they changed their option preference to a significantly lesser degree compared to control animals (n = 8) during upshifts on HV (p=0.005) and LV (p=0.039), as well as the downshift on LV option (p=0.015). Conversely, animals with BLA lesions (n = 8) changed their option preference to a lesser degree on HV upshifts (p<0.0001), but compensated by exaggerated adaptations to HV downshifts (p<0.0001). Group means for option preference during pre-baseline, shift and post-baseline conditions are shown in Figure 4—figure supplement 1. We broke the trials into two types: when the delays fell within distributions experienced for each option at baseline (expected outcomes) and those in which the degree of surprise exceeded that expected by chance (unexpected outcomes). Win-stay/lose-shift scores were computed based on trial-by-trial data: a score of 1 was assigned when animals repeated the choice following better than average outcomes (win-stay) or switched to the other alternative following worse than average outcomes (lose-shift). Sham-lesioned animals demonstrated increased sensitivity to unexpected feedback (p values < 0.001). Similarly, the ability to distinguish between expected and unexpected outcomes was intact in BLA-lesioned animals (p values < 0.001), although their sensitivity to feedback decreased overall. In contrast, OFC-lesioned animals failed to distinguish expected from unexpected fluctuations. (C,D) To examine the learning trajectory we analyzed the evolution of option preference. BLA-lesioned animals were indistinguishable from controls during the shifts on LV option. Whereas, this experimental group demonstrated significantly attenuated learning during the upshift on HV (p values < 0.0001 for all sessions) and potentiated performance during sessions 3 through 5 on HV downshift (p values < 0.05) compared to sham group. Conversely, learning in OFC-lesioned animals was affected on the majority of the shift types: these animals demonstrated significantly slower learning during sessions 3 through 5 during upshift on HV (p values < 0.05), all sessions during upshift on LV (p values < 0.05) and sessions 3 through 5 during downshift on LV (p values < 0.05). Session 0 refers to baseline/pre-shift option preference. Despite these differences in responses to shifts in value under conditions of uncertainty, we did not observe any deficits in basic reward learning in either the BLA- or OFC-lesioned animals, shown in Figure 4—figure supplement 2. The data are shown as group means by condition +SEM. *p<0.05, **p<0.01. Summary statistics and individual animal data are provided in Figure 4—source data 1 and Figure 4—source data 2.
-
Figure 4—source data 1
Summary statistics and individual data for changes in choice preference and learning strategies.
- https://doi.org/10.7554/eLife.27483.011
-
Figure 4—source data 2
Summary statistics and individual data demonstrating experimental group differences in response to shifts.
- https://doi.org/10.7554/eLife.27483.012
Figure 4—figure supplement 1
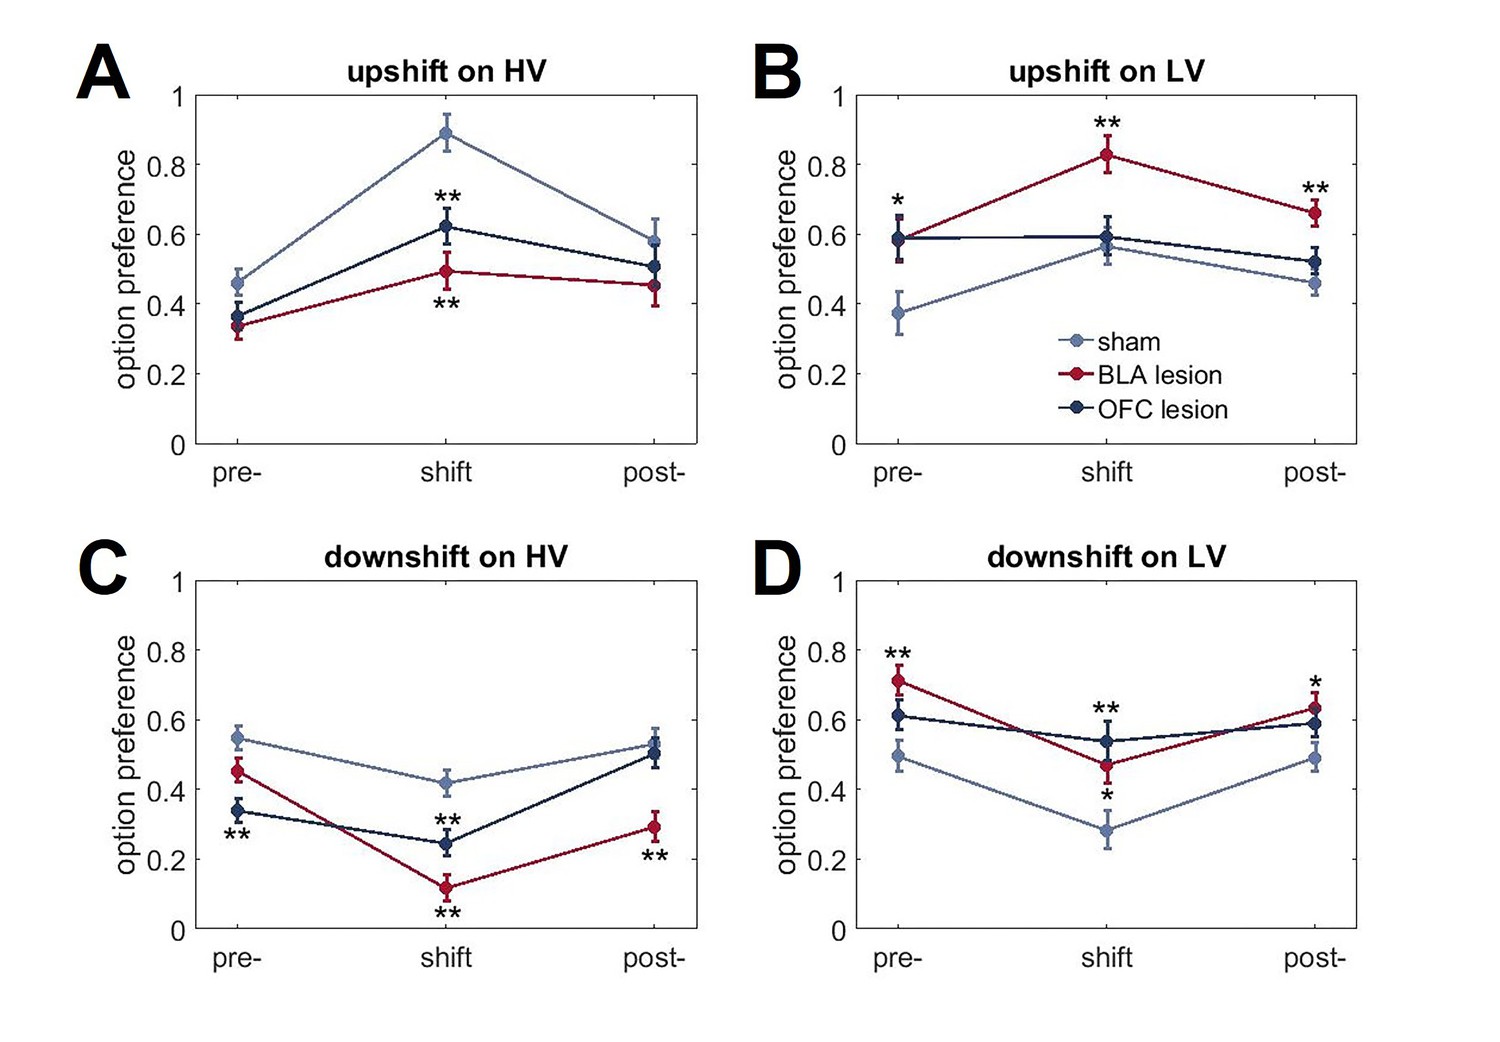
Changes in choice behavior in response to value shifts.
(A) Both lesion groups demonstrated reduced adaptations to value upshifts on HV option (p<0.01). (B). BLA-lesioned animals chose LV option more frequently than controls when its value was increased (p<0.01). (C, D) Both BLA- and OFC-lesioned animals also showed reduced HV option preference (p<0.01) and increased LV option preference (p<0.05) during downshifts compared to sham animals. This pattern of results can be explained by changes in choice behavior even under baseline conditions in BLA- and OFC-lesioned animals that interacted with rats’ ability to learn about shifts in value. Indeed, there were significant group differences in pre-shift baseline preferences. The data are shown as group means for option preference during pre-baseline, shift and post-baseline conditions, ± SEM. *p<0.05, **p<0.01. Summary statistics and individual animal data are provided in Figure 4—source data 2.
Figure 4—figure supplement 2

The lack of group differences in basic reward learning.
Our surgeries took place prior to any exposure to the testing apparatus or behavioral training. Both lesioned groups were indistinguishable from controls at early stages of the task. During pre-training, animals first learned to respond to visual stimuli presented in the central compartment of the screen within 40 s time interval in order to receive the sugar reward (stimulus response). Next, rats learned to initiate the trial by nosepoking the bright white square stimulus presented in the central compartment of the touchscreen; this response was followed by disappearance of the central stimulus and presentation of a target image in one side compartment of the touchscreen (trial initiation). Responses to the target image produced an immediate reward. The last stage of training was administered to familiarize animals with delayed outcomes. The protocol was identical to the previous stage, except the nosepoke to the target image and reward delivery were separated by a 5 s stable delay (certain 5 s delay). (A, B). Animals in all groups took similar number of days to learn to nosepoke visual stimuli on the touchscreen to receive sugar rewards (p=0.796) and to initiate a trial (p=0.821). (C, D). There were no group differences in responses to the introduction of a 5 s delay interval during pre-training (p=0.518) or the number of sessions to reach stable performance during the initial baseline phase of our uncertainty task (p=0.772). The data are shown as group means ± SEM.
Figure 5 with 1 supplement
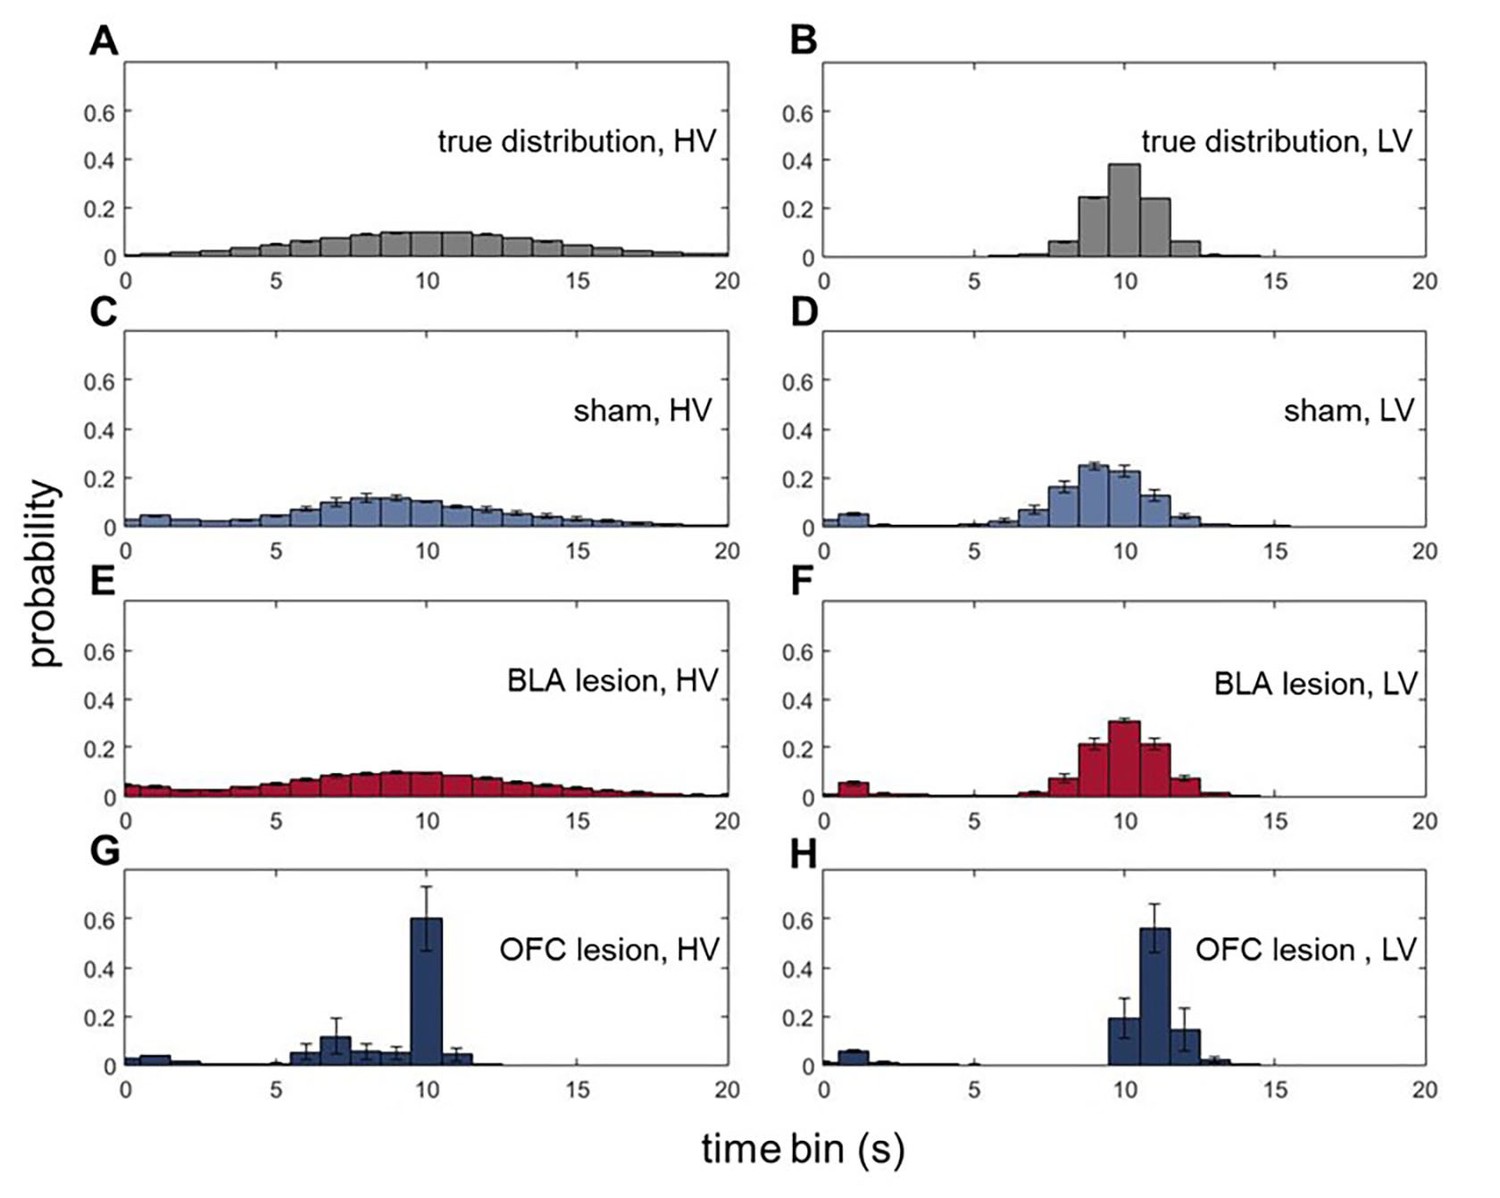
Animals with ventral OFC lesions fail to represent expected uncertainty in reward delays.
We assessed whether BLA and ventral OFC lesions alter animals’ ability to form expectations about the timing of reward delivery. On each trial during all baseline conditions where the overall value of LV and HV options were equivalent, reward port entries were recorded in 1 s bins during the waiting period. There were no significant differences in the means of expected reward delivery times across groups (p=0.394). Similarly, the groups were matched in the total number of reward port entries (p=0.636) as shown in Figure 5—figure supplement 1. Whereas the distributions of reward-seeking times in BLA-lesioned animals were indistinguishable from control animals’ and the true delays (A–F), OFC-lesioned animals concentrated their reward port entries in the time interval corresponding to mean delays (G,H), suggesting that while these animals can infer the average outcome, they fail to represent the variance (i.e., expected uncertainty). We also considered the changes in waiting times across our task; these data are shown in Figure 5—figure supplement 1. Each bar in histogram plots represents mean frequency normalized to total number of reward port entries ±SEM.
Figure 5—figure supplement 1
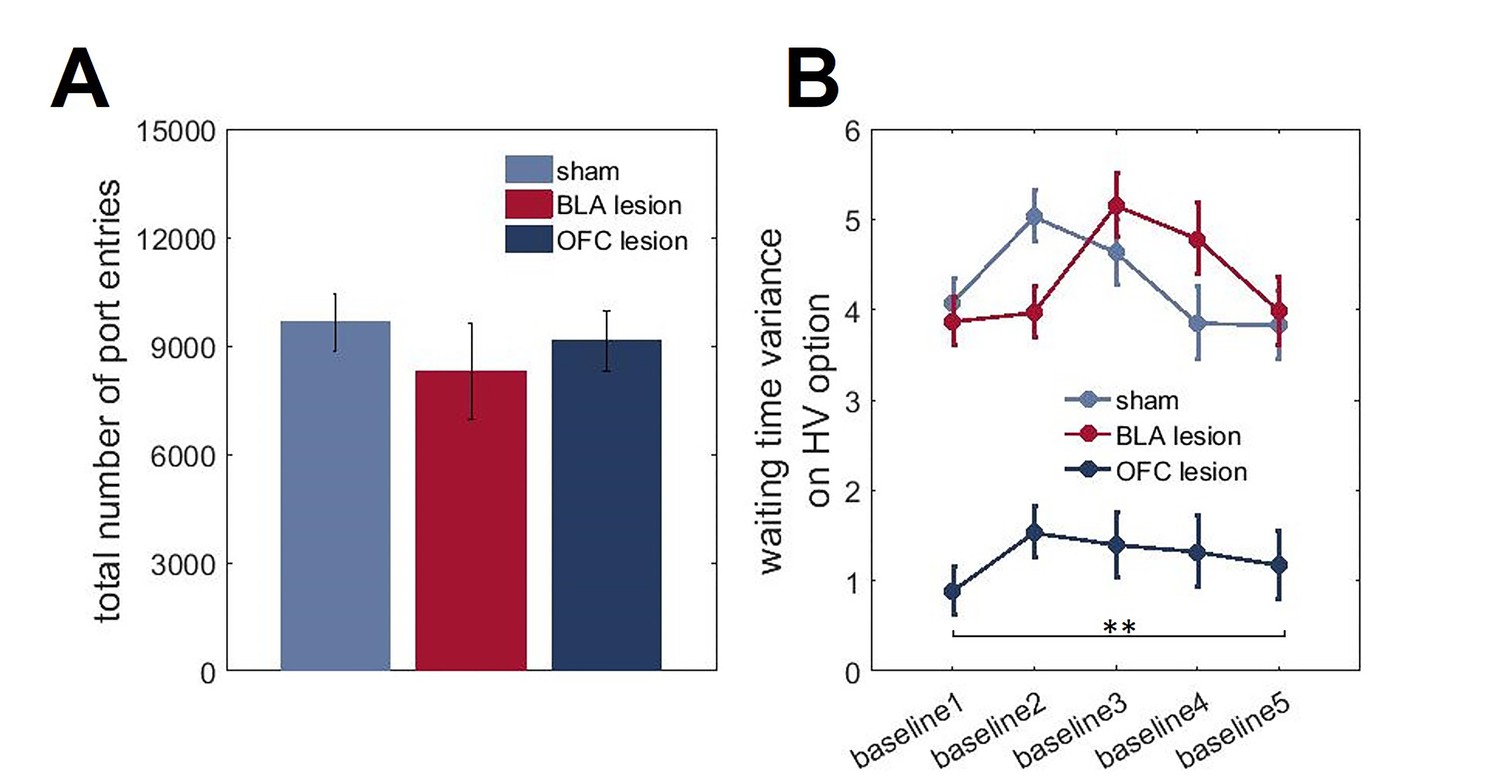
Total number of reward port entries and changes in waiting time variances across task phases.
On each trial during all baseline conditions where the overall value of LV and HV options were equivalent, reward port entries were recorded in 1 s bins during the waiting period. (A) All groups of animals were matched in the total number of reward port entries (p=0.636). (B) We also considered the changes in waiting times across our task. We calculated the variance of reward port entry times during each baseline (initial phase of the task and four baselines separating the shifts) separately for each animal. There was a significant main effect of lesion group on waiting time variances for HV option (p<0.0001) with OFC-lesioned animals demonstrating consistently lower variability in their waiting behavior despite experience with shifts. The data are shown as group means ± SEM, **p<0.01.
Figure 6
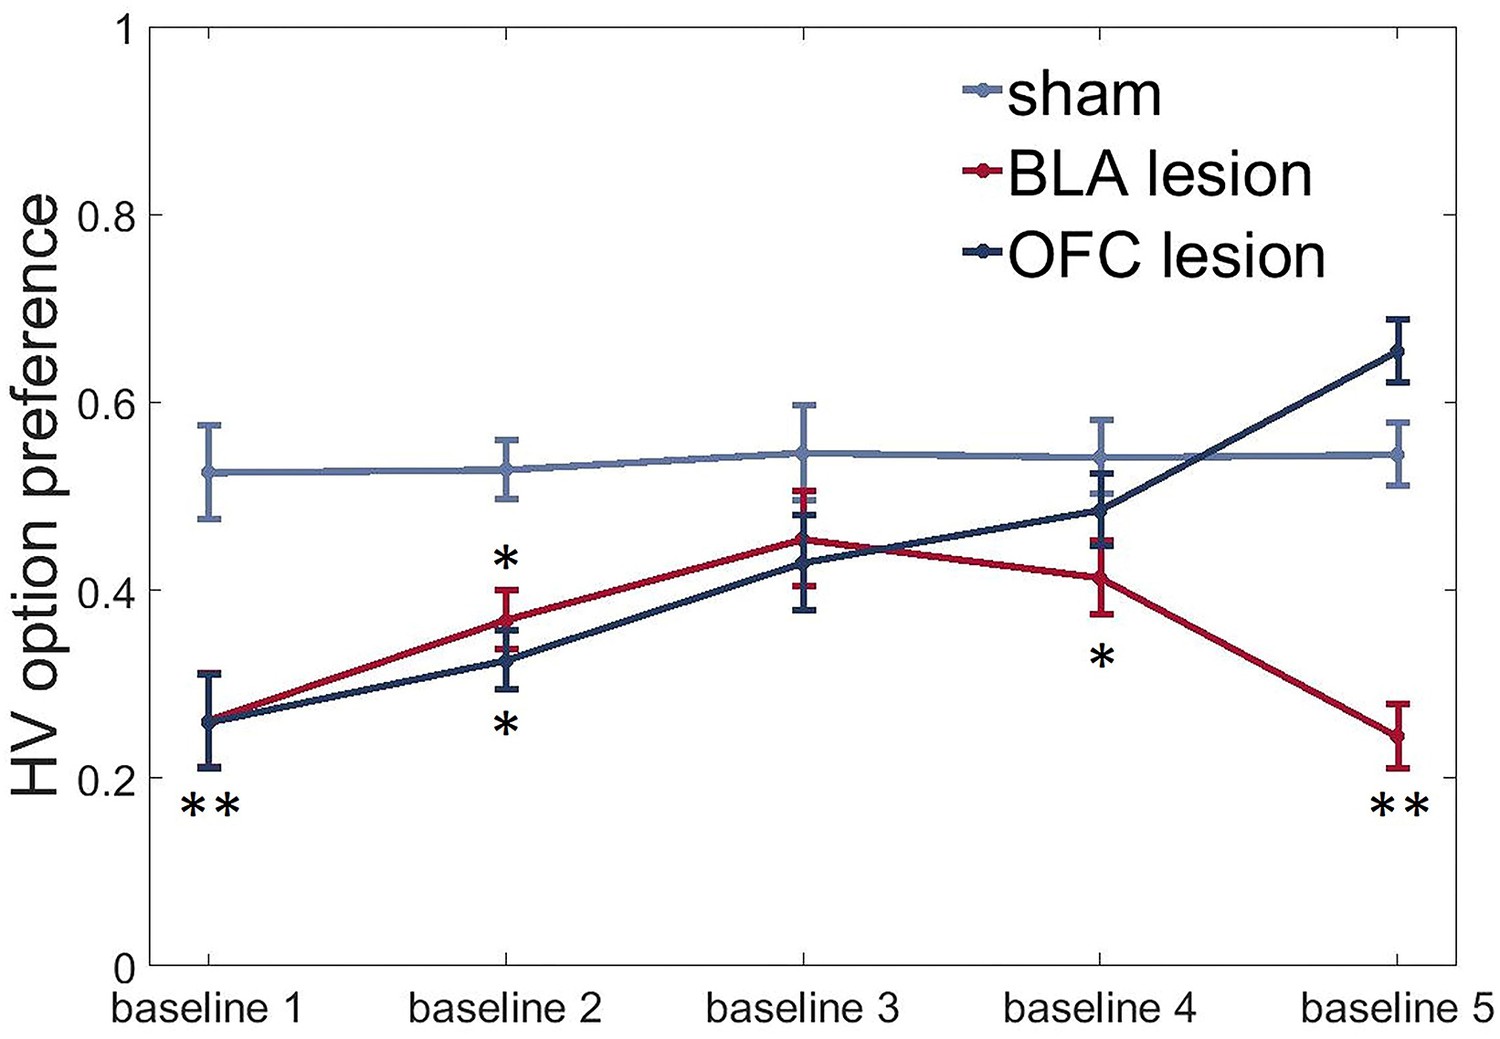
BLA and ventral OFC lesions induce uncertainty-avoidance.
We observed significantly reduced preference for the HV option under baseline conditions in both experimental groups compared to control animals at the beginning of testing (sham vs BLA: p=0.002; sham vs OFC: p=0.002). BLA-lesioned animals continued to avoid the risky option for most of the experiment (all p values < 0.05, except for baseline three assessment when this group was not different from control animals). OFC-lesioned animals progressively increased their choices of HV option during baseline conditions with repeated testing: they were indistinguishable from controls during baselines 3 and 4 and even demonstrated a trend for higher preference than control group during the last baseline [post hoc test, OFC vs sham: p=0.059]. The data are shown as group means by condition ±SEM, *p<0.05, **p<0.01. Summary statistics and individual animal data are provided in Figure 6—source data 1.
-
Figure 6—source data 1
Summary statistics and individual data for HV option preference following lesions.
- https://doi.org/10.7554/eLife.27483.019
Videos
Video 1
An animal performing the task during upshift on HV option.
During an upshift in value on each option, the mean of the delays to reward was reduced to 5 s with variance kept the same as during baseline conditions.
Video 2
An animal performing the task during downshift on HV option.
During a downshift in value on each option, the mean of the delays to reward was increased to 20 s with variance kept constant.
Tables
Table 1
Model comparison. Lower BIC values indicate better model fit (in bold); number of free parameters and parameter values ± SEM of the best fitting model are provided for each group. Trial-by-trial choices of the intact animals were best captured by the dynamic learning rate model incorporating RPE scaling proportional to expected uncertainty and facilitation of learning in response to surprising outcomes (Full model). BLA lesions selectively eliminated learning rate scaling in response to surprise (RW+expected uncertainty model provided the best fit). Whereas OFC lesioned animals still increased learning rates in response to surprising events (PH model), RPE scaling proportional to expected outcome uncertainty was lost in this group. Furthermore, the overall learning rates were reduced in OFC-lesioned animals (p=0.01). Finally, we observed significantly lower values of β (inverse temperature parameter in softmax choice rule) in both BLA- and OFC-lesioned animals (p<0.0001), suggesting that their behavior is less stable, more exploratory and less dependent on the difference in learned outcome values. Asterisks indicate parameter values that were significantly different from the control group (in bold).
| Model | RW | PH | RW+expected uncertainty | Full | ||||||
|---|---|---|---|---|---|---|---|---|---|---|
| # parameters | 3 | 4 | 5 | 6 | ||||||
| BIC | parameter value ± SEM | |||||||||
| k | α, value | β | η | α, risk | ω | |||||
| sham | 26519.39 | 26900.66 | 26384.18 | 25681.7 | 0.29 ± 0.03 | 0.09 ± 0.01 | 14.1 ± 0.99 | 0.33 ± 0.04 | 0.56 ± 0.08 | 3.04 ± 0.11 |
| BLA lesion | 26201.89 | 26864.74 | 25153.82 | 27162.82 | 0.32 ± 0.02 | 0.07 ± 0.01 | 7.4 ± 0.6* | n/a | 0.58 ± 0.06 | 3.40 ± 0.4 |
| OFC lesion | 24292.54 | 23171.46 | 24630.92 | 23994.5 | 0.3 ± 0.05 | 0.05 ± 0.01* | 5.5 ± 0.68* | 0/32 ± 0.05 | n/a | n/a |
Download links
A two-part list of links to download the article, or parts of the article, in various formats.
Downloads (link to download the article as PDF)
Open citations (links to open the citations from this article in various online reference manager services)
Cite this article (links to download the citations from this article in formats compatible with various reference manager tools)
Complementary contributions of basolateral amygdala and orbitofrontal cortex to value learning under uncertainty
eLife 6:e27483.
https://doi.org/10.7554/eLife.27483


