Ratiometric sensing of BiP-client versus BiP levels by the unfolded protein response determines its signaling amplitude
- San Raffaele Scientific Institute, Italy
- Università Vita-Salute San Raffaele, Italy
- FIRC Institute of Molecular Oncology, Italy
Figures
Figure 1 with 1 supplement
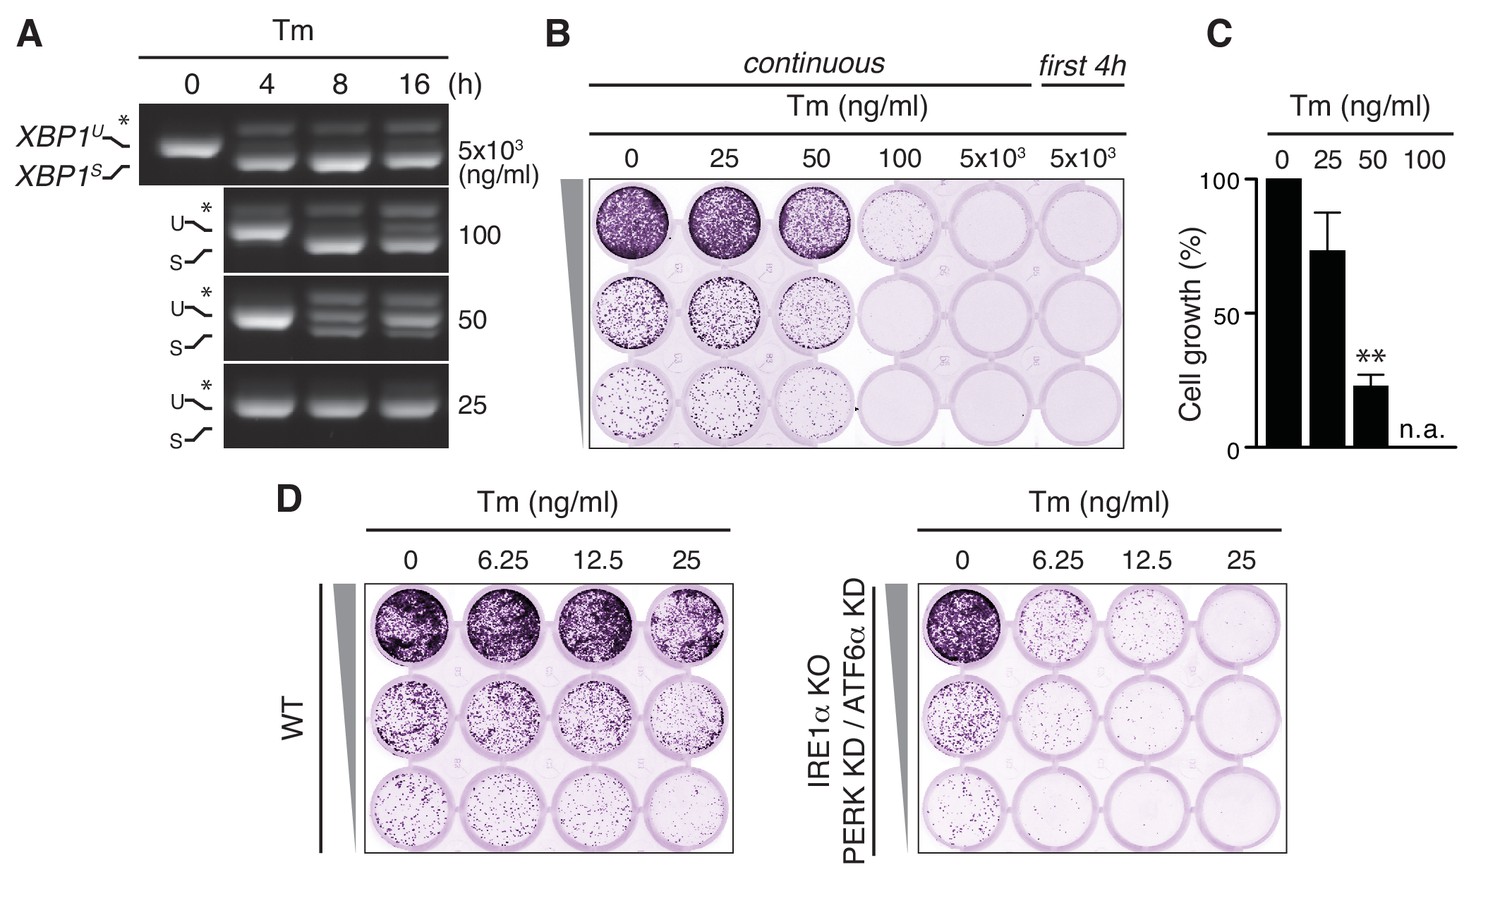
Tunicamycin has pleiotropic cytotoxic effects.
(A) HeLa S3 cells were treated with Tm at various concentrations and for various durations, as indicated, before mRNA was isolated from cells for RT-PCR analysis with oligos specific for XBP1. PCR fragments corresponding to spliced (XBPS) and unspliced (XBPU) XBP1 were separated on gel. A hybrid product that is formed during the PCR reaction (Shang and Lehrman, 2004) is denoted by an asterisk. The ratio of (XBPS)/(XBPS +XBPU) is indicative of the extent of IRE1α activation. (B) Cells as in (A) were seeded upon 1:5 serial dilution into 24-well plates and treated continuously or only for the first 4 hr upon seeding with various concentrations of Tm, as indicated. After 7 days of growth, cells were fixed and stained with crystal violet. (C) Quantitation of the crystal violet staining shown in (B) as a measure of cell growth, except for conditions that fully abrogated growth; n.a. = not assessed. Staining of untreated cells was set at 100%, and values are shown in a bar graph. Mean and s.e.m. are shown; n = 3. Statistical significance in a one-sample t-test of differences in crystal violet staining compared to untreated samples in (B) and replicate experiments was determined as a proxy for growth (**p≤0.01). (D) Cell growth assay as in (B) of HeLa S3 cells in which UPR transducers were deleted (IRE1α KO) or silenced (PERK KD and ATF6α KD) or not (WT), treated with Tm at various concentrations, as indicated.
-
Figure 1—source data 1
Data and calculations that were used to generate the bar graph in Figure 1C.
- https://doi.org/10.7554/eLife.27518.004
Figure 1—figure supplement 1
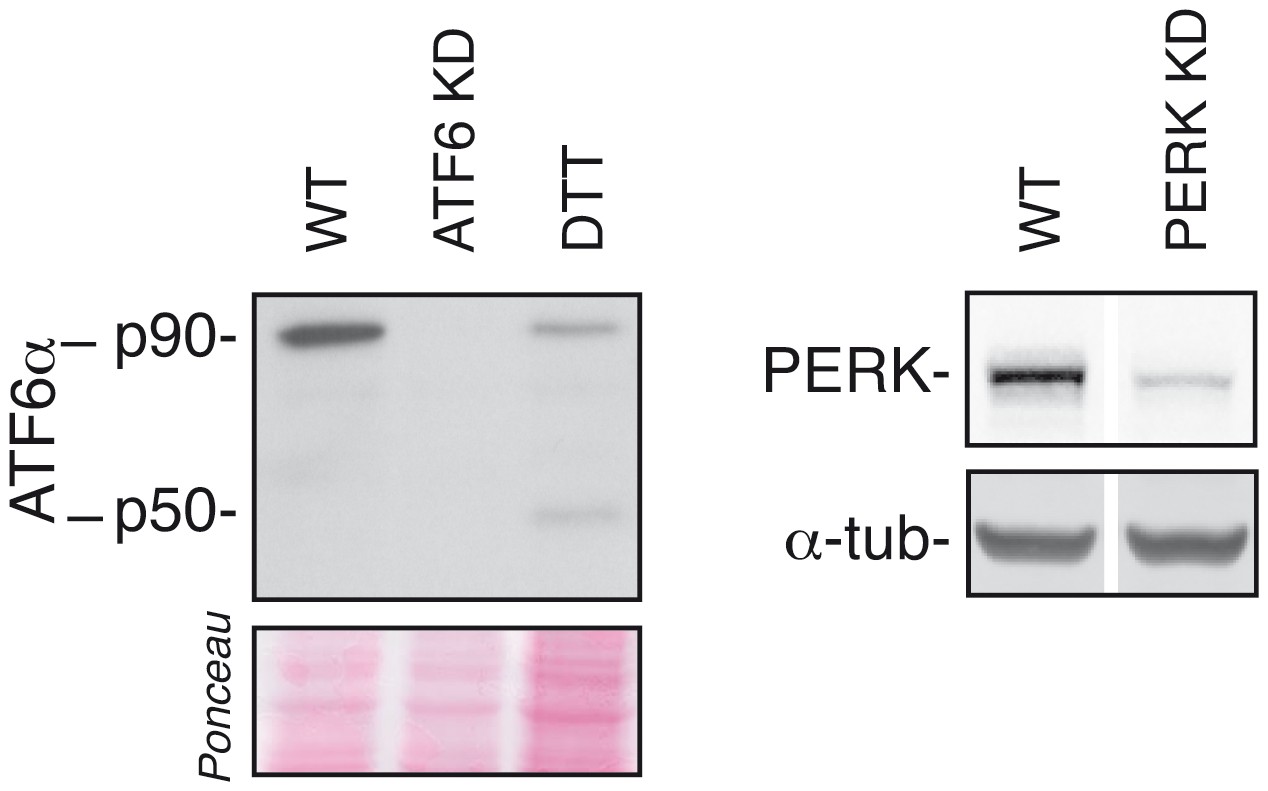
Efficiency of ATF6α and PERK silencing.
HeLa-µs cells were transfected with siRNAs (KD) targeting ATF6α or PERK or not (WT). Levels of ATF6α and PERK were assessed as in Figure 2A; 1 mM DTT treatment for 1 hr was used as a positive reference for ATF6α cleavage.
Figure 2 with 1 supplement
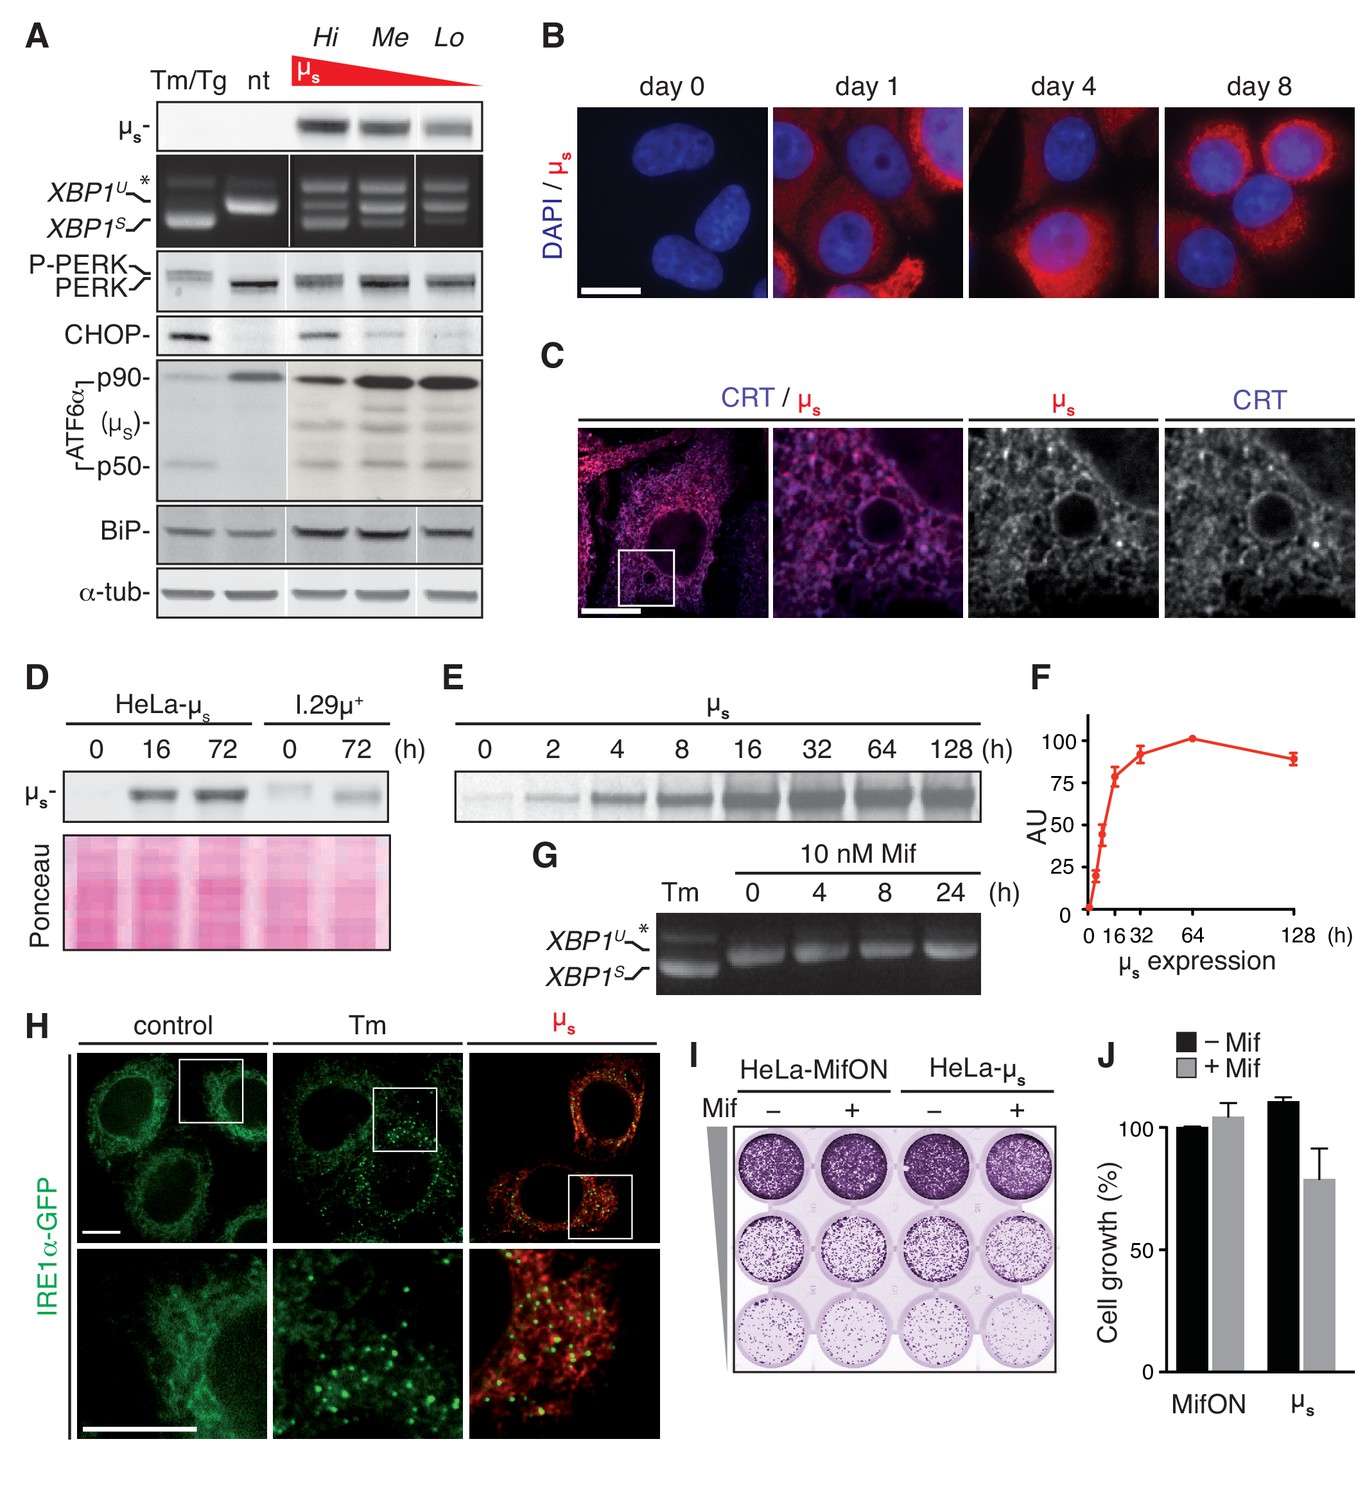
A model for proteostatically induced ER stress.
(A–F,H–J) Expression of µs in HeLa-µs cells was induced with 0.5 nM Mif. (A,G,H) The UPR was pharmacologically induced as a reference for 4 hr with 5 µg/ml Tm, or—for analysis of ATF6α in (A) only—for 1.5 hr with 300 nM Tg (since Tm leads to deglycosylation of ATF6α). (A,D) Immunoblotting revealed levels of µs, CHOP, BiP and α-tubulin. A shift to a lower mobility phosphorylated form, P-PERK, and the appearance of CHOP revealed activation of PERK. The release of the p50 cleavage product from the p90 precursor revealed activation of ATF6α. Cross-reaction of the secondary antibody against anti-ATF6α with µs is denoted. (A,G) Splicing of XBP1 was assessed as in Figure 1A. (A) Three different clones of HeLa-µs cells with decreasing µs expression levels: high (Hi), medium (Me), or low (Lo) were induced for 16 hr. Non-treated (nt) or Tm-treated Hi HeLa-µs served as references. (B,C,H) Immunofluorescence revealed µs (red) and CRT (blue), which marks the ER (C) at the indicated times before or after induction (B) or after 8 hr induction (C,H). Nuclei were stained with DAPI (blue) (B). (C,H) The area that is boxed is shown by 3.5-fold magnification; scale bars represent 10 µm. (D) Samples were derived from equal numbers (7 × 10⁴) of HeLa-µs or I.29µ+ lymphomas induced with Mif or stimulated with 20 µg/ml lipopolysaccharide (LPS), respectively, for the indicated times. Ponceau staining of the blot serves as a loading control. (E) HeLa-µs cells were pulse labeled with 35S labeled methionine and cysteine for 10 min at the indicated times after induction. Immunoprecipitated µs was resolved by gel electrophoresis (F). Levels of radio-labeled µs in (E) were quantified by phosphor imaging. The maximal signal for µs (at 64 hr) was set at 100. (G) HeLa-MifON cells were treated with a high dose of Mif (10 nM) for the indicated times. (H) In HeLa-µs cells in which IRE1α was replaced with doxycycline (Dox)-inducible IRE1α-GFP (green), IRE1α-GFP expression was tuned with 10 nM Dox to levels that allowed satisfactory detection of IRE1α-GFP by fluorescence microscopy. (I) Cell growth assay as in Figure 1B of HeLa-MifON and HeLa-µs induced continuously with Mif or not. (J) Quantitation of (I), performed as in Figure 1C. Mean and s.e.m. are shown, n = 2. There is no statistical significance in a one-sample t-test of differences in growth between conditions.
-
Figure 2—source data 1
Data and calculations that were used to generate the bar graphs in Figures 2F and J.
- https://doi.org/10.7554/eLife.27518.007
Figure 2—figure supplement 1
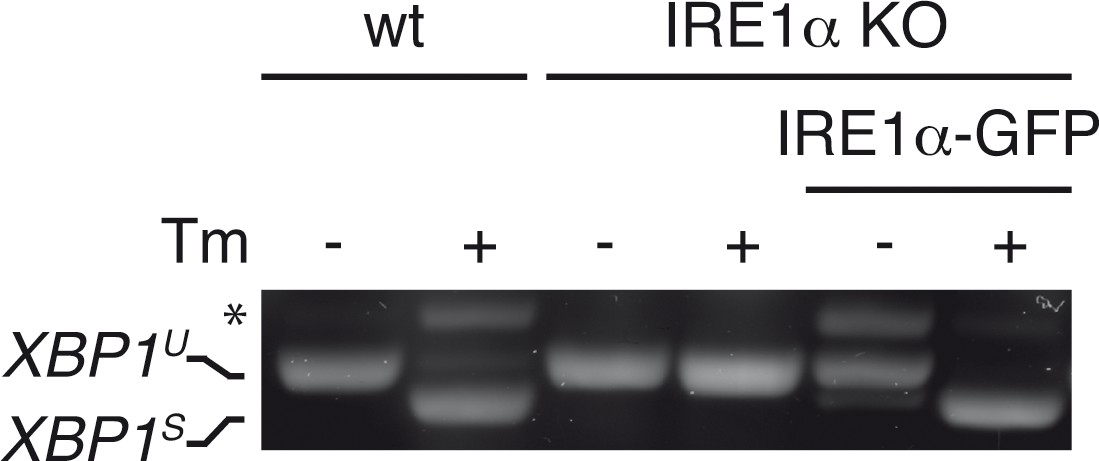
Functional reconstitution of IRE1α-KO cells with IRE1α-GFP.
Wild-type (WT) or IRE1α knock out (KO) HeLa cells, whether reconstituted with IRE1α-GFP or not, were treated (+) or not (–) with 5 µg/ml Tm for 4 hr. XBP1 mRNA splicing was assessed as in Figure 1A. Functional reconstitution did not require Dox induction of IRE1α-GFP, as ‘leaky’ expression was sufficient.
Figure 3

The accumulation of clients in the ER rather than the flux of secretory load drives the UPR.
(A–D) HeLa clones constructed to express λ inducibly, either alone (λ) or in conjunction with µs (µs + λ) at different stoichiometries, ranging from µs being in excess to λ being in excess, all under control of Mif, were induced with 0.5 nM in parallel to the HeLa-µs cells for 16 hr to express IgM subunits. Non-treated (nt) HeLa-µs cells served as a reference. Supernatants (secreted) and cell lysates (intracellular) were separated by reducing (A) or non-reducing (B) gel electrophoresis. Levels of µs, λ (A), CHOP, BiP (C) and α-tubulin (A,C), as well as activation of the UPR pathways (C) were assessed as in Figure 2A. (B) Immunobloting of µs (red) and λ (green) reveals disulfide linked assembly intermediates, as indicated: µλ, µ2, µ2λ2, and high molecular weight (HMW) polymeric assemblies of µs and λ. Simultaneous immunodetection of both IgM subunits resulted in yellow signal. (D) Quantitation of BiP levels shown in (C) and replicate experiments. Mean and s.e.m. are shown, n = 3. Statistical significance in a one-sample t-test of differences in BiP levels is indicated (*p≤0.05). (E) Schematic of BiP associating with the CH1 domain of µs until it is displaced by λ (if available).
-
Figure 3—source data 1
Data and calculations that were used to generate the bar graph in Figure 3D.
- https://doi.org/10.7554/eLife.27518.009
Figure 4 with 4 supplements
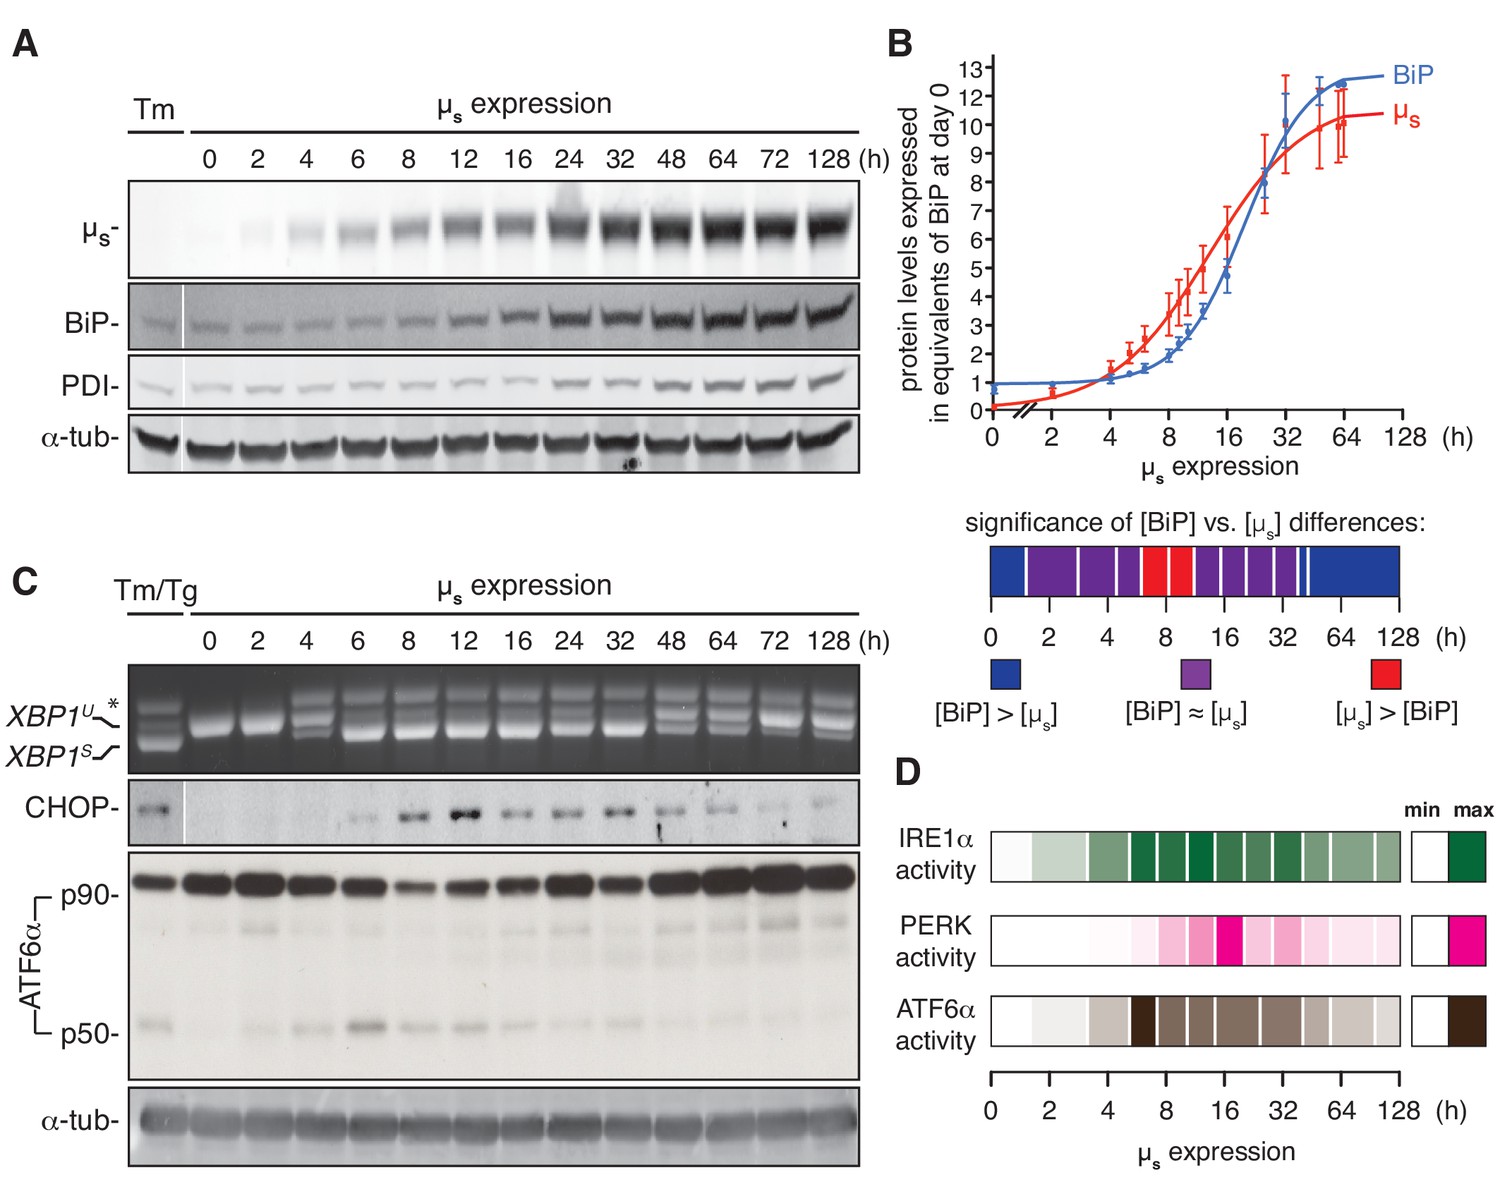
ER homeostatic readjustment entails a transition from acute to chronic UPR signaling.
(A–C) HeLa-µs cells were induced with 0.5 nM Mif for various times as indicated. Levels of µs, BiP, PDI (A) and α-tubulin (A,C), as well as activation of the UPR pathways (C), were assessed as in Figure 2A. (B) Levels of µs and BiP were quantified using known quantities of BiP and µs as standards. The X-axis displays time in hrs in a logarithmic scale to show better detail of the early phase of the time course. Experiments were normalized to the level of BiP at t = 64 hr, which was reproducibly ~10 fold that at t = 0 hr. Quantities of BiP and µs are expressed in equivalents of BiP levels at t = 0 hr; mean and s.e.m. are shown, n = 5. Fitting was performed with Prism software to obtain a sigmoidal dose-response curve. As quantities were not assessed at the same time points in each experiment, some values were inferred from fit curves to obtain the s.e.m. Statistical significance of differences in expression levels between BiP and µs were tested by two-tailed t-test, and are depicted in a color-based heat map ranging from dark blue for [BiP] > [µs] (***p≤0.001), via purple for when there is no statistical significance for differences between the levels of BiP and µs, that is [BiP] ≈ [µs], to red for [µs] > [BiP] (*p≤0.05). (D) Activation of the UPR branches in (C) and replicate experiments were quantified (n = 2–20, depending on the time point assessed): for IRE1α, the percentage of XBP1 mRNA splicing; for PERK, the levels of expression of its downstream effector CHOP; and for ATF6α, the levels of ATF6α-p50 (both the latter normalized on the levels of α-tubulin). Mean values of UPR signaling output at each time point were calculated as a percentage of the maximal level, and are depicted in a color-based heat map ranging from no color (min) to full color (max).
-
Figure 4—source data 1
Data and calculations that were used to generate the bar graphs in Figures 4B and D.
- https://doi.org/10.7554/eLife.27518.015
Figure 4—figure supplement 1
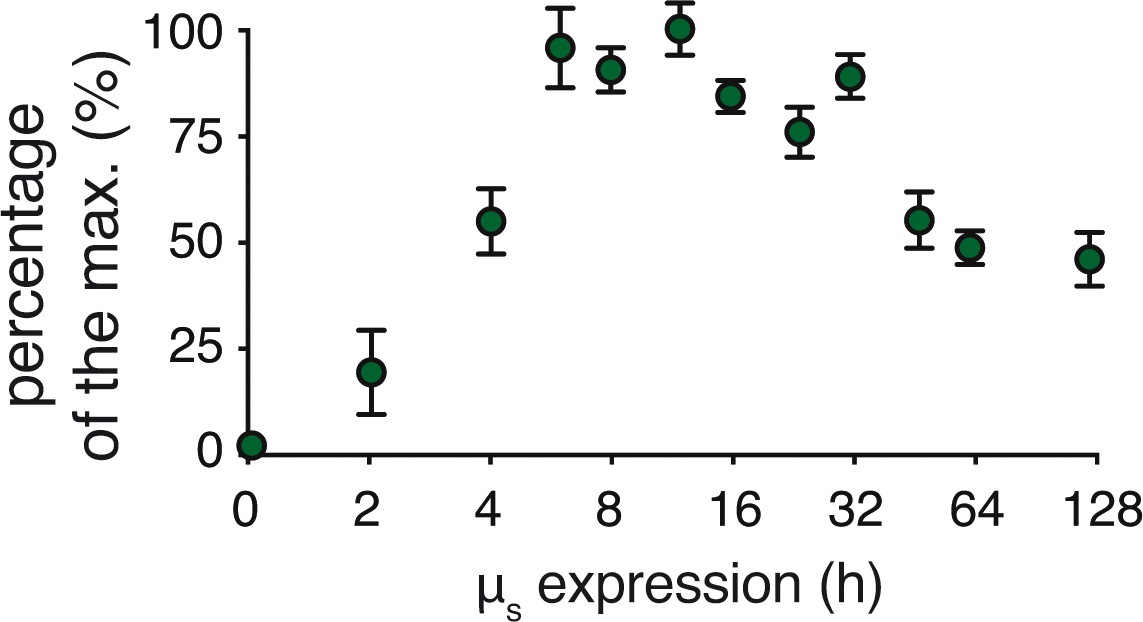
Transitioning from acute, full-geared to chronic, submaximal IRE1α signaling upon µs expression.
Percentages of XBP1 mRNA splicing in Figure 4C and replicate experiments were quantified and expressed in percentages of the maximal XBP1 mRNA splicing that was reached. Mean and s.e.m. are shown (n = 3–22 depending on the time point assessed).
Figure 4—figure supplement 2

Transitioning from acute, full-geared to chronic, submaximal PERK signaling upon µs expression.
Levels of CHOP in Figure 4C and replicate experiments were quantified, normalized to α-tubulin levels, and expressed in percentages of the maximal CHOP level that was reached. Mean and s.e.m. are shown (n = 1–10 depending on the time point assessed).
Figure 4—figure supplement 3

Transitioning from acute, full-geared to chronic, submaximal ATF6α signaling upon µs expression.
Levels of ATF6α-p50 in Figure 4C and replicate experiments were quantified, normalized to α-tubulin levels, and expressed in percentages of the maximal ATF6α-p50 level that was reached. Mean and s.e.m. are shown (n = 1–3 depending on the time point assessed).
Figure 4—figure supplement 4
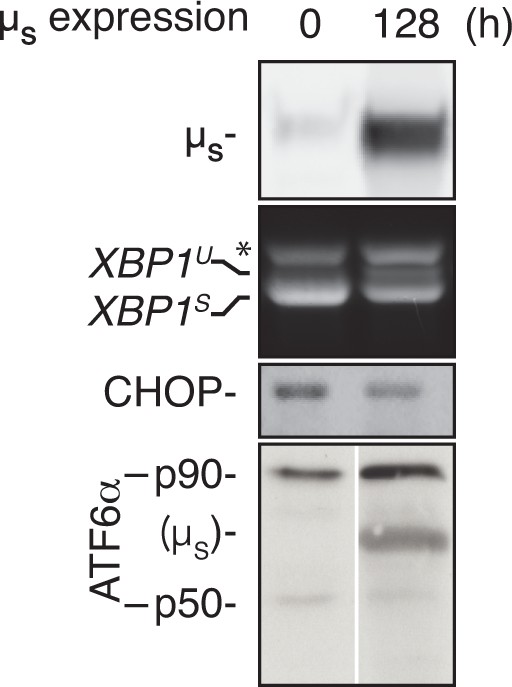
UPR pathways are not exhausted upon chronic µs overexpression.
HeLa-µs cells were induced for 128 hr to express µs or not, prior to treatment with 5 mg/ml Tm for 4 hr or 300 nM Tg for 1.5 hr (for analysis of ATF6α). Levels of µs and activation of the UPR pathways were assessed as in Figure 2A.
Figure 5 with 1 supplement
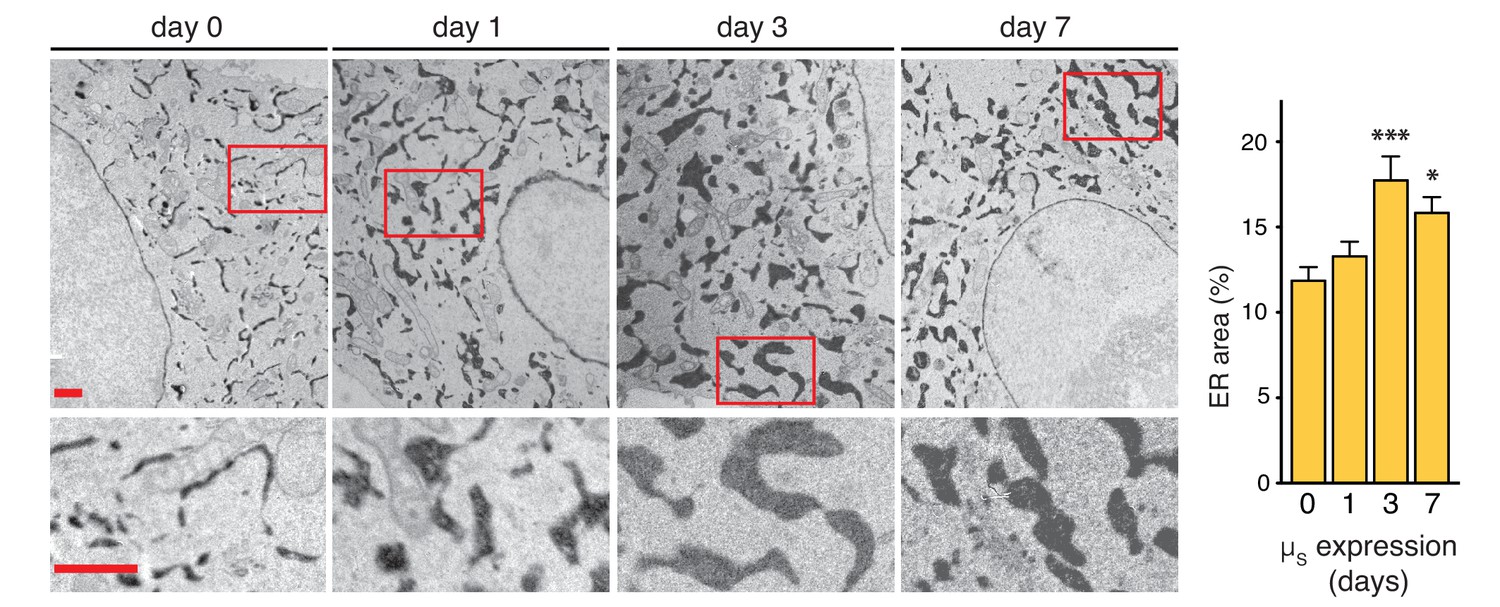
ER expansion in the course of homeostatic readjustment to µs overexpression.
HeLa-µs-derived cells, harboring Dox-inducible APEX-KDEL, were induced with 0.5 nM Mif to express µs for various days as indicated, and APEX-KDEL expression was induced with 100 nM Dox for 2 days. APEX-KDEL was exploited to obtain DAB precipitates (dark), revealing the extent of the ER in electron micrographs. Boxed areas are shown by 3-fold magnification; scale bars represent 1 µm. The percentage of the area within the cytoplasm corresponding to ER was determined and depicted in bar graphs; mean and s.e.m. are shown, n = 10. Statistical significance of differences in the extent of ER occupying cytosolic area in the electron micrographs was tested by ANOVA (*p≤0.05; ***p≤0.001).
-
Figure 5—source data 1
Data and calculations that were used to generate the bar graph.
- https://doi.org/10.7554/eLife.27518.018
Figure 5—figure supplement 1
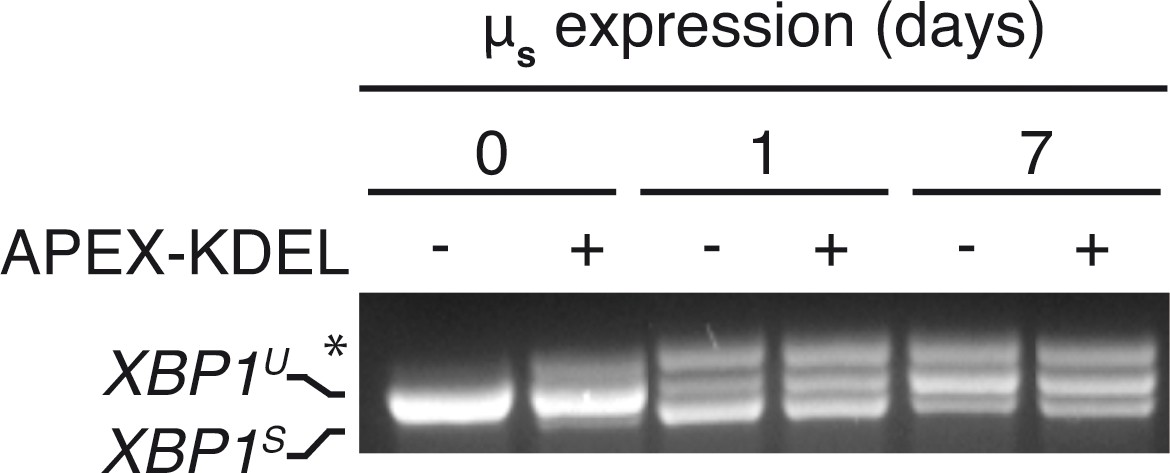
APEX-KDEL expression hardly interferes with µs-driven UPR.
HeLa-µs cells expressing APEX-KDEL induced at low levels with 100 nM Dox for 2 days (+) or not (–) were induced with 0.5 nM Mif to express µs for the indicated times (days), and XBP1 mRNA splicing was assessed as in Figure 1A.
Figure 6

BiP becomes dominant in the ER when it expands upon µs overexpression.
HeLa-µs cells were induced with Mif to express µs for various numbers of days as indicated. Proteins were identified at each time point by mass spectrometry and expression levels were approximated by label-free proteomics. The ~600 most abundant proteins, accounting for over 90% of the total protein content, were categorized according to localization in the cell—cytosolic, nuclear, mitochondrial, ER resident, or residing in other organelles—by the use of Uniprot entries. From the approximated quantities of these proteins, the quantities of proteins per organelle were calculated as a percentage of the total proteome and depicted in pie charts (upper panels). For the ER, the resident proteins (gold) and µs (red) are shown separately. Quantities of ER resident proteins including µs were calculated as a percentage of the ER proteome and are depicted in pie charts (lower panels) that are size-proportioned commensurate with the difference in combined quantity of ER and µs at different days. For details on calculations, see Supplementary file 1. Color-coding of pie charts is as annotated in the legend embedded in the figure.
-
Figure 6—source data 1
Data derived from Supplementary file 1 that were used to generate the pie diagrams.
- https://doi.org/10.7554/eLife.27518.020
Figure 7
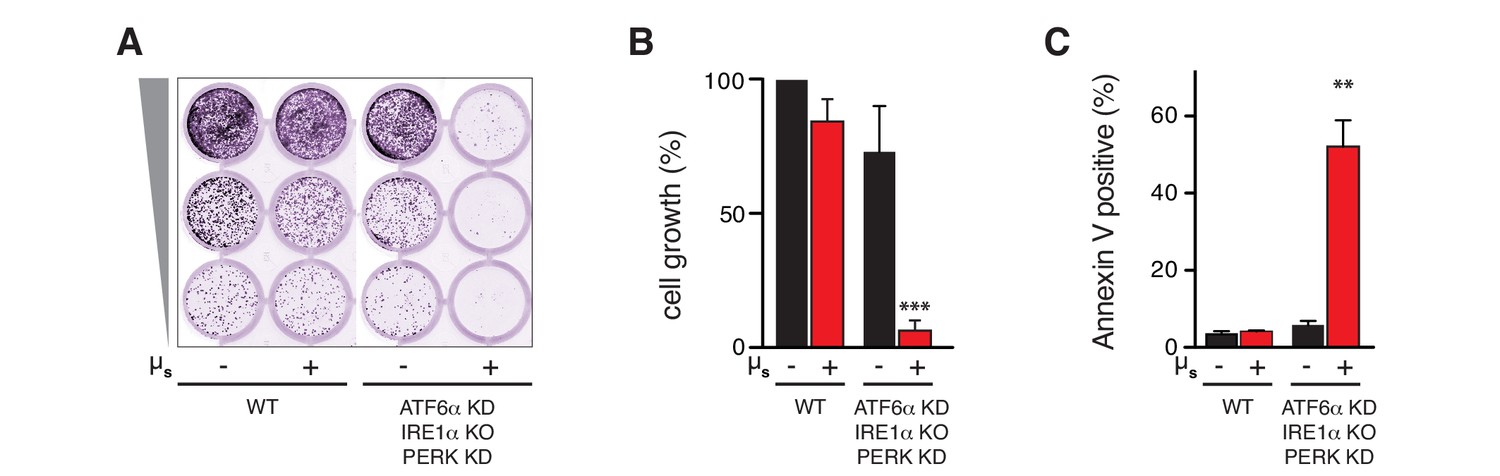
The UPR is essential to sustain ER homeostatic readjustment upon µs expression.
(A,B,C) All UPR transducers were ablated, either by deletion (KO, IRE1α) or by silencing (KD, ATF6α and PERK) in HeLa-µs cells, and µs expression was induced with 0.5 nM Mif (+) or not (–), as indicated. (A,B) Cell growth was assessed as in Figure 1B and quantitated as in Figure 1C (B). Mean and s.e.m. are shown in a bar graph; n = 2. (C) Percentages of Annexin-V-positive cells before or upon induction of µs expression for 3 days were assessed by cytometric analysis. Means and s.e.m. are shown in a bar graph, n = 2. (B,C) Statistical significance of differences in growth (B) or Annexin V staining (C) were tested by ANOVA (**p≤0.01; ***p≤0.001).
-
Figure 7—source data 1
Data and calculations that were used to generate the bar graphs in Figures 7B and C.
- https://doi.org/10.7554/eLife.27518.022
Additional files
-
Supplementary file 1
Proteomics data and calculations that were used to generate Figure 6.
- https://doi.org/10.7554/eLife.27518.023
-
Supplementary file 2
List of cell lines, antibodies, and siRNAs used in this study.
- https://doi.org/10.7554/eLife.27518.024
-
Transparent reporting form
- https://doi.org/10.7554/eLife.27518.025
Download links
A two-part list of links to download the article, or parts of the article, in various formats.
Downloads (link to download the article as PDF)
Open citations (links to open the citations from this article in various online reference manager services)
Cite this article (links to download the citations from this article in formats compatible with various reference manager tools)
Ratiometric sensing of BiP-client versus BiP levels by the unfolded protein response determines its signaling amplitude
eLife 6:e27518.
https://doi.org/10.7554/eLife.27518


