The large-scale organization of shape processing in the ventral and dorsal pathways
- Carnegie Mellon University, United States
- Center for the Neural Basis of Cognition, Carnegie Mellon University and the University of Pittsburgh, United States
- University of Western Ontario, Canada
Figures
Figure 1
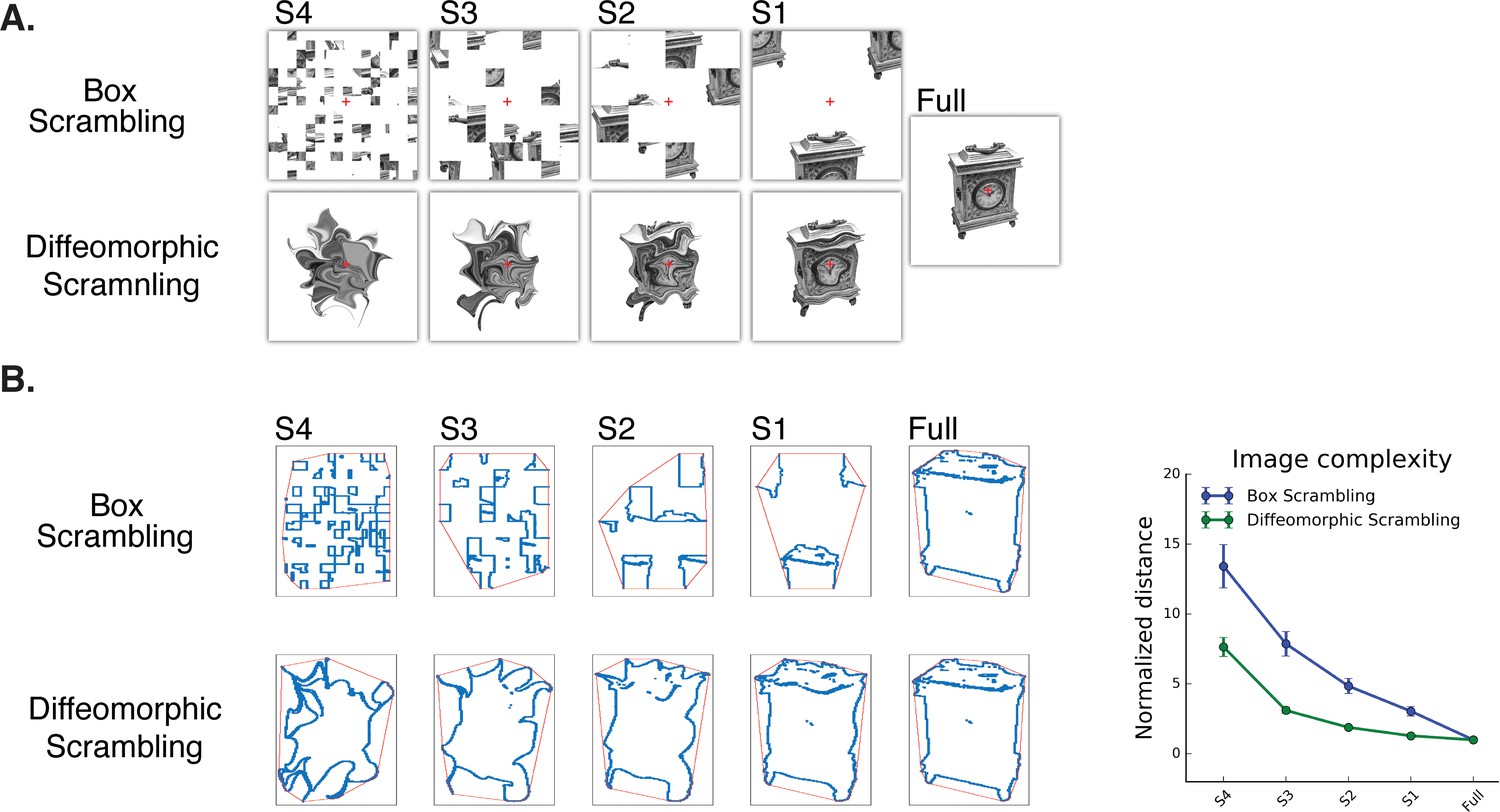
Experimental stimuli (A) and a quantitative analysis of ‘goodness of shape’ following the different scrambling procedures (B).
(A) Box scrambling experiment (upper row). Shape information was altered by dividing the display using an invisible grid and then randomly rearranging the squares. The diffeomorphic scrambling experiment (bottom row) distorted the outer contour and distinctive features of the object, while preserving the existence of a single shape but rendering it increasingly unrecognizable. This is achieved by repeatedly applying a flow field generated from a set of two-dimensional cosine components with random phase and amplitude (Stojanoski and Cusack, 2014). Both methods of scrambling preserve low-level factors of the image (e.g., average luminance, number of pixels). (B) Image analysis as a function of scrambling method and scrambling level. For each image, the minimal distance between the shape edges (blue dots) and the image’s convex hull (red frame) was computed and normalized relative to the full (intact) image. Although both manipulations resulted in reduced shape information, a greater decrease in the availability of shape information was found in the box scrambling experiment compared to the diffeomorphic scrambling experiment. Similar results were obtained when other image analysis algorithms were employed, suggesting that the amount of shape information (including texture, figure-ground segregation and defined edges) was greater for the diffeomorphic than scrambled stimuli (see methods for details).
Figure 2 with 2 supplements
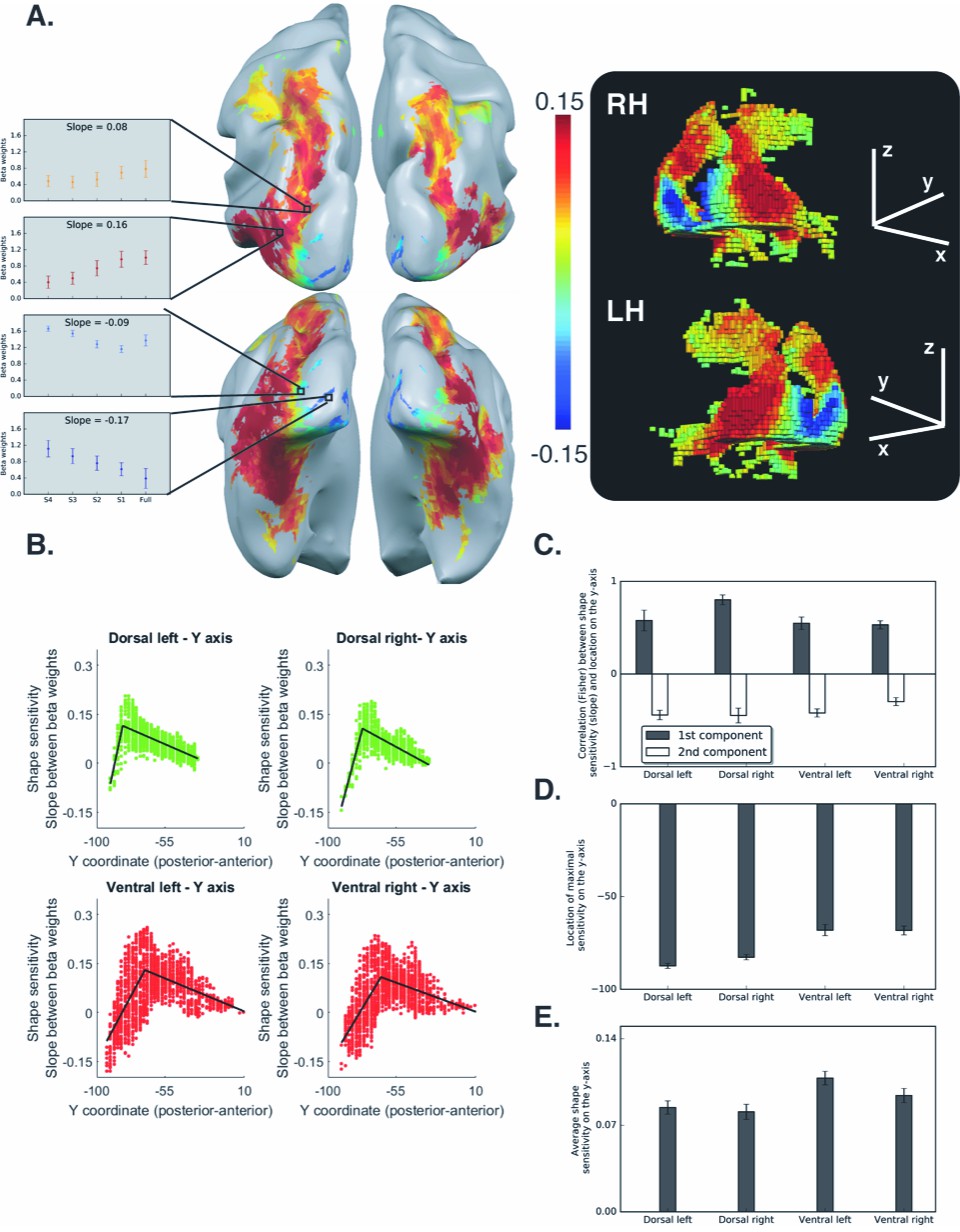
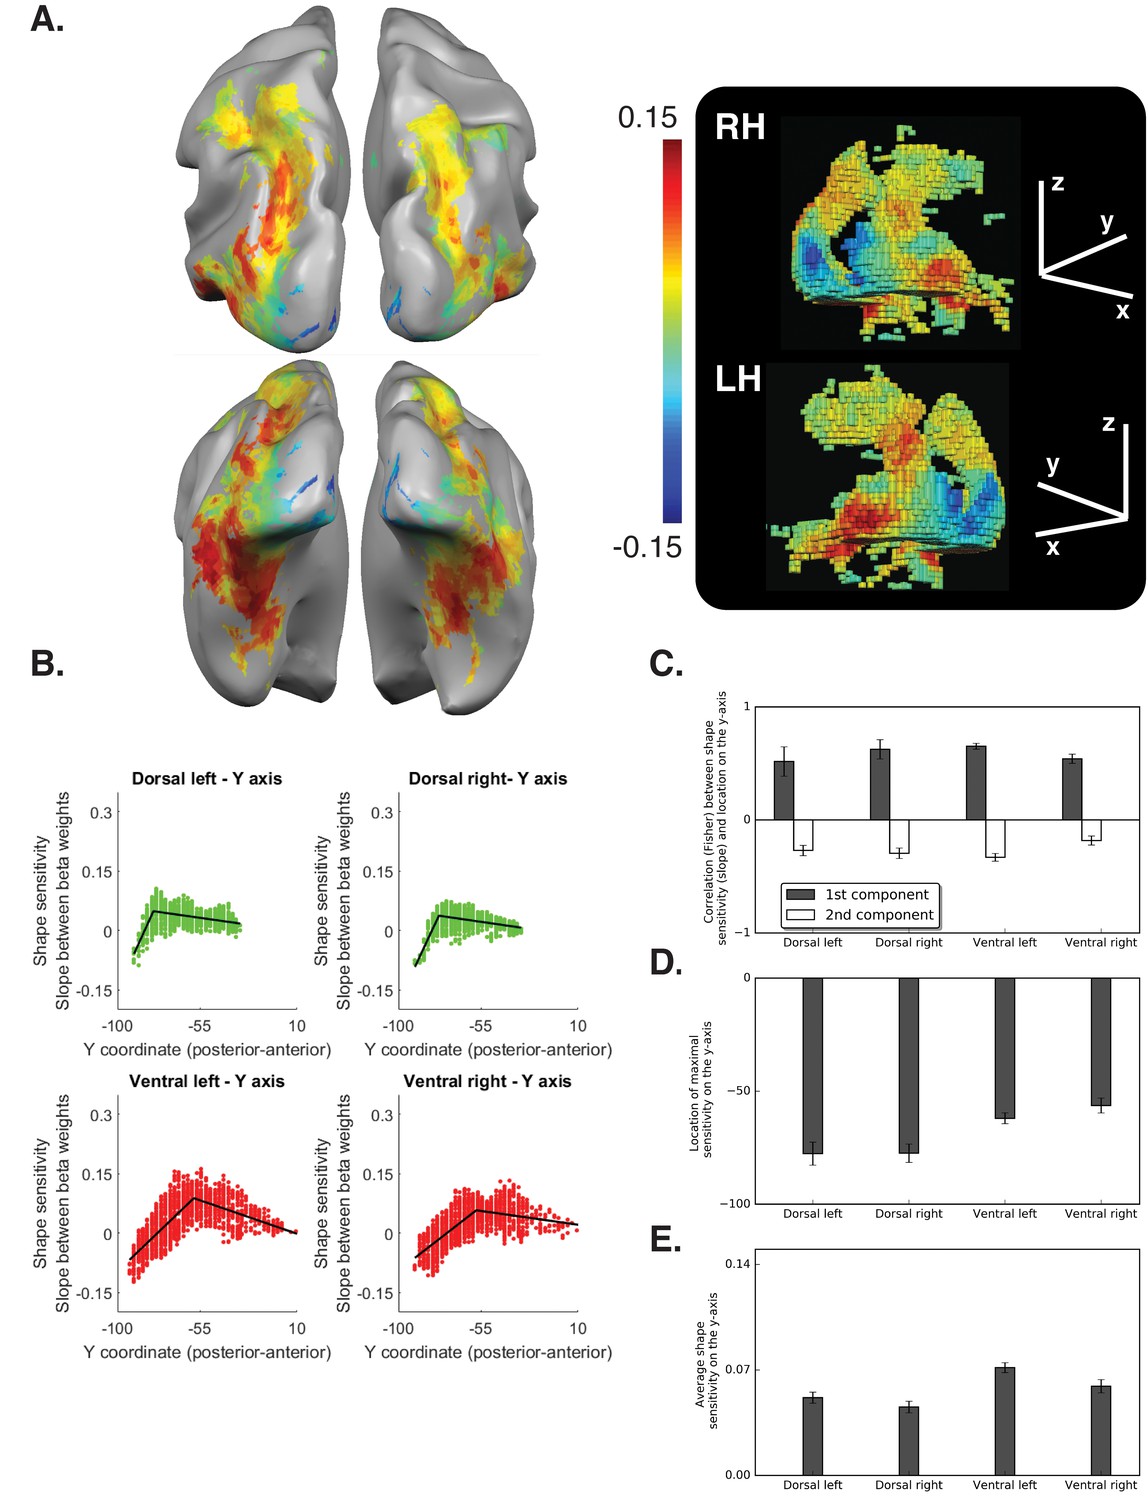
Voxel-wise analysis for the box scrambling experiment.
(A) Shape sensitivity is projected on an inflated brain from a superior view (upper panel) and from a posterior-inferior view (lower panel). Warm colors signify voxels that are shape sensitive, with activation increasing as a function of object coherence. Conversely, cold colors reflect low shape sensitivity (negative slopes) or greater sensitivity for scrambled than intact images. The activation profile of four representative clusters (10 voxels each) is plotted and the color of the bars reflects the slope value of each cluster (left panel). The right panel is a 3D reconstruction of the shape sensitivity of all visual voxels along the two pathways. (B) Group-averaged piecewise regression analysis. Each dot signifies a voxel, at a particular y-coordinate, averaged across participants, and the black line shows the result of the piecewise regression (based on two linear components) obtained for the group average. In both the dorsal and ventral pathways, the first component showed that the voxel location on the posterior-anterior axis was significantly correlated with shape sensitivity, which depicts how shape selectivity increases moving forward from the occipital pole through extrastriate and inferior temporal areas. The second component reflects a decrease in shape selectivity. (C) Correlation coefficients for each component, computed for individual participants, reveal that the large-scale organization of the two pathways was reliable across participants. (D) The point of maximal-shape sensitivity (inflection point) differed between the two pathways. This was more posterior in the dorsal versus ventral pathway. (E) The average shape sensitivity of all shape-selective voxels was greater in the ventral than dorsal pathway. Figure 2—figure supplement 1 (upper panel) shows that similar results were observed when the analysis excluded pictures of tools and was restricted to images of objects with no visuomotor association. Figure 2—figure supplement 1 (lower panel) shows that similar results were obtained when the piecewise regression was based on distance that was calculated from the combination of the Y and Z coordinates (see Figure 2C for a comparison). Figure 2—figure supplement 2 shows the ROI analysis in which slope (shape sensitivity) is plotted as function of Region of Interest defined from atlases, separately for each pathway and hemisphere. Black asterisks signify that a ROI is significantly sensitive to shape (slope >0, q < 0.05 FDR corrected). The black vertical line separates the lateral and inferior ROIs of the ventral pathway. Error bars in all graphs represent the standard errors. For all figures, see also source data files for individual data points.
-
Figure 2—source data 1
Individual data points for Figure 2C.
- https://doi.org/10.7554/eLife.27576.007
-
Figure 2—source data 2
Individual data points for Figure 2D.
- https://doi.org/10.7554/eLife.27576.008
-
Figure 2—source data 3
Individual data points for Figure 2E.
- https://doi.org/10.7554/eLife.27576.009
-
Figure 2—source data 4
Individual data points for Figure 2—figure supplement 1 (upper panel).
- https://doi.org/10.7554/eLife.27576.010
-
Figure 2—source data 5
Individual data points for Figure 2—figure supplement 1 (lower panel).
- https://doi.org/10.7554/eLife.27576.011
-
Figure 2—source data 6
Individual data points for Figure 2—figure supplement 2.
- https://doi.org/10.7554/eLife.27576.012
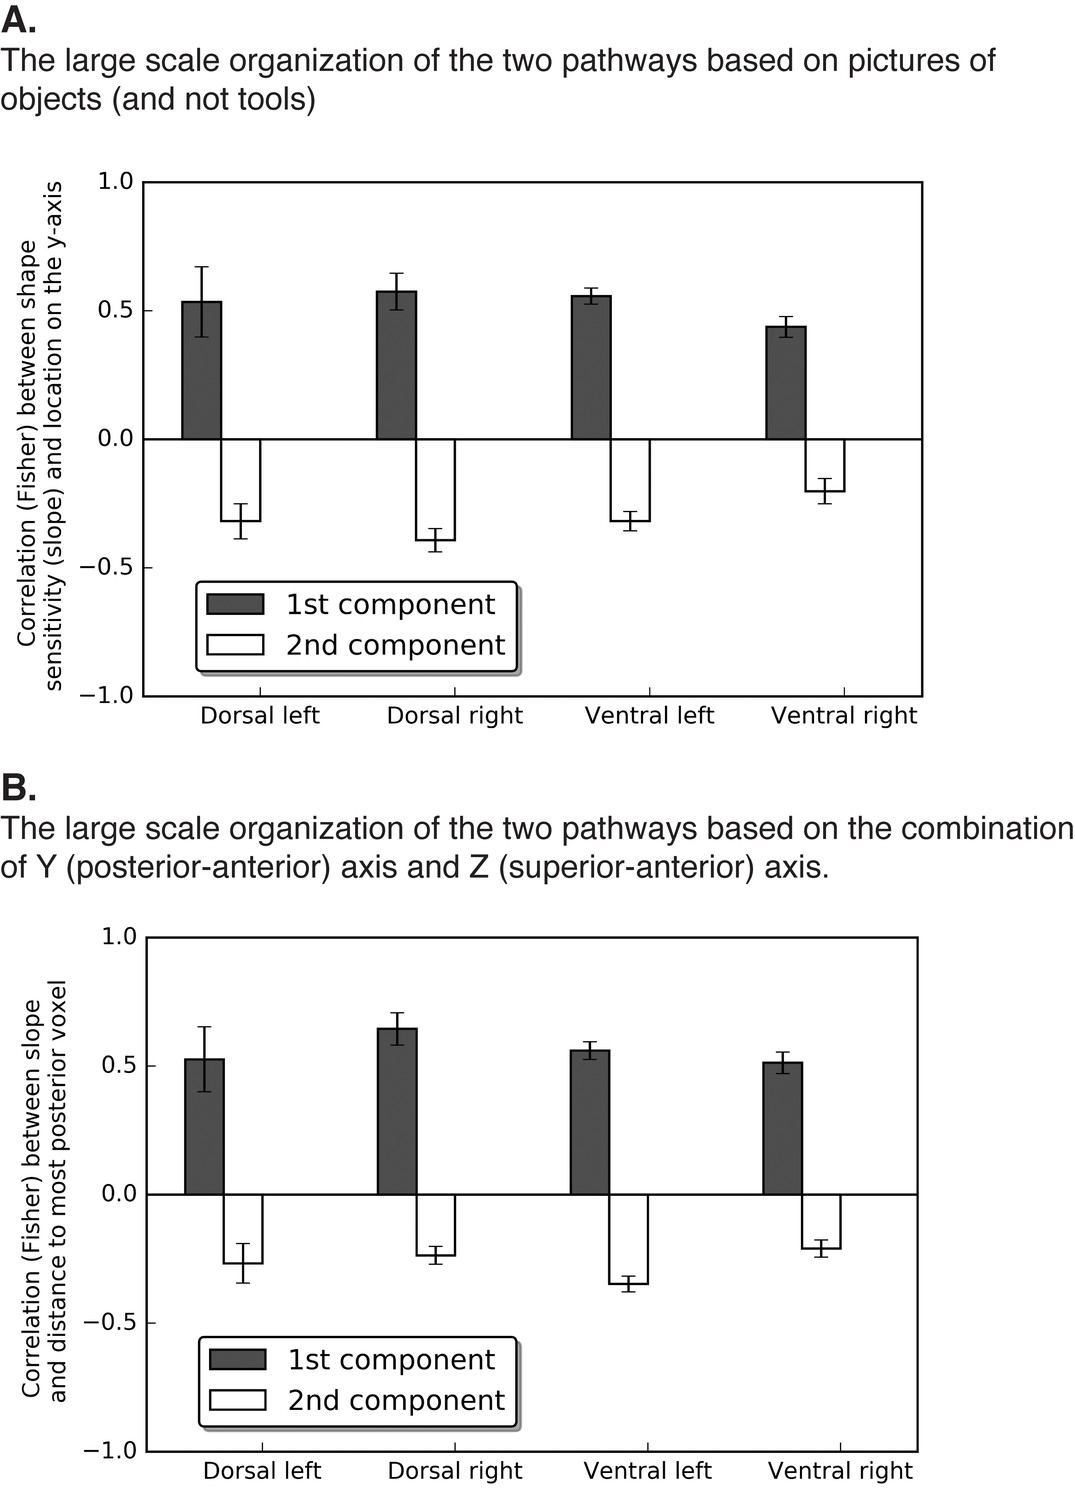
Figure 2—figure supplement 1
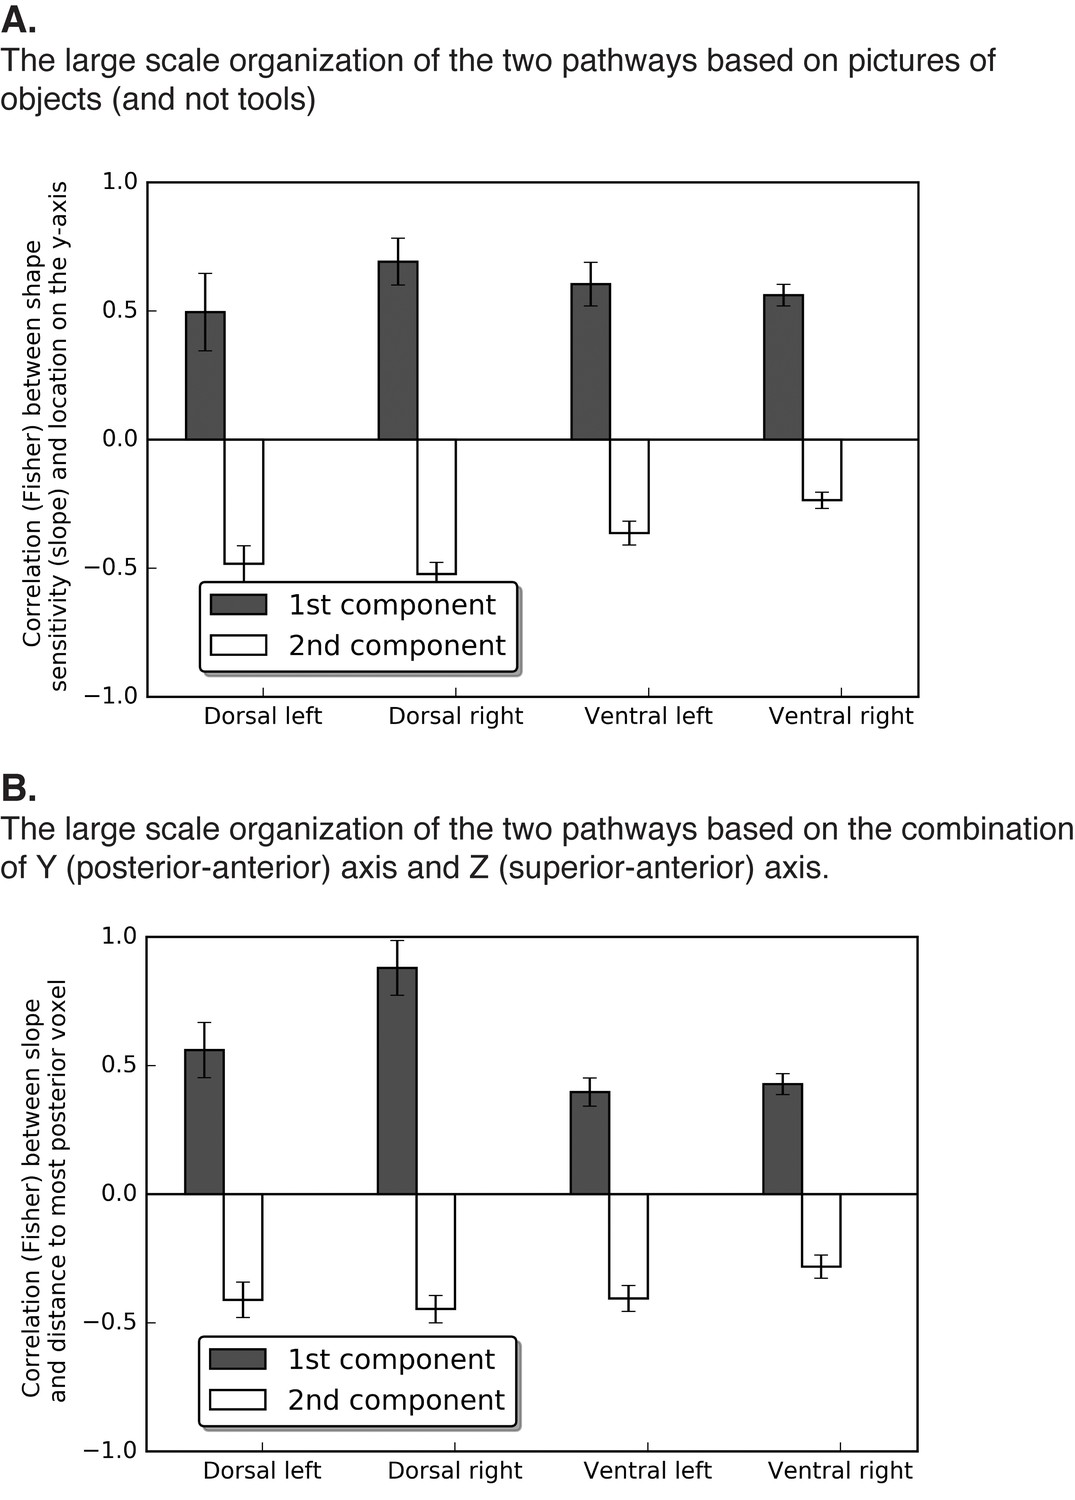
Two components analysis for the box scrambling experiment.
(A) The large scale organization of the two pathways based on pictures of objects (and not tools). (B) The large scale organization of the two pathways based on the combination of Y (posterior-anterior) axis and Z (superior-anterior) axis.
Figure 2—figure supplement 2
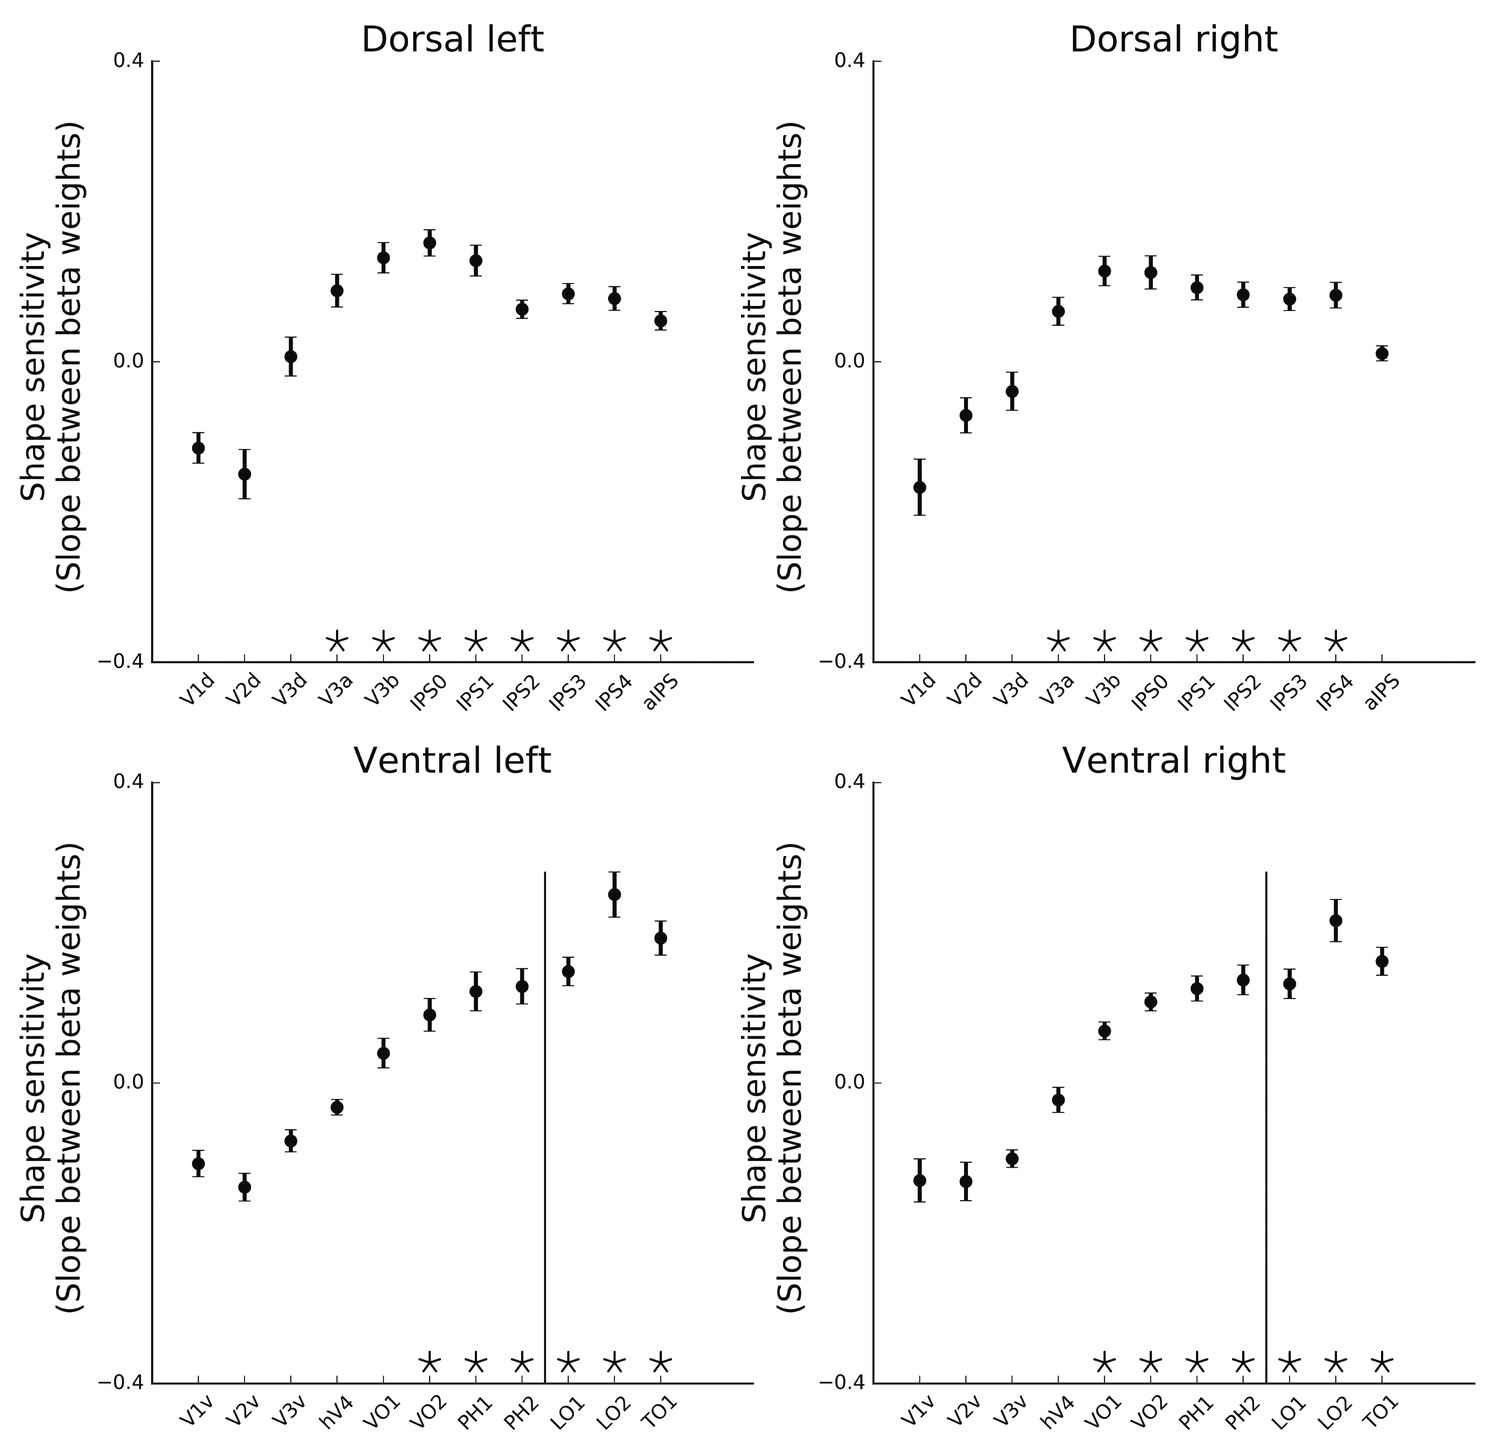
Shape sensitivity for Dorsal left and Dorsal right and Ventral left and Ventral right.
https://doi.org/10.7554/eLife.27576.006
Figure 3 with 2 supplements
Diffeomorphic scrambling experiment Voxel-wise analysis.
(A) Warm colors signify voxels that are shape sensitive, that is, voxels in which activation, as a function of object coherence, had a positive slope. Conversely, cold colors reflect low shape sensitivity (negative slopes) or greater sensitivity for scrambled than intact images. The right panel is a 3D reconstruction of all visual voxels along the two pathways. (B) Group-averaged piecewise regression analysis. Each dot signifies the mean of a single voxel, averaged across participants, and the black line shows the result of the two-components piecewise regression obtained for the group average. In agreement with the box scrambling experiment, the location of a voxel on the posterior-anterior y-axis in both the dorsal and ventral pathways was positively correlated with slope, and the second component was characterized by a robust negative correlation, suggesting that shape sensitivity decreased in more rostral parts of the two pathways. (C) Correlation coefficients for each component computed for individual participants reveal that the large-scale organization of the two pathways was reliable across participants. (D) The point of maximal-shape sensitivity (inflection point) differed between the two pathways and was more posterior in the dorsal versus ventral pathway. (E) The average shape sensitivity of all shape-selective voxels was greater in the ventral pathway compared with the dorsal pathway. Figure 3—figure supplement 1 (upper panel) shows that similar results were observed when the analysis excluded pictures of tools and was conducted only on objects with no visuomotor association. Figure 3—figure supplement 1 (lower panel) shows that similar results were obtained when the piecewise regression was based on distance that was calculated from the combination of the Y and Z coordinates. Figure 3—figure supplement 2 (lower panel) aims to compare between the ROIs analysis of the two experiments and shows the ROI analysis in which slope (shape sensitivity) is plotted as function of Region of Interest defined from atlases, separately for each pathway and hemisphere. Black and gray asterisks signify that a ROI is significantly sensitive to shape (slope >0, q < 0.05) in the box scrambling experiment and the diffeomorphic scrambling experiment, correspondingly. Gray-filled circles (q < 0.05) and gray-filled triangles (q < 0.1) signify that, in a particular ROI, shape sensitivity was greater in the box scrambling experiment compared with the diffeomorphic experiment. The black vertical line separates the lateral and inferior ROIs of the ventral pathway. Along the dorsal pathway, most ROIs were more shape sensitive in the box scrambling experiment compared with the diffeomorphic experiment. In contrast, in the ventral pathway only the lateral ROIs showed this distinction.
-
Figure 3—source data 1
Individual data points for Figure 3C.
- https://doi.org/10.7554/eLife.27576.016
-
Figure 3—source data 2
Individual data points for Figure 3D.
- https://doi.org/10.7554/eLife.27576.017
-
Figure 3—source data 3
Individual data points for Figure 3E.
- https://doi.org/10.7554/eLife.27576.018
-
Figure 3—source data 4
Individual data points for Figure 3—figure supplement 1 (upper panel).
- https://doi.org/10.7554/eLife.27576.019
-
Figure 3—source data 5
Individual data points for Figure 3—figure supplement 1 (lower panel).
- https://doi.org/10.7554/eLife.27576.020
-
Figure 3—source data 6
Individual data points Figure 3—figure supplement 2.
- https://doi.org/10.7554/eLife.27576.021
Figure 3—figure supplement 1
Two components analysis for the diffeomorphic scrambling experiment.
(A) The large-scale organization of the two pathways based on pictures of objects (and not tools). (B) The large-scale organization of the two pathways based on the combination of Y (posterior-anterior) axis and Z (superior-anterior) axis.
Figure 3—figure supplement 2

Shape sensitivity for dorsal left and dorsal right and ventral left and ventral right.
https://doi.org/10.7554/eLife.27576.015
Figure 4
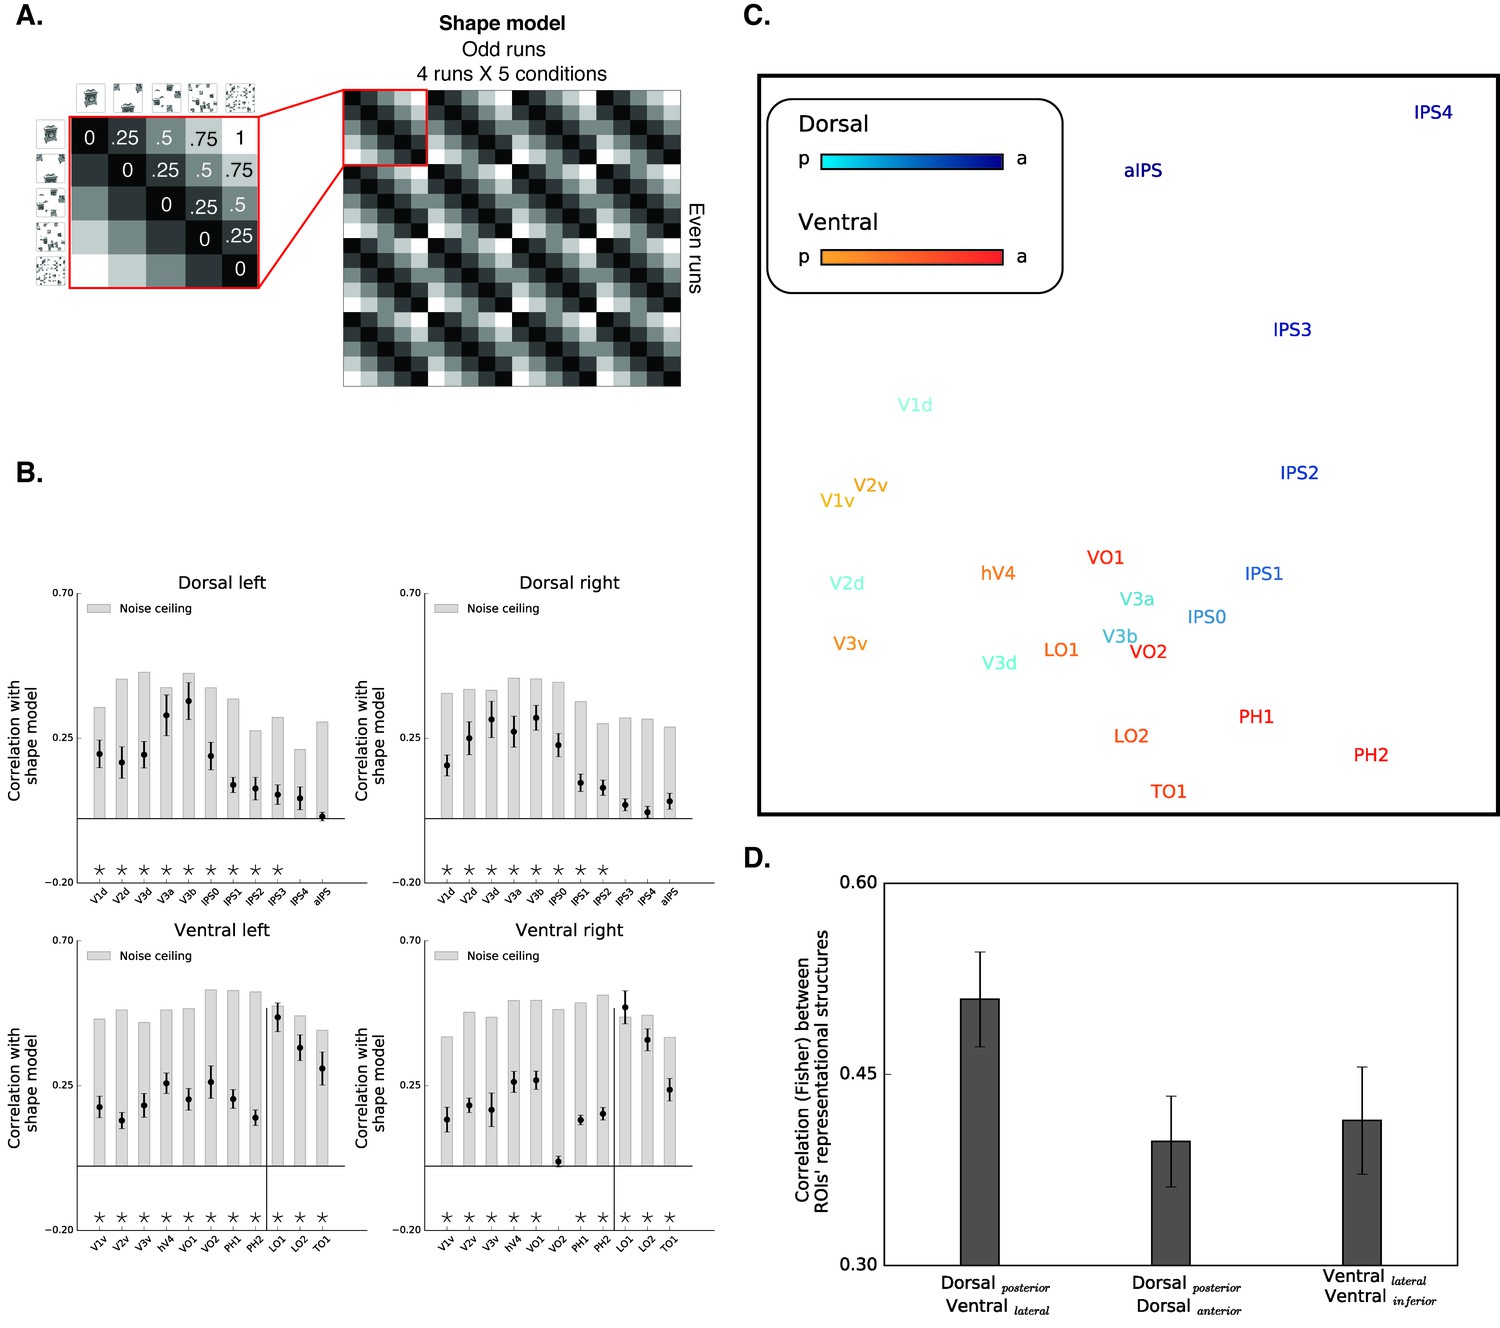
Box scrambling experiment - RSA analysis.
(A) The shape model is a dissimilarity matrix which asserts that representations of blocks of images will be more similar to each other (i.e. lower dissimilarity) if they possess similar levels of shape information. The analysis correlates the pattern of activation from the odd (columns) and even (rows) runs. For clarity, the left matrix magnifies a part of the model, and the values reflect the predicted dissimilarity values (range from 0 – maximal similarity to 1 maximal dissimilarity). (B) Correlation with the shape sensitivity model is plotted as a function of ROI, defined from atlases, separately for each pathway and hemisphere. Black asterisks along the x-axis signify that a ROI is significantly correlated with the shape model (q < 0.05). The black vertical line separates the lateral and inferior ROIs of the ventral pathway. The correlation with the shape model was evident in the early visual cortices, as well as in object selective cortices. The correlation with the shape model reached a peak in the LO (ventral) and V3b (dorsal) and then decreased gradually. For each ROI, the bright gray bars reflect the noise ceiling (the reliability of the correlational patterns in each ROI, which approximates the upper limit of the correlations between the fMRI and shape model given the inherent noise in the data (see methods)). (C) MDS plot performed on the second-order correlation across ROI’s (averaged across participant) revealed that posterior dorsal regions and lateral ventral regions had highly similar representational structure and that differentiation between the pathways emerged in more anterior parts of the two pathways. Darkness of the markers signify their location on the posterior (bright)-anterior (dark) axis. For clarity, ROIs for the left hemisphere are presented, but a highly similar MDS plot is obtained for the right hemisphere ROIs. (D) Statistical quantification of the second-order correlation reveals that correlation between posterior dorsal ROIs and lateral ventral ROIs were higher than the within-pathways correlations.
-
Figure 4—source data 1
Individual data points for Figure 4B.
- https://doi.org/10.7554/eLife.27576.023
-
Figure 4—source data 2
Individual data points for Figure 4D.
- https://doi.org/10.7554/eLife.27576.024
Figure 5 with 1 supplement
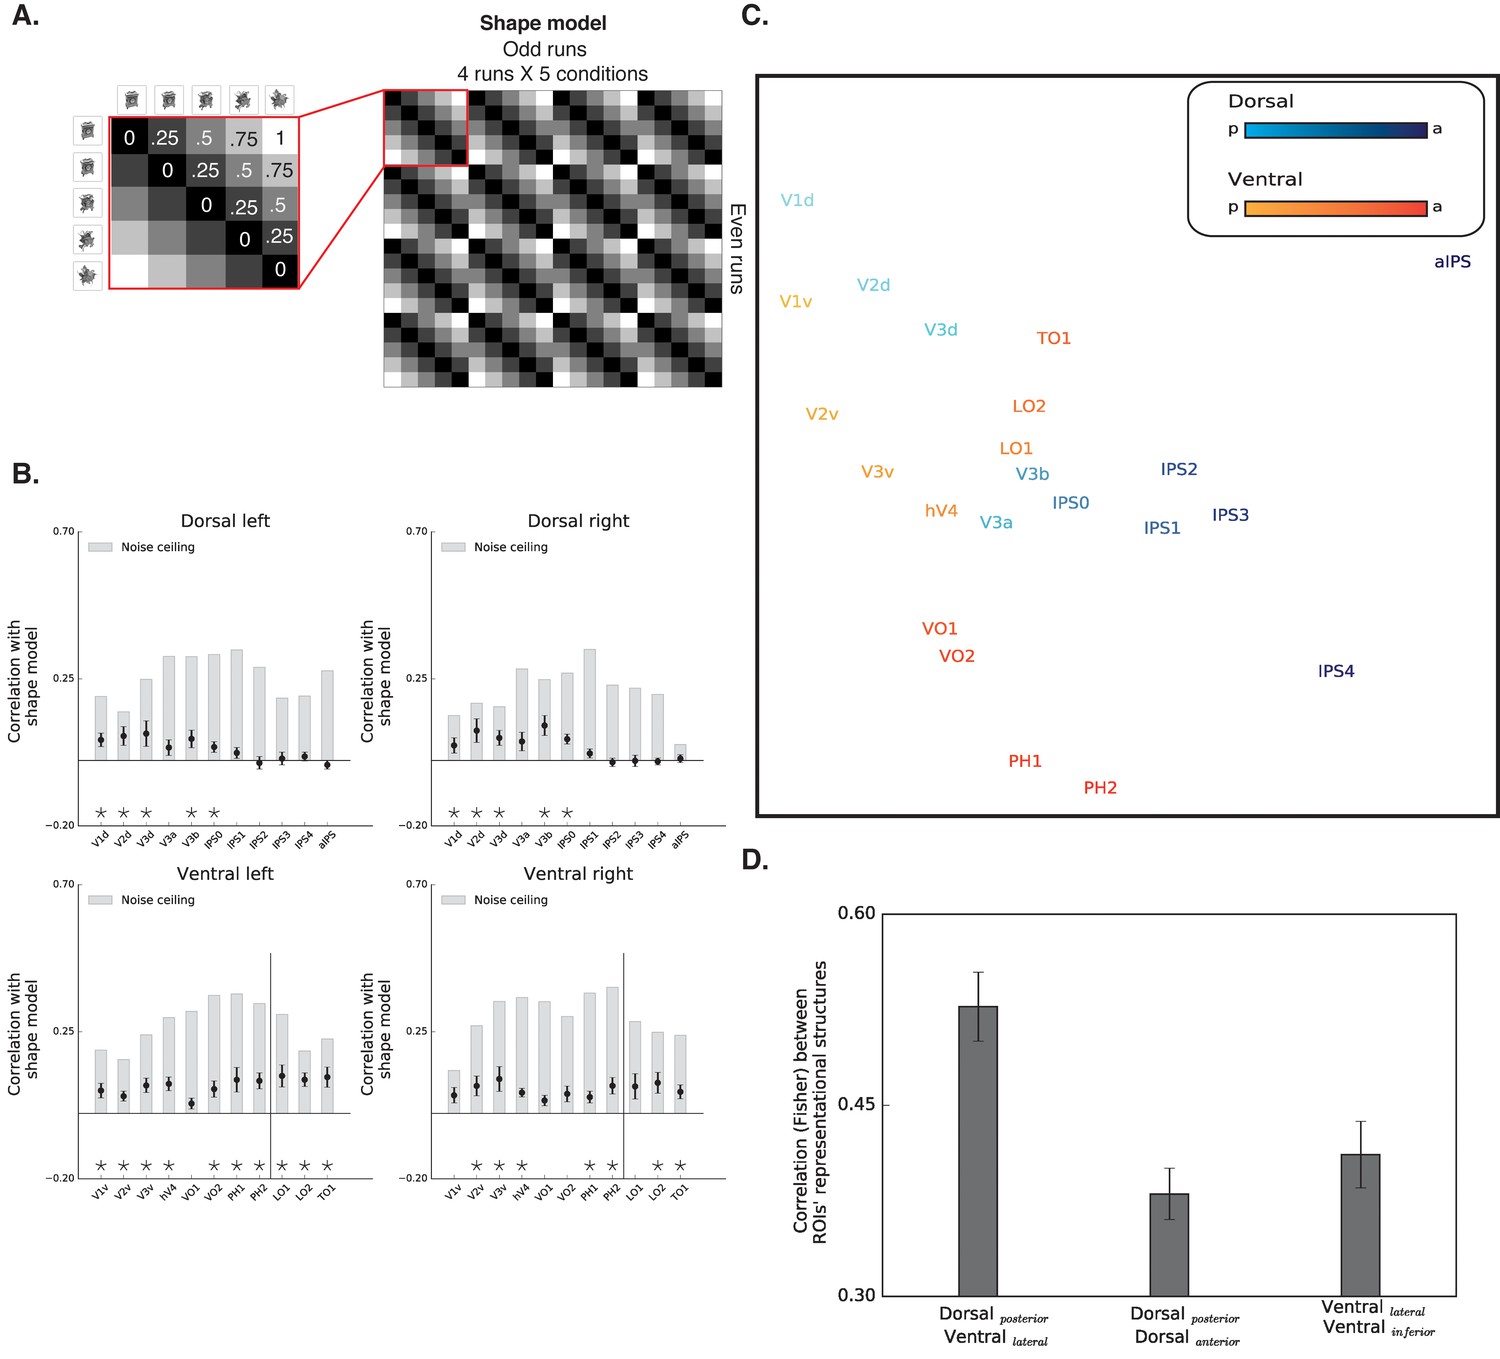
Diffeomorphic scrambling experiment - RSA analysis.
(A) The shape model is a dissimilarity matrix which proposes more similar representations (i.e. lower dissimilarity) to blocks of images containing similar levels of shape information. For more details, see Figure 4 legend. (B) Correlation with the shape sensitivity model is plotted as a function of ROI defined from atlases, separately for each pathway and hemisphere. Black asterisks signify that a ROI is significantly correlated with the shape model (q < 0.05). The black vertical line separates the lateral and inferior ROIs of the ventral pathway. Correlation with the shape model was evident in the early visual cortices, as well as in object selective cortices. Despite a reduction in the magnitude of the correlations in comparison to the box scrambling experiment, a similar pattern of sensitivity to shape information was observed. For each ROI, the bright gray bars reflect the reliability of the correlational patterns in each ROI, which approximates the upper limit of the correlations between the fMRI and shape model given the inherent noise in the data (see methods). (C) MDS plot performed on the second-order correlation across ROI’s (averaged across participant) revealed that posterior dorsal regions and lateral ventral regions had highly similar representational structure and that differentiation between pathways emerged in more anterior parts of the two pathways. Darkness of the markers signify their location on the posterior (bright)-anterior (dark) axis. For clarity ROIs for the left hemisphere are presented, but a highly similar MDS plot is obtained for the right hemisphere ROIs. (D) Statistical quantification of the second-order correlation reveals that correlation between posterior dorsal ROIs and lateral ventral ROIs were higher than the within-pathways correlations. Figure 5—figure supplement 1 shows the direct comparison between the two experiments. Black and gray asterisks signify that a ROI is significantly correlated with the shape model in the box scrambling experiment and the diffeomorphic scrambling experiment., correspondingly. Gray filled circles (q < 0.05) and gray filled triangles (q < 0.1) signify that, in a particular ROI, the correlation with the shape model was greater in the box scrambling experiment compared with the diffeomorphic scrambling experiment.
-
Figure 5—source data 1
Individual data points for Figure 5B.
- https://doi.org/10.7554/eLife.27576.027
-
Figure 5—source data 2
Individual data points for Figure 5D.
- https://doi.org/10.7554/eLife.27576.028
Figure 5—figure supplement 1
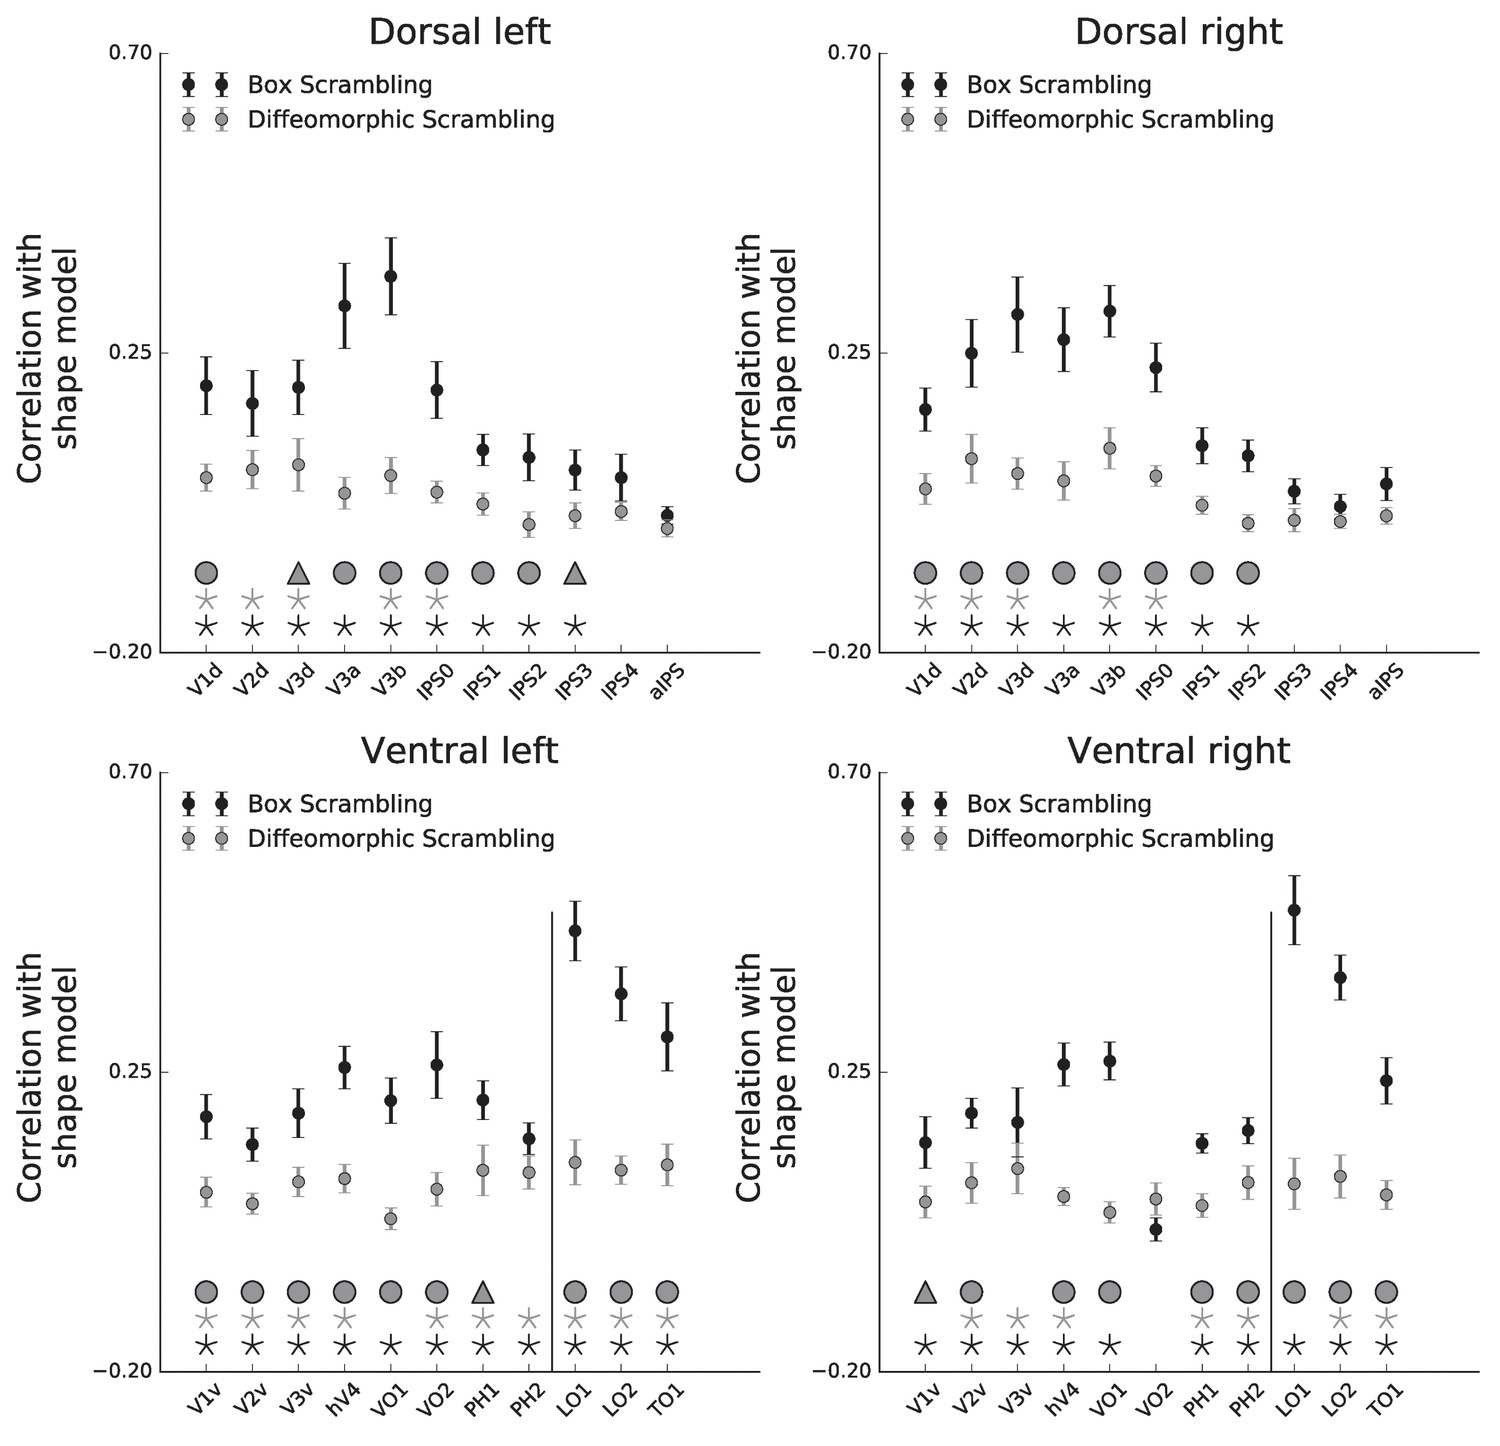
Correlation with shape model for dorsal left and dorsal right and ventral left and ventral right.
https://doi.org/10.7554/eLife.27576.026
Figure 6
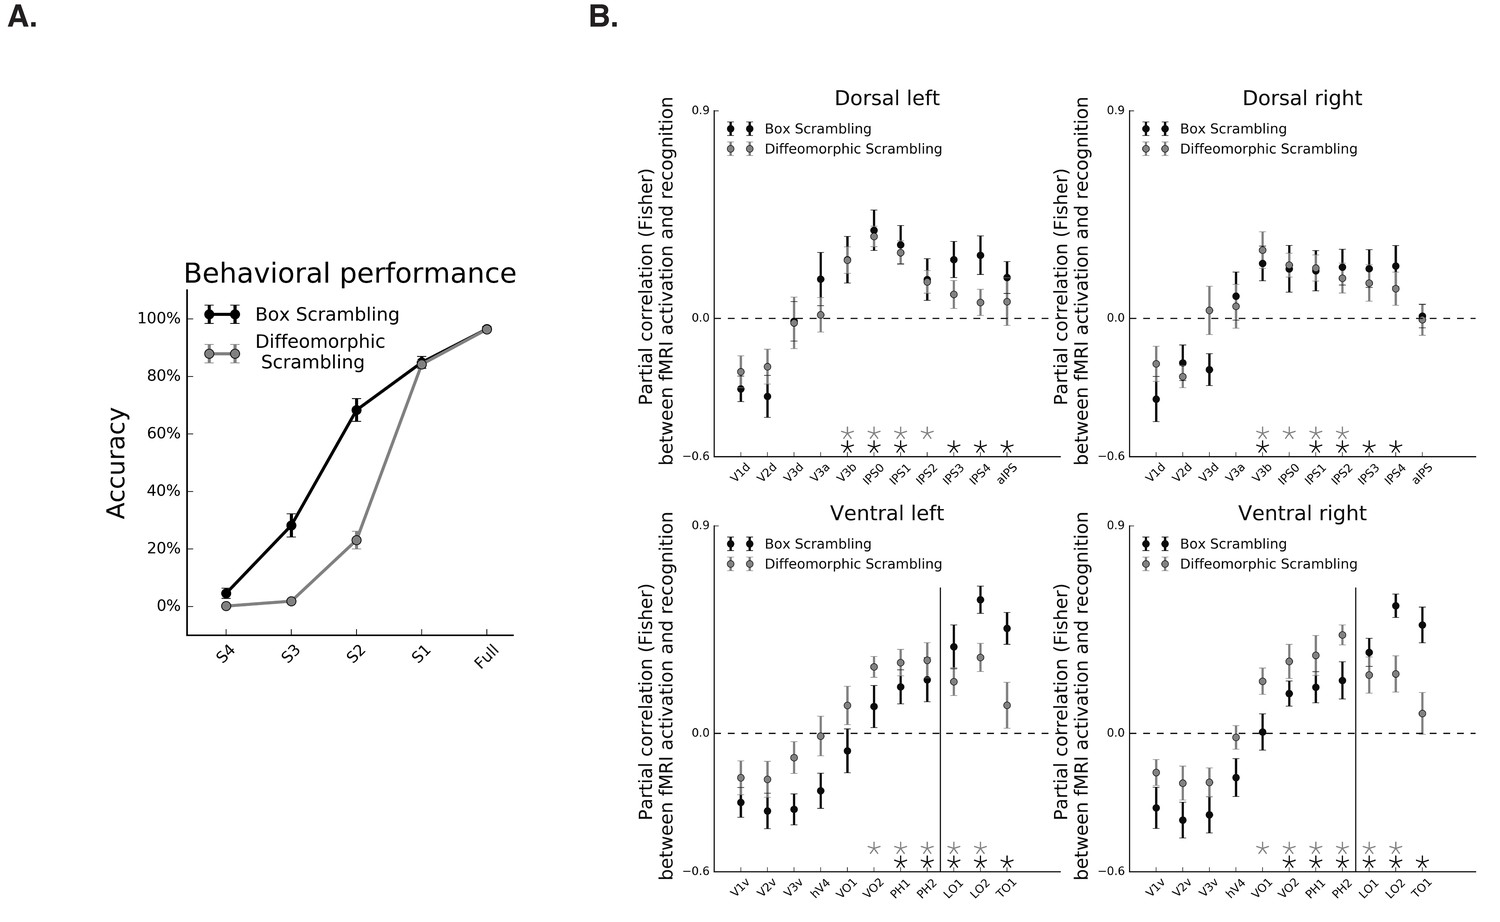
Correspondence between fMRI and object recognition performance.
(A) Mean accuracy of recognition, obtained outside the scanner in the box scrambling experiment and the diffeomorphic scrambling experiment., as a function of scrambling. Recognition ability decreased as a function of scrambling. (B) Partial correlation between fMRI activation and recognition performance along the two pathways. Black and gray asterisks signify that a ROI evinces a significantly positive correlation between these two variables (r > 0, q < 0.05) in the box scrambling experiment and diffeomorphic scrambling experiment, respectively. The black vertical line separates the lateral and inferior ROIs of the ventral pathway. In both experiments, object recognition abilities were correlated with fMRI responses across different ROIs in the mid-anterior parts of the ventral and dorsal pathways.
-
Figure 6—source data 1
Individual data points for Figure 6A.
- https://doi.org/10.7554/eLife.27576.030
-
Figure 6—source data 2
Individual data points for Figure 6B.
- https://doi.org/10.7554/eLife.27576.031
Author response image 1
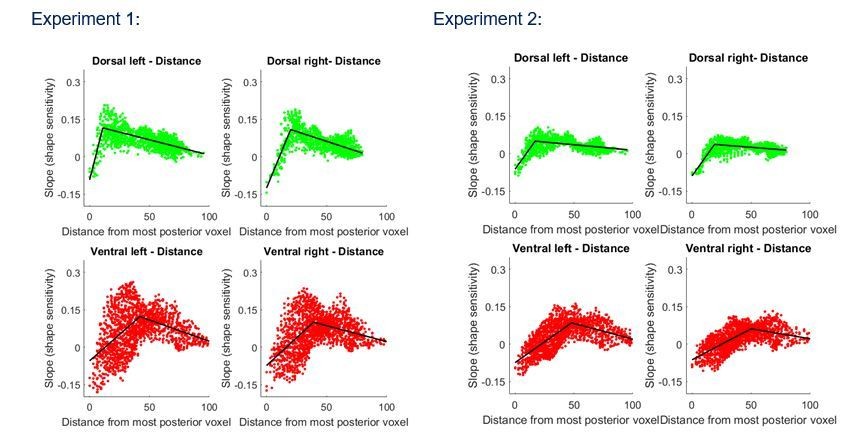
Group-averaged piecewise regression analysis for Experiment 1 and 2.
Each dot signifies a voxel, at a particular relative location based on the z and y coordinates, averaged across participants, and the black line shows the result of the piecewise regression (based on two components) obtained for the group average.
Tables
Table 1
Comparison between simple regression and piecewise (two components) regression.
https://doi.org/10.7554/eLife.27576.032| Simple correlation | Two linear components | |||||||
|---|---|---|---|---|---|---|---|---|
| Ventral r | Ventral l | Dorsal r | Dorsal l | Ventral r | Ventral l | Dorsal r | Dorsal l | |
| Box scrambling experiment | 0.04 ± 0.01 | 0.03 ± 0.01 | 0.05 ± 0.02 | 0.1±0.02 | 0.23 ± 0.03 | 0.26 ± 0.04 | 0.27 ± 0.03 | 0.22 ± 0.02 |
| Diffeomorphic scrambling experiment | 0.13 ± 0.02 | 0.11 ± 0.01 | 0.03 ± 0.01 | 0.03 ± 0.01 | 0.26 ± 0.03 | 0.33 ± 0.02 | 0.18 ± 0.03 | 0.17 ± 0.02 |
-
The mean R2 (and standard error) based on a simple correlation or the two linear components regression that was utilized for the voxel-wise analysis.
Additional files
-
Source code 1
Matlab code for the voxelwise analysis.
- https://doi.org/10.7554/eLife.27576.033
-
Transparent reporting form
- https://doi.org/10.7554/eLife.27576.034
Download links
A two-part list of links to download the article, or parts of the article, in various formats.
Downloads (link to download the article as PDF)
Open citations (links to open the citations from this article in various online reference manager services)
Cite this article (links to download the citations from this article in formats compatible with various reference manager tools)
The large-scale organization of shape processing in the ventral and dorsal pathways
eLife 6:e27576.
https://doi.org/10.7554/eLife.27576


