Dynamics and consequences of spliceosome E complex formation
- University of Wisconsin-Madison, United States
Figures
Figure 1 with 3 supplements
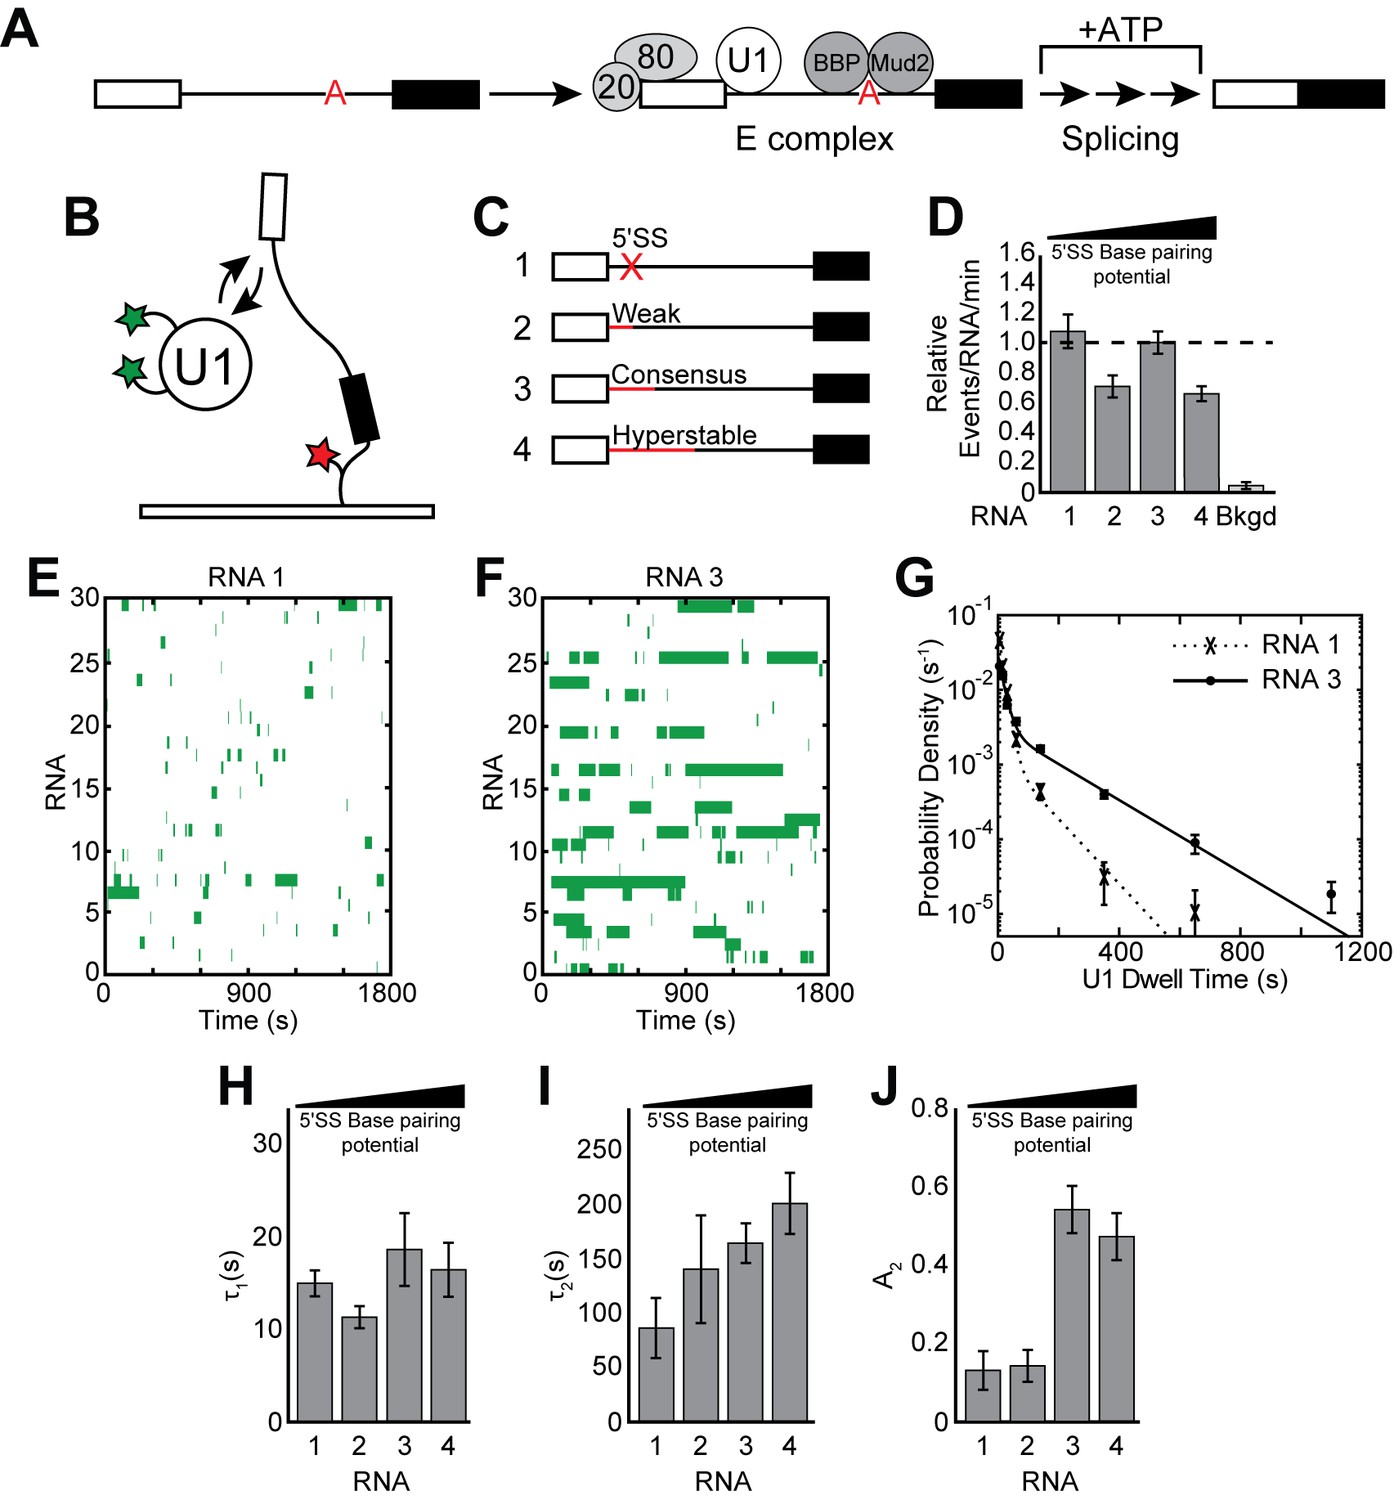
Cartoon of E complex formation and the impact of the 5' SS mutations on U1 binding kinetics.
(A) E complex assembles on pre-mRNA and contains U1 and BBP/Mud2 associated with the 5' SS and BS, respectively. In yeast, the nuclear CBC is composed of Cbp20 and Cbp80, associates with the pre-mRNA 5' cap, and is also a member of E complex. Subsequent steps then lead to splicing. (B) Cartoon of a two-color CoSMoS experiment for observing U1 binding dynamics. The U1 snRNP contained two green-excited fluorophores attached to two different proteins while the RNA was immobilized to the slide surface and contained a single Cy5 fluorophore. (C) Graphic representation of capped RNAs with variable 5' SS used in these experiments and their corresponding label number. RNA sequences are given in Supplementary file 1. (D) Bar graph comparing the relative number of U1 binding events observed on each RNA depicted in panel (C). (E) Rastergram depicting U1 binding events on RNAs lacking a functional 5' SS (RNA 1). The rastergram represents a stack of 30 time ribbons from individual RNA molecules in which U1 binding events are shown as green bands. (F) Rastergram depicting U1 binding events on RNAs containing a functional, consensus 5' SS (RNA 3). (G) Probability density histogram of dwell times for U1 on RNAs lacking (RNA 1) and containing (RNA 3) a functional 5' SS. Lines represent fits of the distributions of dwell times to equations containing two exponential terms. (H–J) Bar graph comparison of the fit parameters (τ1, panel H; τ2, panel I; the τ2 amplitude A2, panel J) obtained from analysis of the dwell time distributions of U1 binding events on RNAs 1–4. Details of the fit parameters for data shown in (G–J) can be found in Supplementary file 2. Error bars in (D, G) represent the error in counting statistics as given by the variance of a binomial distribution. Bars in (H–J) represent the fit parameters ± S.D.
Figure 1—figure supplement 1
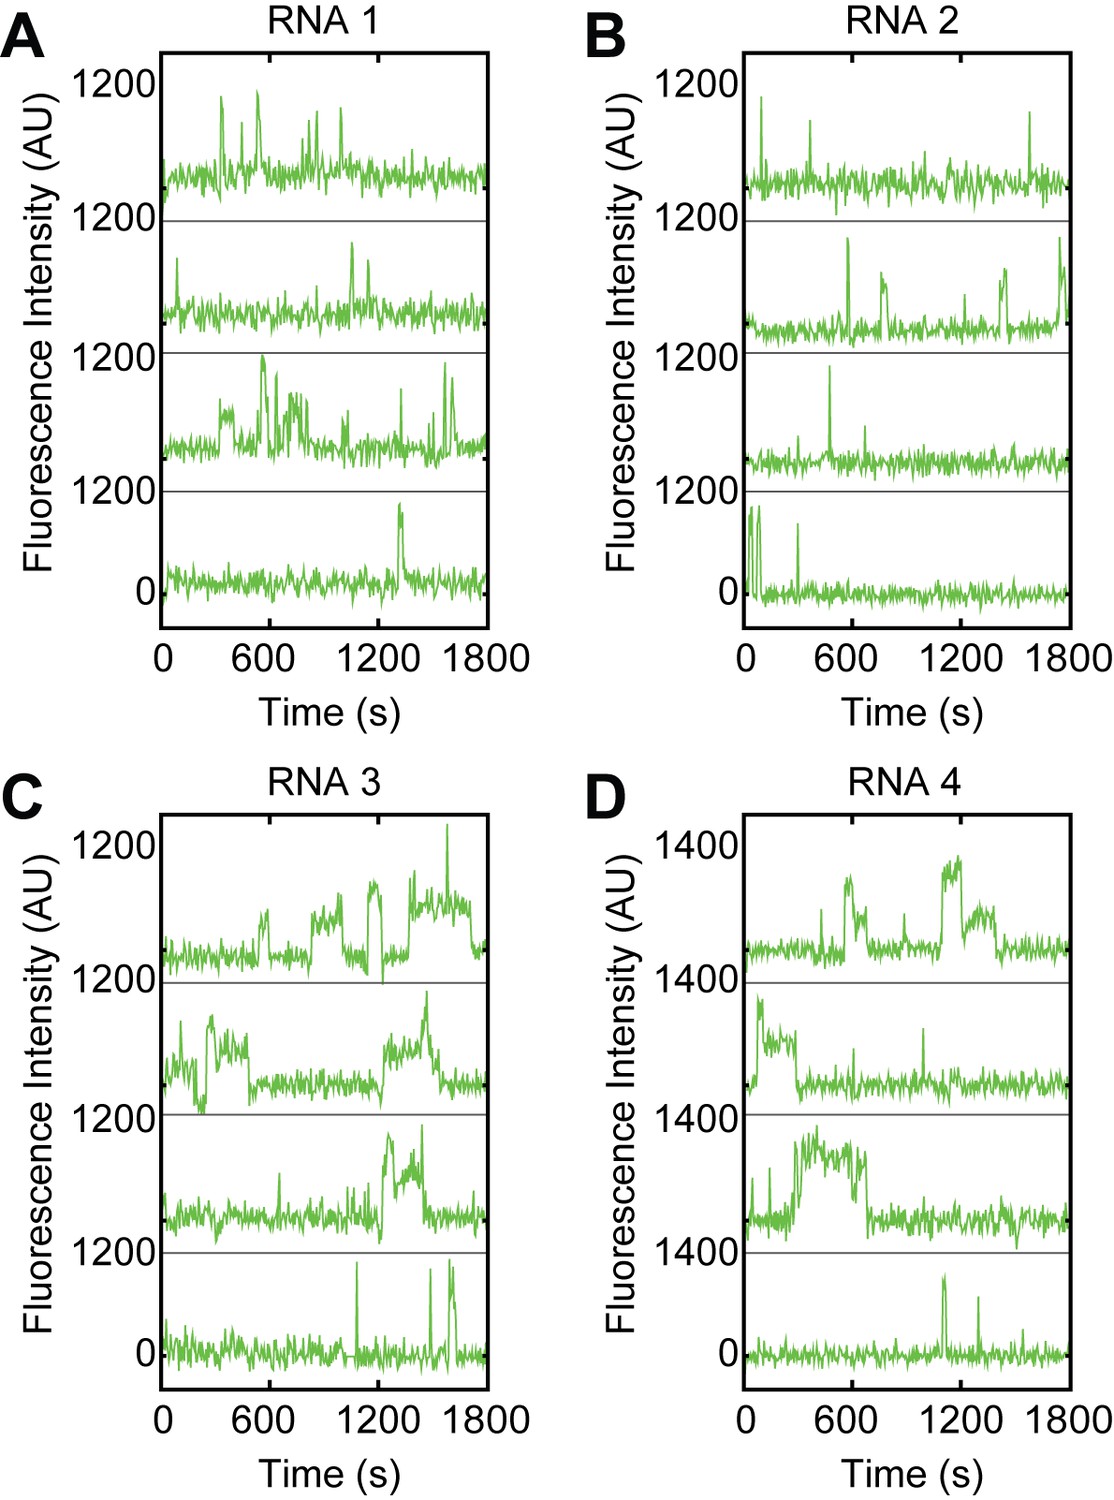
Examples of fluorescence intensity traces supplementing data shown in Figure 1C–J showing individual U1-SNAPf subcomplexes co-localizing with the indicated surface-tethered RNAs containing variable 5' SS sequences.
(RNAs 1–4, Figure 1B).
Figure 1—figure supplement 2
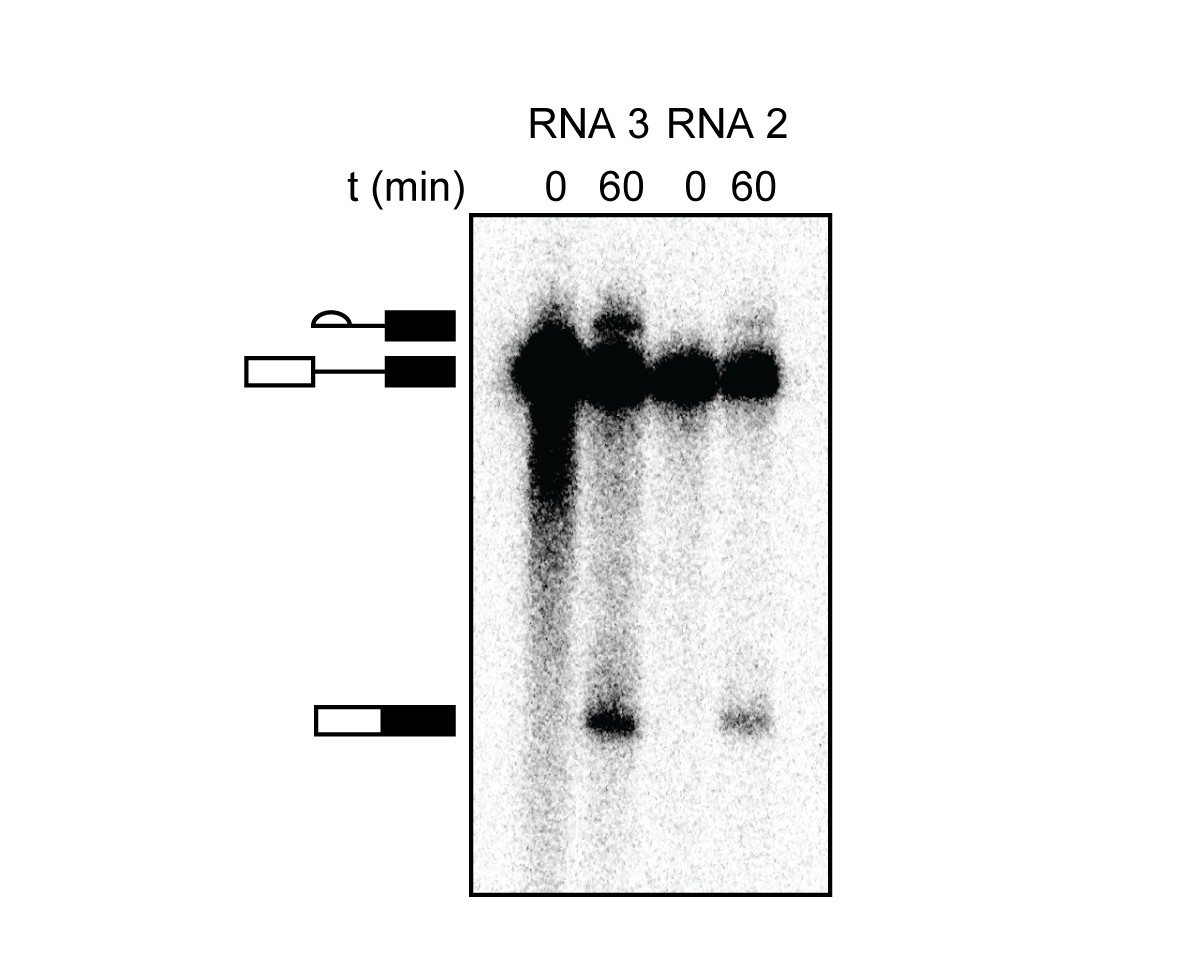
RNAs containing a weak 5' SS splice in vitro.
These results were generated by phosphorimaging of the [32P]-labeled RNAs generated from in vitro splicing assays and compare lariat-3' exon and mRNA production from WT RP51A (RNA 3) and a mutant containing a weak but functional 5' SS (RNA 2). The weak 5' SS produces mRNA, indicating that functional engagement of U1 with the pre-mRNA has occurred. Splicing efficiencies are as follows: 1st step (5' SS cleavage) RNA 2 = 8% and RNA 3 = 25%; second step (exon ligation) RNA 2 = 4% and RNA 3 = 16%.
Figure 1—figure supplement 3
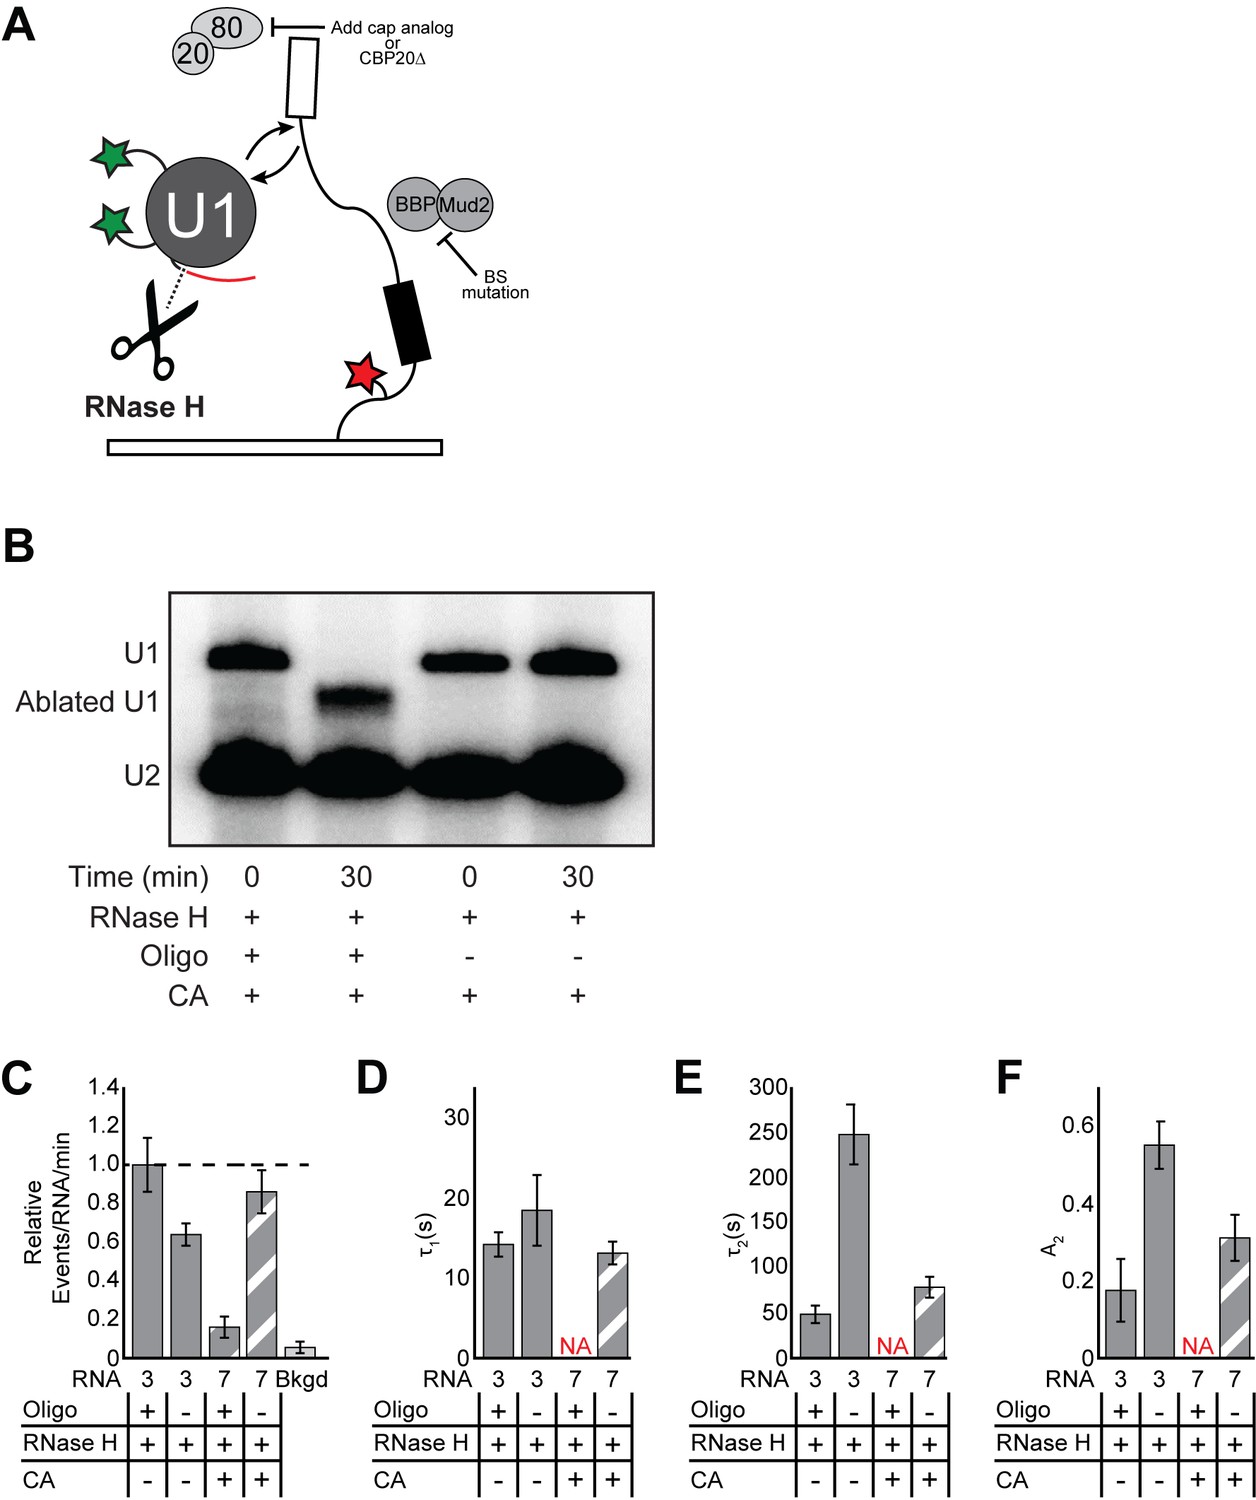
Single molecule analysis of U1 binding after ablation of the 5' end of the snRNA.
(A) Cartoon of a two-color CoSMoS experiment for observing U1 binding dynamics. U1 was labeled with two green-excited fluorophores while the RNA was immobilized to the slide surface and contained a single, red-excited Cy5 fluorophore. (B) Confirmation of U1 ablation by primer extension. Primer extension of the U2 snRNA is included as a loading control. Quantification of the band intensities indicate that ≥96% of the U1 snRNA was cleaved by RNase H. (C) Bar graph comparing the relative number of U1 binding events observed on RNAs 3 or 7, in the presence or absence of CA and/or the RNase H ablation oligo. (D–F) Bar graph comparison of the fit parameters (τ1, panel D; τ2, panel E; the τ2 amplitude A2, panel F) obtained from analysis of the dwell time distributions of U1 binding events. Details of the fit parameters for data shown in (D–F) can be found in Supplementary file 2. Error bars in (C) represent the error in counting statistics as given by the variance of a binomial distribution. Bars in (D–F) represent the fit parameters ± S.D.
Figure 2 with 3 supplements
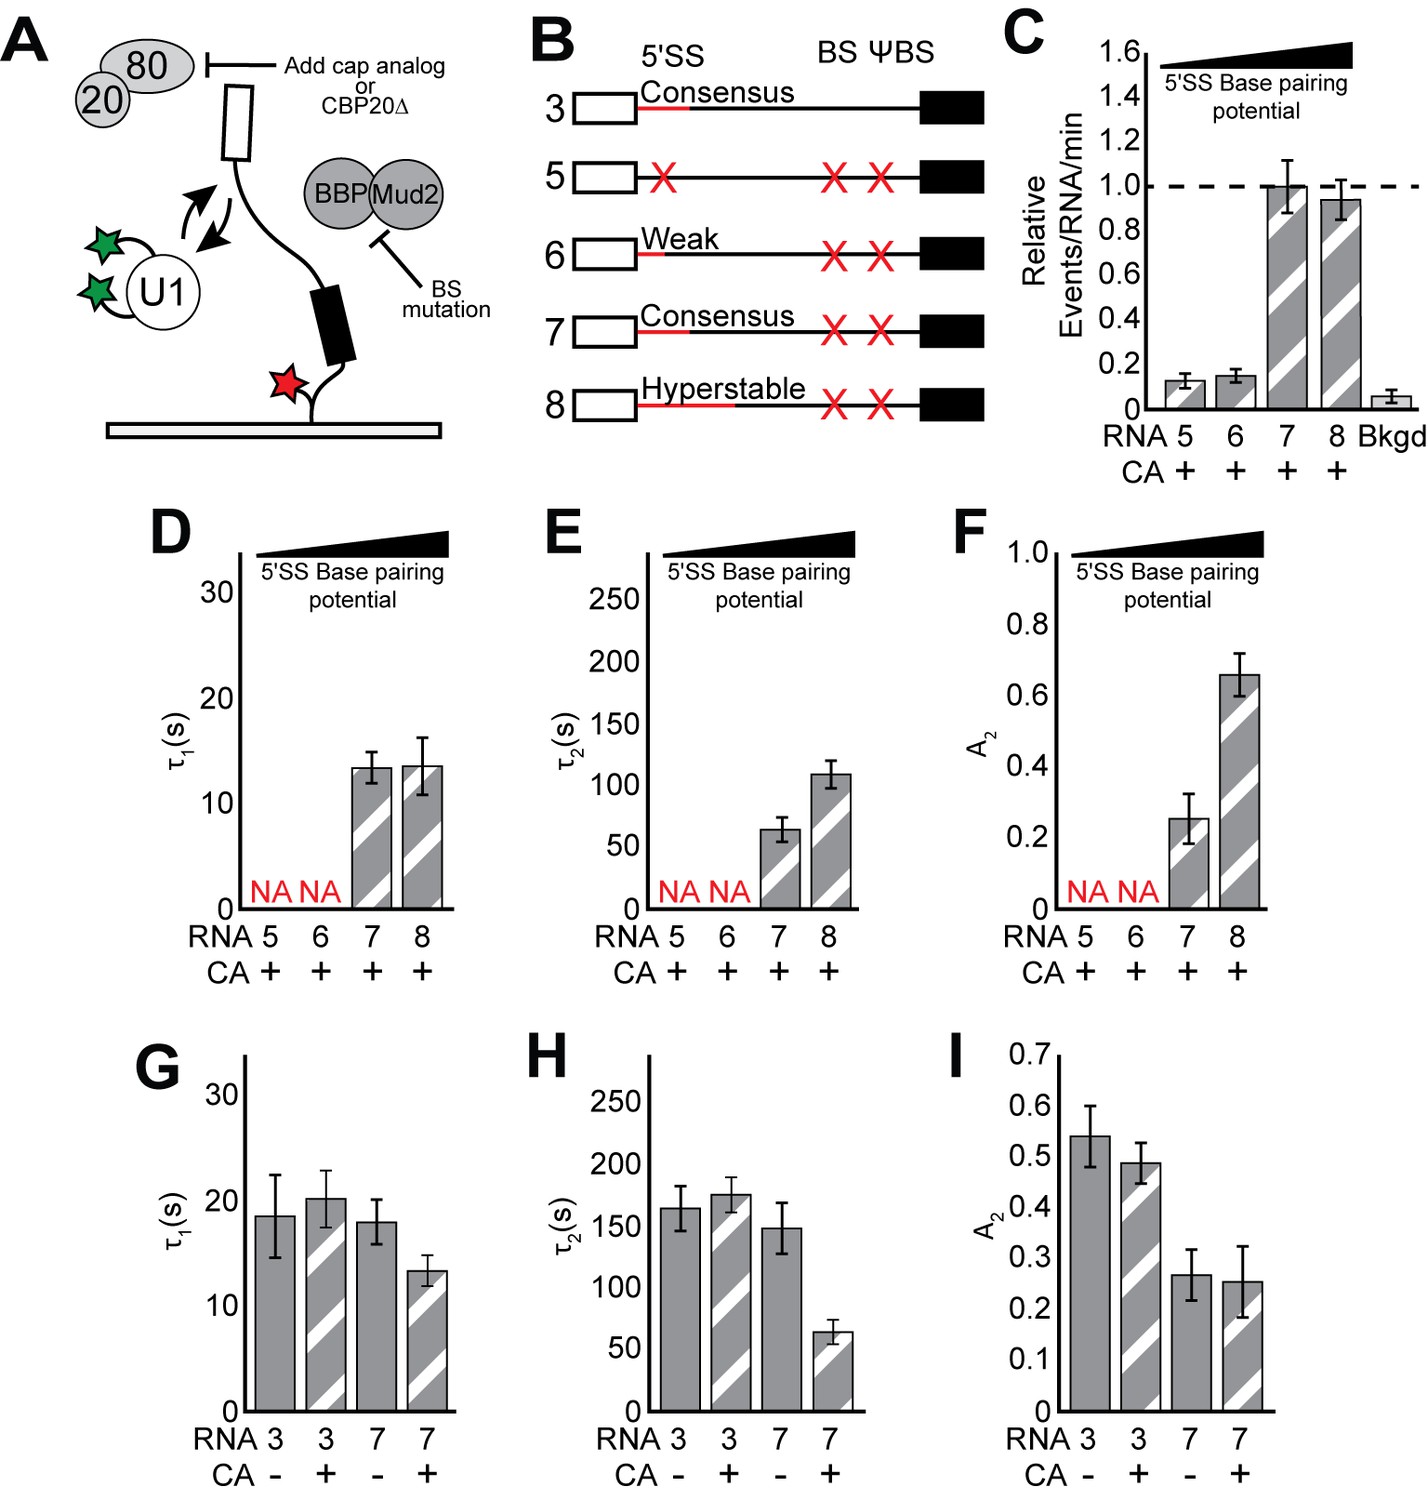
CoSMoS experiments monitoring U1 binding without the influence of ECPs.
(A) Cartoon of a two-color CoSMoS experiment for observing U1 binding dynamics while mitigating the influence of ECPs. Addition of cap analog (CA) or genetic deletion of Cbp20 prevents the CBC from interacting with the immobilized RNAs, and deletion of the BS and ΨBS prevent stable binding of BBP/Mud2. (B) Graphic representation of capped RNAs with variable 5' SS and BS and their corresponding label number. RNA sequences are given in Supplementary file 1. (C) Bar graph comparing the relative number of U1 binding events observed on RNAs 5–8 depicted in panel (B) and in the presence of CA. (D–F) Bar graph comparison of the fit parameters (τ1, panel D; τ2, panel E; the τ2 amplitude A2, panel F) obtained from analysis of the dwell time distributions of U1 binding events on RNAs 5–8 in the presence of CA. (G–I) Bar graph comparison of the fit parameters (τ1, panel G; τ2, panel H; the τ2 amplitude A2, panel I) obtained from analysis of the dwell time distributions of U1 binding events on RNAs 3 or 7 in the presence or absence of CA. Details of the fit parameters for data shown in (C–I) can be found in Supplementary file 2. Error bars in (C) represent the error in counting statistics as given by the variance of a binomial distribution. Bars in (D–I) represent the fit parameters ± S.D. Striped bars in (C–I) indicate the addition of CA in those experiments.
Figure 2—figure supplement 1
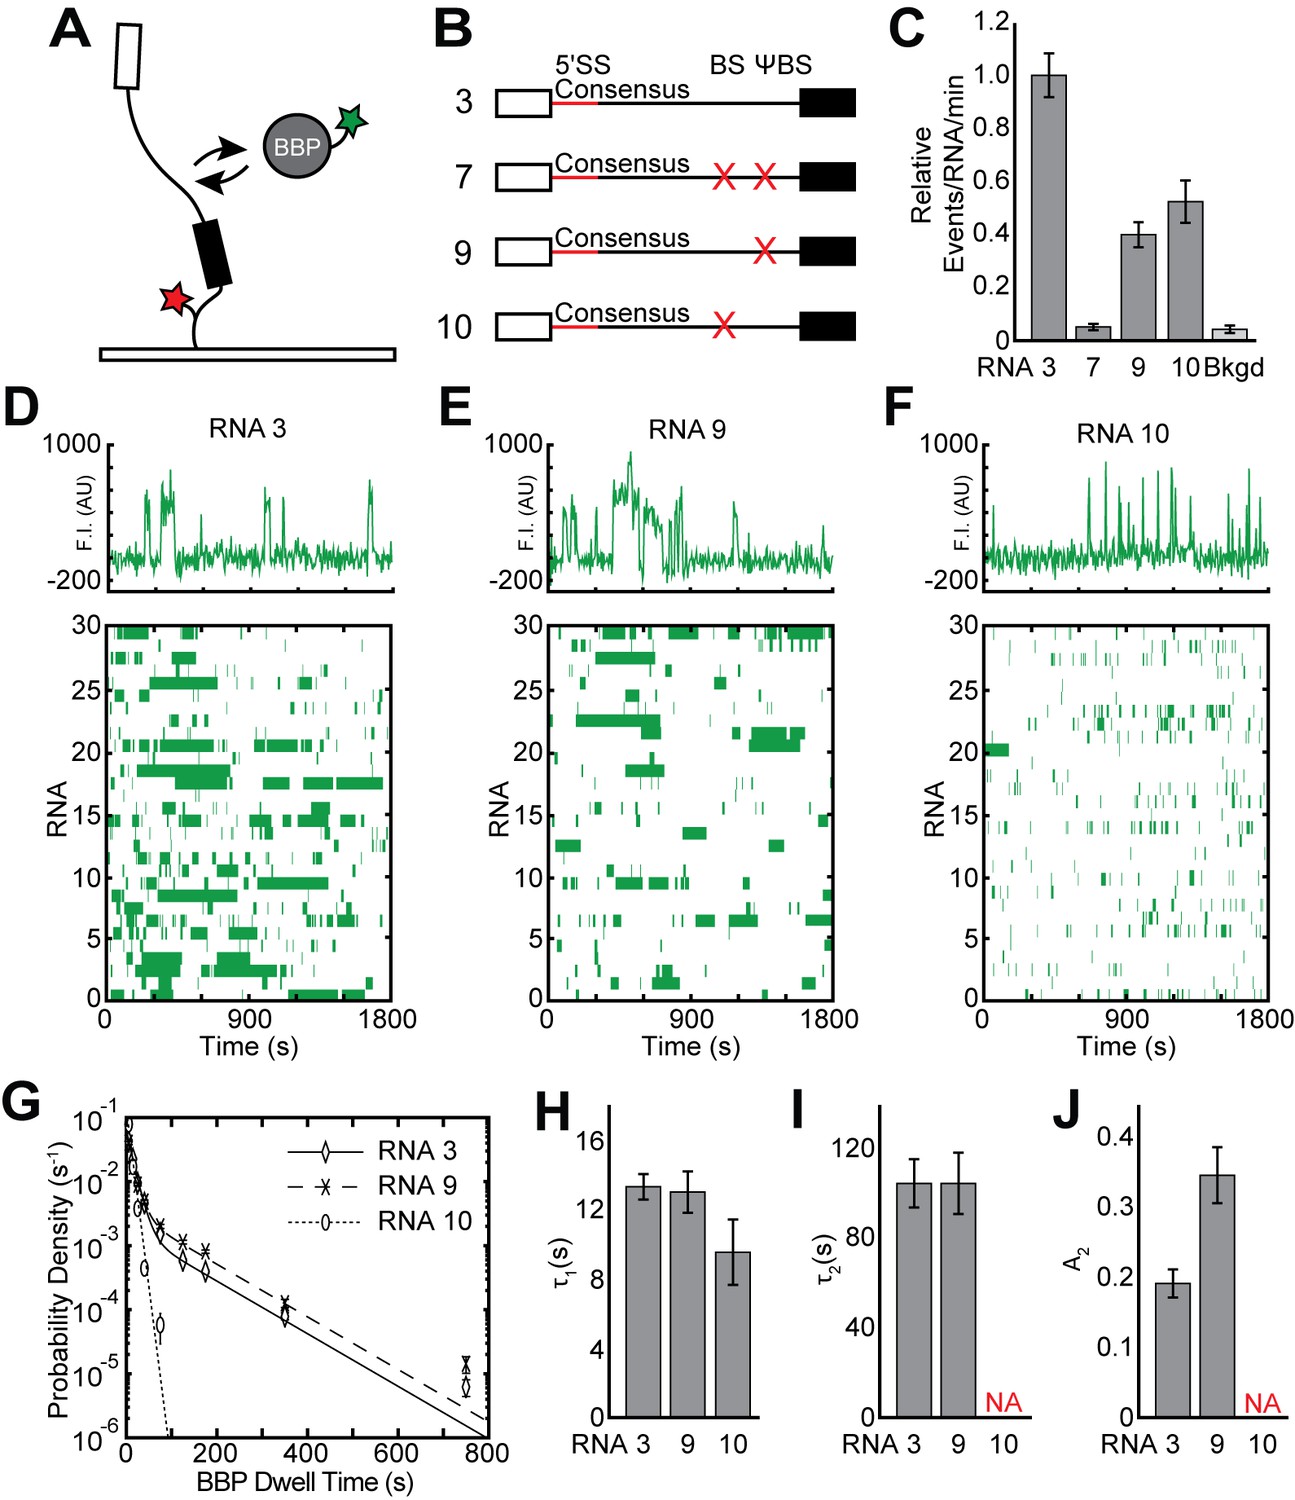
Single molecule analysis of BBP-SNAPf binding dynamics.
(A) Cartoon of a two-color CoSMoS experiment for observing BBP binding dynamics. BBP was labeled with a single green-excited fluorophore while RNA was immobilized to the slide surface and contained a single, red-excited Cy5 fluorophore. (B) Graphic representation of capped RNAs with variable BS and ΨBS used in these experiments and their corresponding label number. RNA sequences are given in Supplementary file 1. (C) Bar graph comparing the relative number of BBP binding events observed on each RNA depicted in panel (B). (D) Rastergram depicting BBP binding events on RNAs containing both a BS and ΨBS (RNA 3). (E) Rastergram depicting BBP binding events on RNAs containing only the BS (RNA 9). (F) Rastergram depicting BBP binding events on RNAs containing only the ΨBS (RNA 10). (G) Probability density histogram of dwell times for BBP on RNAs with variable BS and ΨBS. Lines represent fits of the distributions of dwell times to equations containing one or two exponential terms. (H–J) Bar graph comparison of the fit parameters (τ1, panel H; τ2, panel I; the τ2 amplitude A2, panel J) obtained from analysis of the dwell time distributions of BBP binding events on RNAs 3, 9, and 10. Details of the fit parameters for data shown in (H–J) can be found in Supplementary file 3. Error bars in (C, G) represent the error in counting statistics as given by the variance of a binomial distribution. Bars in (H–J) represent the fit parameters ± S.D.
Figure 2—figure supplement 2

Examples of fluorescence intensity traces supplementing data shown in Figure 2C–I showing individual U1-SNAPf subcomplexes co-localizing with the indicated surface-tethered RNAs containing variable 5' SS sequences in the presence of CA and in the absence of the BS/ΨBS.
(RNAs 3, 5–8; Figure 2B).
Figure 2—figure supplement 3
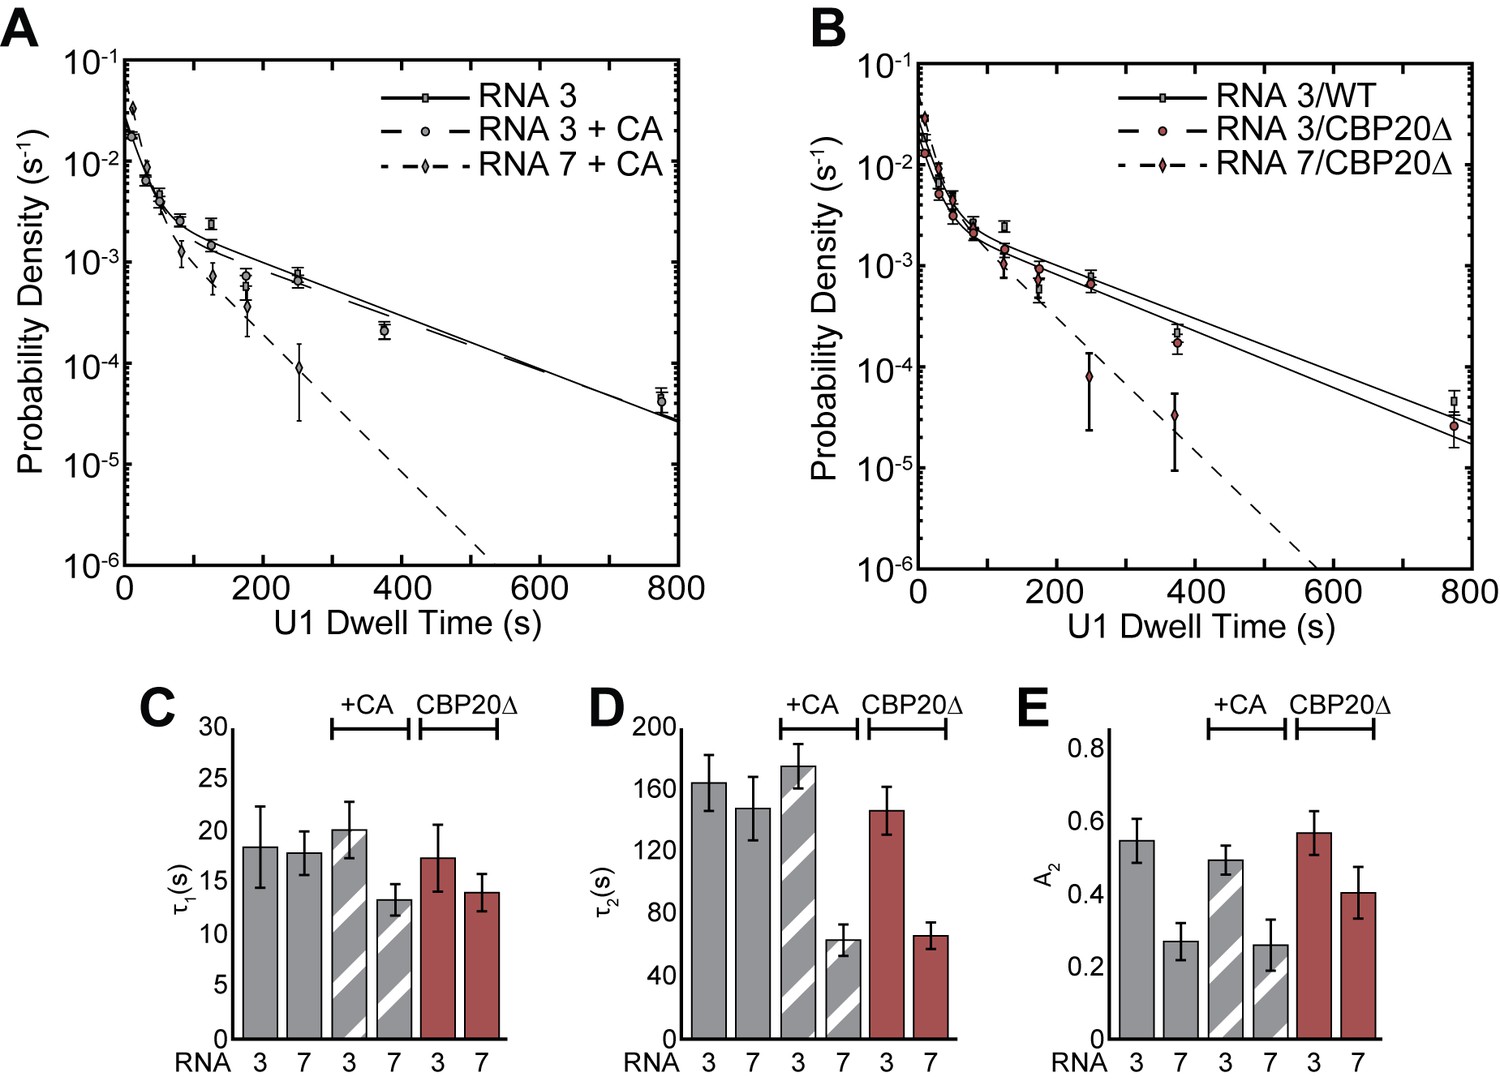
Impact of CBP20 deletion on U1 binding dynamics and comparison with CA addition.
(A) Probability density histogram of dwell times for U1 on RNAs 3 and 7 in the presence or absence of CA. (B) Probability density histogram of dwell times for U1 on RNAs 3 and 7 using WCE containing CBP20 or prepared from stains in which CBP20 was genetically deleted. In panels A and B the lines represent fits of the distributions of dwell times to equations containing two exponential terms. (C–E) Bar graph comparison of the fit parameters (τ1, panel C; τ2, panel D; the τ2 amplitude A2, panel E) obtained from analysis of the dwell time distributions of U1 binding events on RNAs 3 and 7 after either CA addition or after deletion of CBP20. Details of the fit parameters for data shown in (A–E) can be found in Supplementary file 2. Error bars in (A, B) represent the error in counting statistics as given by the variance of a binomial distribution. Bars in (C–E) represent the fit parameters ± S.D. Striped or dark red bars in (C–E) indicate the addition of CA or use of CBP20Δ extract in those experiments, respectively.
Figure 3 with 7 supplements

Three-color CoSMoS observation of U1 and BBP binding dynamics.
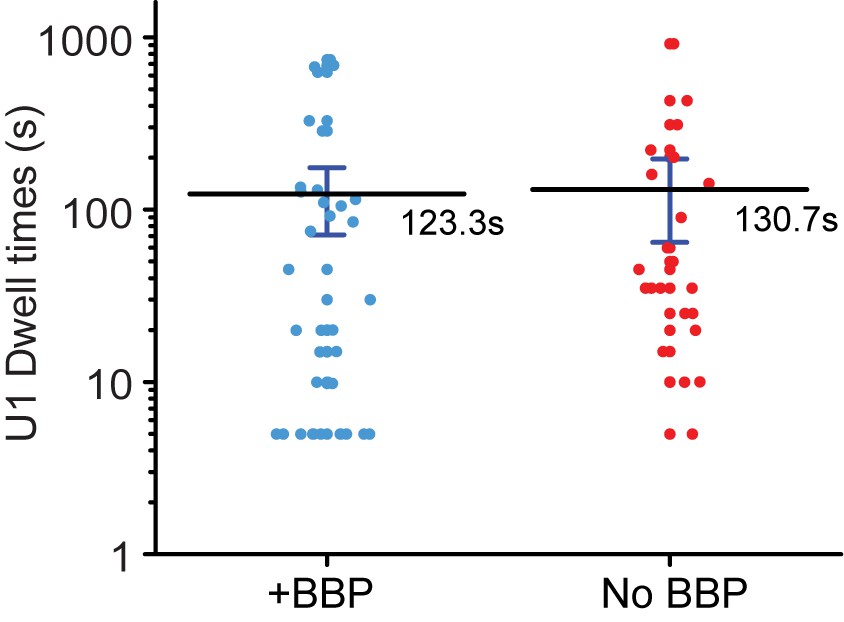
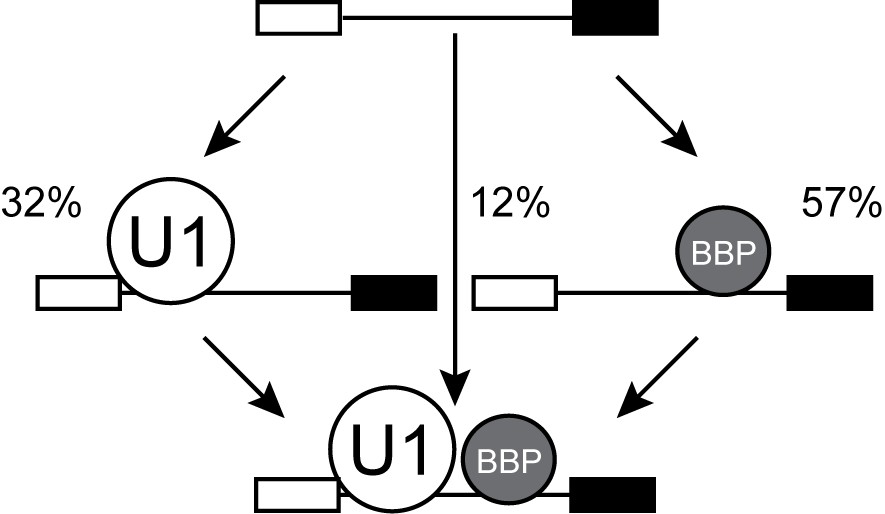
(A) Schematic of a three-color experiment in which U1 was labeled with two red-excited (Cy5) fluorophores, BBP was labeled with a single green-excited (Dy549) fluorophore, and the surface-tethered pre-mRNA was labeled with an Alexa488 fluorophore. Shown below is a graphic representation of the capped, immobilized RNA used in these three-color experiments. (B) Representative time records showing peaks in fluorescence intensity corresponding to colocalization of BBP (green) and U1 (red) with the same individual pre-mRNA molecule. The dashed line demarks the arrival of U1. Shown below the time record is the corresponding time ribbon in which U1 and BBP binding are represented by red and green bands, respectively. Colocalizations of U1 and BBP are represented by blue bands. (C) Rastergram depicting typical U1 and BBP binding events and colocalization on immobilized RNAs. (D) Measured U1 lifetimes in the presence or absence of BBP colocalization. The mean lifetimes are noted ±S.E. (E) Probability density histogram of dwell times for colocalized U1 and BBP complexes. The lines represent the fit of the distribution to an equation containing two exponential terms. Details of the fit parameters can be found in Supplementary file 5. (F) Routes for loss of either U1 or BBP fluorescent spots from immobilized RNAs following their colocalization. Percentages represent the fraction of U1/BBP complexes in which fluorescence disappeared by the indicated pathway (N = 173 initial colocalized U1/BBP complexes). Error bars in (E and F) represent the error in counting statistics as given by the variance of a binomial distribution.
Figure 3—figure supplement 1
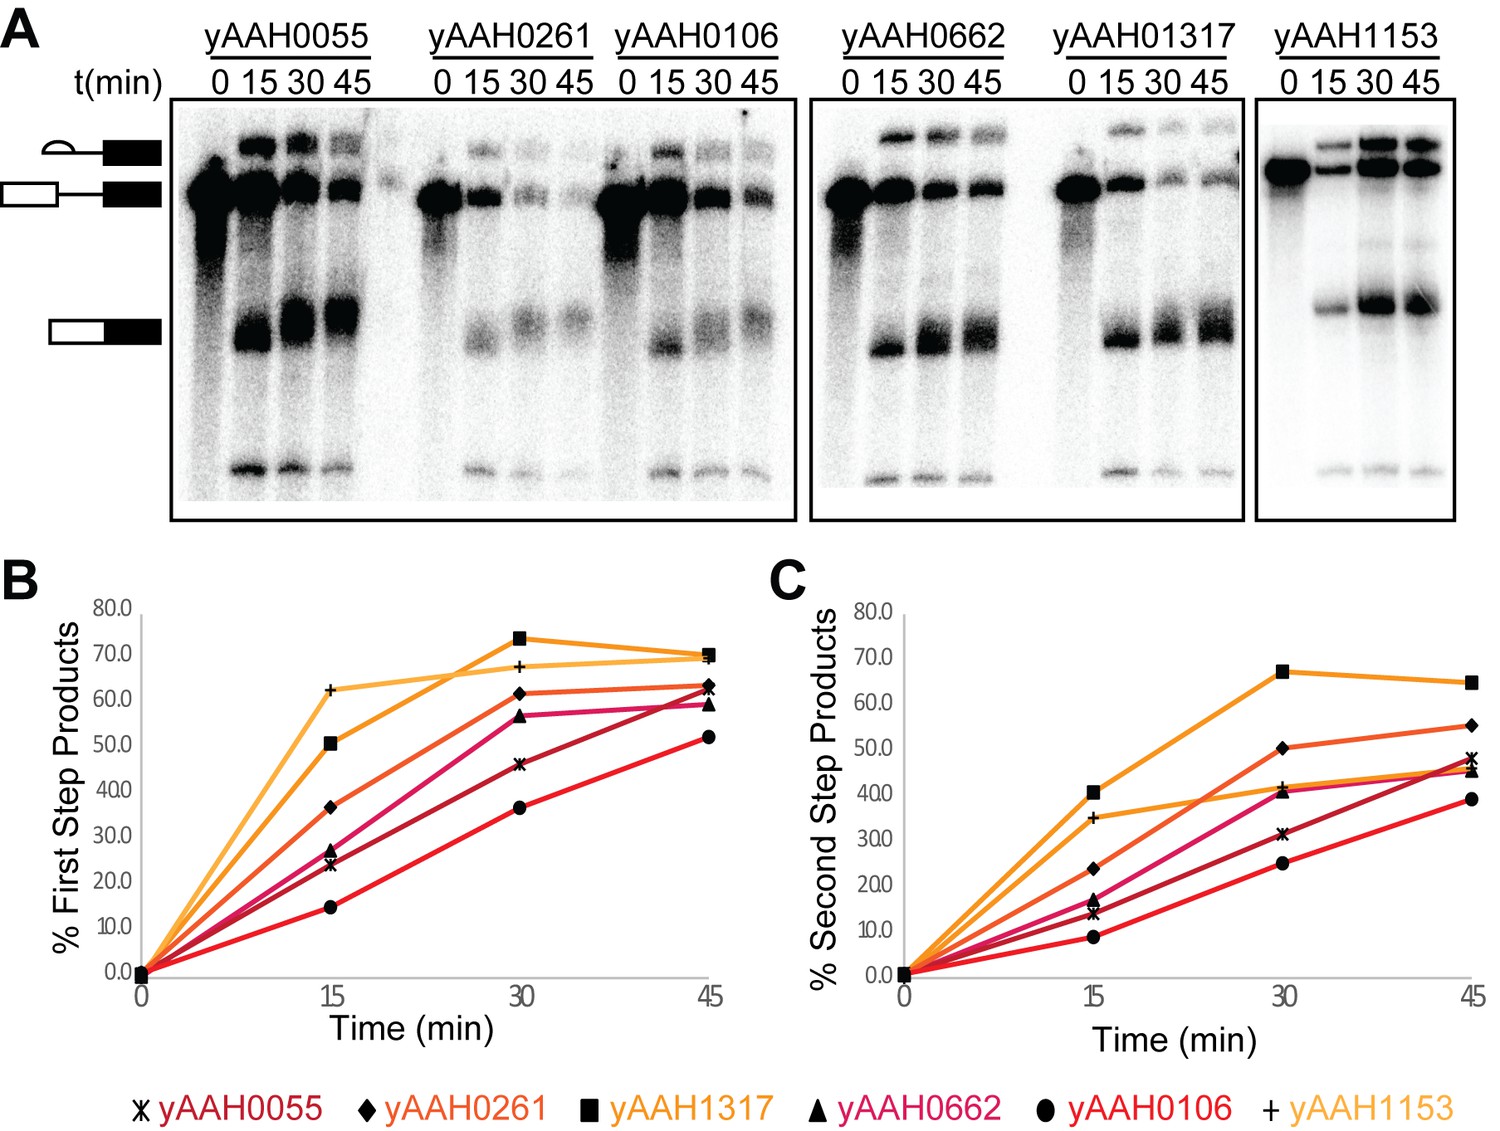
Characterization of U1- and BBP-labeled yeast splicing extracts.
(A) Phosphorimaging of the [32P]-labeled RNAs generated from in vitro splicing assays carried out with WCE prepared from the given strains. (B) Quantification of the results shown in (A) depicting the accumulation of the fraction products that had completed the 1st chemical step in splicing (lariat intron-3' exon and mRNA) over time for labeled extracts. (C) Quantification of the results shown in (A) depicting the accumulation of the fraction of second step product (mRNA) over time for labeled extracts. Descriptions of the each WCE corresponding to numbers listed in (A–C) can be found in Supplementary file 4.
Figure 3—figure supplement 2
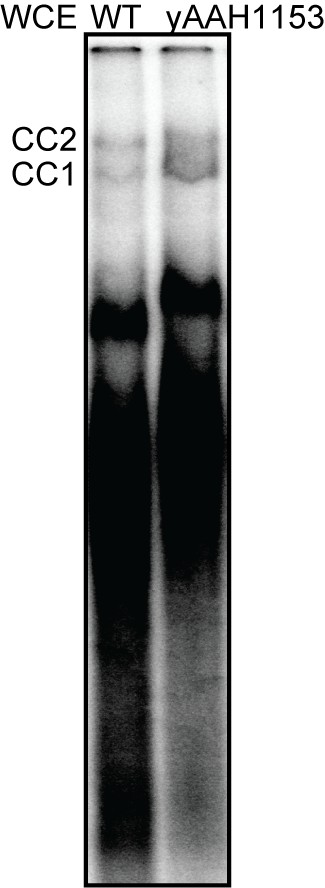
U1- and BBP-labeled WCE forms commitment complexes.
CC1 and CC2 formation on [32P]-labeled RP51A RNA was monitored by native PAGE followed by phosphorimaging of the dried gel. Descriptions of the WT and yAAH1153 strains from which the WCE was prepared can be found in Supplementary file 4.
Figure 3—figure supplement 3
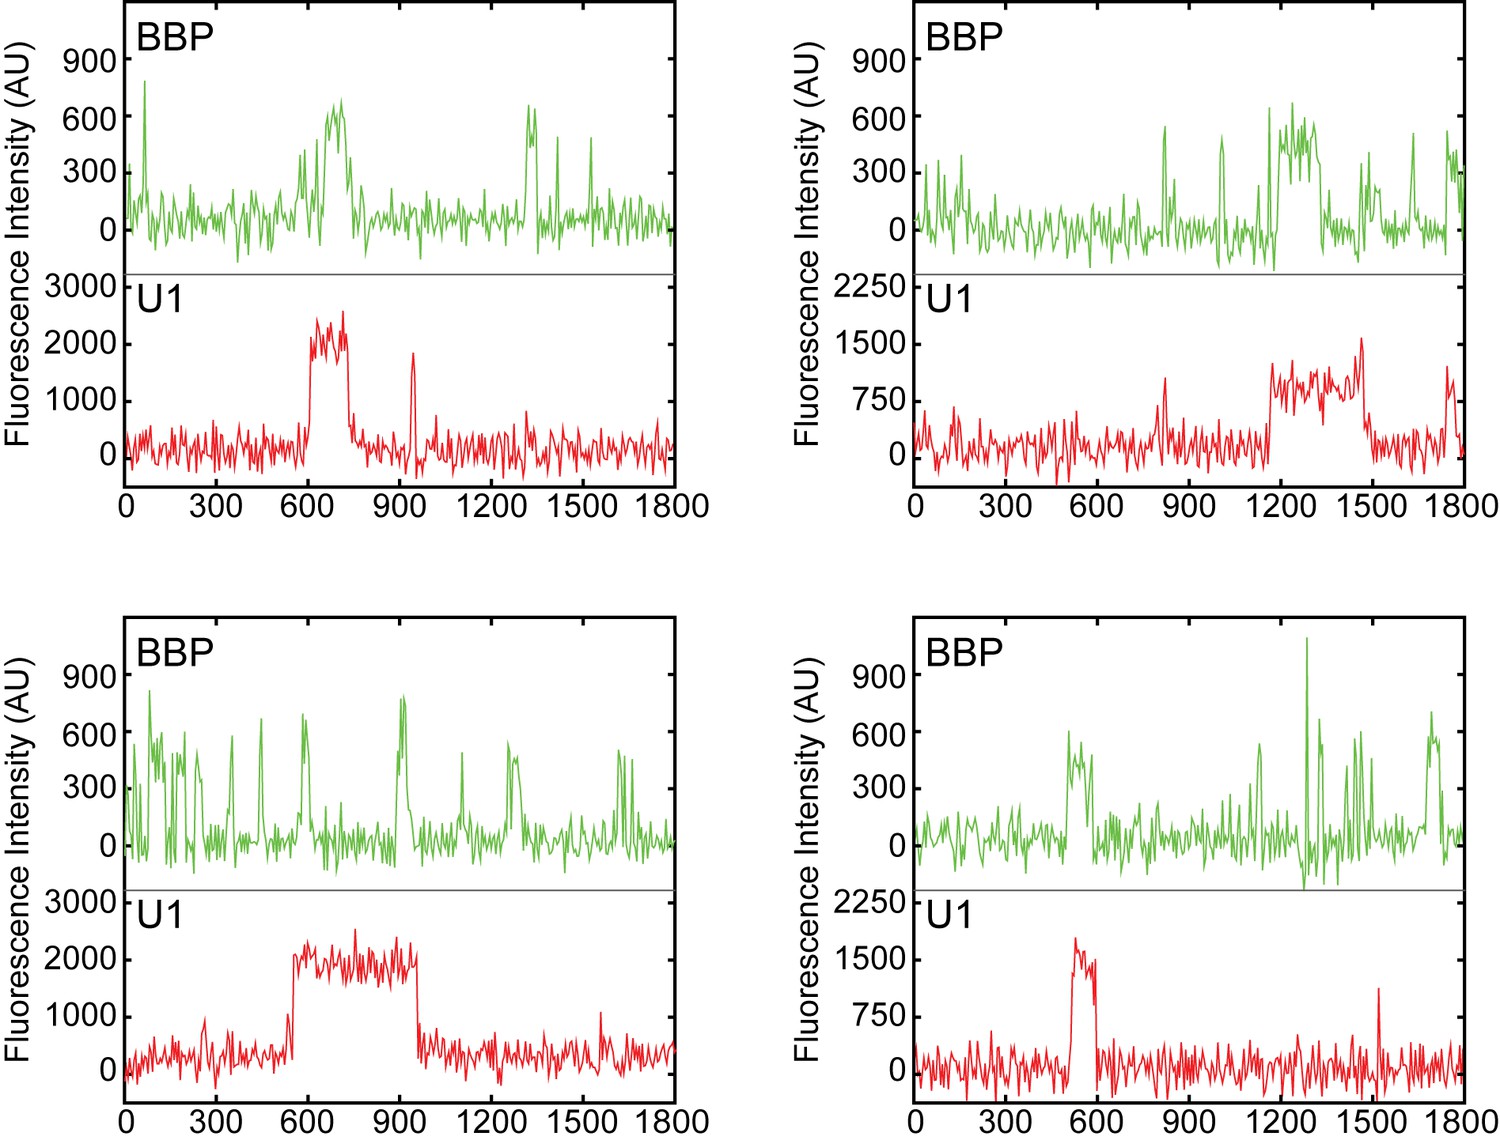
Examples of fluorescence intensity traces supplementing data shown in Figure 3B showing individual U1-DHFR subcomplexes and BBP-SNAPf co-localizing with surface-tethered RNAs.
https://doi.org/10.7554/eLife.27592.014
Figure 3—figure supplement 4
Randomized control for analysis of U1 lifetimes during colocalization with BBP to complement Figure 3D.
U1 and BBP fluorescence intensity traces were randomly paired with one another and U1 dwell times with and without a coincident BBP binding event were then measured and plotted. The mean lifetimes are noted ±S.E and are identical following randomization.
Figure 3—figure supplement 5
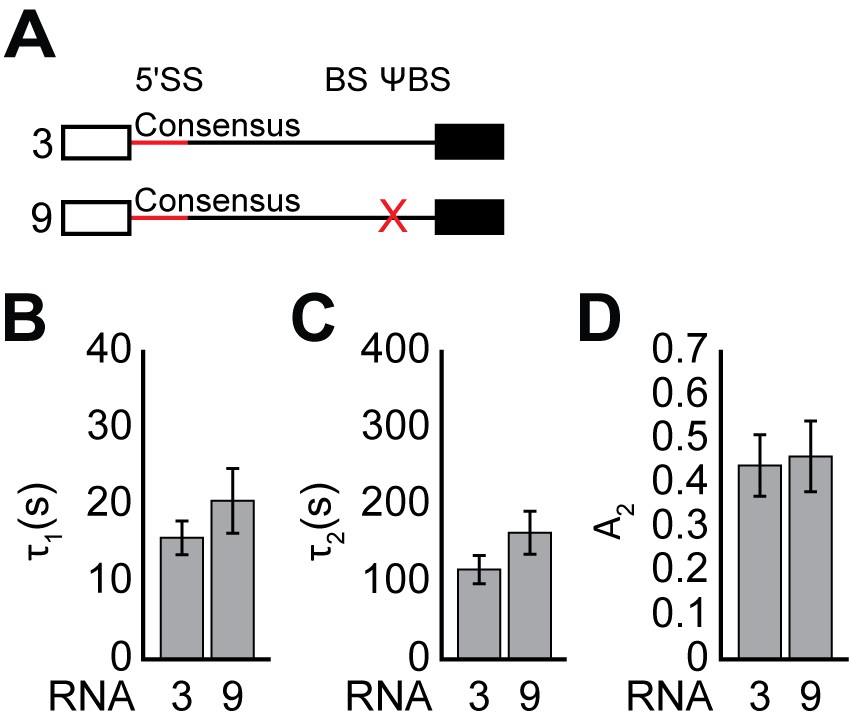
E complex lifetimes on RNAs containing or lacking the ΨBS.
(A) Graphic representation of capped RNAs with variable ΨBS used in these experiments and their corresponding label number. RNA sequences are given in Supplementary file 1. (B–D) Bar graph comparison of the fit parameters (τ1, panel B; τ2, panel C; the τ2 amplitude A2, panel D) obtained from analysis of E complex lifetimes on RNAs 3 and 9. Details of the fit parameters for data shown in (B–D) can be found in Supplementary file 5, and bars in (C–E) represent the fit parameters ± S.D.
Figure 3—figure supplement 6
Pathways for E complex formation.
In WCE, E complex can form either by U1 or BBP first pathways (N = 92 RNAs that acquired colocalized U1 and BBP molecules).
Figure 3—figure supplement 7
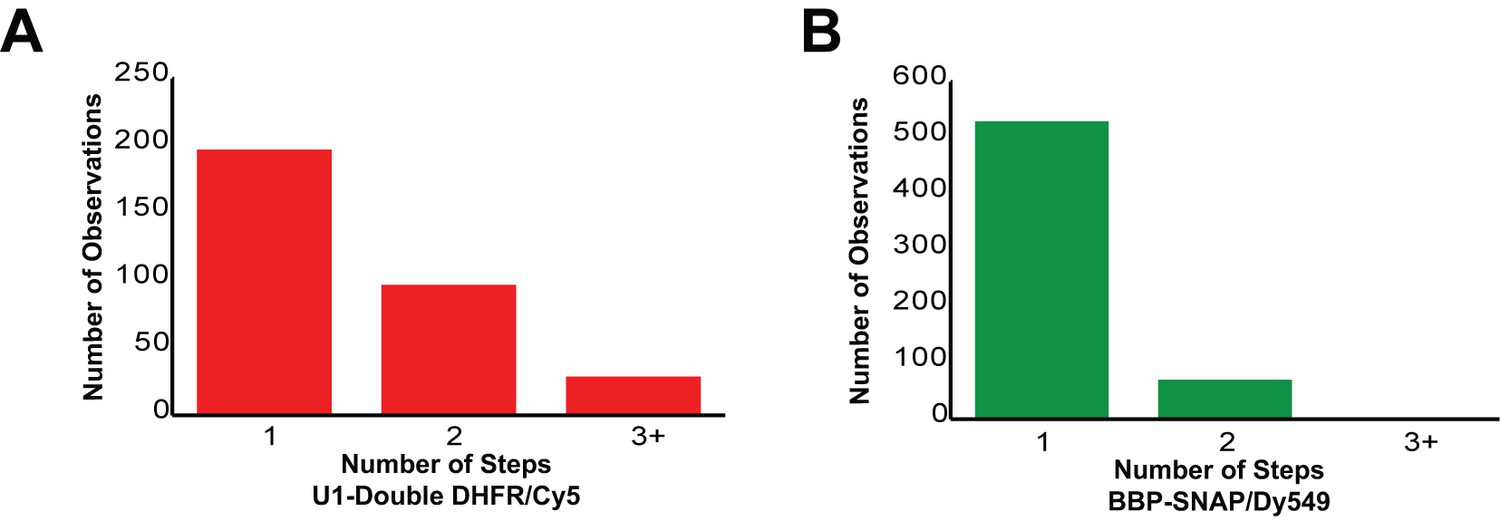
Counting statistics for the number of steps observed during loss of fluorescence from either U1-double DHFR or BBP-SNAPf binding events in three-color CoSMoS experiments.
(A) Number of steps observed during loss of U1 fluorescence. Each U1 molecule contains two fluorophores, which can result in either 1 or two steps. 91% of U1 binding events are consistent with presence of only a single U1 molecule on the pre-mRNA. (B) Number of steps observed during loss of BBP fluorescence. Each BBP molecule contains a single fluorophore. 88% of BBP binding events are consistent with presence of only a single BBP molecule on the pre-mRNA.
Figure 4 with 1 supplement
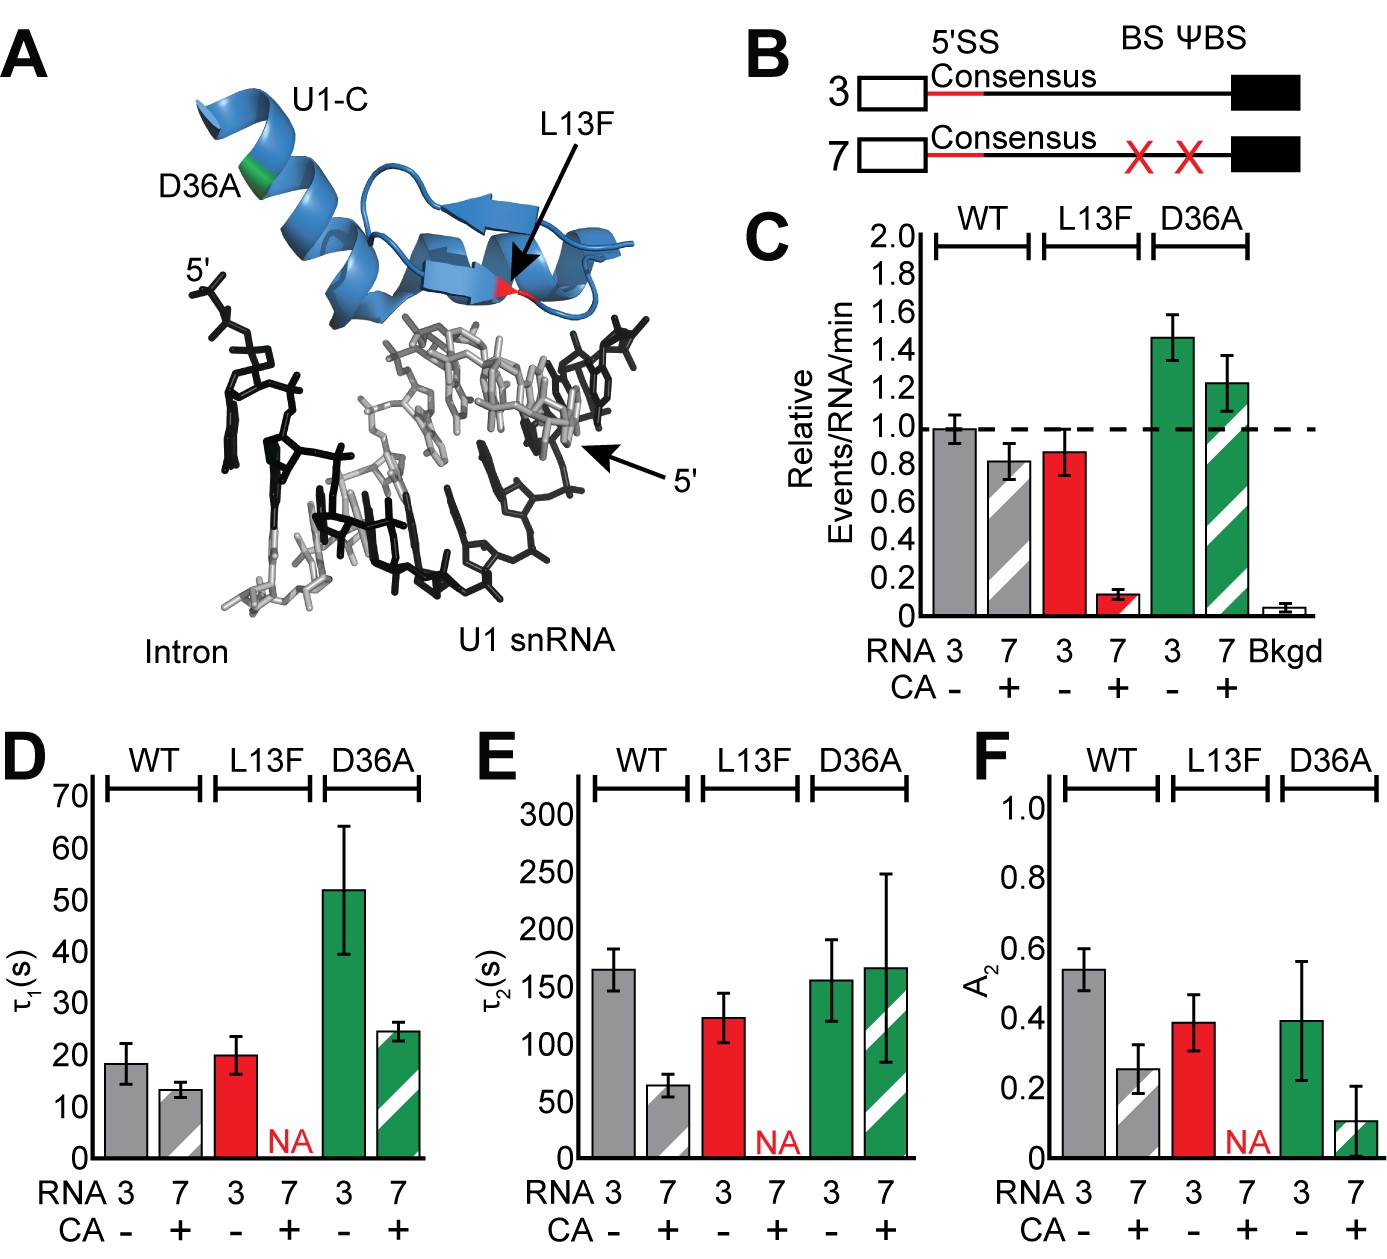
Impact of Yhc1 mutations on U1 binding dynamics.
(A) Close-up view of the structure of a human U1 snRNP fragment focusing on proximity of the U1 snRNA/5' SS duplex to the U1-C protein (from 4PJO.pdb). The locations of the L13F (red) and D36A (green) mutations incorporated into yeast Yhc1 are shown. (B) Graphic representation of capped RNAs with consensus 5' SS and variable BS and their corresponding label number. RNA sequences are given in Supplementary file 1. (C) Bar graph comparing the relative number of WT and Yhc1 mutant U1 binding events observed on RNAs 3 and 7 depicted in panel (B) and in the presence or absence of CA. (D–F) Bar graph comparison of the fit parameters (τ1, panel D; τ2, panel E; the τ2 amplitude A2, panel F) obtained from analysis of the dwell time distributions of WT and Yhc1 mutant U1 binding events on RNAs 3 and 7 in the presence or absence of CA. Details of the fit parameters for data shown in (D–F) can be found in Supplementary file 2. Error bars in (C) represent the error in counting statistics as given by the variance of a binomial distribution. Bars in (D–F) represent the fit parameters ± S.D. Striped bars in (C–F) indicate the addition of CA in those experiments.
Figure 4—figure supplement 1
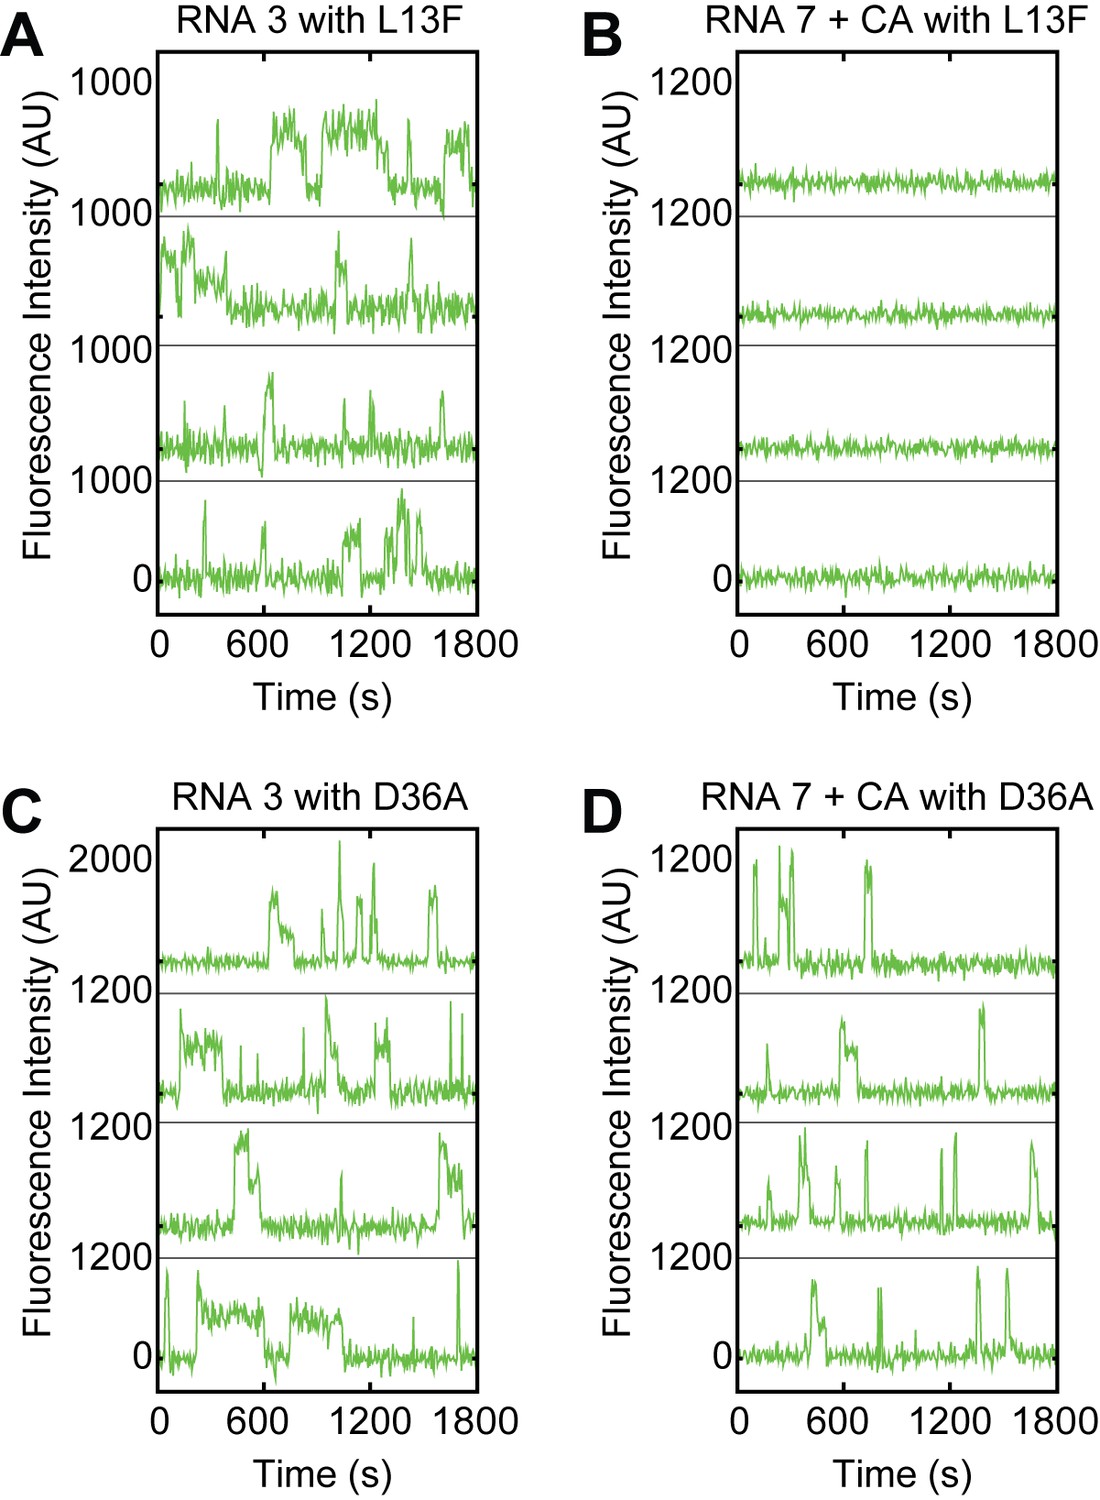
Examples of fluorescence intensity traces supplementing data shown in Figure 4C–F showing individual Yhc1-L13F or –D36A U1-SNAPf subcomplexes co-localizing with the indicated surface-tethered RNAs in the presence or absence of CA (RNAs 3 and 7, Figure 4B).
https://doi.org/10.7554/eLife.27592.020
Figure 5 with 2 supplements
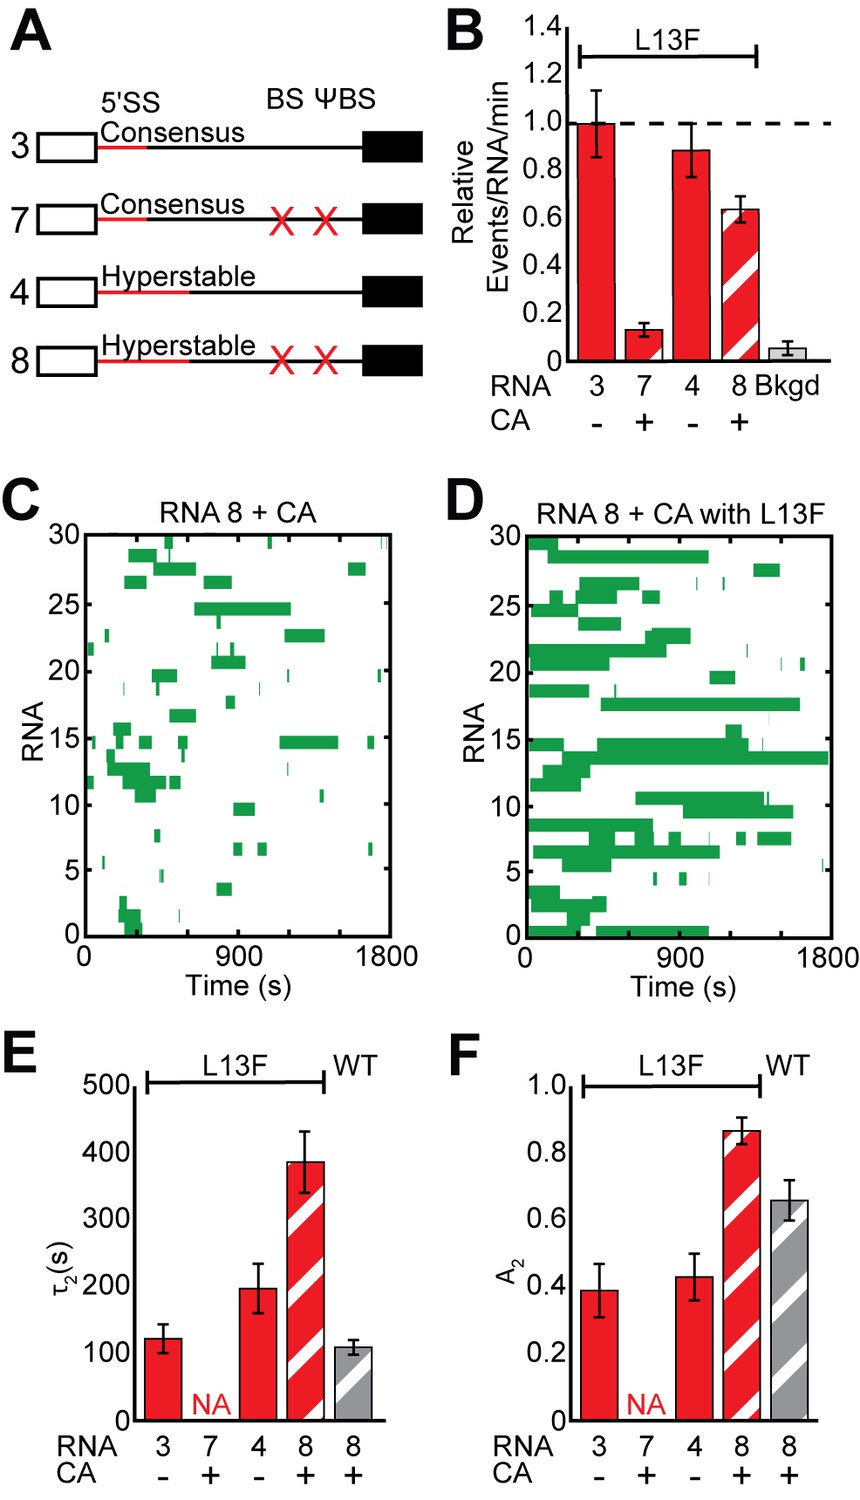
Impact of Yhc1 mutations on U1 binding dynamics to RNAs containing a hyperstabilized 5' SS.
(A) Graphic representation of capped RNAs with variable 5' SS and BS and their corresponding label number. RNA sequences are given in Supplementary file 1. (B) Bar graph comparing the relative number of WT and Yhc1 mutant U1 binding events observed on RNAs depicted in panel (A) and in the presence or absence of CA. (C) Rastergram depicting WT U1 binding events on RNAs containing a hyperstabilized 5' SS (RNA 8) in the presence of CA. (D) Rastergram depicting Yhc1-L13F U1 binding events on RNAs containing a hyperstabilized 5' SS (RNA 8) in the presence of CA. (E, F) Bar graph comparison of the fit parameters (τ2, panel E; the τ2 amplitude A2, panel F) obtained from analysis of the dwell time distributions of WT and Yhc1-L13F U1 binding events on RNAs shown in panel (A) in the presence or absence of CA. Details of the fit parameters for data shown in (E–F) can be found in Supplementary file 2. Error bars in (B) represent the error in counting statistics as given by the variance of a binomial distribution. Bars in (D,E) represent the fit parameters ± S.D. Striped bars in (B,E,F) indicate the addition of CA in those experiments.
Figure 5—figure supplement 1

Examples of fluorescence intensity traces supplementing data shown in Figure 5B–F showing individual Yhc1-L13F U1-SNAPf subcomplexes co-localizing with the indicated surface-tethered RNAs in the presence or absence of CA (RNAs 4 and 8, Figure 5A).
https://doi.org/10.7554/eLife.27592.022
Figure 5—figure supplement 2
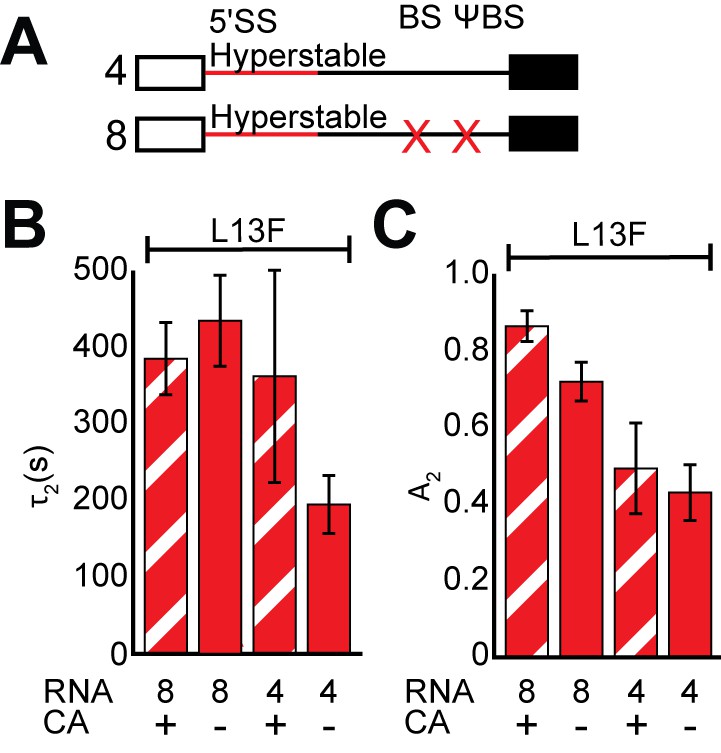
The BS and 5' cap work toegether to promote Yhc1-L13F release from RNAs containing hyperstabilized 5' SS.
(A) Graphic representation of capped RNAs containing hyperstabilized 5' SS but with variable BS/ΨBS used in these experiments and their corresponding label number. RNA sequences are given in Supplementary file 1. (B, C) Bar graph comparison of the fit parameters (τ2, panel B, and the τ2 amplitude A2, panel C) obtained from analysis of Yhc1-L13F U1 lifetimes on RNAs 4 and 8 in the presence or absence of CA. On hyperstabilized 5' SS, presence of the BS suppresses switching to the long-lived Yhc1-L13F U1 complex (decreases A2; compare A2 for RNA 4 + CA vs. RNA 8 + CA). CA has a much smaller effect on A2 (compare A2 for RNA 8 ± CA) but still increases τ2. However, suppression of both A2 and τ2 requires influences from both the 5' cap and BS. Details of the fit parameters for data shown in (B, C) can be found in Supplementary file 2, and bars in (B, C) represent the fit parameters ± S.D.
Figure 6 with 1 supplement
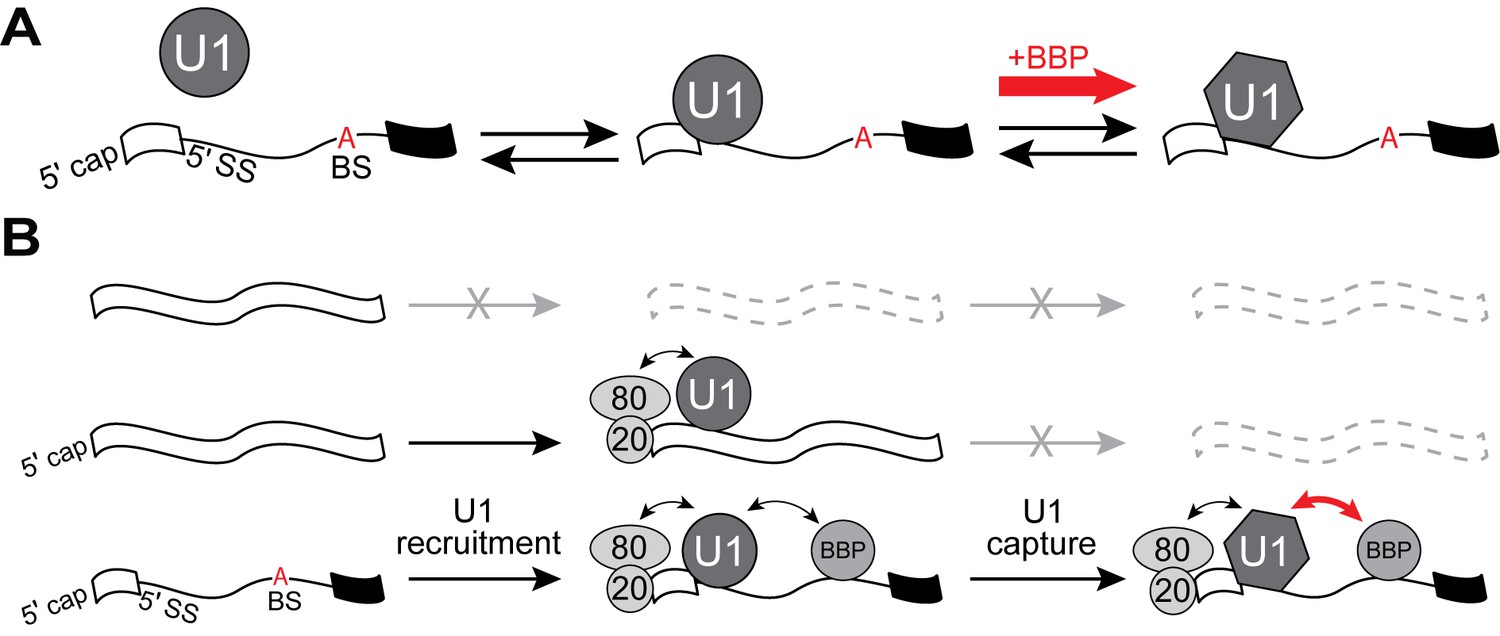
U1 binding kinetics are tuned to increase pre-mRNA competitiveness for the snRNP.
(A) Model of a two-step mechanism for U1 binding. U1 first forms an initial complex that is short-lived before transitioning to a longer-lived complex. Binding of BBP to a downstream BS stimulates this transition. (B) A ‘recruit and capture’ model for stimulating U1 occupancy on pre-mRNAs. U1 is first recruited to transcripts by forming short-lived complexes dependent on interactions occurring either at potential 5' SS or by interactions with ECPs. Transition to long-lived complexes dependent snRNA/5' SS pairing and stimulated by BBP bound at the BS facilitates efficient capture of U1 by pre-mRNAs.
Figure 6—figure supplement 1
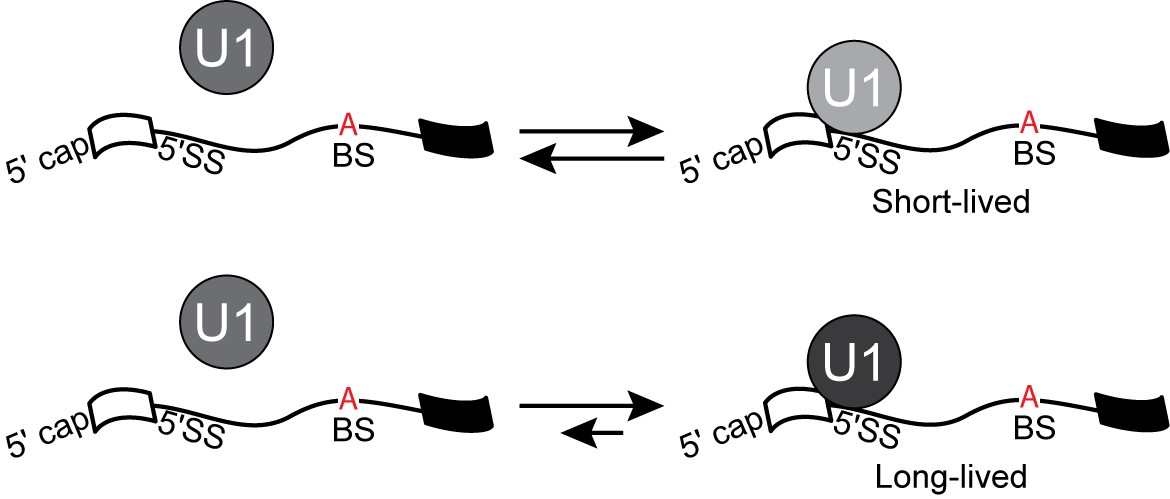
An alternative U1 binding mechanism to that shown in Figure 6 that can give rise to multi-exponential dwell time distributions.
U1 can bind the same pre-mRNA via two independent pathways to yield short- and long-lived complexes that cannot directly interconvert.
Additional files
-
Supplementary file 1
Sequences of RNAs used in these experiments.
- https://doi.org/10.7554/eLife.27592.026
-
Supplementary file 2
Fit Parameters for the Distribution of U1 Lifetimes Under Various Conditions
- https://doi.org/10.7554/eLife.27592.027
-
Supplementary file 3
Fit Parameters for the Distribution of BBP Lifetimes on RNAs Containing or Lacking the BS
- https://doi.org/10.7554/eLife.27592.028
-
Supplementary file 4
Yeast strains used in these experiments.
- https://doi.org/10.7554/eLife.27592.029
-
Supplementary file 5
Fit Parameters for the Distribution of Lifetimes of E Complexes Containing Colocalized U1 and BBP
- https://doi.org/10.7554/eLife.27592.030
-
Supplementary file 6
Plasmids for Yeast Protein Expression and Encoding DNA Templates for RNA Substrates
- https://doi.org/10.7554/eLife.27592.031
-
Transparent reporting form
- https://doi.org/10.7554/eLife.27592.032
Download links
A two-part list of links to download the article, or parts of the article, in various formats.
Downloads (link to download the article as PDF)
Open citations (links to open the citations from this article in various online reference manager services)
Cite this article (links to download the citations from this article in formats compatible with various reference manager tools)
Dynamics and consequences of spliceosome E complex formation
eLife 6:e27592.
https://doi.org/10.7554/eLife.27592


