Tissue-specific regulation of BMP signaling by Drosophila N-glycanase 1
- Baylor College of Medicine, United States
- RIKEN Global Research Cluster, Japan
Figures
Figure 1
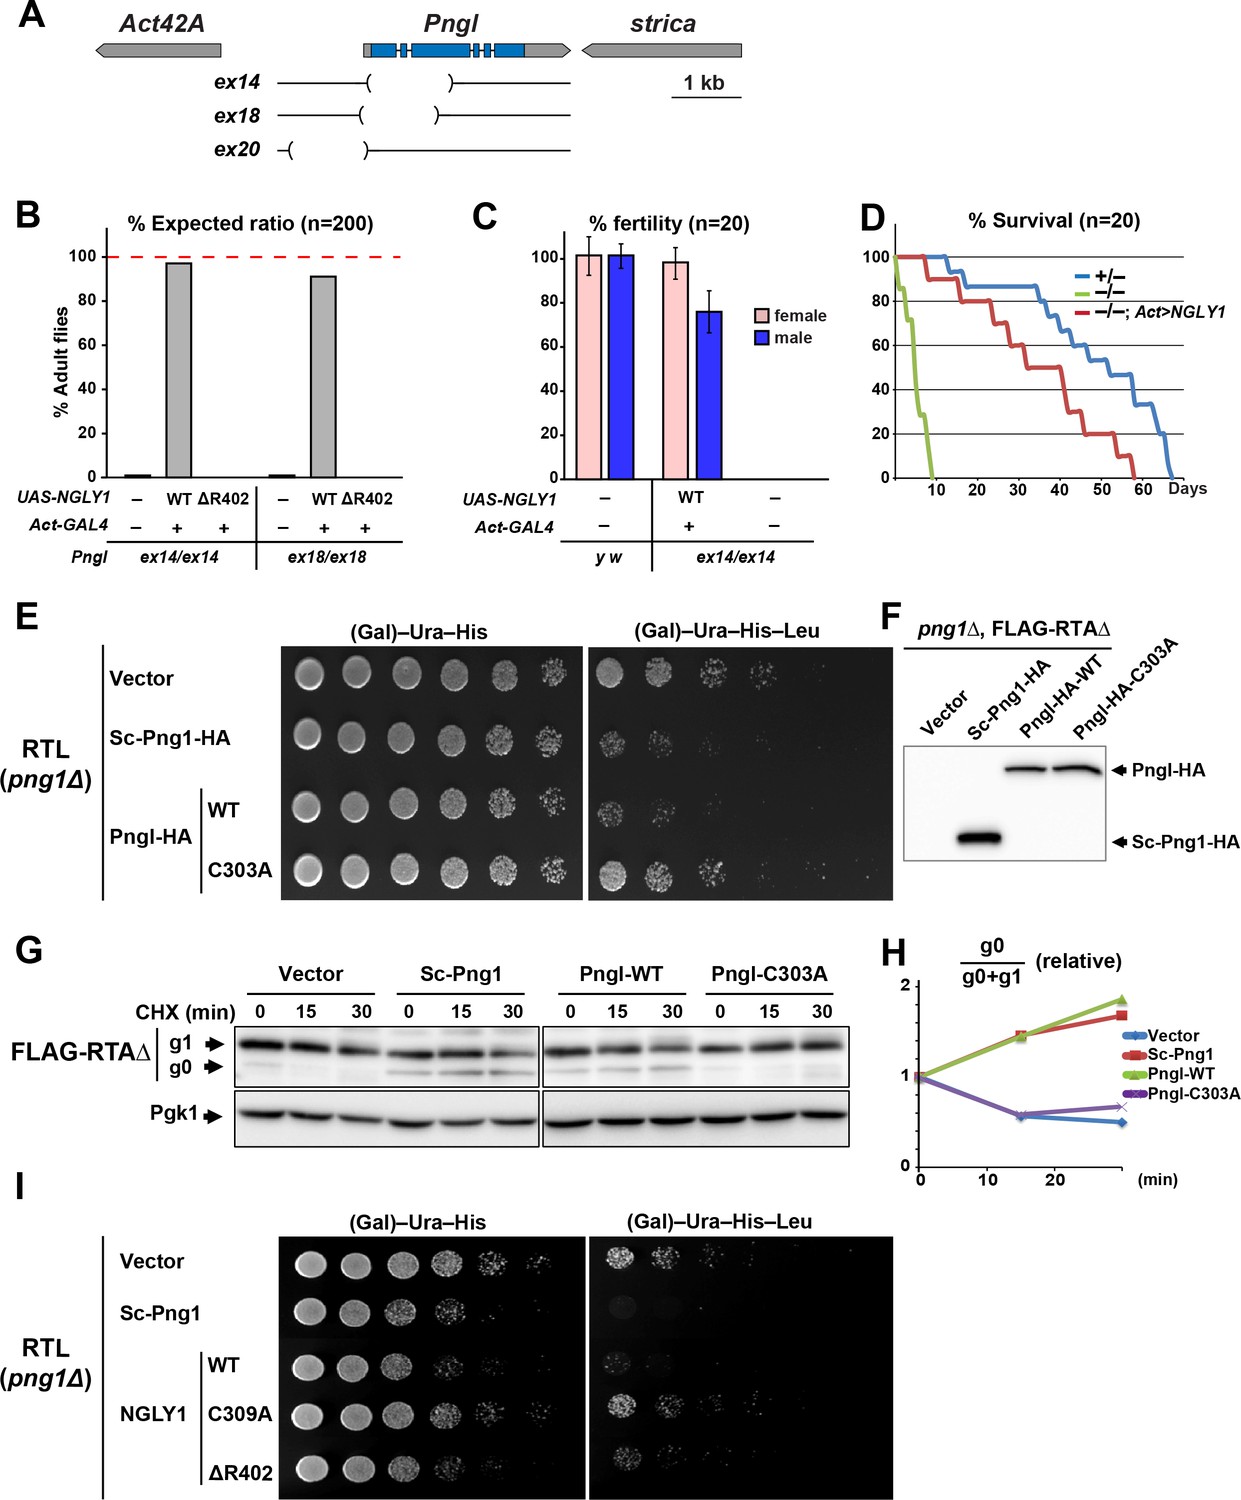
Fly Pngl has a high level of functional conservation with human NGLY1.
(A) Schematic of the Pngl locus and the deleted section of the alleles used in this study. (B) Eclosion tests of Pngl–/– flies with or without rescue by ubiquitous expression of NGLY1-WT or NGLY1-ΔR402. The red dashed line marks the expected Mendelian ratio. (C) Fertility tests of Pngl–/– flies rescued by NGLY1-WT and Pngl–/– escaper flies compared to yellow white (y w) flies used as control. (D) Longevity tests of Pngl–/– escaper flies compared to Pngl+/– and Pngl–/– flies rescued by NGLY1-WT. (E) RTL spotting assay on png1Δ mutant yeast transfected with empty vector or expression vectors for HA-tagged versions of Saccharomyces cerevisiae PNGase (Sc-Png1-HA), and wild-type or C303A-mutant Drosophila Pngl (Pngl-HA). (F) Western blot analysis of the yeast strains used in (E) by anti-HA antibody. (G) Cycloheximide (CHX) decay assay for FLAG-RTAΔ on yeast transfected with the same vectors as (E), followed by immunoblotting with anti-FLAG. Phosphoglycerate kinase (Pgk1) was used as loading control. (H) Quantification of cycloheximide decay assay for FLAG-RTAΔ showing deglycosylated (g0)/deglycosylated (g0) +glycosylated (g1) ratio for each genotype over time. The graph represents the mean of three independent experiments. (I) RTL spotting assay by using yeast PNGase (Sc-Png1-HA), and WT, C309A or ΔR402-mutant human NGLY1.
Figure 2 with 2 supplements
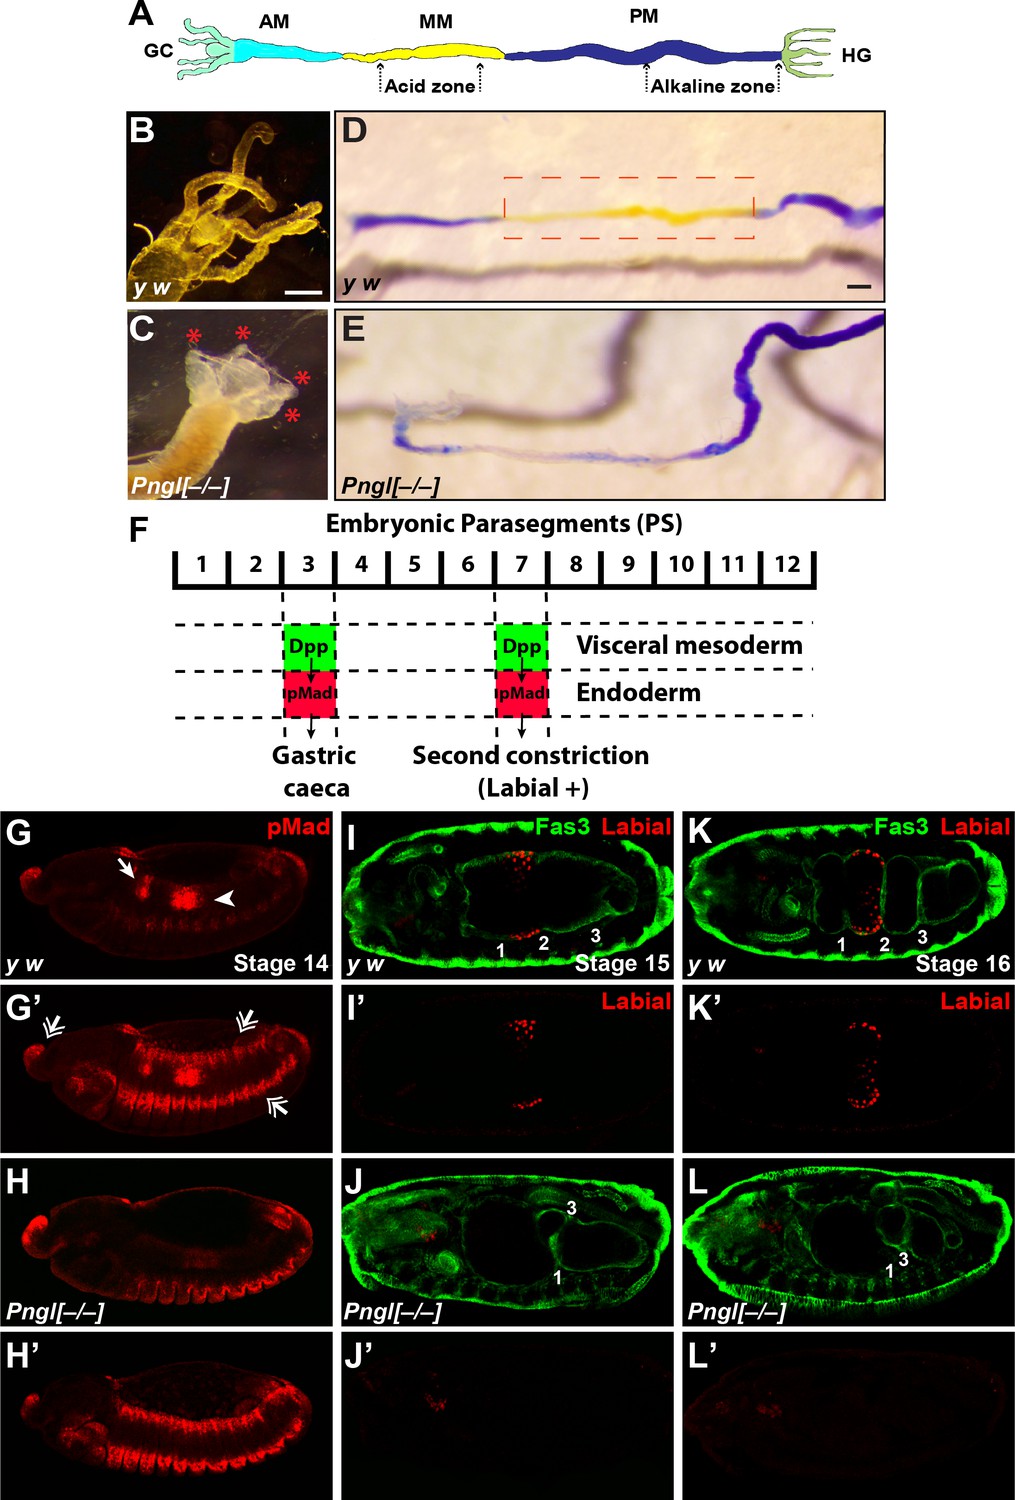
Loss of Pngl results in larval midgut defects and impaired BMP signaling from VM to endoderm.
(A) Schematic drawing of larval midgut/hindgut indicating gastric caeca (GC), anterior midgut (AM), middle midgut (MM), posterior midgut (PM), and hindgut (HG). (B and C) Bright field images of the proximal midgut region of larvae 96 hours after egg deposition. Red asterisks in C mark the shortened gastric caeca upon loss of Pngl. Scale bar, 100 µm. (D and E) Bright field images of midgut from third instar larvae fed with food containing bromophenol blue. Acid zone is delimitated by the red dotted boxes. Scale bar, 100 µm. (F) Schematic drawing of Dpp signaling in the embryonic midgut. (G–H’) pMad staining of stage 14 embryos of the indicated genotypes. In G and H, limited projection views are shown to highlight pMad expression in PS3 (arrow) and PS7 (arrowhead). G’ and H’ are full projection view of the datasets shown in G and H. Note that expression of pMad in ectodermal bands and other regions are not affected by the loss of Pngl (double-arrowheads). (I–L’) Fas3 (VM marker) and Labial staining of stage 15 and 16 embryos of indicated genotypes. Midgut constrictions are marked by numbers along the anterior-posterior axis.
Figure 2—figure supplement 1

Loss of one copy of Pngl does not impair midgut development and BMP signaling in the embryo.
(A) Bright field image of the proximal midgut region of a Pnglex14/+ larvae 96 hours after egg deposition. (B) Bright field image of midgut from a Pnglex14/+ third instar larvae fed with food containing bromophenol blue. Acid zone is delimitated by the red dotted boxes. (C and C’) pMad staining of a stage 14 Pnglex14/+ embryo. (C) is a limited projection view to highlight pMad expression in PS3 and PS7. (C’) is a full projection view of the dataset shown in (C). (D–E’) Fas3 (VM marker) and Labial staining of stage 15 and 16 Pnglex14/+ embryos. Midgut constrictions are marked by numbers along the anterior-posterior axis.
Figure 2—figure supplement 2
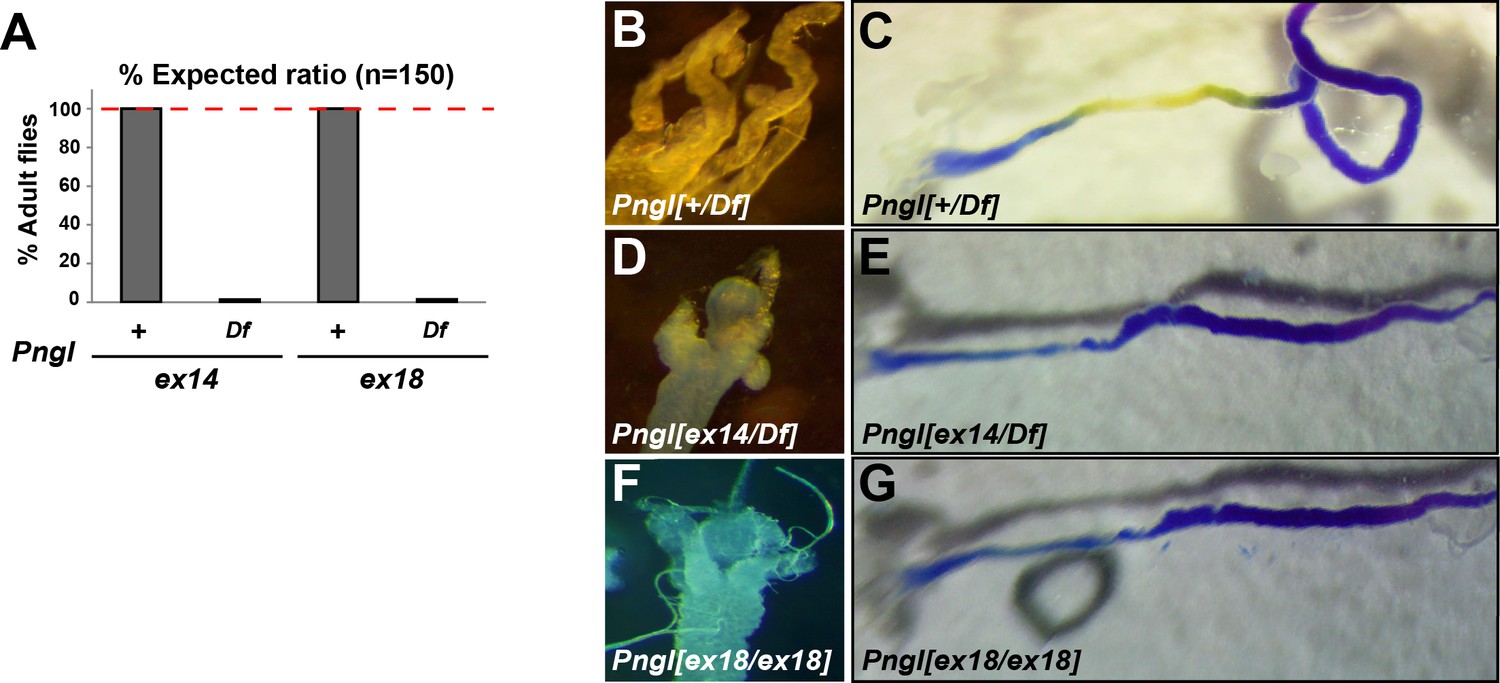
Pnglex14 and Pnglex18 are genetic null alleles.
(A) Lethality tests for Pnglex14/Df and Pnglex18/Df animals (Df, deficiency Df(2R)ED1484). (B–G) Bright field images of the proximal midgut and acid zone of 3rd instar larvae with the indicated genotypes.
Figure 3 with 1 supplement
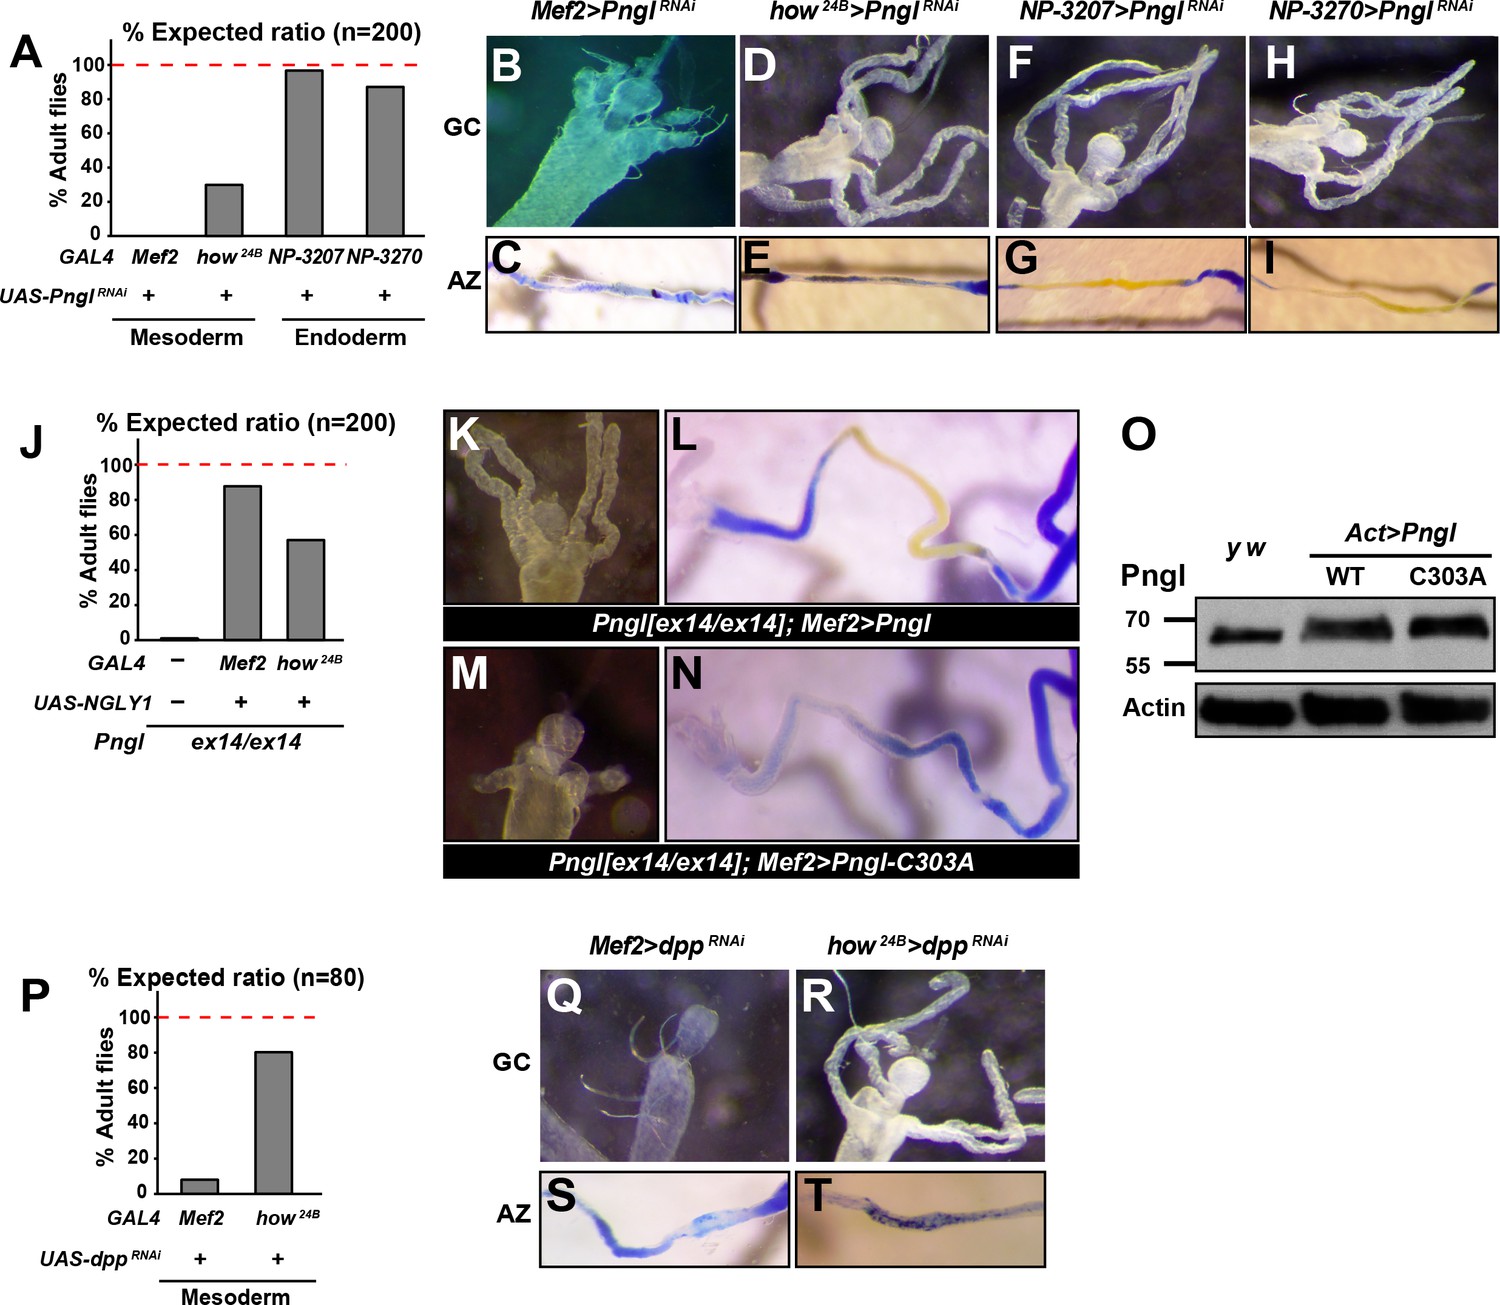
The enzymatic activity of Pngl is essential in the mesoderm for the regulation of BMP pathway in the midgut.
(A) Eclosion tests of PnglRNAi flies based on expected Mendelian ratio using two pan-mesodermal drivers (Mef2- and how24B-GAL4) and two midgut endodermal drivers (NP3207- and NP3270-GAL4). (B–I) Proximal midgut region and acid zone of the indicated genotypes. (J) Rescue of the lethality of Pnglex14/ex144 animals by expressing NGLY1-WT using Mef2- and how24B-GAL4 drivers. (K–N) Proximal midgut region and acid zone of the indicated genotypes. (O) SDS gels were used to run larval extracts from the indicated genotypes and were probed with an antibody against Pngl. (P) Eclosion tests of dppRNAi flies using Mef2- and how24B-GAL4 drivers. (Q–T) Proximal midgut region and acid zone of the indicated genotypes.
Figure 3—figure supplement 1
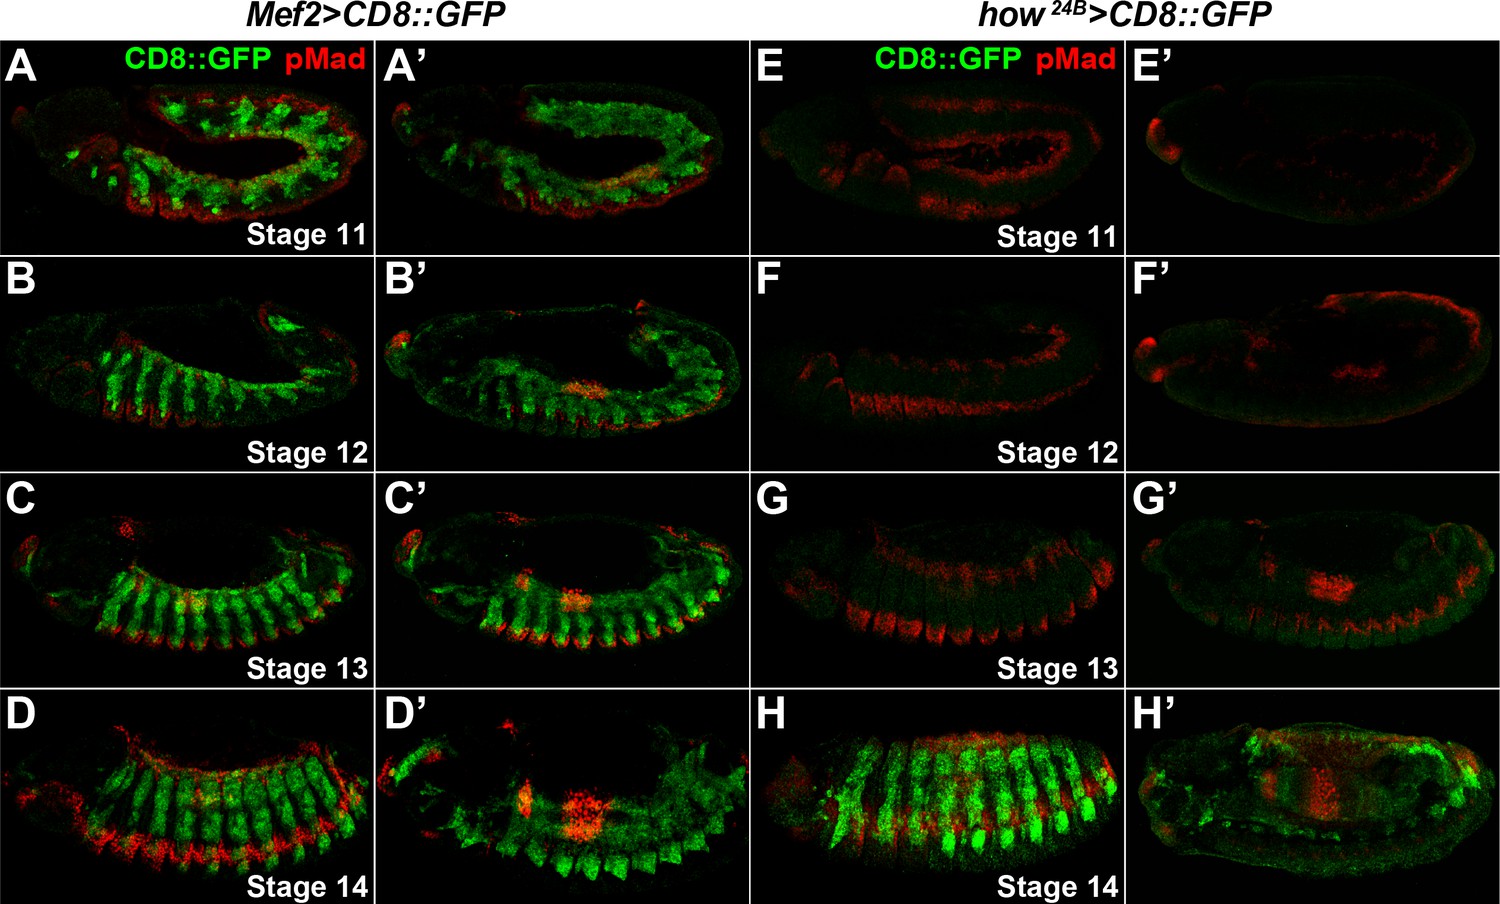
Mef2-GAL4 expression starts earlier than how24B-GAL4 expression during embryonic development.
Full projection view of stage 11–14 Mef2 >CD8::GFP (A–D) and how24B > CD8::GFP (E–H) embryos. Limited projection views are shown in (A’–H’) to highlight pMad expression in the midgut region of the indicated genotypes.
Figure 4
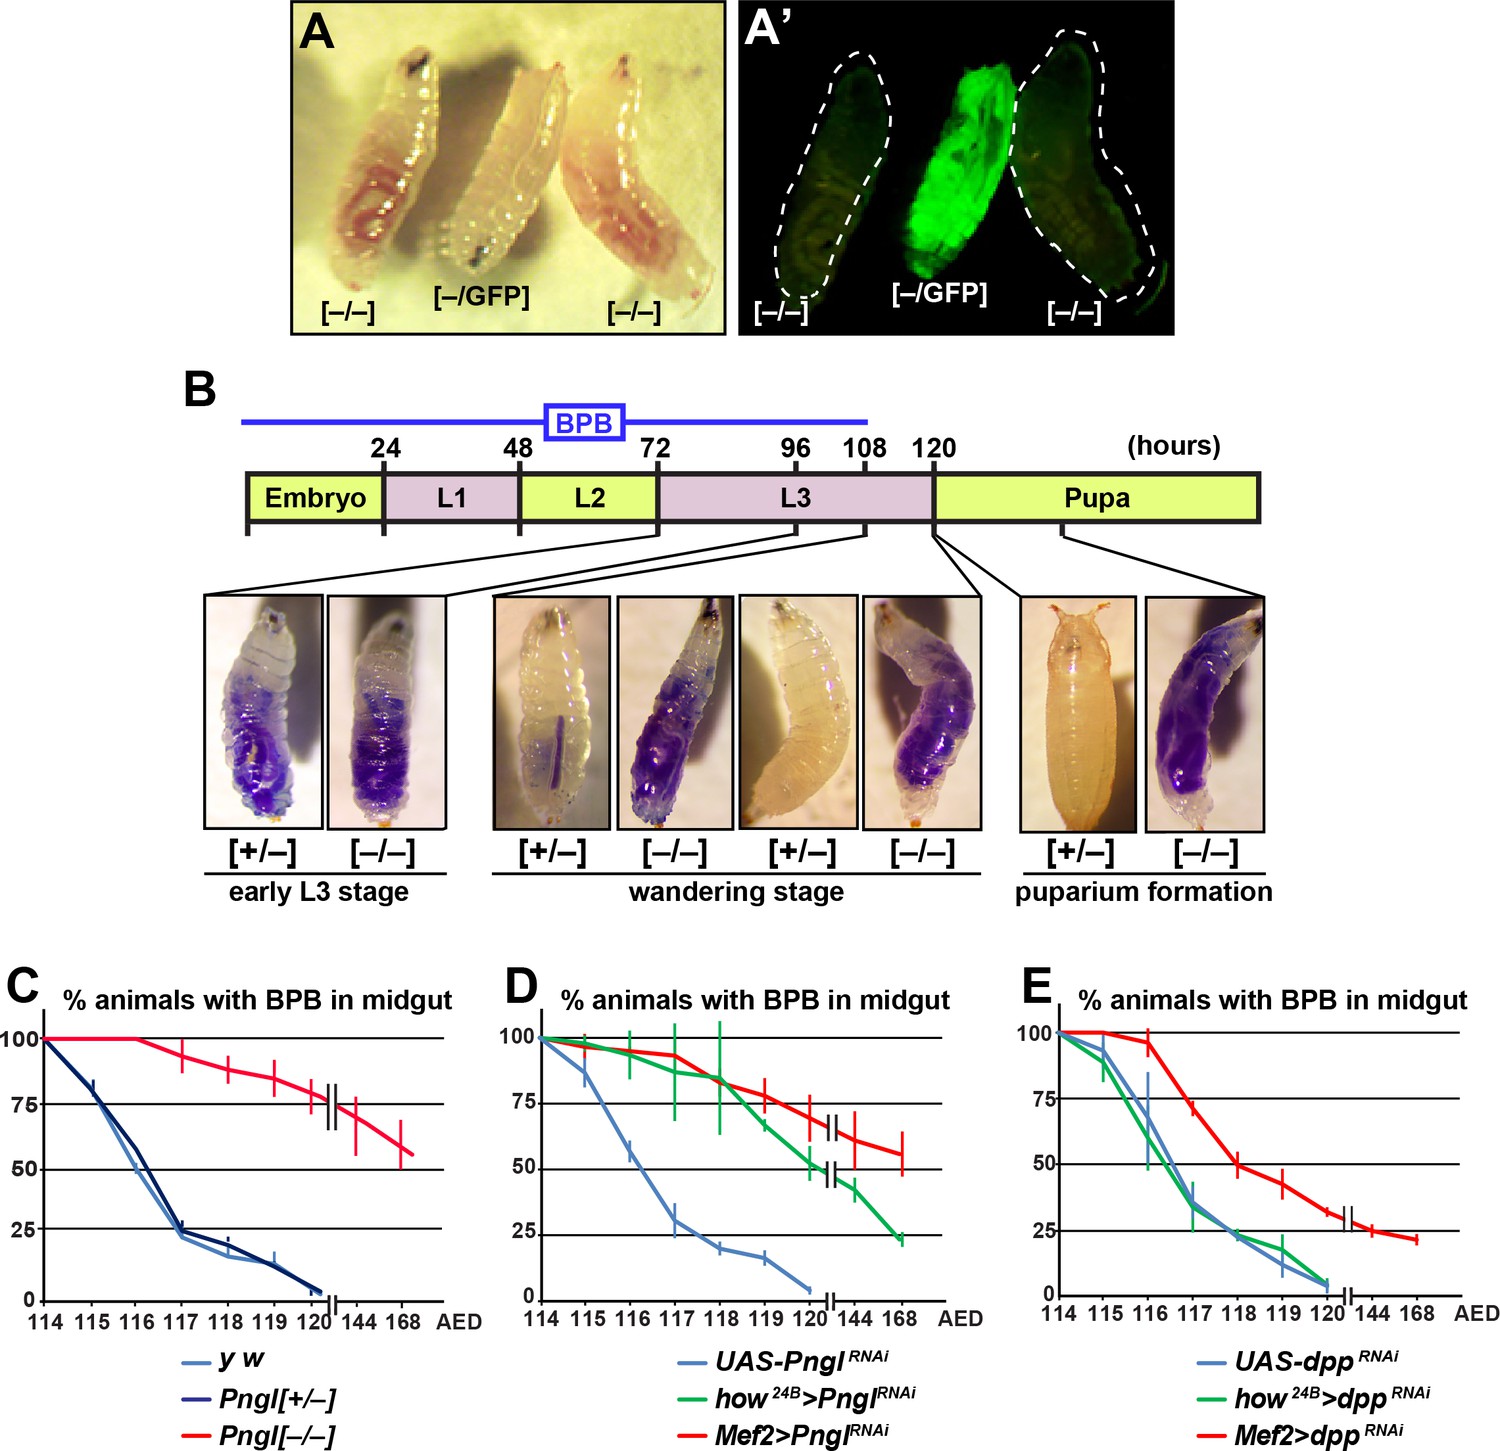
Loss of Pngl in the mesoderm causes food accumulation in larval midgut.
(A–A’) Wandering larvae of Pnglex14/+ with a GFP+ balancer chromosome for selection [–/GFP] and Pnglex14/ex14 GFP– larvae [–/–] showing food accumulation. (B) Gut clearance assay in larval stages using Bromophenol blue (BPB) as a marker. The top part shows the timeline of BPB feeding during development. At the bottom, representative images of Pnglex14/+ [+/–] and Pnglex14/ex14 larvae [–/–] at different times and stages are shown. (C–E) Quantification of midgut clearance assays in third instar larvae of the indicated genotypes.
Figure 5 with 2 supplements

Pngl is required for proper Dpp propagation and autoactivation in the embryonic VM.
(A–F) Projection views of Dpp staining for stage 13 (A–C) and stage 14 (D–F) embryos of the indicated genotypes are shown. Arrows and arrowheads mark PS3 and PS7, respectively. Scale bar in A is 100 µm. (G–N) Dpp staining in PS7. Limited projection views for stages 13 (G–I and M) and 14 (J–L and N) embryos of the indicated genotypes are shown. (O–P’) pMad staining of PS7 at stages 13 (O–O’) and 14 (P–P’). Green marks mesoderm (Mef2 >GFP). (Q) Schematic drawing of Dpp autoactivation in PS7 in stages 13 and 14. (R–U’) Limited projection views of PS7 for the indicated genotypes at embryonic stages 13 and 14. dpp-lacZ is marked in green (gray in R’-U’), red marks pMad.
Figure 5—figure supplement 1
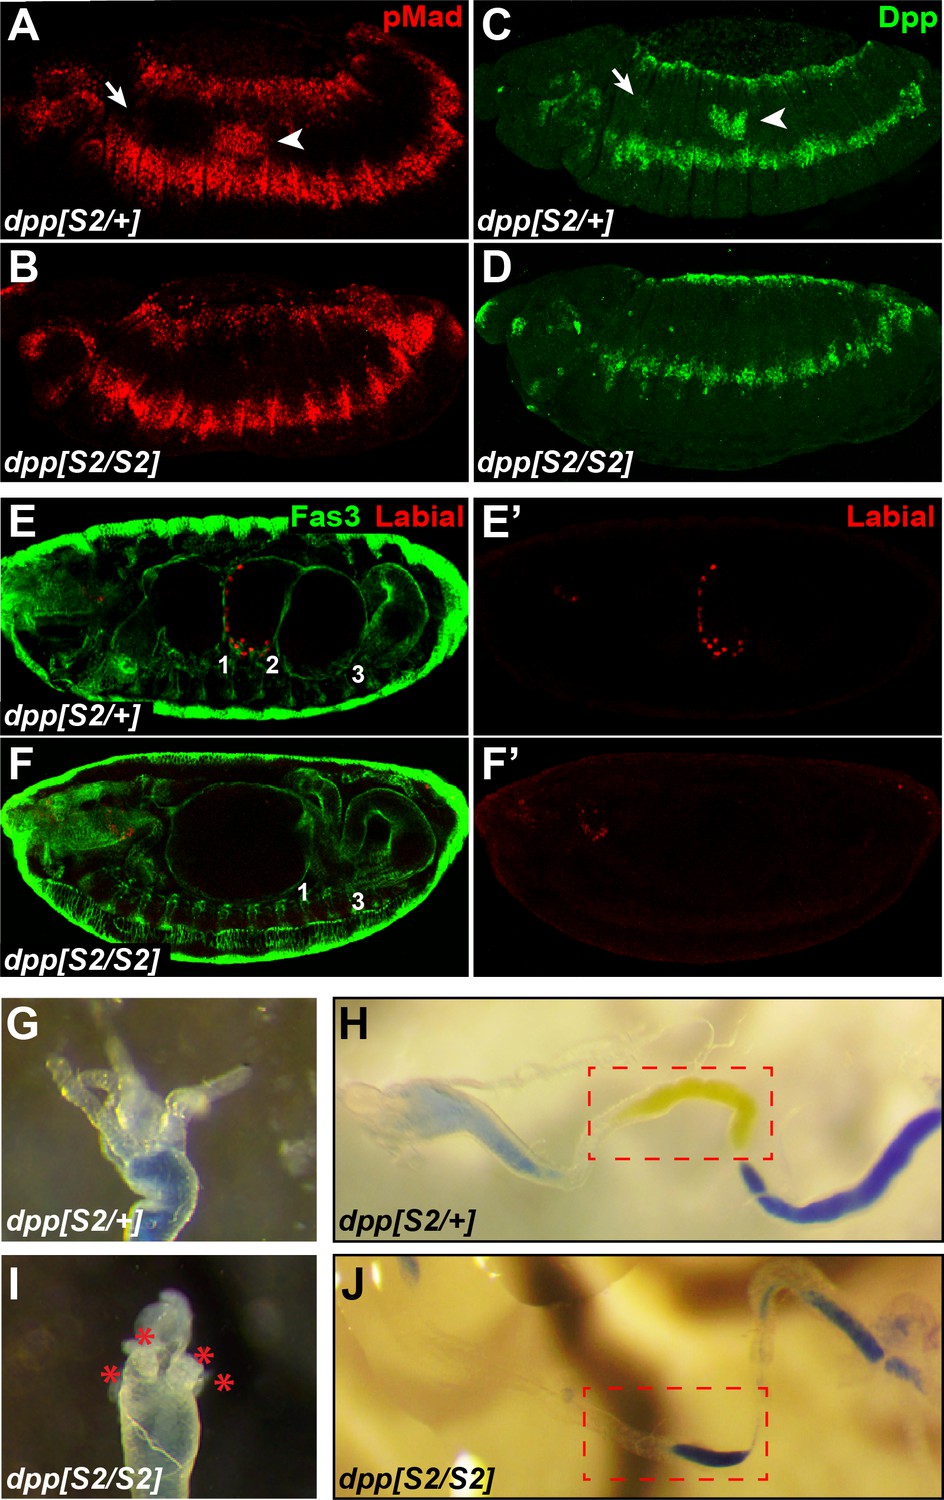
Removing one copy of dpp in the visceral mesoderm does not affect BMP signaling in PS7.
(A–D) Projection views of pMad staining (A–B) and Dpp staining (C–D) for stage 14 embryos of the indicated genotypes are shown. (E–F’) Fas3 (VM marker) and Labial staining of stage 16 for dpps2/+ and dpps2/s2 embryos. Midgut constrictions are marked by numbers along the anterior-posterior axis. (G–J) Proximal midgut region and acid zone of the indicated genotypes.
Figure 5—figure supplement 2
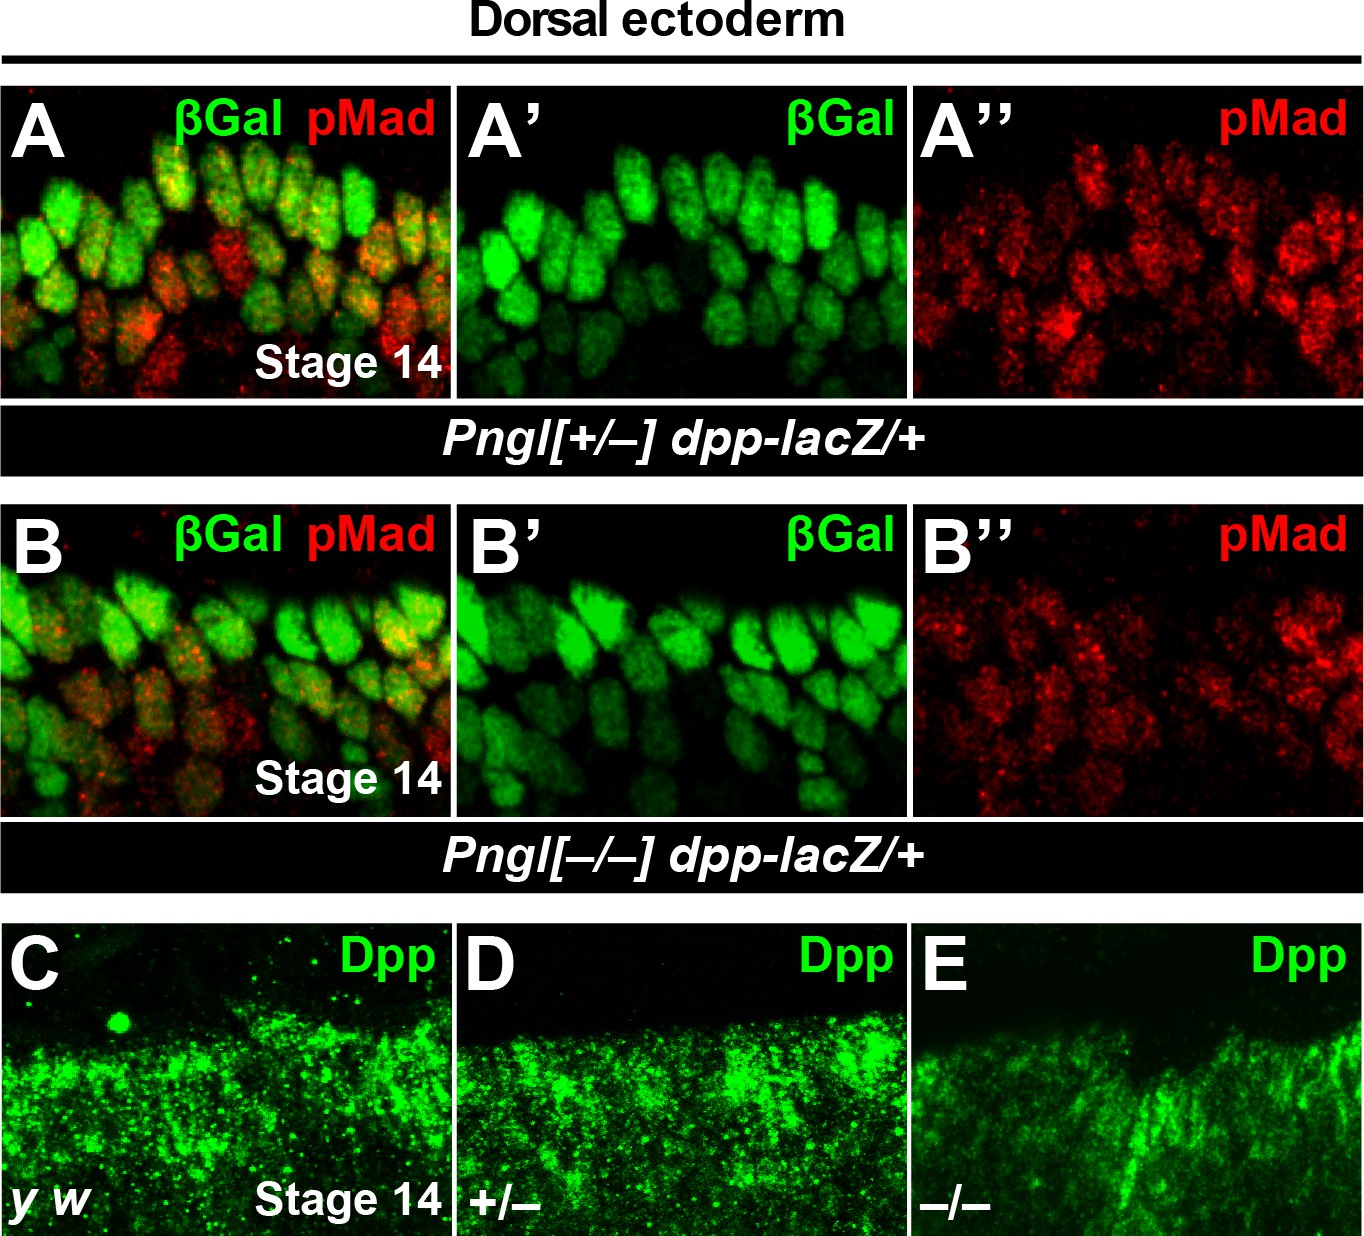
Dpp signaling in embryonic dorsal ectoderm is not impaired in Pngl mutants, but the Dpp-positive puncta are severely decreased.
(A–B’’) Limited projection views of dorsal ectoderm at stage 14. Green marks dpp-lacZ expressing cell, red pMad. (C–E) High magnification of Dpp staining in embryonic dorsal ectodermal band at stage 14. Limited projection views of the indicated genotypes are shown.
Figure 6 with 1 supplement
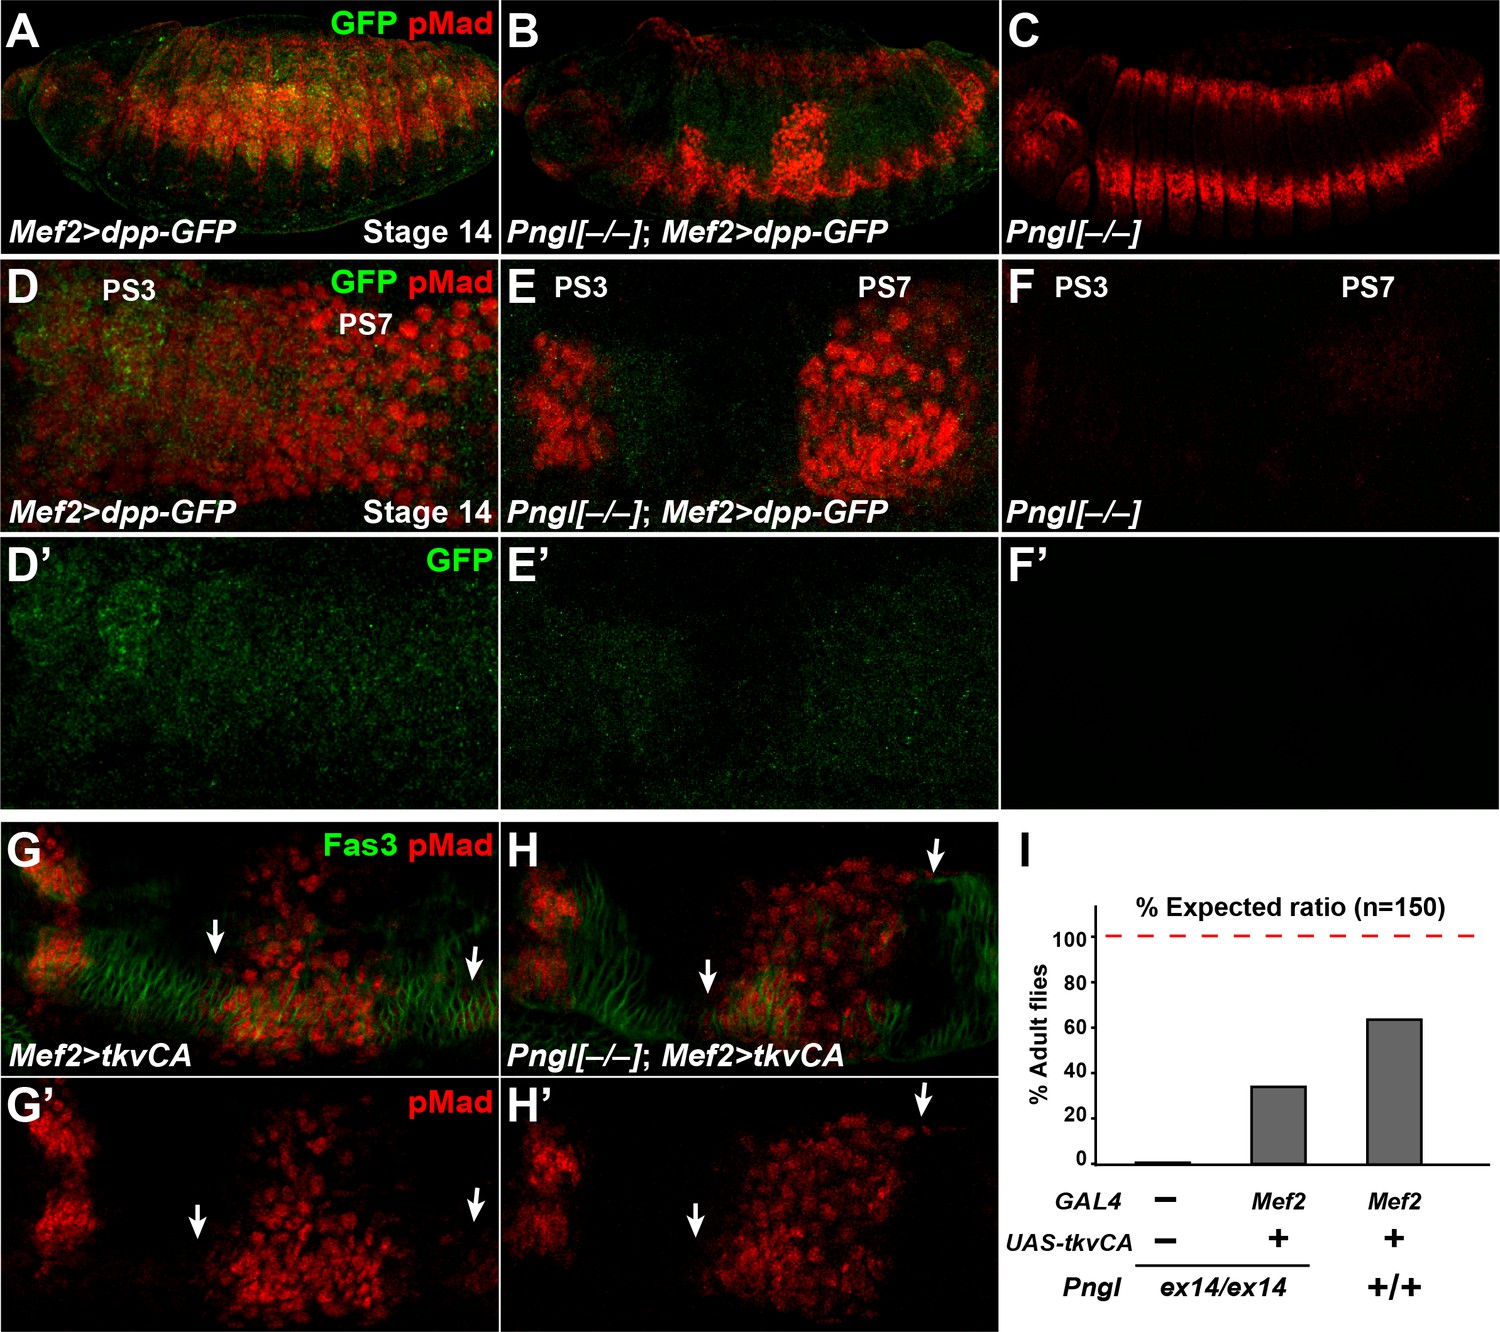
Dpp-GFP and TkvCA overexpression in mesoderm rescues Dpp signaling in Pngl–/– embryo.
(A–C) Projection views of stage 14 embryos of the indicated genotypes stained with anti-pMad (red) and anti-GFP (green) antibodies. (D–F’) Close-ups of embryonic PS3 and PS7 of indicated genotypes. Notably, in the Pngl–/– embryo, Mef2 >dpp GFP overexpression rescues pMad staining in PS3 and PS7 (E, compared to F). (G–H’) Close-ups of embryonic PS3 and PS7 of indicated genotypes. pMad is marked in red and Fas3 in green. Arrows mark pMad staining outside of PS7. (I) Eclosion tests of the indicated genotypes. The red dashed line marks the expected Mendelian ratio.
Figure 6—figure supplement 1

The acid zone impairment in adult midgut of Pngl mutant flies can be rescued by overexpressing tvkCA in the mesoderm.
(A–B) Bright field images of midguts from adult flies of the indicated genotypes fed with food containing bromophenol blue. The acid zone is delimitated by the red dotted boxes. The dashed circles indicate the crop.
Figure 7 with 3 supplements
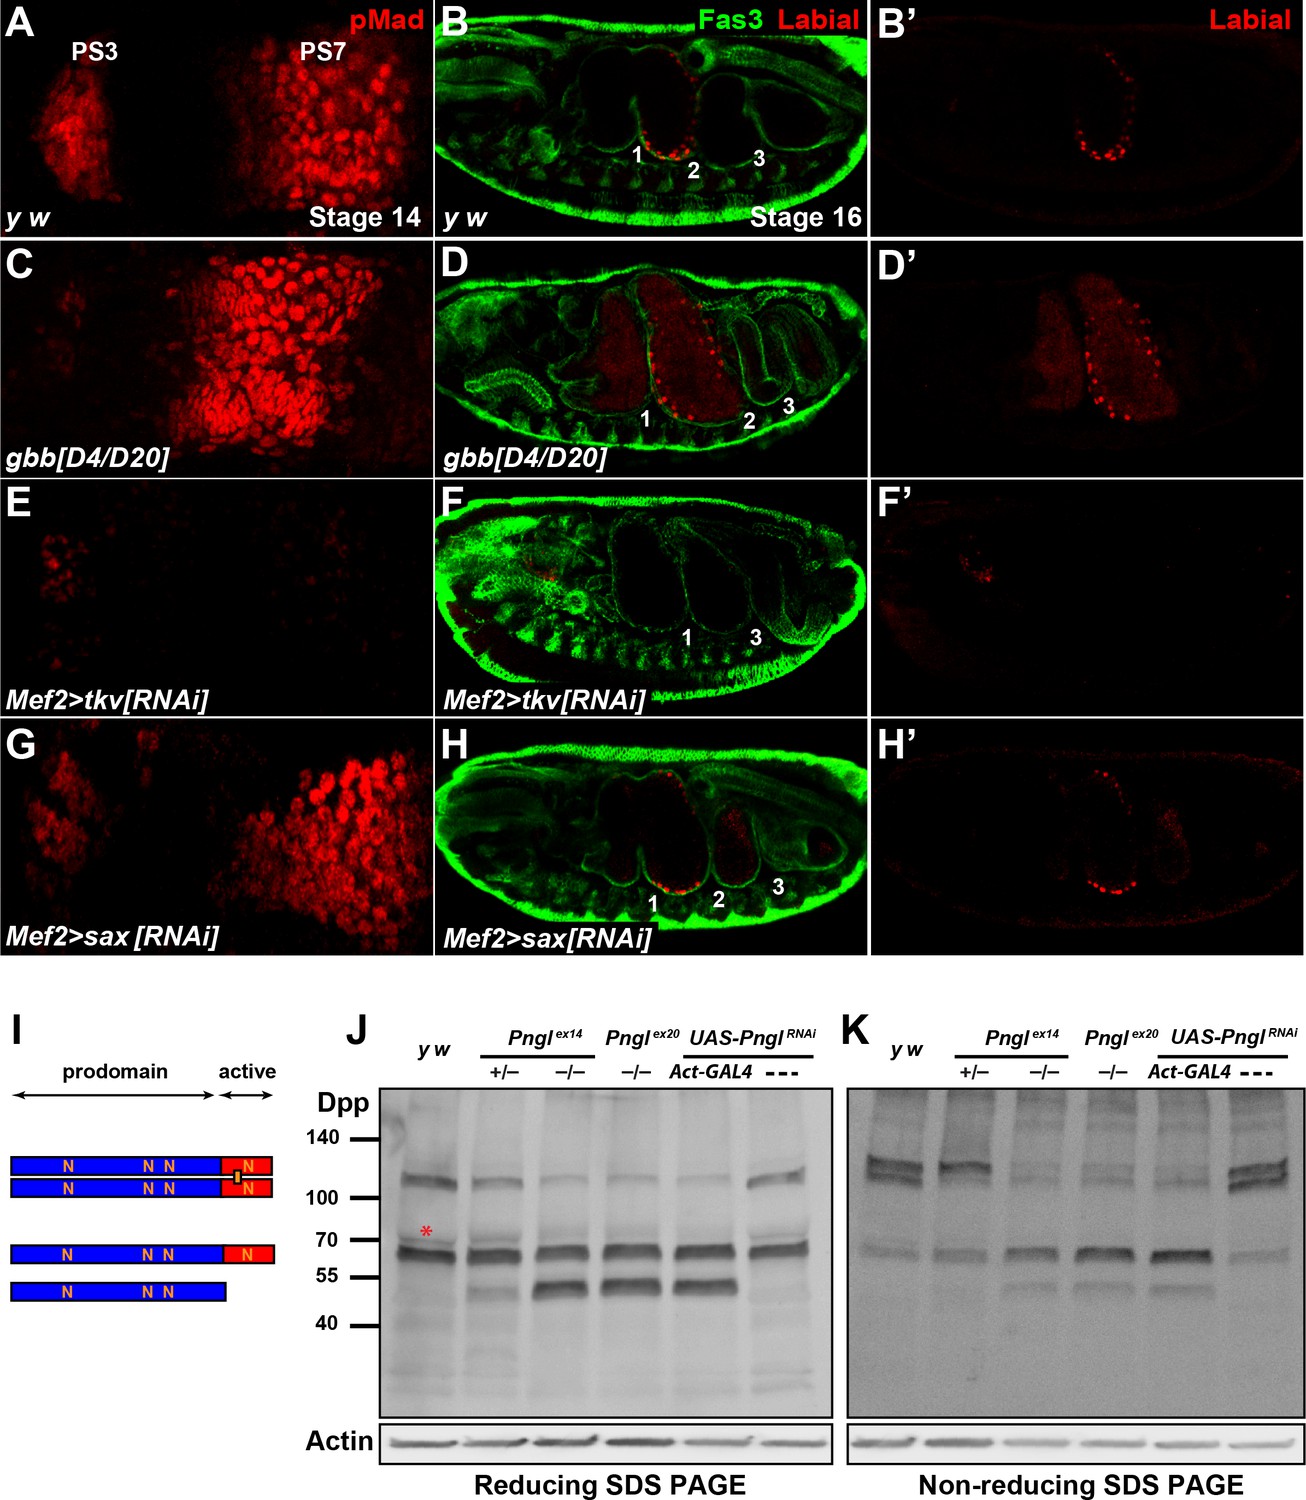
Pngl regulates Dpp homodimer level and signaling via Tkv receptor homodimers.
(A, C, E, G) Close-ups of embryonic PS3 and PS7 of indicated genotypes. pMad is marked in red. (B–B’, D–D’, F–F’ and H–H’) Fas3 (VM marker) and Labial staining of stage 16 embryos of indicated genotypes. Numbers indicate embryonic midgut constrictions. (I) Schematic representation of the Dpp protein dimer and its processing. (J, K) Reducing (J) and non-reducing (K) SDS gels were used to run larval extracts from the indicated genotypes and were probed with a polyclonal antibody against the Dpp prodomain.
Figure 7—figure supplement 1
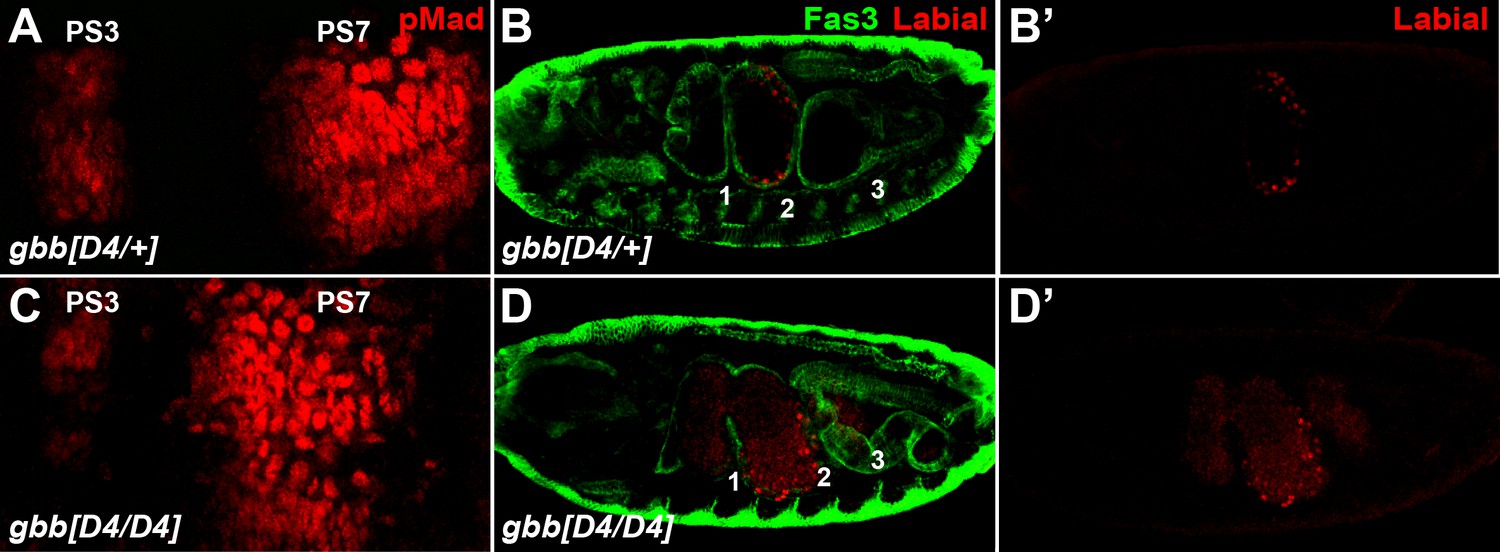
Loss of gbb affects BMP signaling in embryonic midgut differently from loss of dpp or Pngl.
(A and C) Close-ups of embryonic PS3-PS7 region of indicated genotypes. pMad is marked in red. (B, B’, D, D’) Fas3 (VM marker) and Labial staining of stage 16 embryos of the indicated genotypes. Embryonic constrictions are marked by numbers across anterior-posterior axis.
Figure 7—figure supplement 2
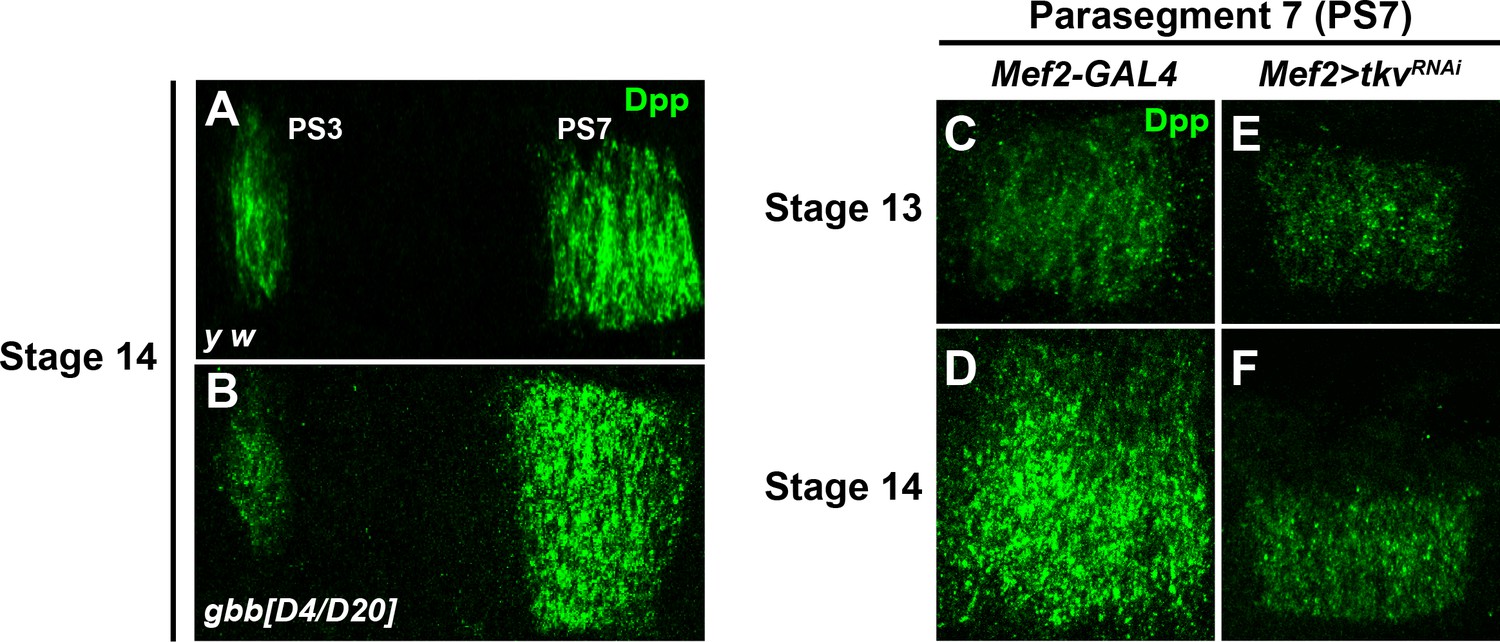
Altered Dpp expression in gbb–/– and tkv mesodermal KD embryos.
(A and B) Close-ups of embryonic PS3-PS7 region of indicated genotypes. Dpp is marked in green. (C–F) High magnification of Dpp staining in PS7 at stage 13 (C and E) and stage 14 (D and F) of Mef2-GAL4, used as control, and Mef2 > tkvRNAi.
Figure 7—figure supplement 3
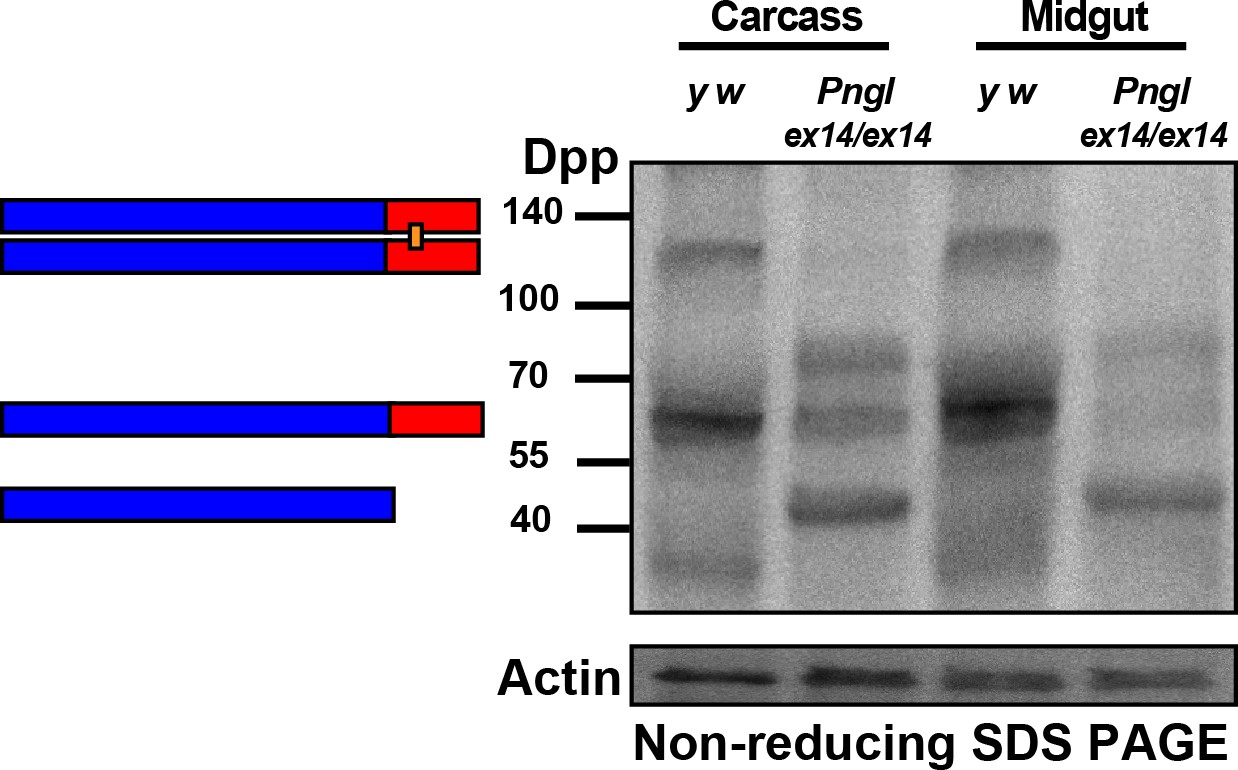
Dpp dimer levels are not exclusively altered in Pngl larval midgut.
Non-reducing SDS gels were used to run carcass (without midgut) and midgut extracts from the indicated genotypes and were probed with a polyclonal antibody against the Dpp prodomain.
Author response image 1
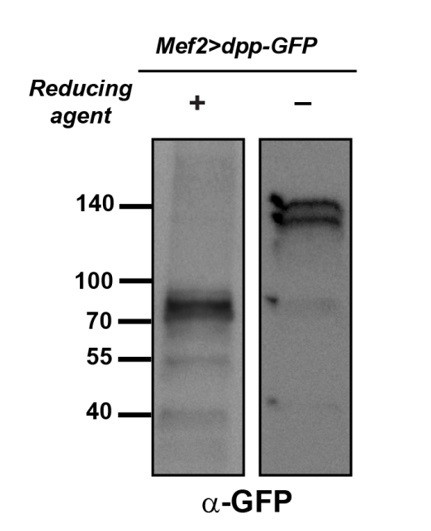
Dpp-GFP shows dimerization and processing patterns similar to Dpp.
Larval extracts from Mef2>dpp-GFPwere run under reducing (left lane) and non-reducing (right lane) conditions and probed with an anti-GFP antibody.
Additional files
-
Transparent reporting form
- https://doi.org/10.7554/eLife.27612.019
Download links
A two-part list of links to download the article, or parts of the article, in various formats.
Downloads (link to download the article as PDF)
Open citations (links to open the citations from this article in various online reference manager services)
Cite this article (links to download the citations from this article in formats compatible with various reference manager tools)
Tissue-specific regulation of BMP signaling by Drosophila N-glycanase 1
eLife 6:e27612.
https://doi.org/10.7554/eLife.27612


