The intractable challenge of evaluating cattle vaccination as a control for bovine Tuberculosis
- University of Cambridge, United Kingdom
- Animal and Plant Health Agency, United Kingdom
- Wageningen University, Netherlands
Figures
Figure 1
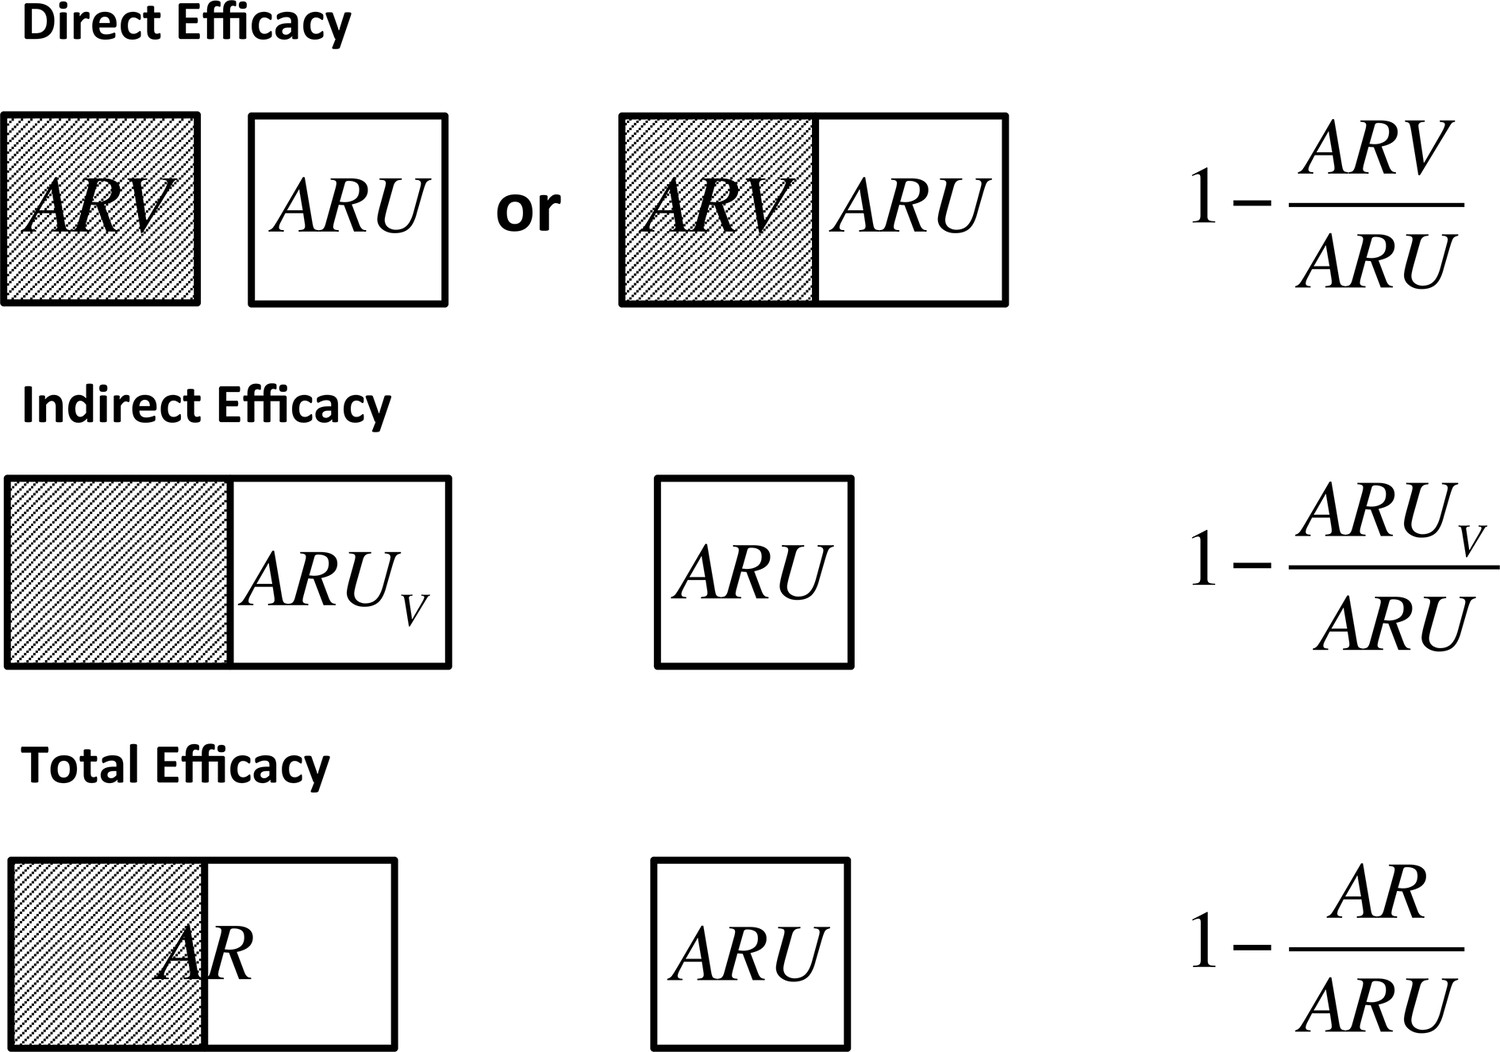
Definitions of direct, indirect and total efficacy measures.
Direct efficacy can be estimated through comparison of the attack rate in vaccinated animals () and unvaccinated animals () that may be held in the same herd to control for the background infectious pressure or through comparison of fully vaccinated and unvaccinated herds. Indirect efficacy compares the attack rate in unvaccinated animals () in a partially vaccinated herd to that in unvaccinated control herds (). Total efficacy compares the attack rate of all animals in a partially vaccinated herd () and unvaccinated control herds ().
Figure 2 with 3 supplements
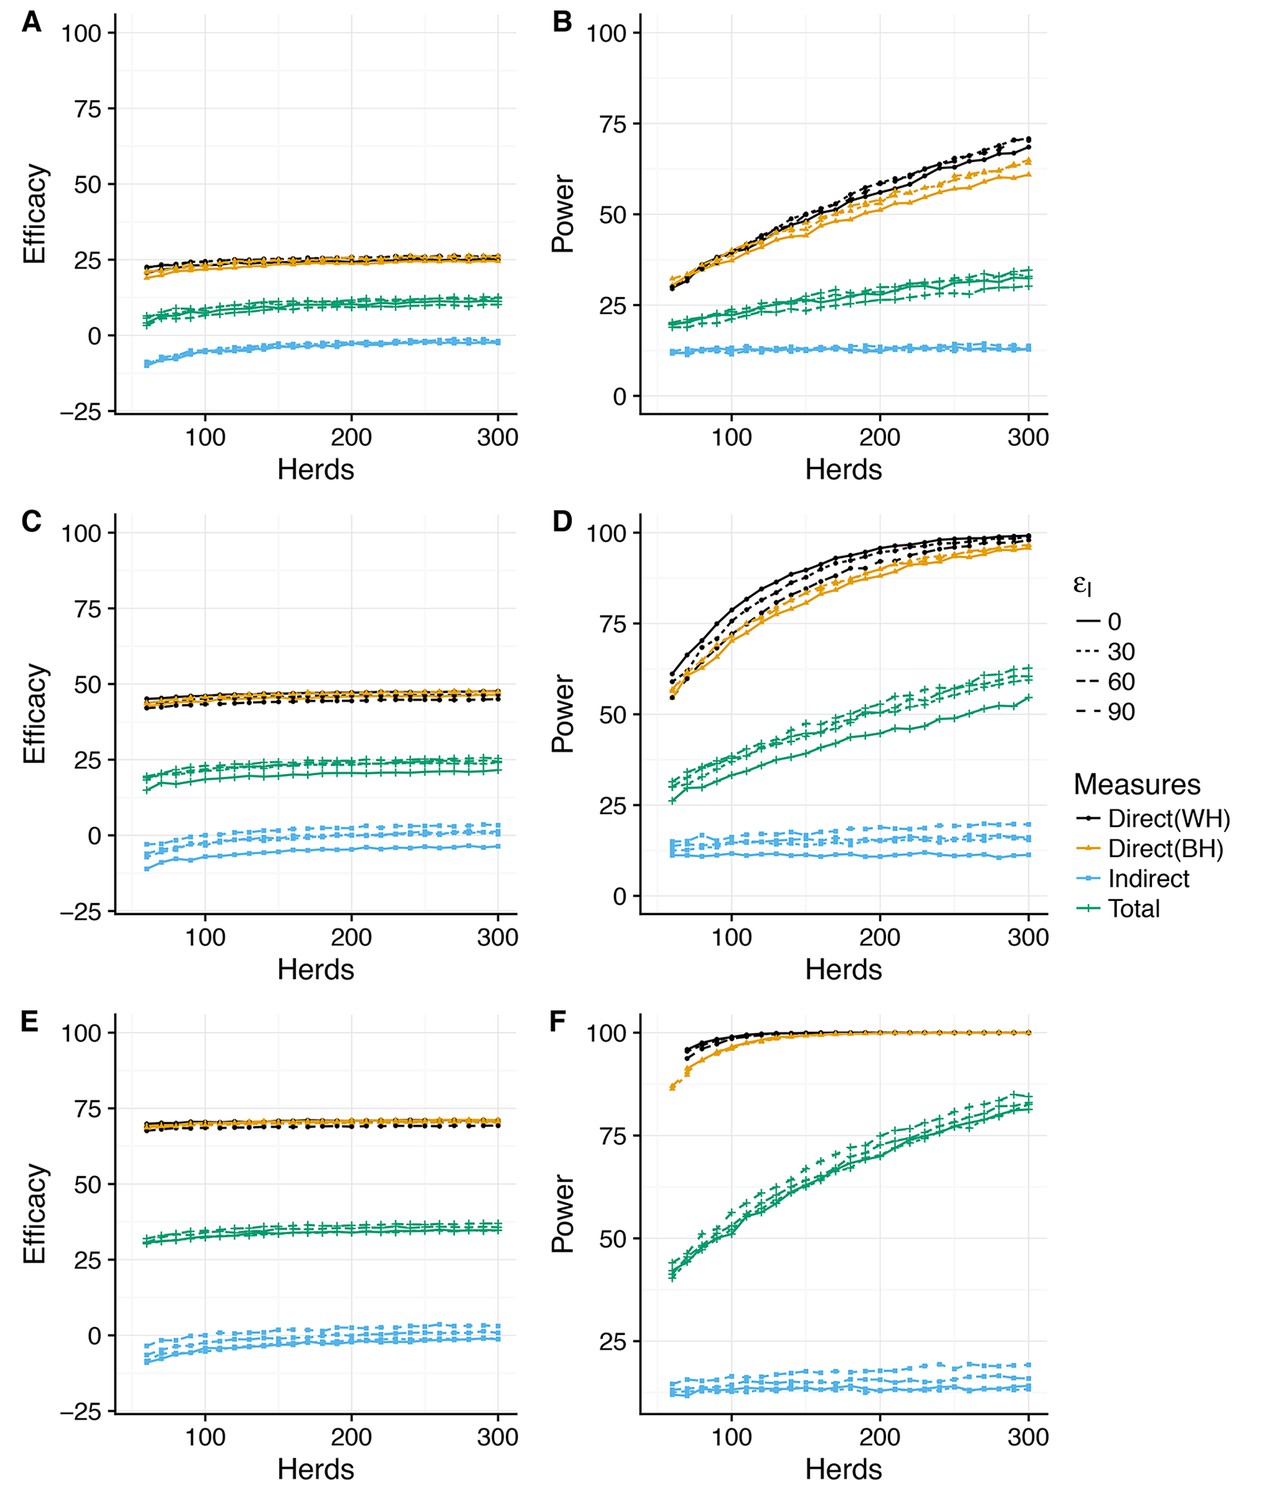
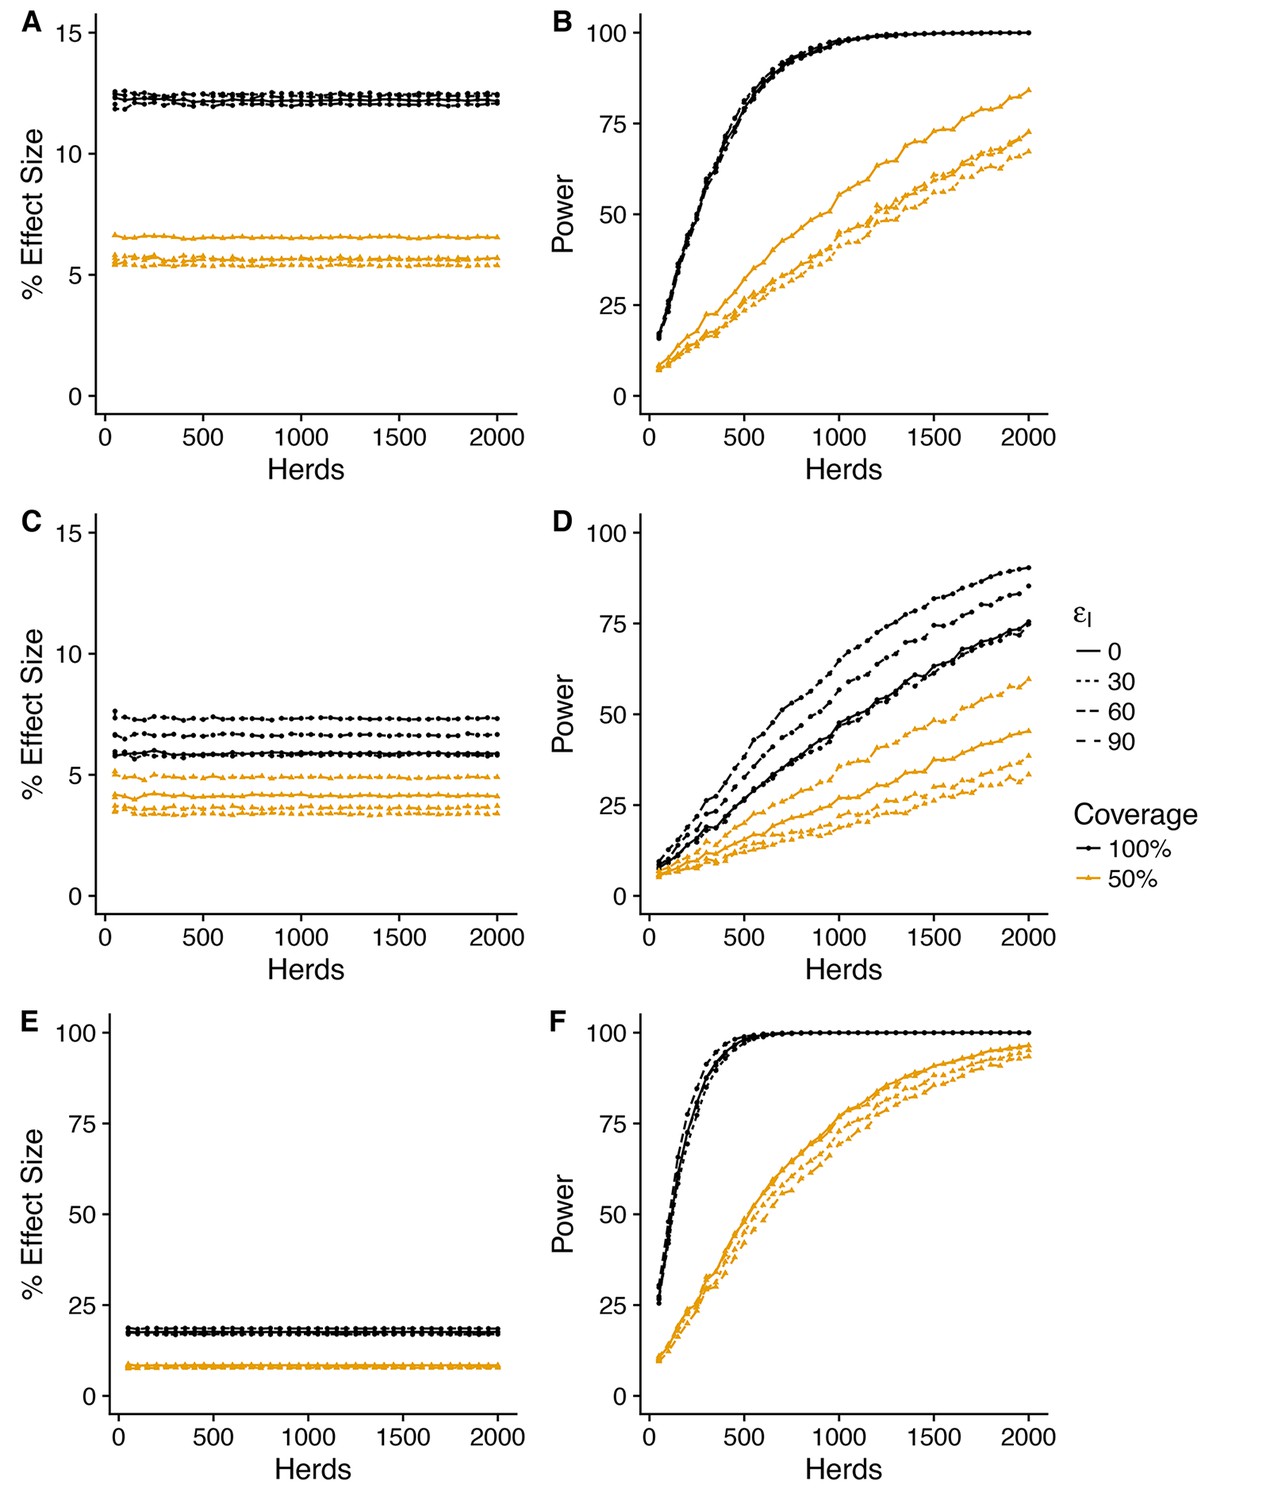
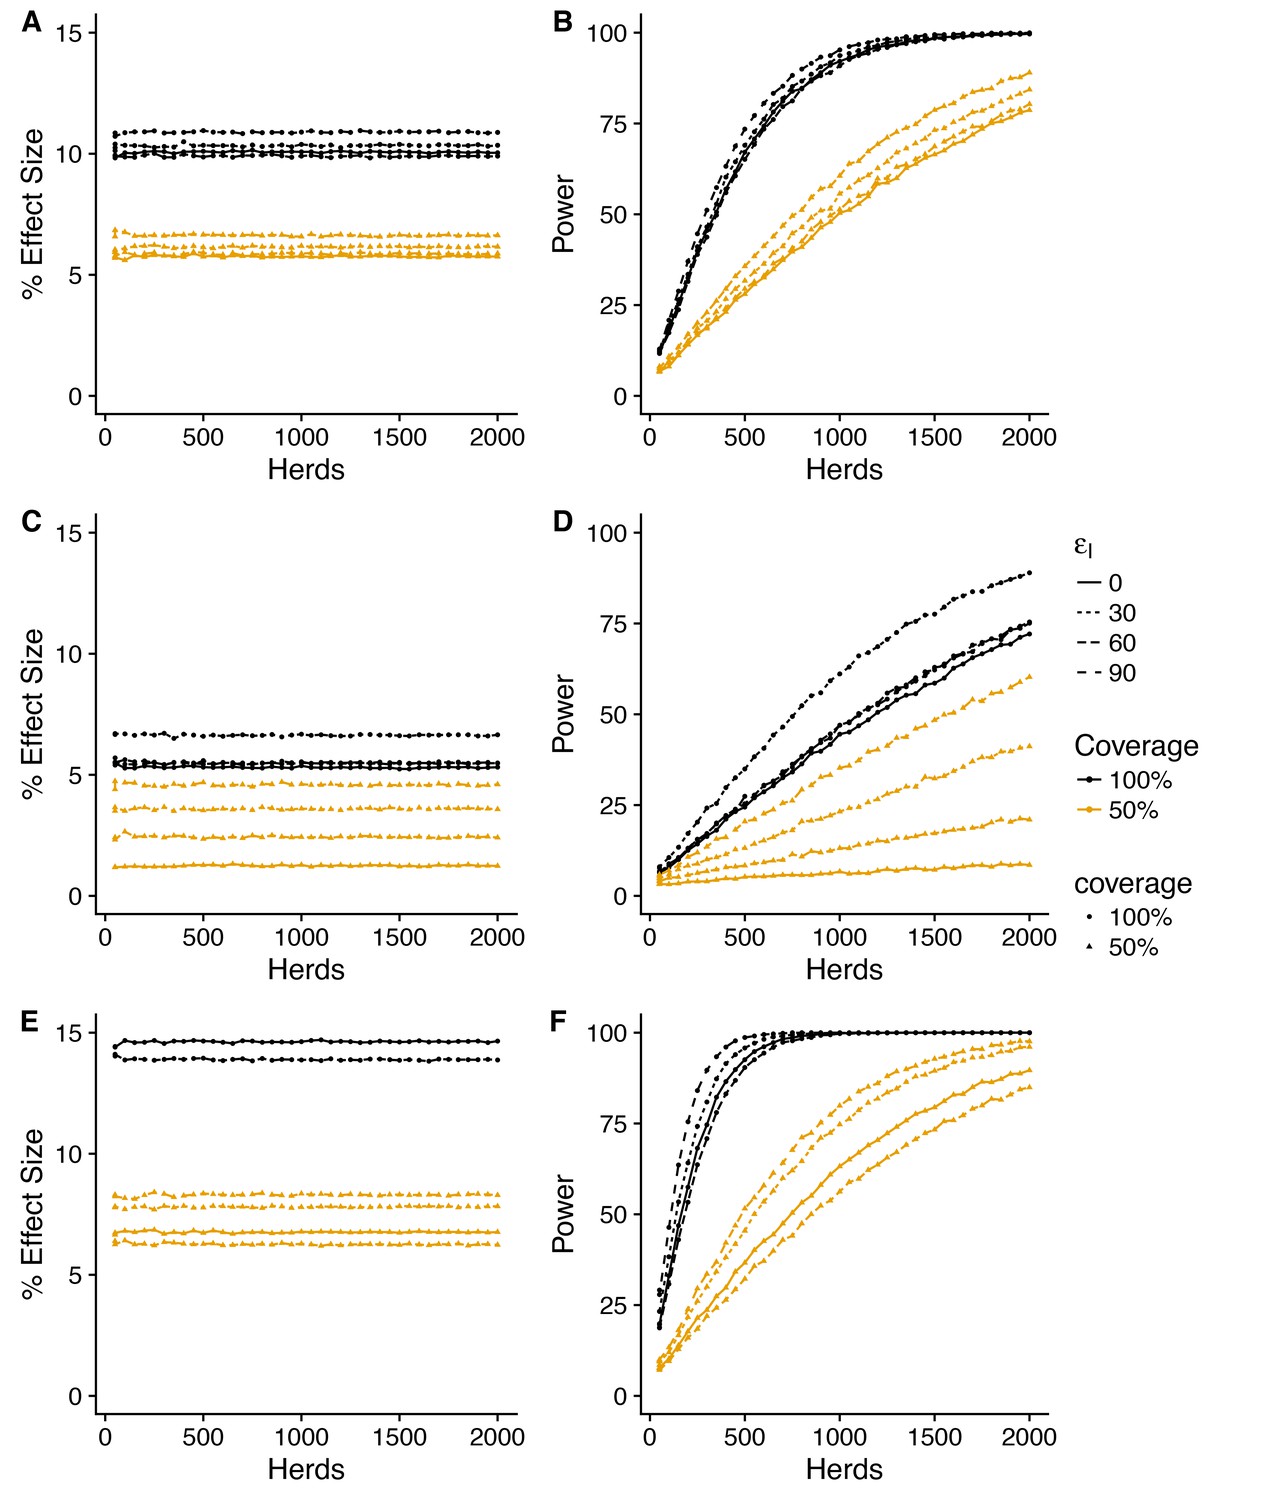
Power to estimate Direct, Indirect and Total efficacy from a two-level design (SORI model).
Expected values of the Direct, Indirect and Total vaccine efficacies measured from a two-level design with trial duration of 3 years and with 75% of herds vaccinated at 50% and 25% of herds as unvaccinated whole-herd controls. We explore a range of assumed vaccine-induced reductions in susceptibility (A,B) , (C,D) , (E,F) ) and infectiousness (Linetype, ). The expected effect sizes (A,C,E) are illustrated by the median of the posterior predictive distribution for each measure. Power (B,D,F) is calculated using a classical hypothesis test on the relative risk of infection (RR) in vaccinated compared to unvaccinated animals (described fully in Materials and methods section). Note that in this design Direct Efficacy can be estimated relative to either within-herd (WH) or between-herd (BH) control animals. 100 herds provides power to estimate a protective direct efficacy for a true efficacy of 60%; however, herds are required to achieve an 80% power to estimate a true efficacy of 30%. The indirect efficacy is predicted to be close to zero as the extrinsic force of infection acting on herds overwhelms the indirect protection provided by immunity within the herd. There is a ~50% probability of estimating a negative indirect efficacy of vaccination across the number of herds explored. As a consequence of the minimal indirect protection offered by vaccination, the Total Efficacy of vaccination with herds with 50% coverage is approximately half that of the direct efficacy. The model predicts that a 90% power of estimating a positive Total Efficacy would require herds for a true direct efficacy of 60%.
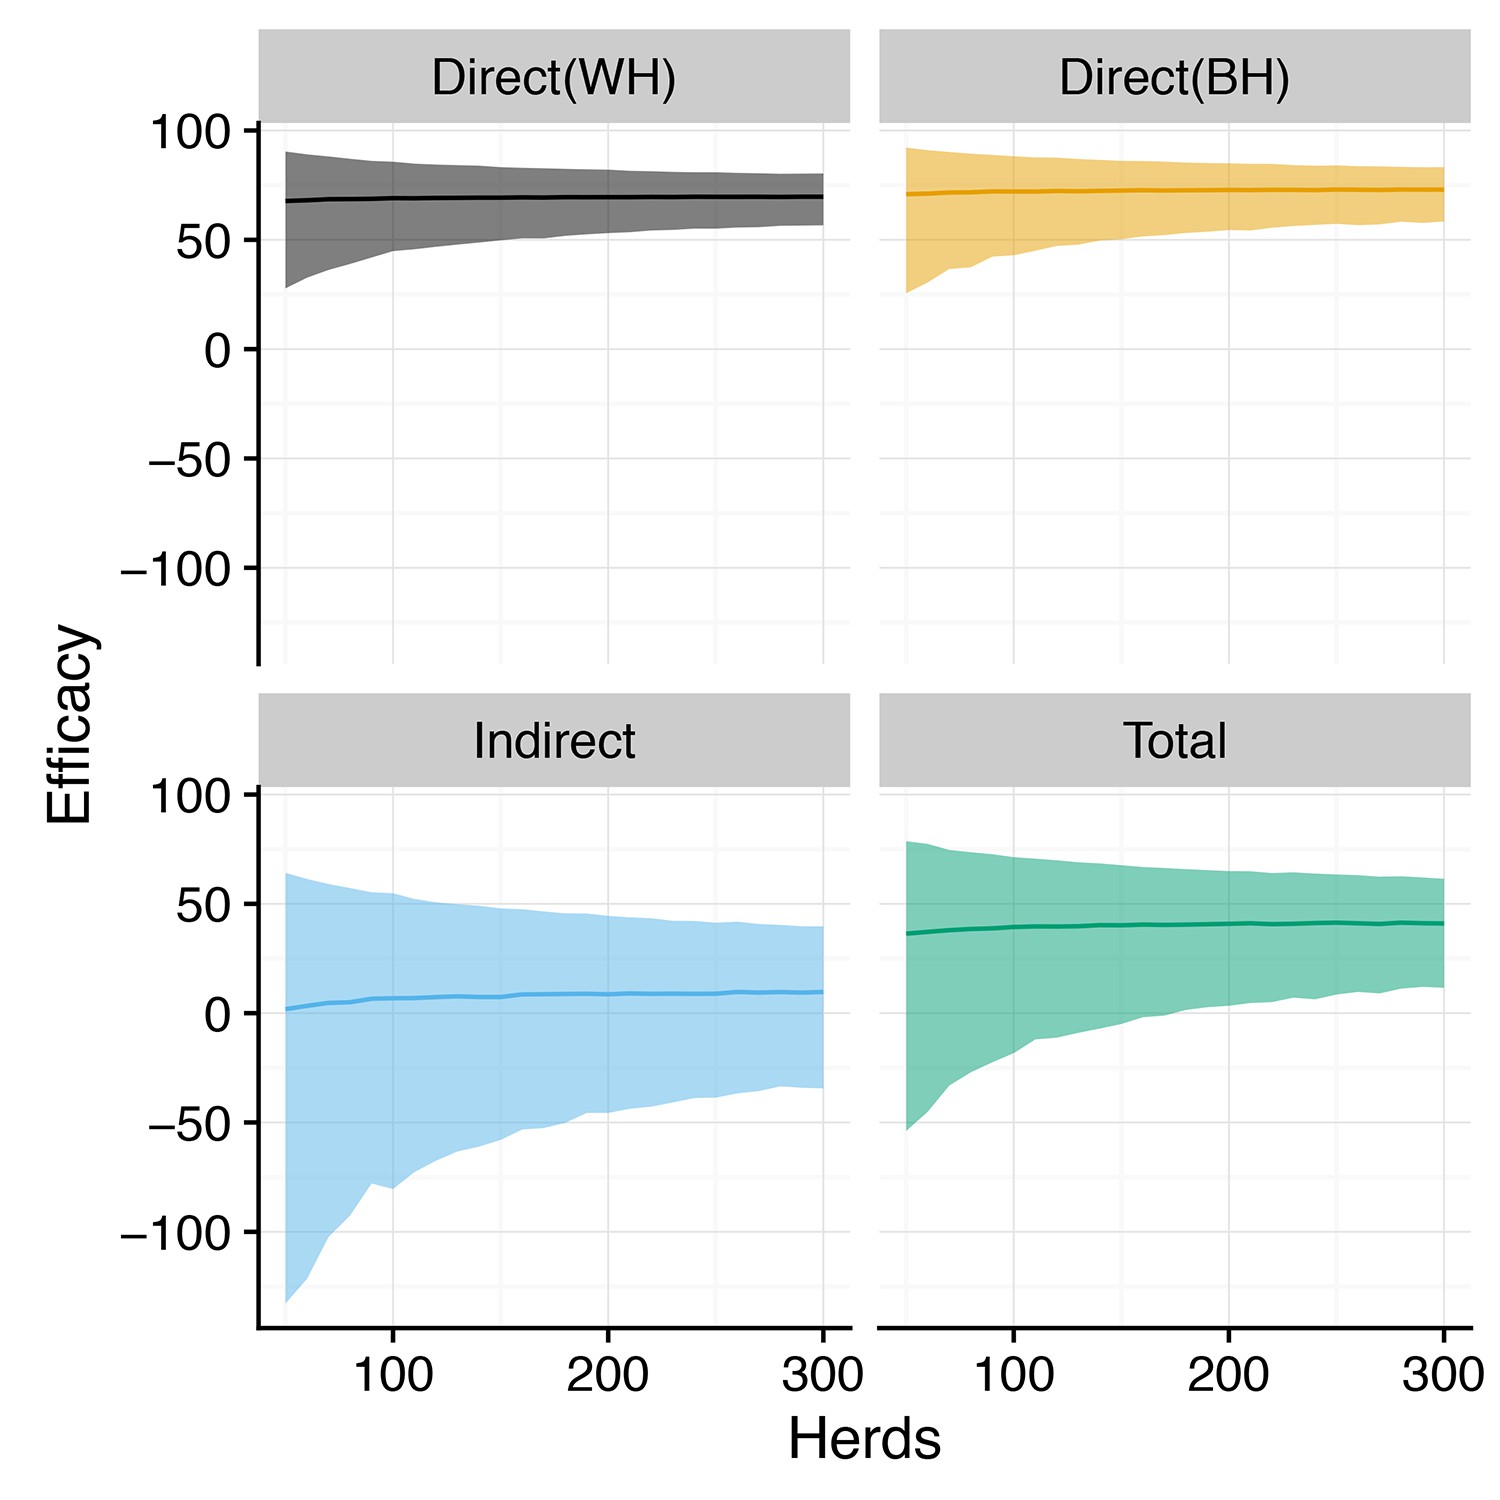
Figure 2—figure supplement 1

Posterior predictive distributions for Direct, Indirect and Total efficacy from two-level design (SORI model).
Posterior predictive distributions for the direct, indirect and total vaccine efficacy (effect size) as estimated by relative risk ratios plotted against the number of trial herds for a 3-year trial duration. Direct efficacy is estimated in two ways using within-herd (WH) and between-herd (BH) controls. Median effect size is plotted as a solid line, with shaded region illustrating 95% credible intervals. Plotted distributions are for the most optimistic scenario of an assumed reduction in susceptibility and infectiousness of . While the 95% credible interval for the effect size remains comfortably above zero for both measures of direct efficacy, there is a substantial risk of estimating a erroneous negative indirect and total efficacy of vaccination even for this most optimistic scenario.
Figure 2—figure supplement 2
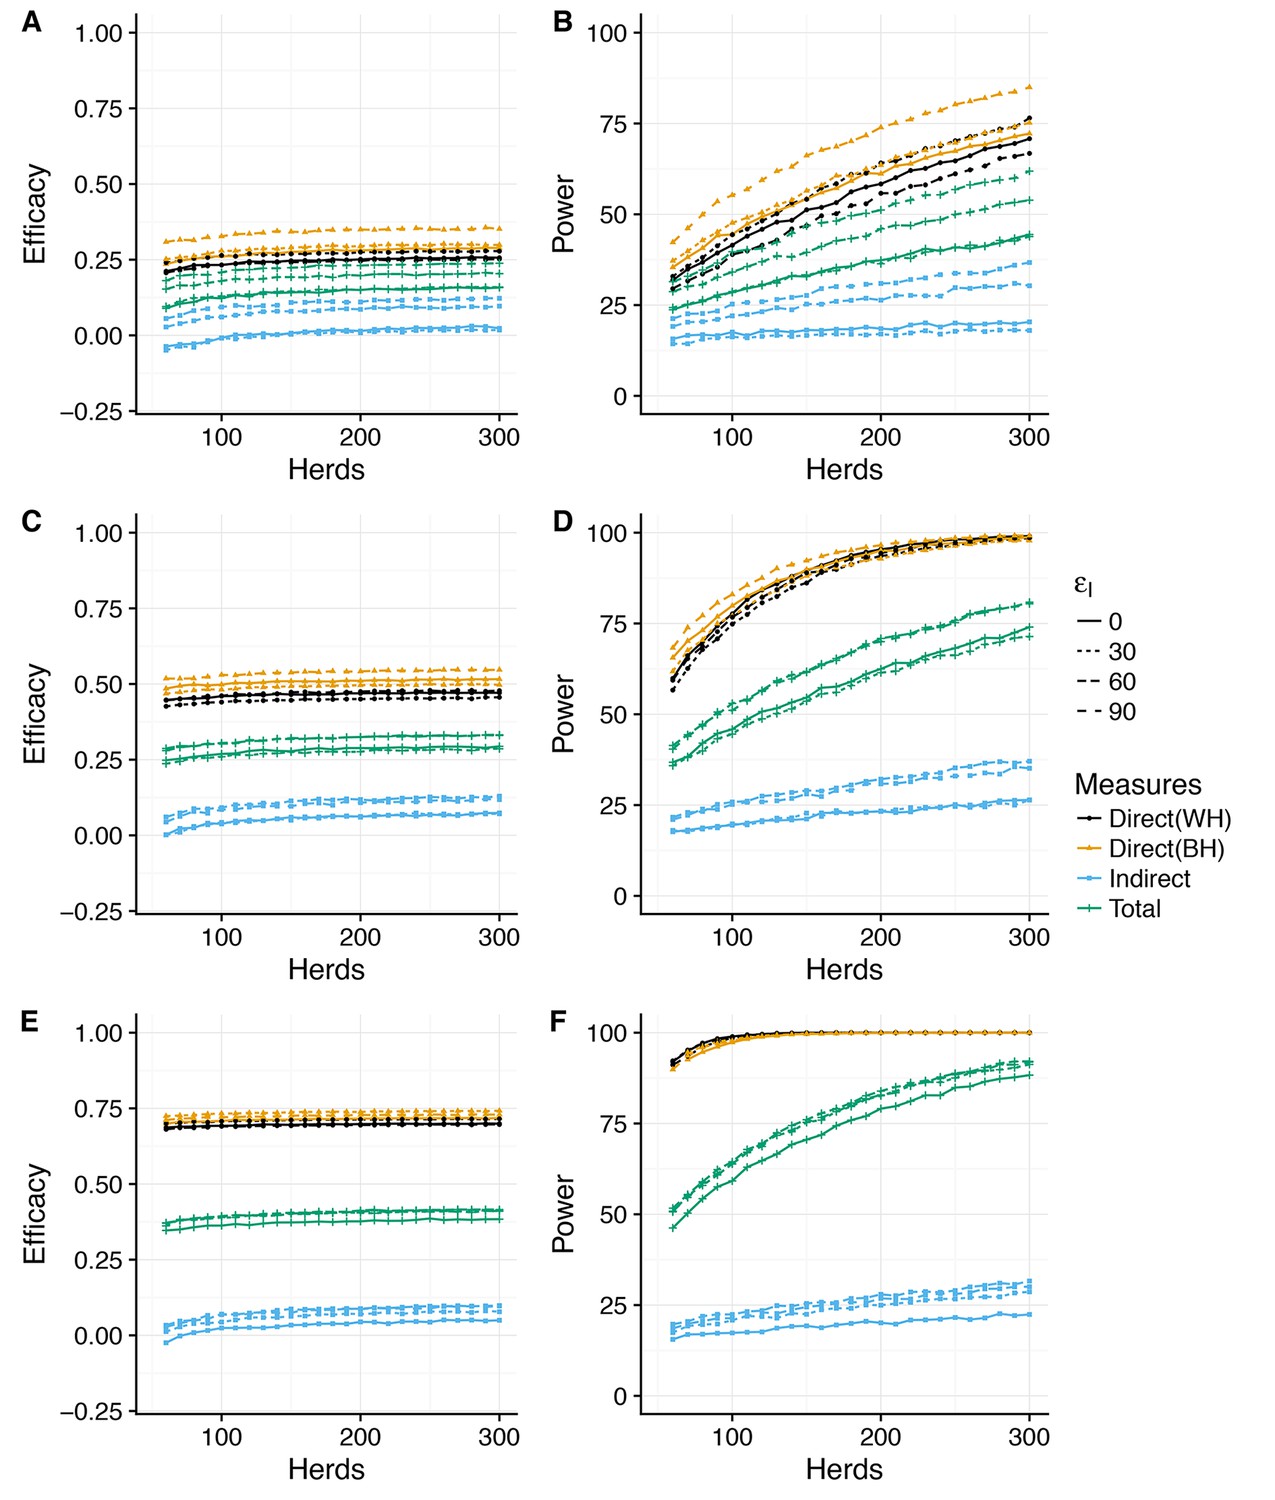
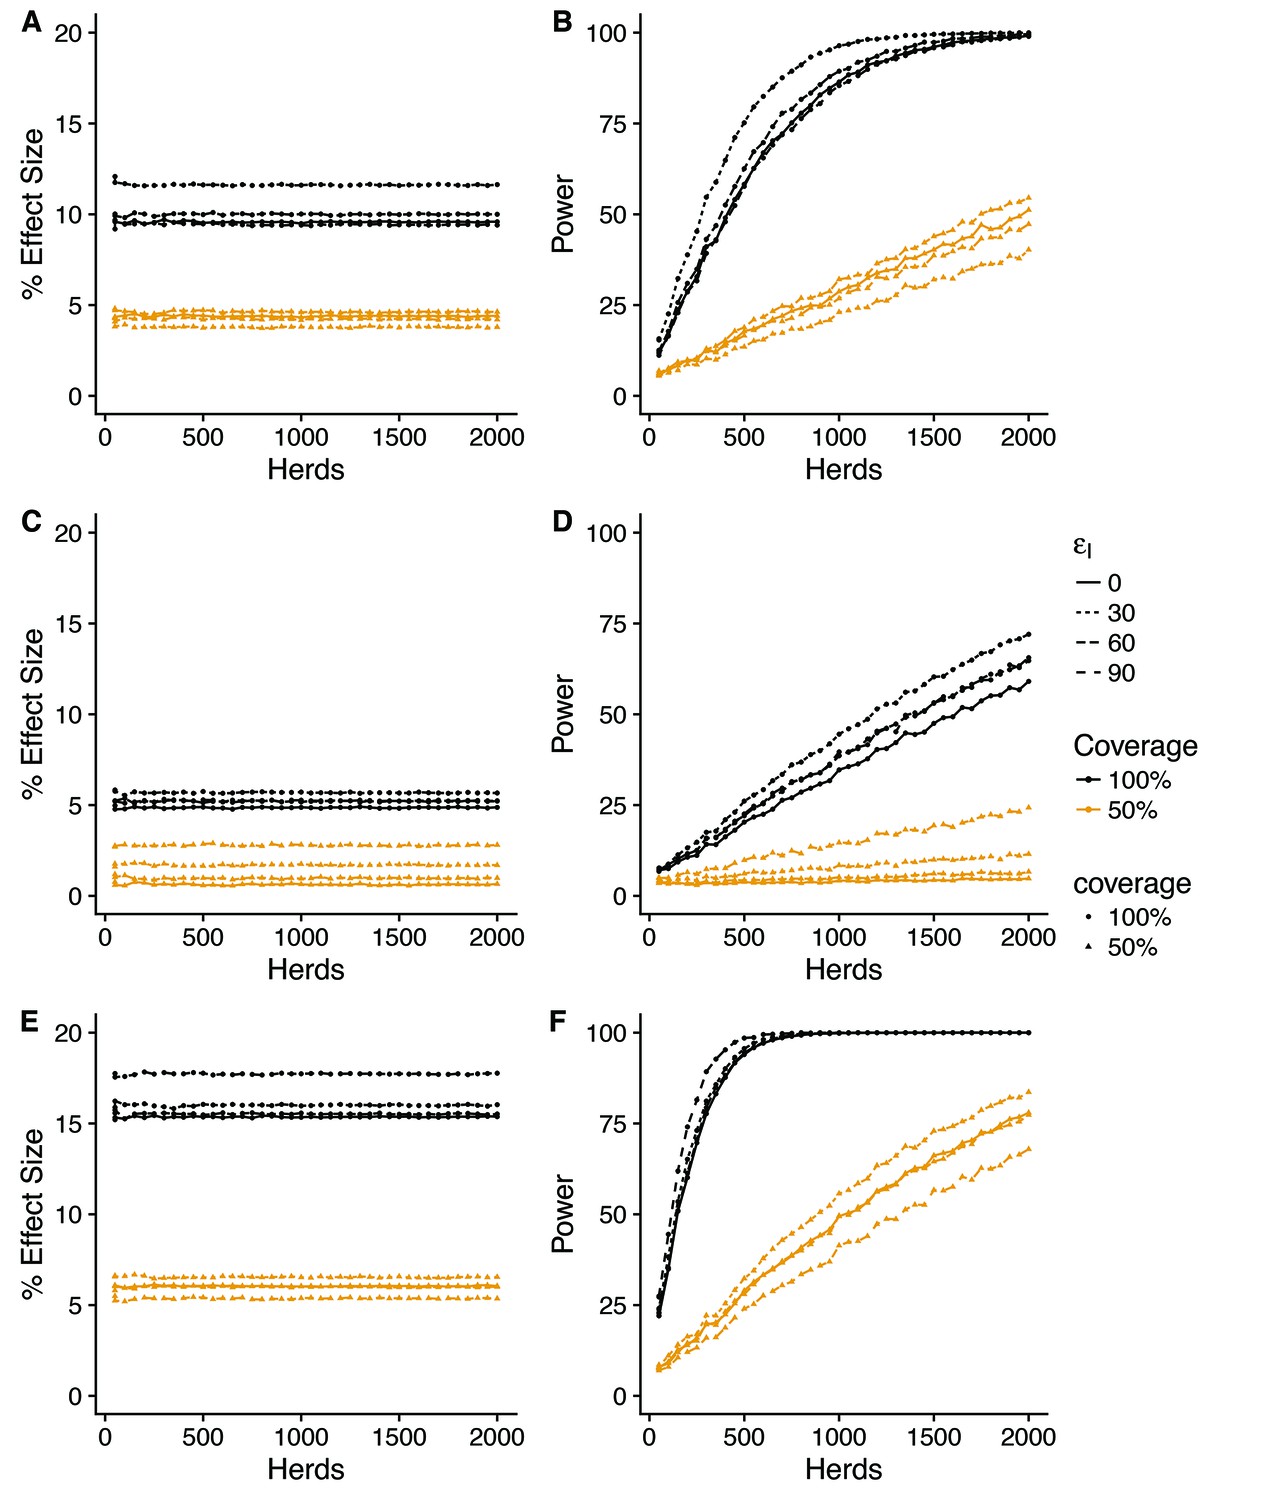
Power to estimate Direct, Indirect and Total efficacy from two-level design (SOR model).
Expected values of the Direct, Indirect and Total efficacies of vaccination using a two-level design with 50% of herds vaccinated at 25% and of herds as unvaccinated whole-herd controls. We explore a range of assumed vaccine-induced reductions in susceptibility (A,B) , (C,D) , (E,F) ) and infectiousness (Linetype, 0, 30, 60, 90%). The expected effect sizes (A,C,E) are illustrated by the median of the posterior predictive distribution for each measure. Power (B,D,F) is calculated using a classical hypothesis test on the relative risk of infection (RR) in vaccinated compared to unvaccinated animals (described fully in Materials and methods section). Note that in this design, Direct Efficacy can be estimated relative to either within-herd (WH) or between-herd (BH) control animals. 100 herds provides power to estimate a protective direct efficacy for a true efficacy of 60%, however herds are required to achieve an 80% power to estimate a true efficacy of 30%. For the SOR model, the indirect efficacy is predicted to be ~10% as a consequence of the greater instantaneous number of infectious animals within herds as compared to the SORI model. This predicted effect size is still small and as such there is still only a 70% power of estimating a positive indirect efficacy for a study size of 300 herds. Power to estimate the Total Efficacy is likewise increased with a chance of estimating a positive Total Efficacy from 300 herds.
Figure 2—figure supplement 3
Posterior predictive distributions for Direct, Indirect and Total efficacy from two-level design (SOR model).
Posterior predictive distributions for the direct, indirect and total vaccine efficacy (effect size) as estimated by relative risk ratios plotted against the number of trial herds for a 3-year trial duration. Direct efficacy is estimated in two ways using within-herd (WH) and between-herd (BH) controls. Median effect size is plotted as a solid line, with shaded region illustrating 95% credible intervals. Plotted distributions are for the most optimistic scenario of an assumed reduction in susceptibility and infectiousness of . While the 95% credible interval for the effect size remains comfortably above zero for both measures of direct efficacy, there is a substantial risk of estimating a erroneous negative indirect and total efficacy of vaccination even for this most optimistic scenario.
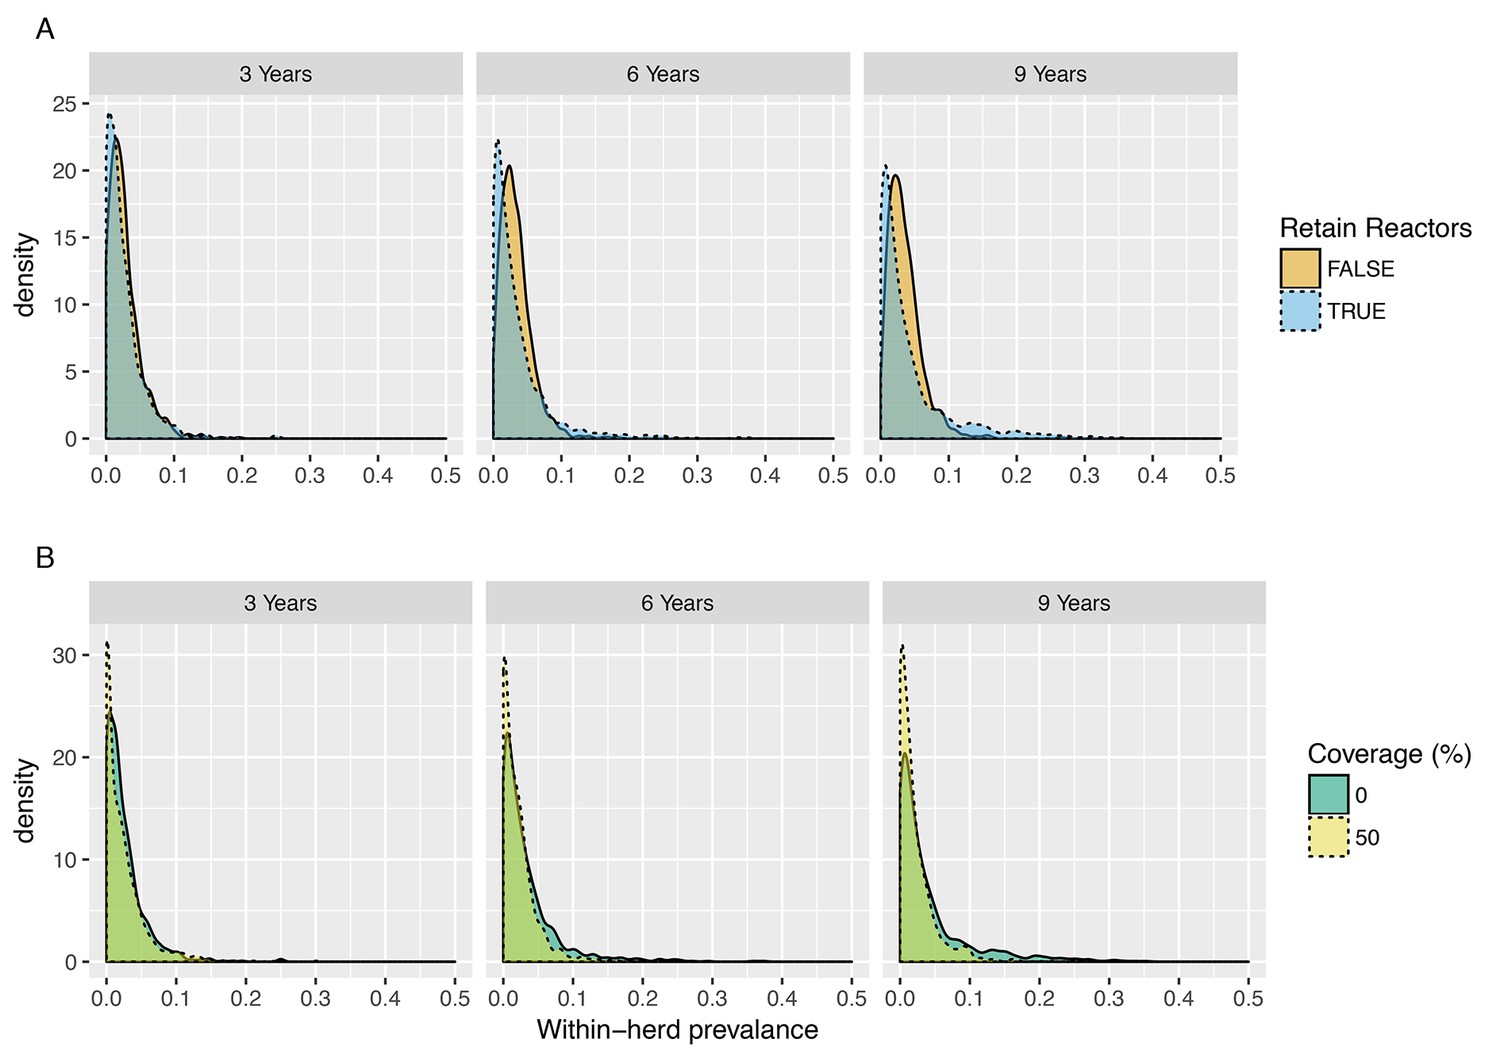
Figure 3 with 1 supplement

Posterior predictive distributions for within-herd prevalence for 3-, 6- and 9-year trial durations (SORI model).
(A) Posterior predictive distributions for the proportion of reactors disclosed within a herd (within-herd prevalence) for trial-durations of 3, 6 and 9 years under policies where reactor animals are retained within herds (orange, FALSE) or removed when disclosed (blue, TRUE). Over a 3-year period, retention of reactors makes very little difference to the overall attack rate due to the relatively low transmission rates and long inter-generational period. (B) Posterior predictive distributions for the proportion of reactors disclosed within a herd (within-herd prevalence) for trial-durations of 3, 6 and 9 years in unvaccinated (0% coverage, Blue) and partially vaccinated (50% coverage, Yellow) herds for the most optimistic scenario of an assumed reduction in susceptibility and infectiousness of . Even for this most optimistic scenario, a 50% coverage of vaccination is predicted to have very little impact on within-herd transmission for trial-durations of up to 9 years.
Figure 3—figure supplement 1
Posterior predictive distributions for within-herd prevalence for 3-, 6- and 9-year trial durations (SOR model).
(A) Posterior predictive distributions for the proportion of reactors disclosed within a herd (within-herd prevalence) for trial-durations of 3, 6 and 9 years under policies where reactor animals are retained within herds (orange, FALSE) or removed when disclosed (blue, TRUE). Over a 3-year period, retention of reactors makes very little difference to the overall attack rate due to the relatively low transmission rates and long inter-generational period. (B) Posterior predictive distributions for the proportion of reactors disclosed within a herd (within-herd prevalence) for trial-durations of 3, 6 and 9 years in unvaccinated (0% coverage, Blue) and partially vaccinated (50% coverage, Yellow) herds for the most optimistic scenario of an assumed reduction in susceptibility and infectiousness o. Even for this most optimistic scenario, a 50% coverage of vaccination is predicted to have very little impact on within-herd transmission for trial-durations of up to 9 years.
Figure 4 with 3 supplements
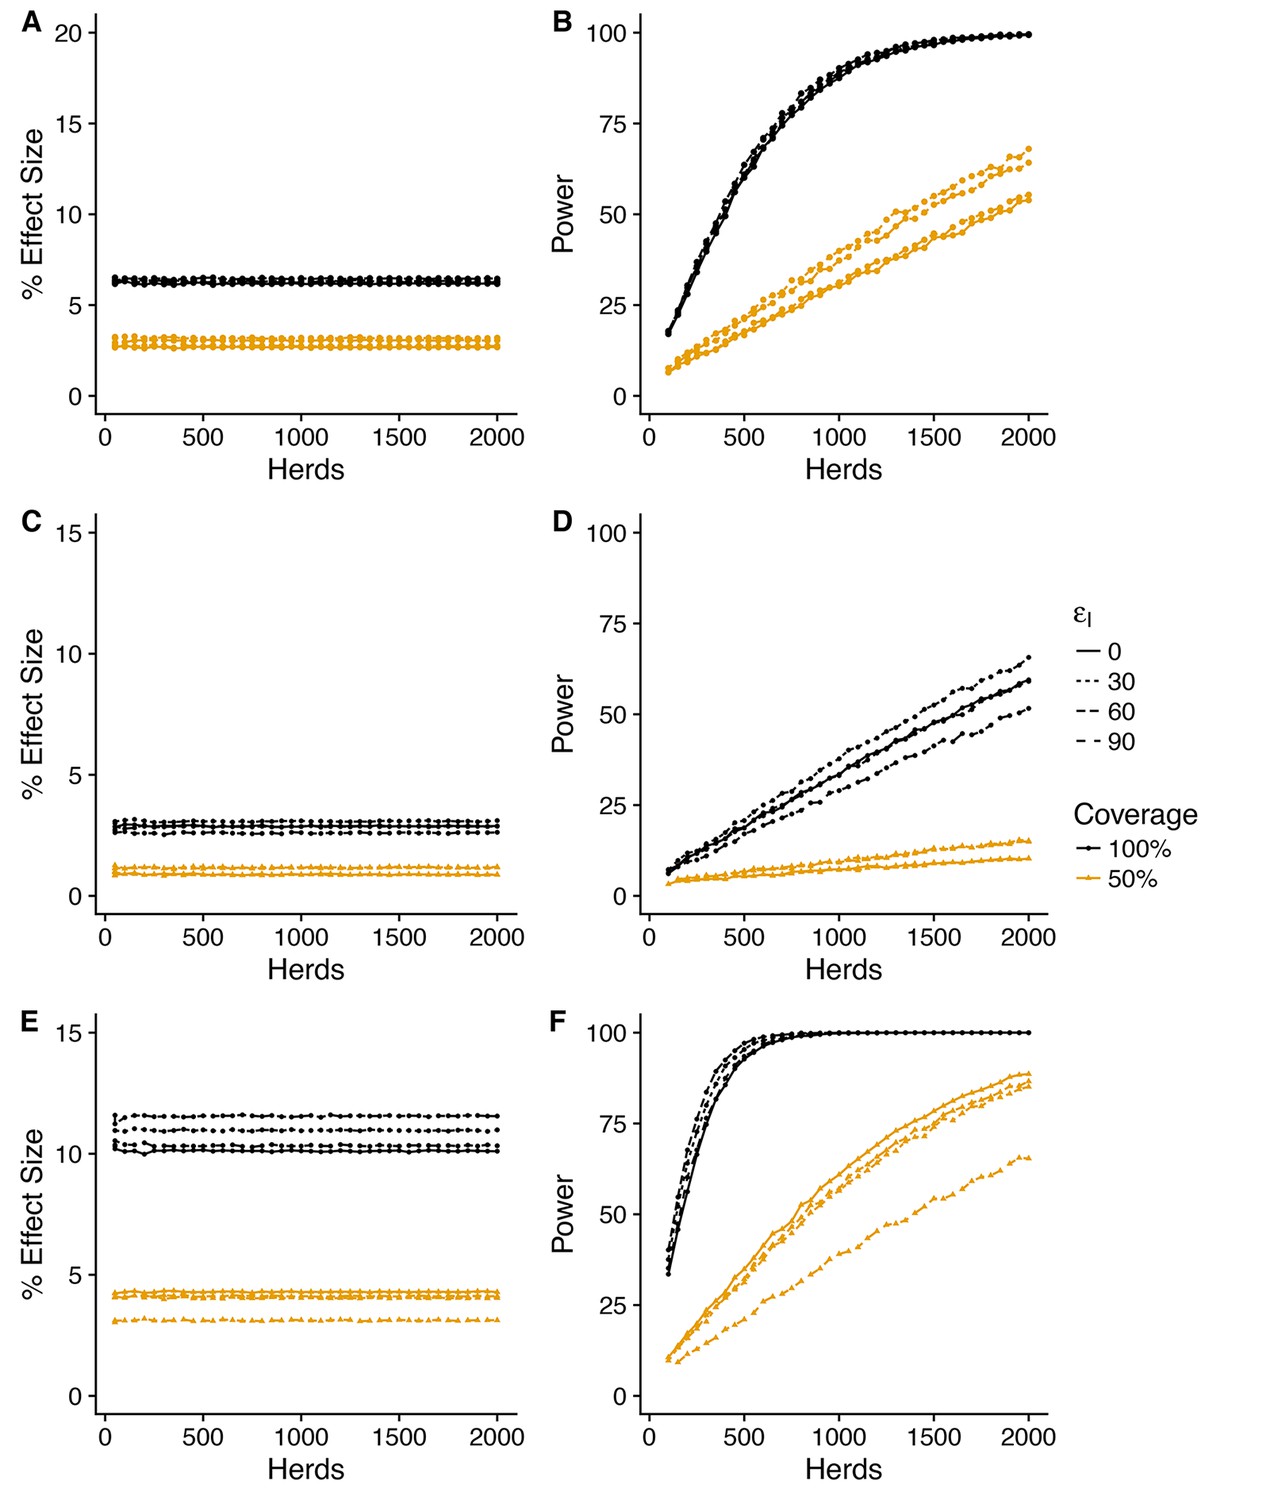
Power to estimate effect of vaccination on herd level incidence (SORI model).
Simplest design to measure vaccine effectiveness with 50:50 mix of control and vaccinated herds and a target coverage of either 50% or 100% for a 3-year trial period. We explore a range of assumed vaccine-induced reductions in susceptibility (A,B) (C,D) (E,F) and infectiousness (0, 30, 60, 90%). For an assumed vaccine efficacy of 90% (reduction in susceptibility), the SORI model predicts a ~ 10% reduction in herd level incidence (defined as the proportion of herds with at least one DIVA test positive animal or slaughterhouse case) for 100% vaccination coverage and ~ 5% for 50%. For this effect size ~ 500 herds would be required to achieve the target 80% trial power for whole herd vaccination. In excess of 2000 herds (the upper range considered) would be required for a 50% within herd target coverage.
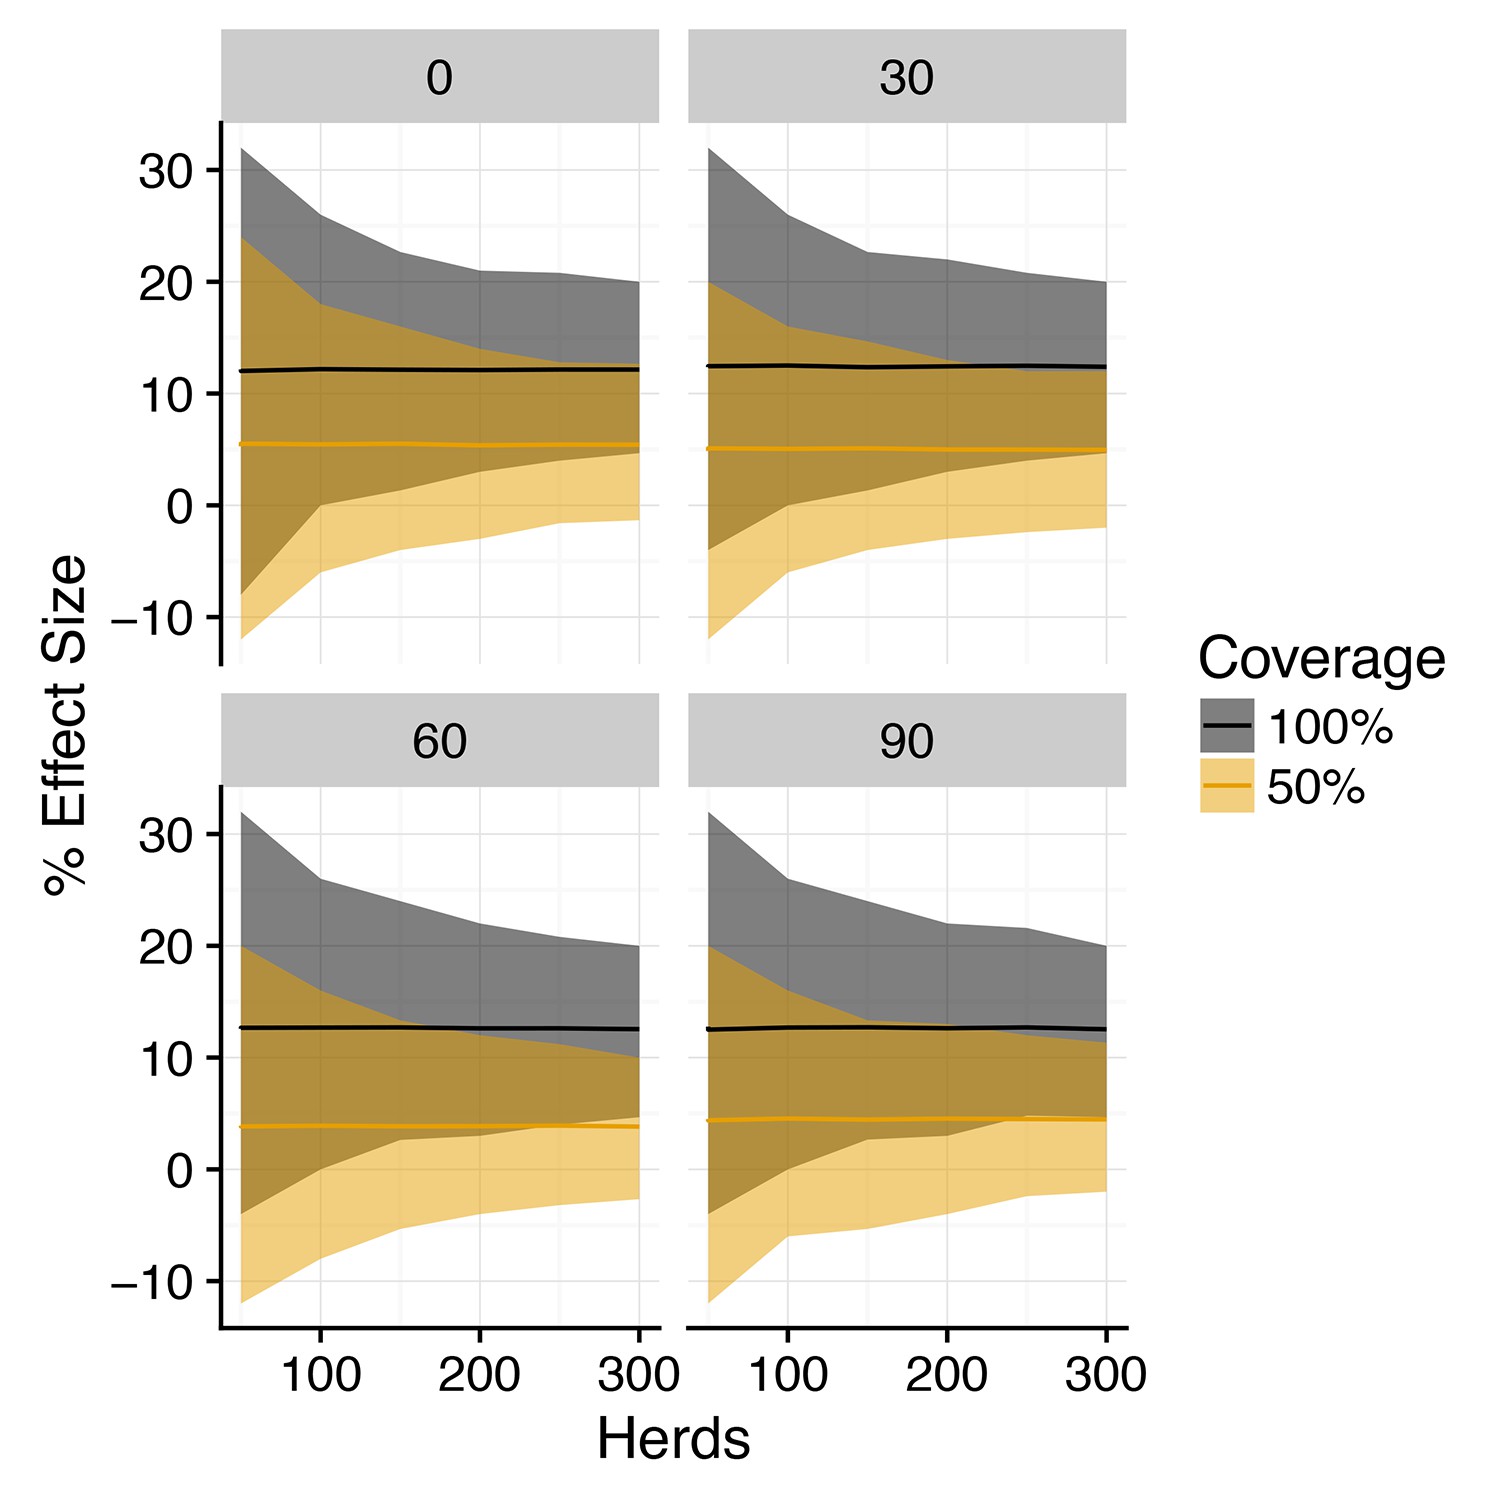
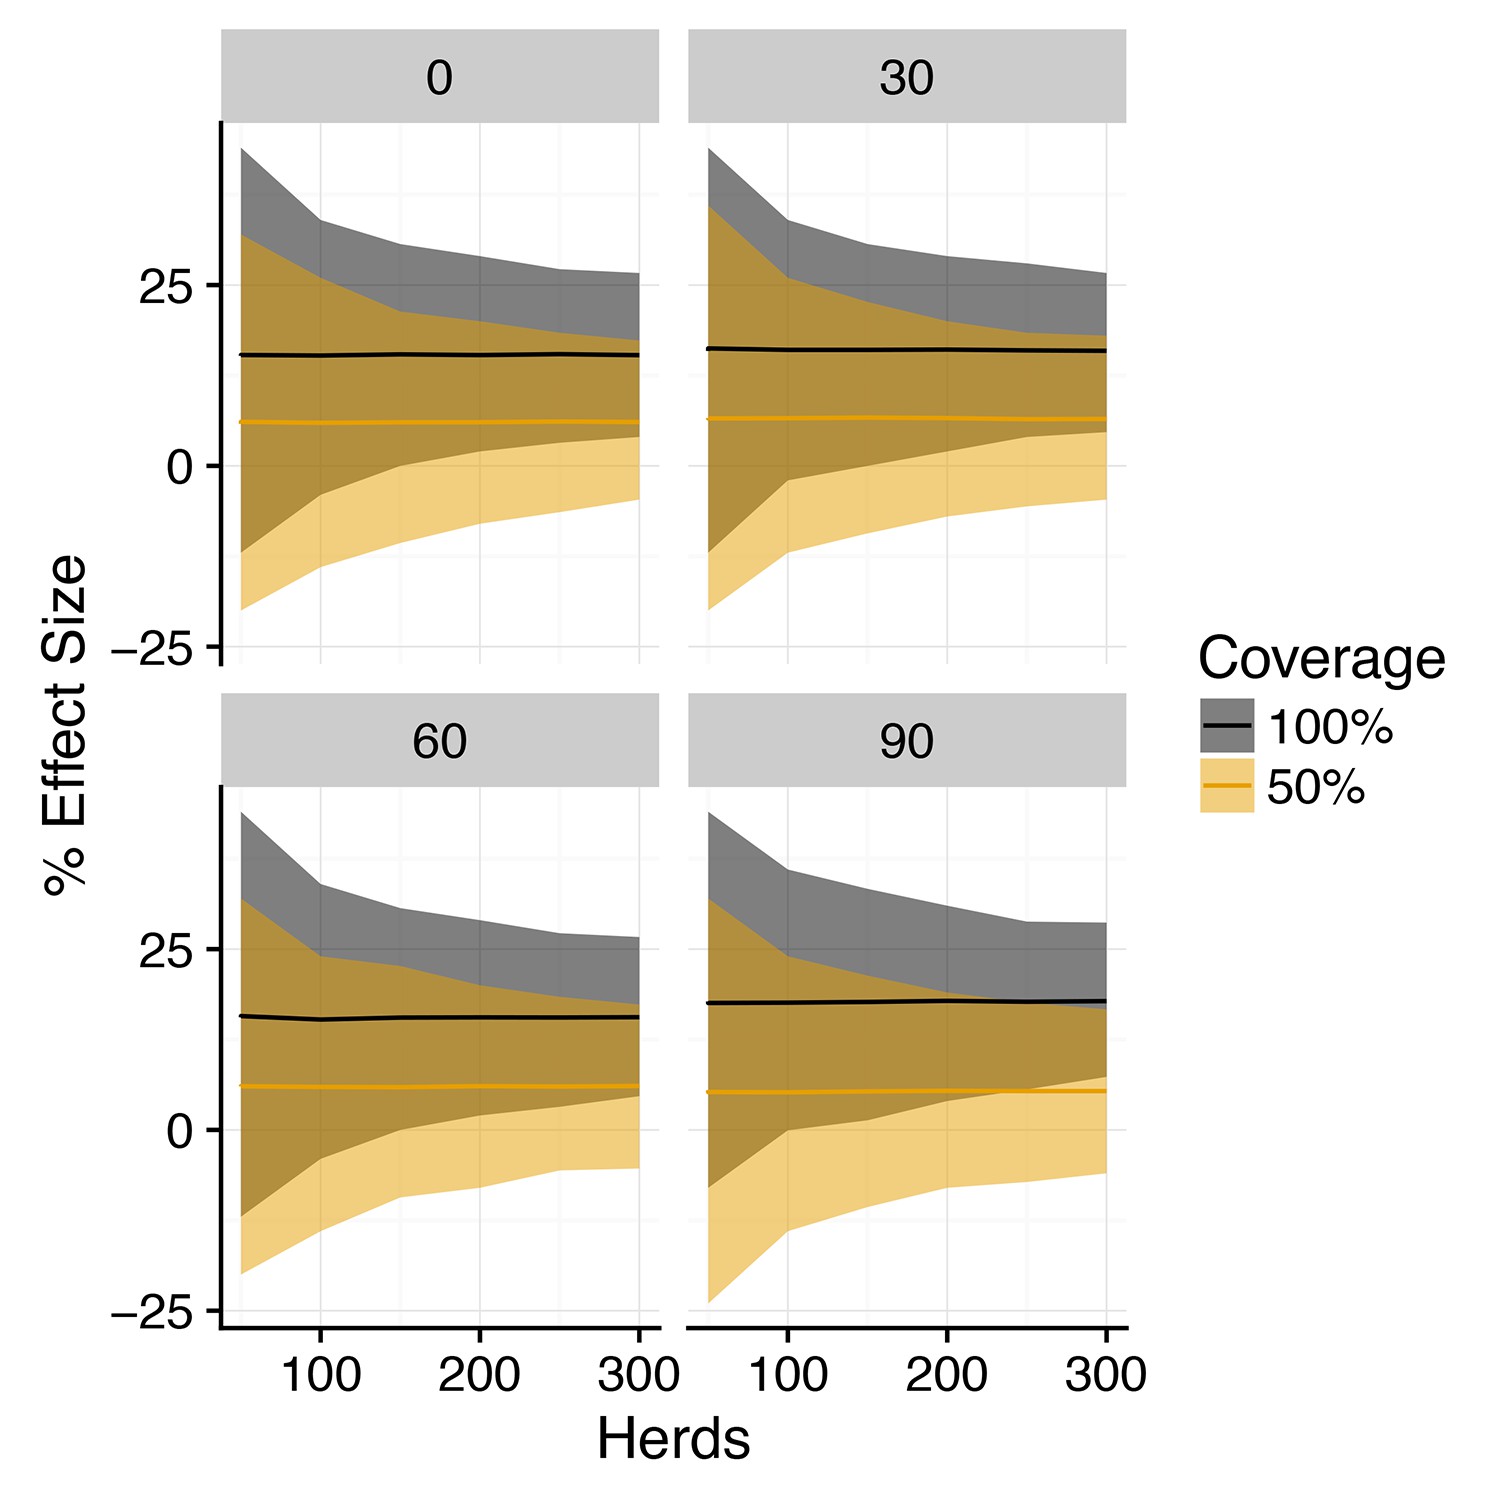
Figure 4—figure supplement 1
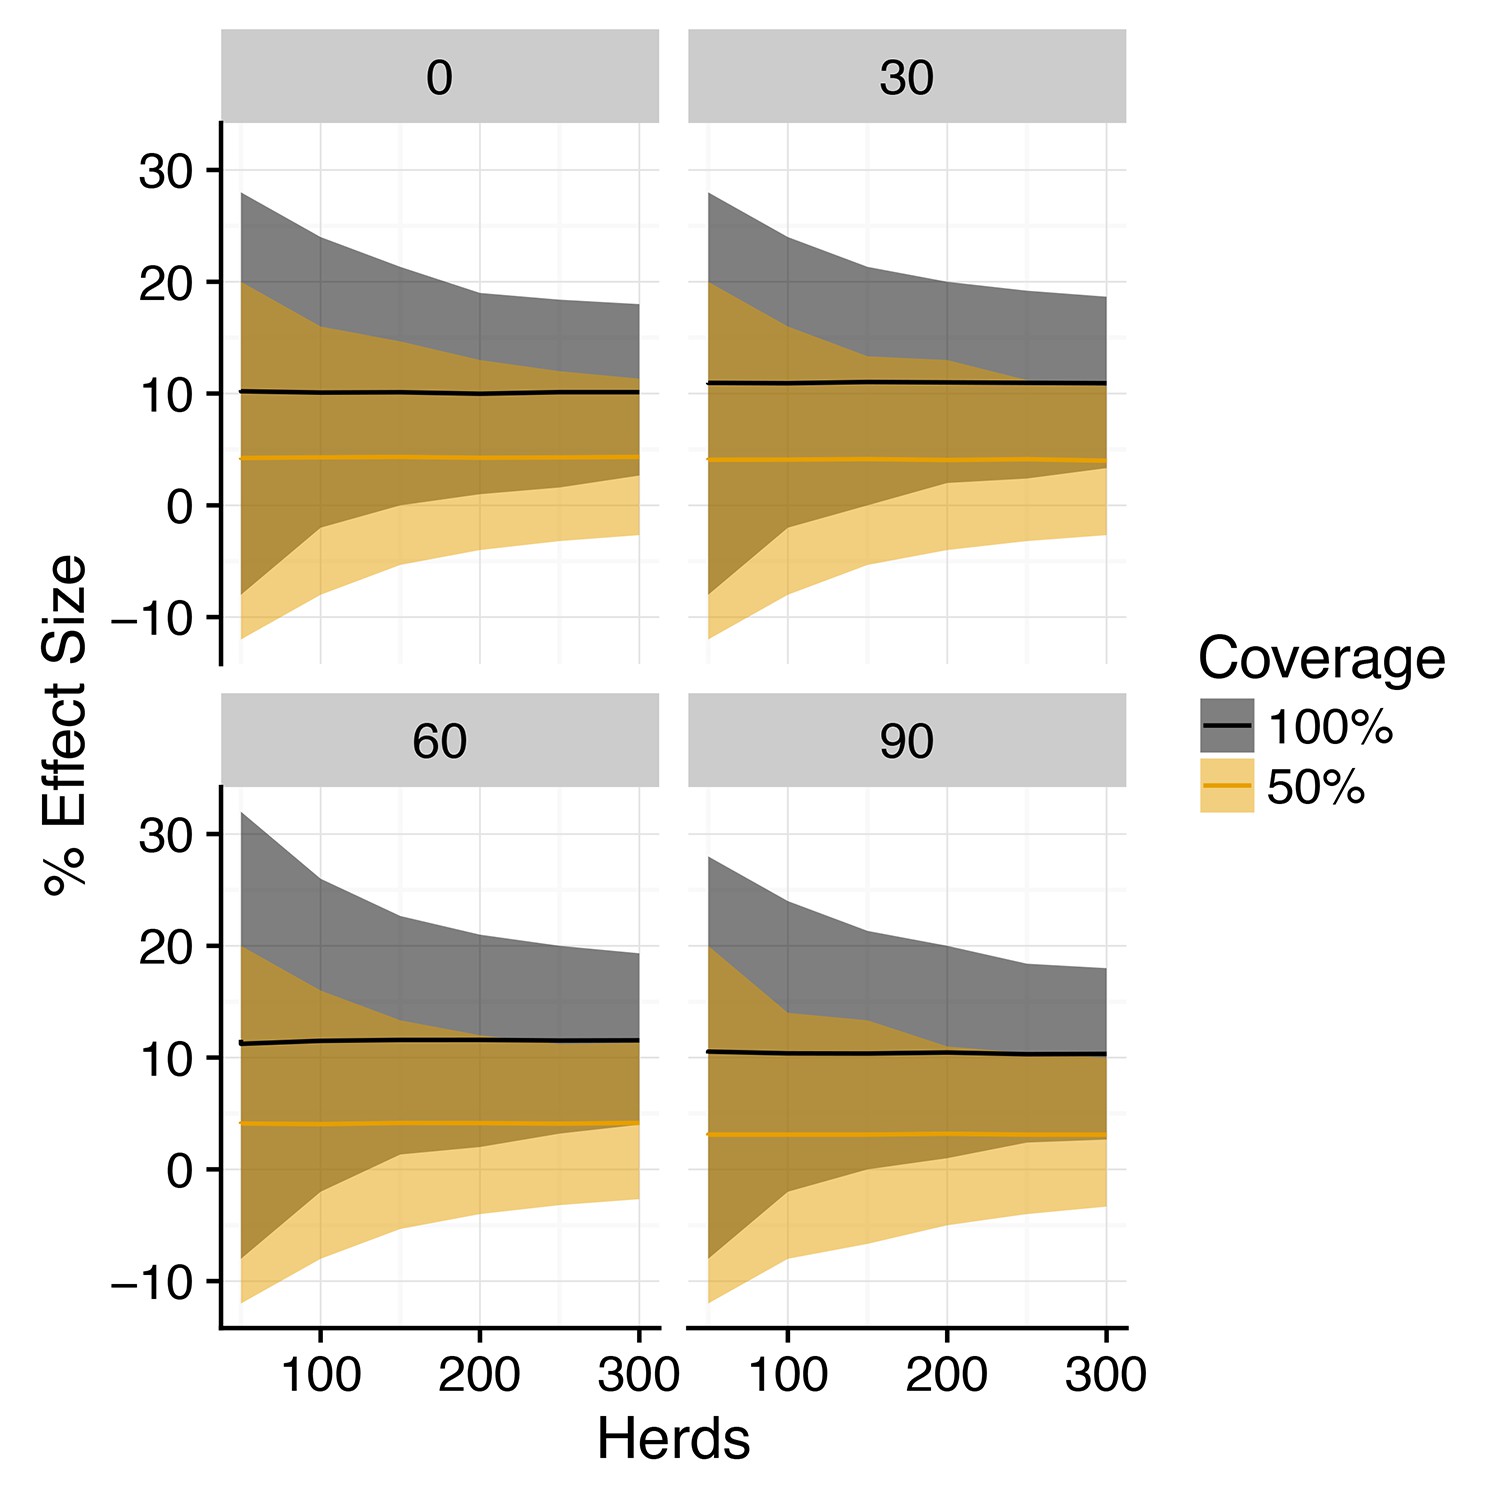
Posterior predictive distribution for effect size of vaccination on herd level incidence (SORI model).
Posterior predictive distribution of the % difference in incidence (effect size) between vaccinated and control herds for a three-year trial duration for the SORI model plotted against herd size. Median value is plotted as a solid line, with shaded region illustrating 95% credible intervals for 100% within-herd target coverage of vaccination (black) and 50% target coverage (orange). Plotted distributions are for an assumed reduction in susceptibility of and the reduction in infectiousness as indicated in the heading of each panel.
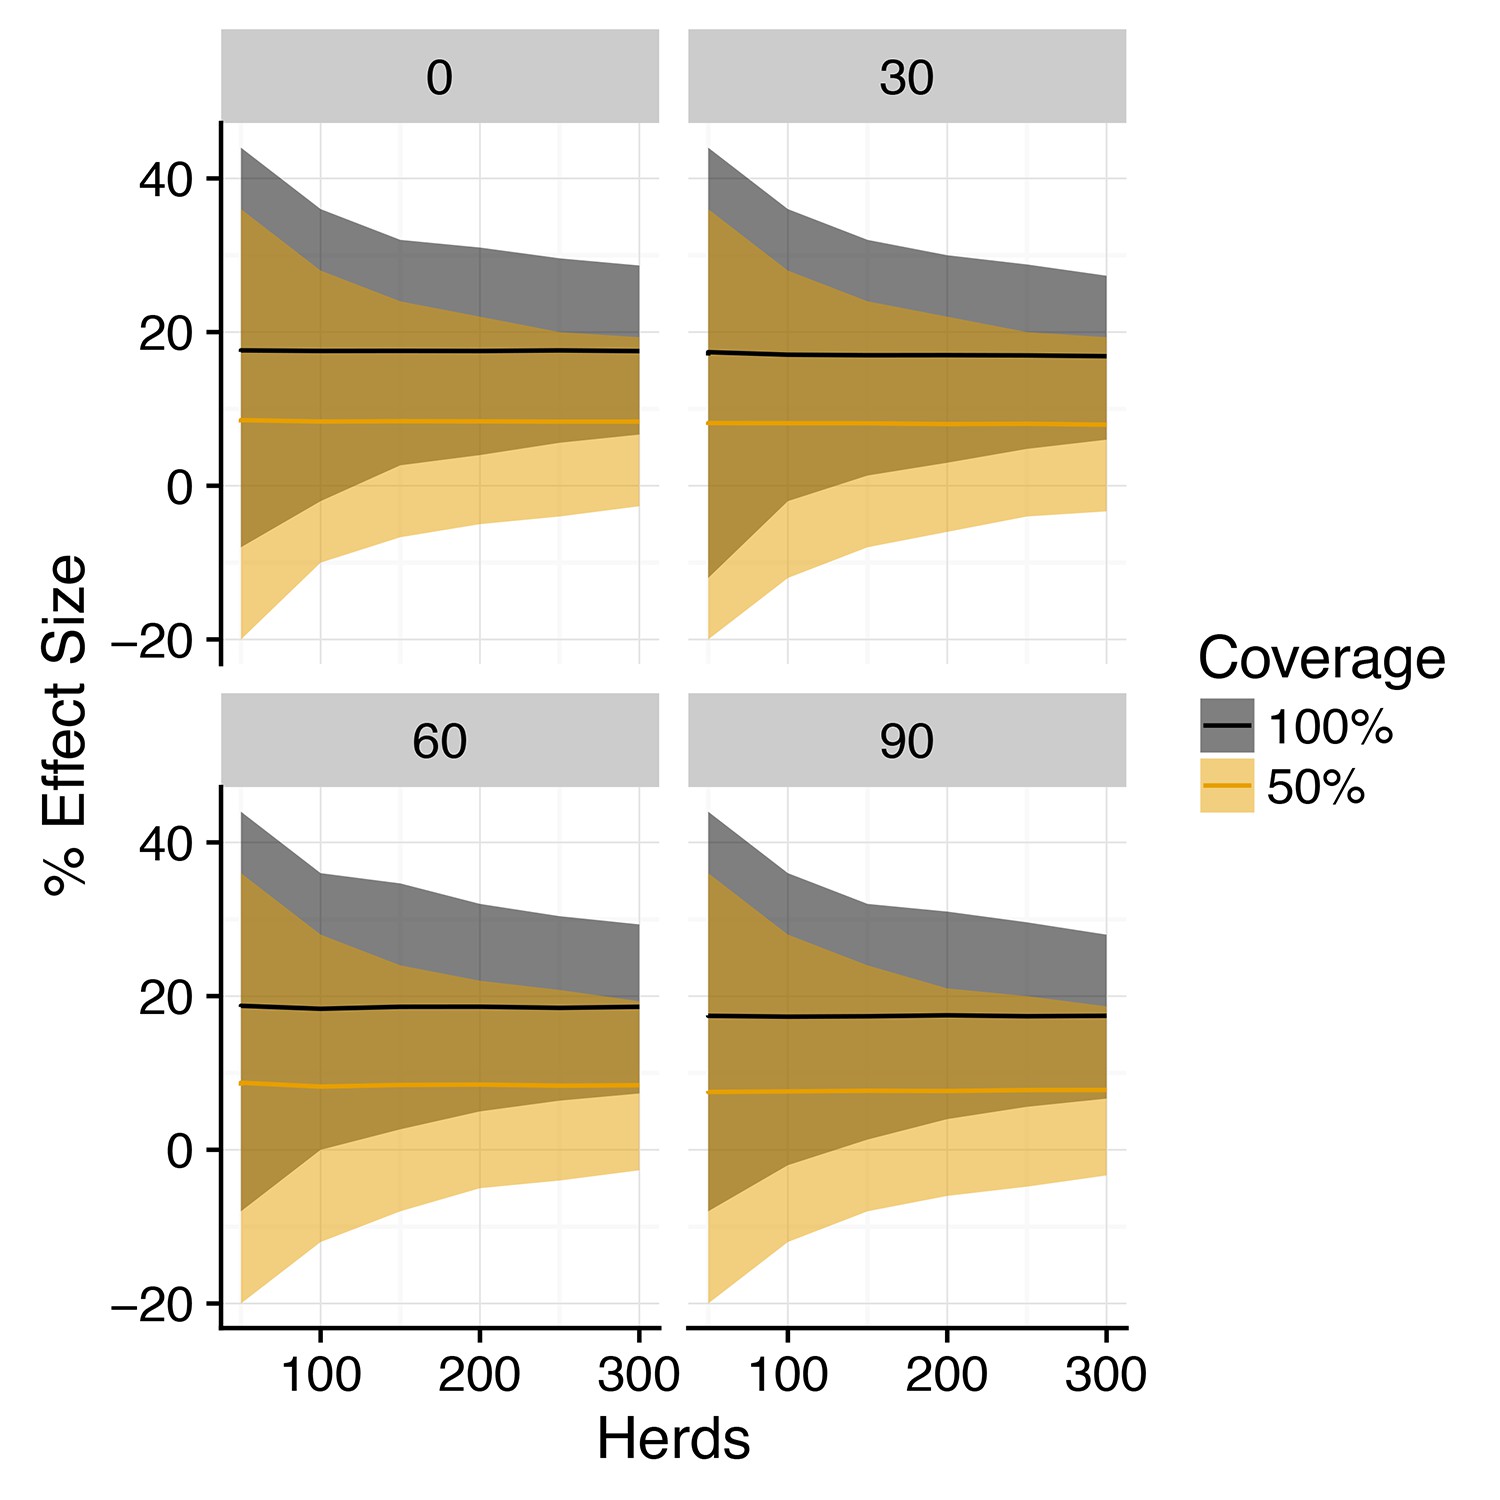
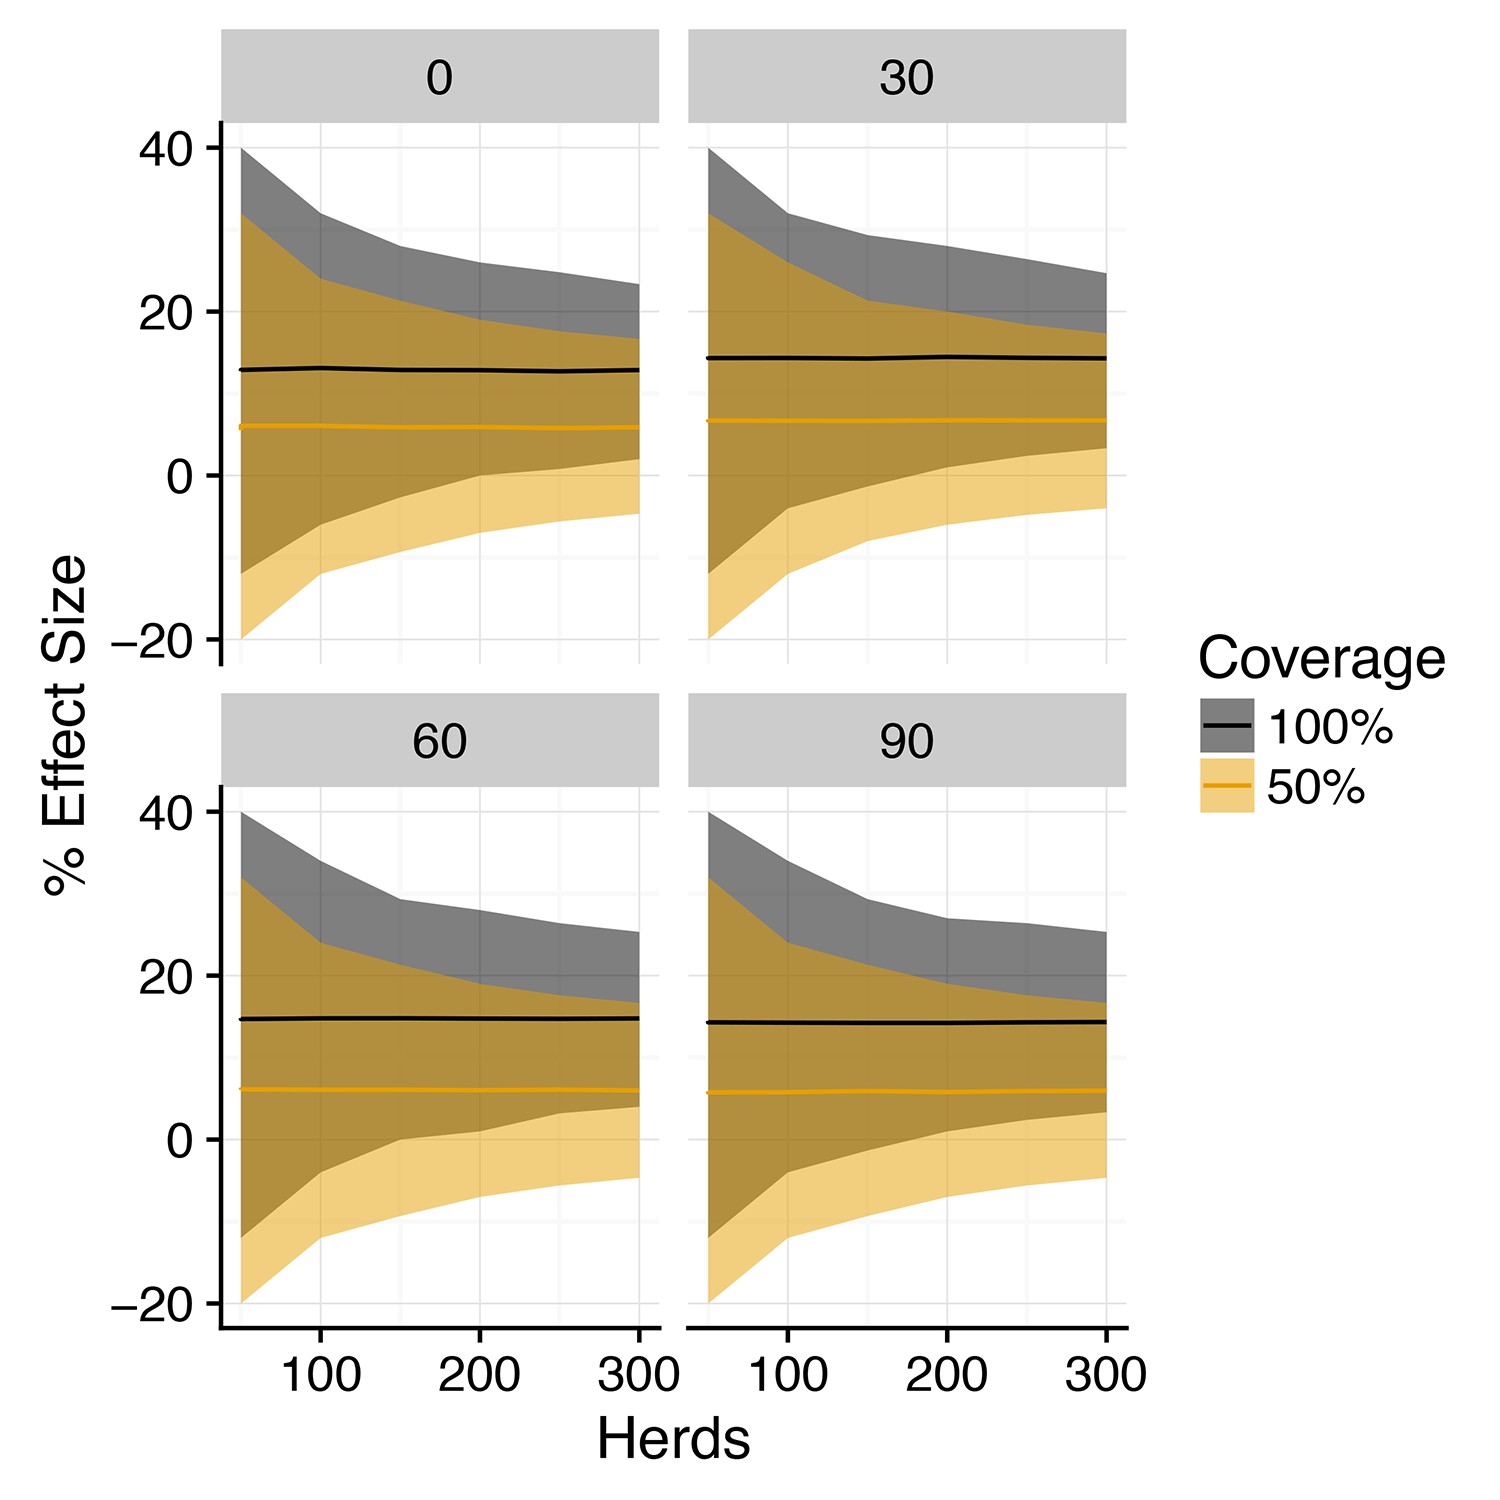
Figure 4—figure supplement 2
Predicted effect of vaccination on herd level incidence (SOR model).
Simplest design to measure vaccine efficiency with 50:50 mix of control and vaccinated herds and a target coverage of either 50 or 100% for a 3-year trial period. We explore a range of assumed vaccine-induced reductions in susceptibility (A,B) (C,D) (E,F) and infectiousness (0, 30, 60, 90%). For an assumed vaccine efficacy of 90% (reduction in susceptibility) the SOR model predicts a ~ 12% reduction in herd level incidence (defined as the proportion of herds with at least one DIVA test positive animal or slaughterhouse case) for 100% vaccination coverage and ~ 5% for 50%. For this effect size, ~ 500 herds would be required to achieve the target 80% trial power for whole herd vaccination. In excess of 1500 herds would be required for a 50% within herd target coverage.
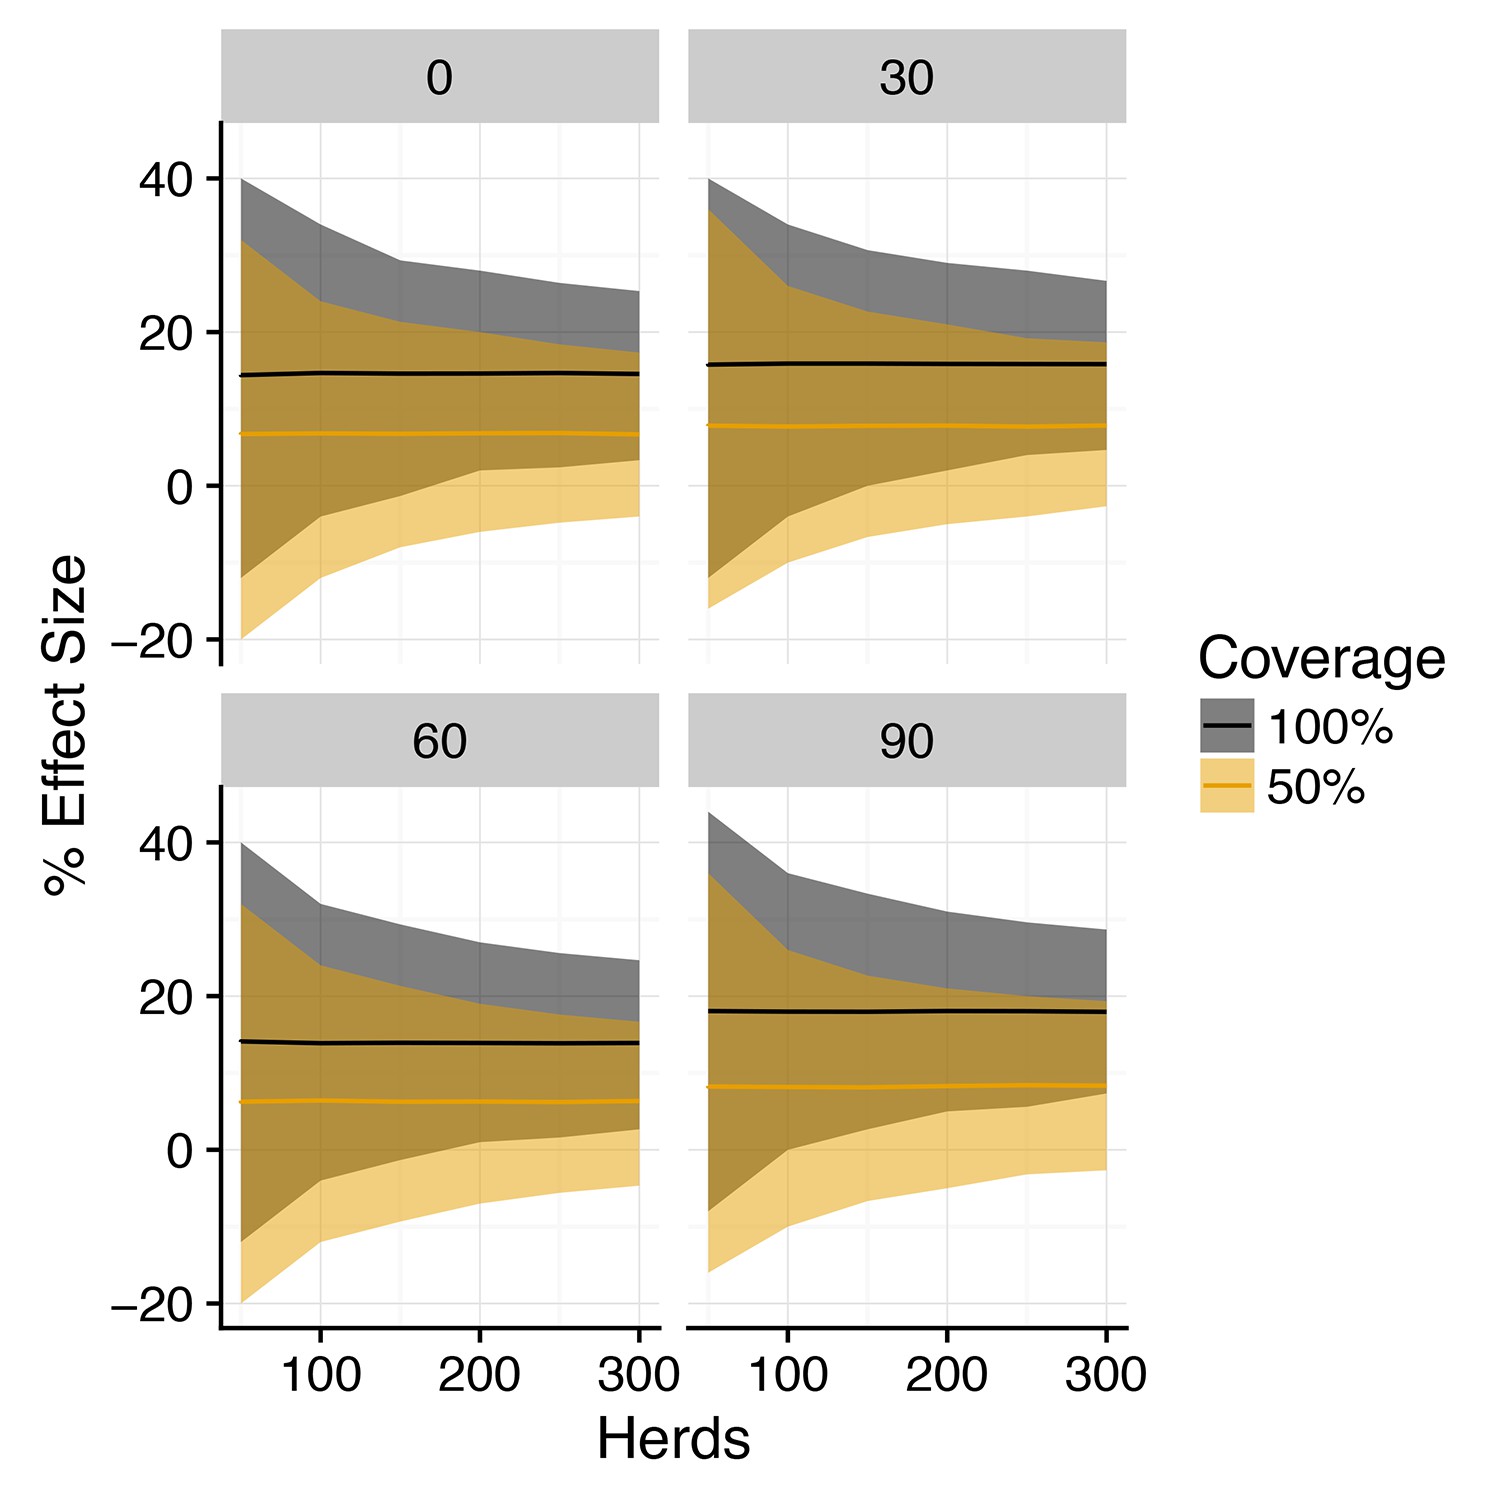
Figure 4—figure supplement 3
Posterior predictive distribution for effect size of vaccination on herd level incidence (SOR model).
Posterior predictive distribution of the % difference in incidence (effect size) between vaccinated and control herds for a 3-year trial duration for the SOR model plotted against herd size. Median value is plotted as a solid line, with shaded region illustrating 95% credible intervals for 100% within-herd target coverage of vaccination (black) and 50% target coverage (orange). Plotted distributions are for an assumed reduction in susceptibility of and the reduction in infectiousness as indicated in the heading of each panel.
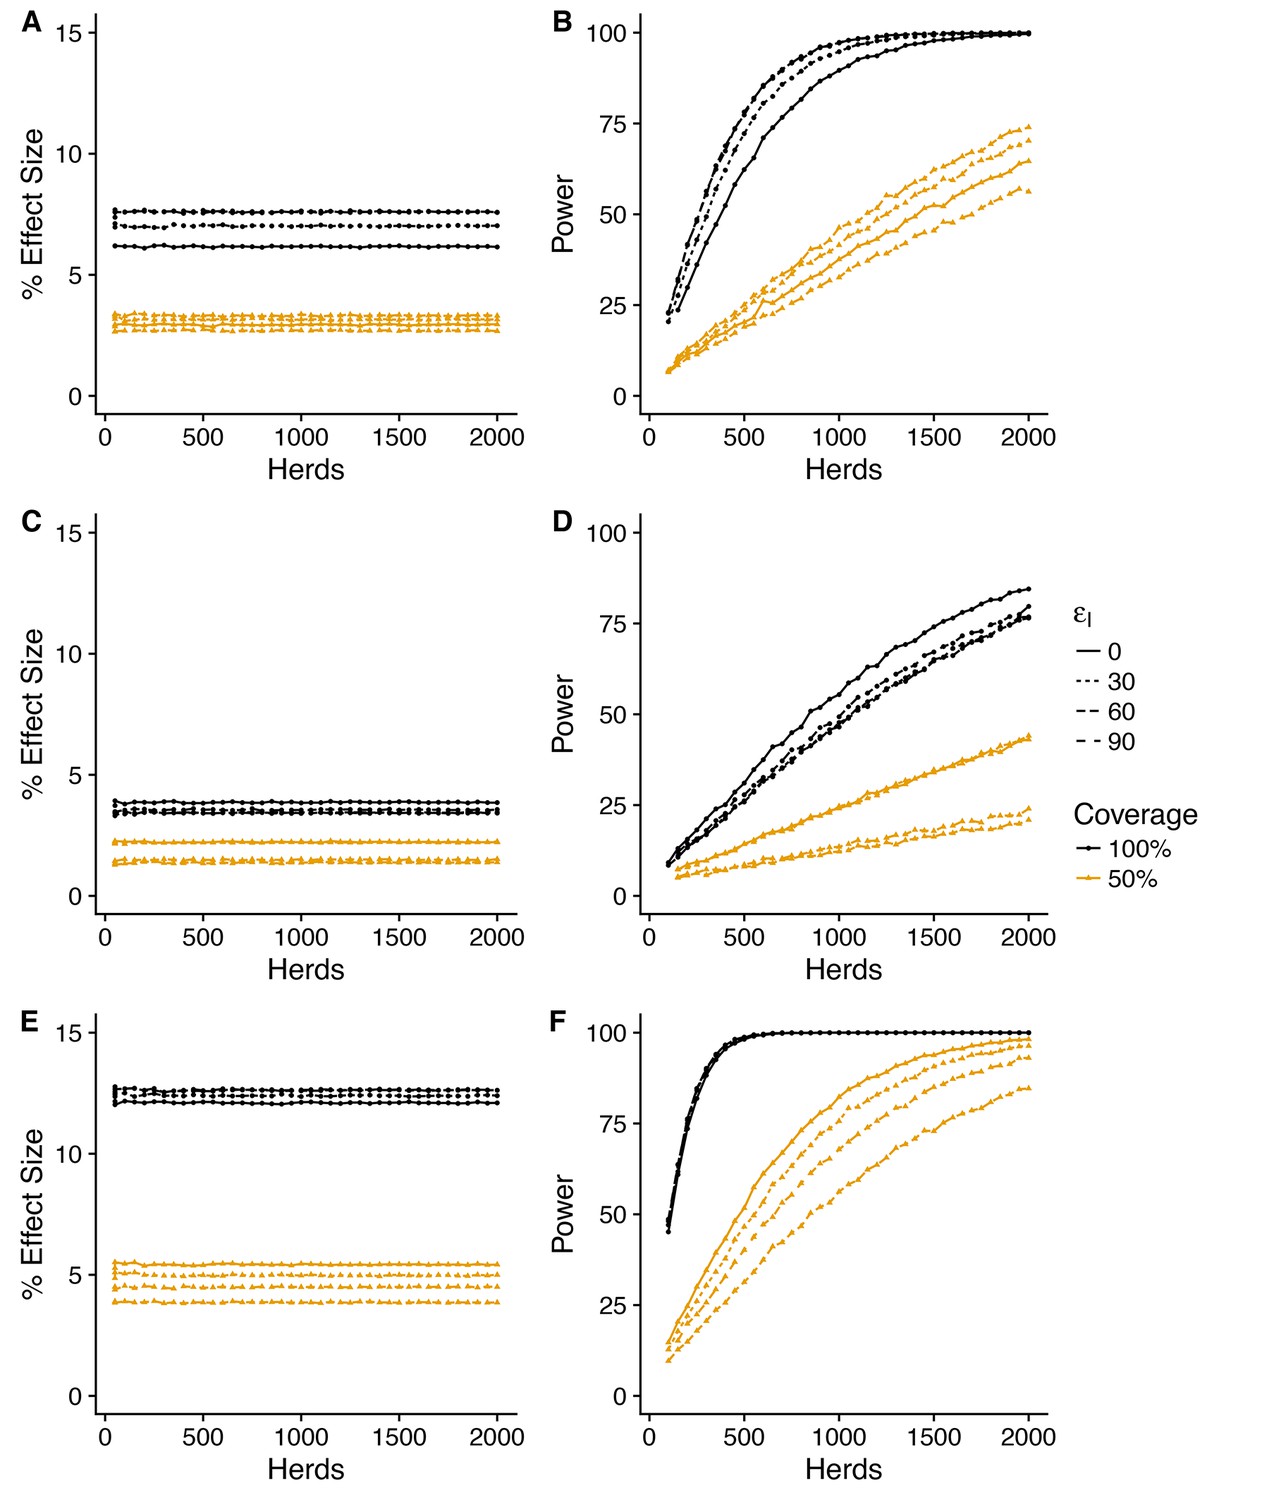
Figure 5 with 3 supplements
Predicted effect of vaccination on duration of restrictions (SORI model).
Simplest design to measure vaccine effectiveness with 50:50 mix of control and vaccinated herds and a target coverage of either 50 or 100% for a 3-year trial period. We explore a range of assumed vaccine-induced reductions in susceptibility (A,B) (C,D) (E,F) and infectiousness ( = 0, 30, 60, 90%). For an assumed vaccine efficacy of 90% (reduction in susceptibility), the SORI model predicts a ~ 20% reduction in prolonged breakdowns (defined as the proportion of herds that take more than 1 short interval test to clear restrictions) for 100% vaccination coverage and ~ 10% for 50%. For this effect size, ~ 250 herds would be required to achieve the target 80% trial power for whole herd vaccination. In excess of 1500 herds (the upper range considered) would be required for a 50% within herd target coverage.
Figure 5—figure supplement 1
Posterior predictive distribution for effect size of vaccination on duration of restrictions (SORI model).
Posterior predictive distribution of the % difference in the probability of a prolonged breakdown (effect size) between vaccinated and control herds for a 3-year trial duration for the SORI model plotted against herd size. Median value is plotted as a solid line, with shaded region illustrating 95% credible intervals for 100% within-herd target coverage of vaccination (black) and 50% target coverage (orange). Plotted distributions are for an assumed reduction in susceptibility of and the reduction in infectiousness as indicated in the heading of each panel.
Figure 5—figure supplement 2
Predicted effect of vaccination on duration of restrictions (SOR model).
Simplest design to measure vaccine effectiveness with 50:50 mix of control and vaccinated herds and a target coverage of either 50 or 100% for a 3-year trial period. We explore a range of assumed vaccine-induced reductions in susceptibility (A,B) (C,D) (E,F) and infectiousness ( = 0, 30, 60, 90%). For an assumed vaccine efficacy of 90% (reduction in susceptibility), the SOR model predicts a ~ 15% reduction in prolonged breakdowns (defined as the proportion of herds that take more than 1 short interval test to clear restrictions) for 100% vaccination coverage and ~ 5% for 50%. For this effect size, ~ 400 herds would be required to achieve the target 80% trial power for whole herd vaccination. In excess of 2000 herds (the upper range considered) would be required for a 50% within herd target coverage.
Figure 5—figure supplement 3
Posterior predictive distribution for effect size of vaccination on duration of restrictions (SOR model).
Posterior predictive distribution of the % difference in the probability of a prolonged breakdown (effect size) between vaccinated and control herds for a 3-year trial duration for the SOR model plotted against herd size. Median value is plotted as a solid line, with shaded region illustrating 95% credible intervals for 100% within-herd target coverage of vaccination (black) and 50% target coverage (orange). Plotted distributions are for an assumed reduction in susceptibility of and the reduction in infectiousness as indicated in the heading of each panel.
Figure 6 with 3 supplements

Predicted effect of vaccination on probability of recurrence (SORI model).
Simplest design to measure vaccine effectiveness with 50:50 mix of control and vaccinated herds and a target coverage of either 50 or 100% for a 3-year trial period. We explore a range of assumed vaccine-induced reductions in susceptibility (A,B) (C,D) (E,F) and infectiousness ( = 0, 30, 60, 90%). For an assumed vaccine efficacy of 90% (reduction in susceptibility), the SORI model predicts a ~ 15% reduction in prolonged breakdowns (defined as the proportion of herds that take more than 1 short interval test to clear restrictions) for 100% vaccination coverage and ~ 5% for 50%. For this effect size, ~ 500 herds would be required to achieve the target 80% trial power for whole herd vaccination. In excess of 2000 herds (the upper range considered) would be required for a 50% within herd target coverage.
Figure 6—figure supplement 1
Posterior predictive distribution for effect size of vaccination on probability of recurrence (SORI model).
Posterior predictive distribution of the % difference in the probability of a recurrent breakdown (effect size) between vaccinated and control herds for a 3-year trial duration for the SORI model plotted against herd size. Median value is plotted as a solid line, with shaded region illustrating 95% credible intervals for 100% within-herd target coverage of vaccination (black) and 50% target coverage (orange). Plotted distributions are for an assumed reduction in susceptibility of and the reduction in infectiousness as indicated in the heading of each panel.
Figure 6—figure supplement 2
Predicted effect of vaccination on probability of recurrence (SOR model).
Simplest design to measure vaccine effectiveness with 50:50 mix of control and vaccinated herds and a target coverage of either 50 or 100% for a 3-year trial period. We explore a range of assumed vaccine-induced reductions in susceptibility (A,B) (C,D) (E,F) and infectiousness ( = 0, 30, 60, 90%). For an assumed vaccine efficacy of 90% (reduction in susceptibility), the SOR model predicts a ~ 15% reduction in prolonged breakdowns (defined as the proportion of herds that take more than 1 short interval test to clear restrictions) for 100% vaccination coverage and ~ 5% for 50%. For this effect size, ~ 300 herds would be required to achieve the target 80% trial power for whole herd vaccination. In excess of 2000 herds (the upper range considered) would be required for a 50% within herd target coverage.
Figure 6—figure supplement 3
Posterior predictive distribution for effect size of vaccination on probability of recurrence (SOR model).
Posterior predictive distribution of the % difference in the probability of a prolonged breakdown (effect size) between vaccinated and control herds for a 3-year trial duration for the SOR model plotted against herd size. Median value is plotted as a solid line, with shaded region illustrating 95% credible intervals for 100% within-herd target coverage of vaccination (black) and 50% target coverage (orange). Plotted distributions are for an assumed reduction in susceptibility of and the reduction in infectiousness as indicated in the heading of each panel.
Appendix 2—figure 1
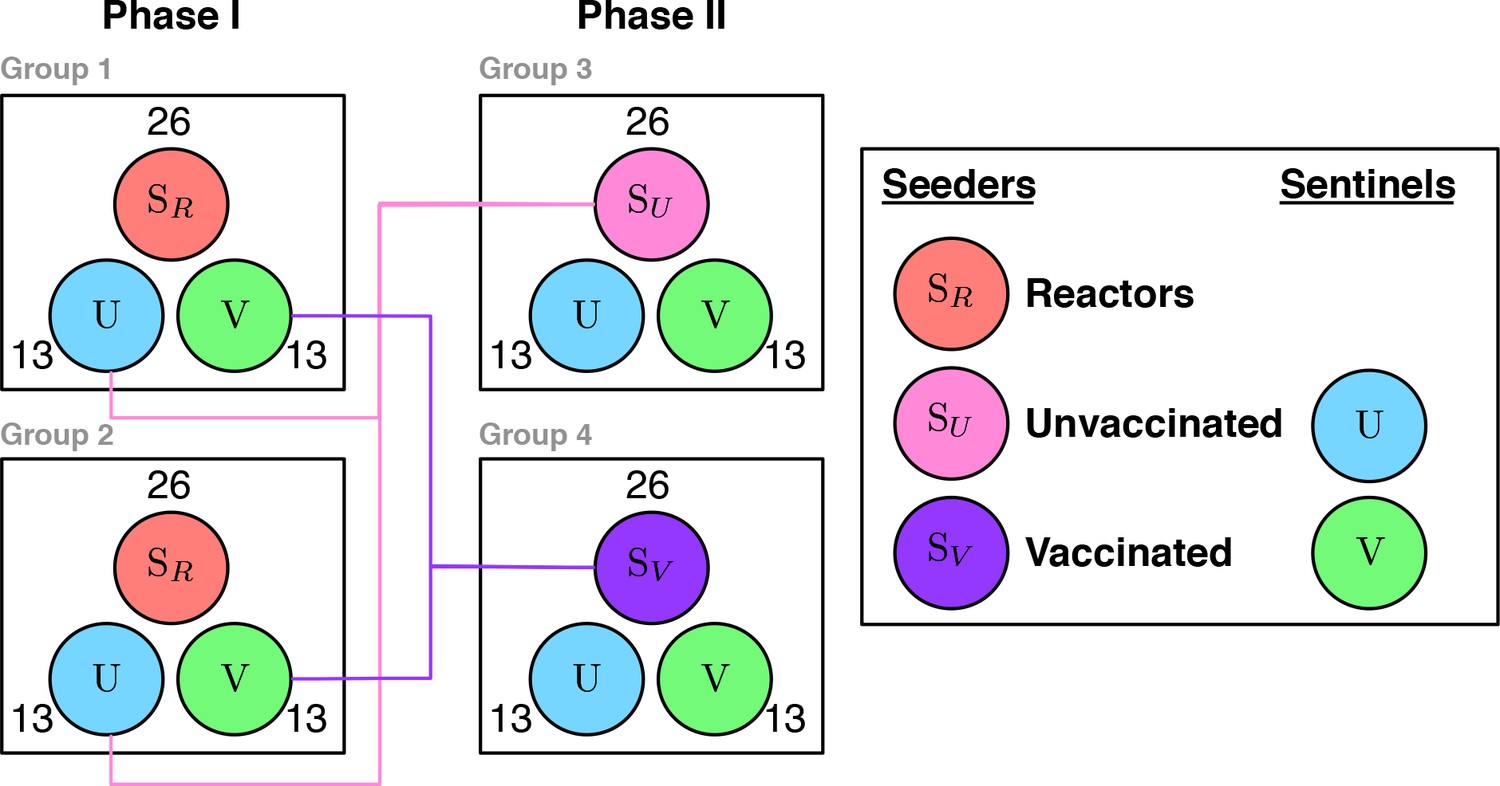
Experimental transmission study to demonstrate vaccine efficacy Both phases consist of two experimental groups with co-housed animals.
Within each experimental group there is a balanced number of seeder () and sentinel animals . 50% of the sentinel animals are vaccinated () and 50% unvaccinated controls . For Phase I the seeders () are recruited from the field. At the end of Phase I, the exposed control animals and vaccinated animals are group together and used as the seeder animals ( and respectively) and set in contact with a fresh set of (uninfected) sentinels.
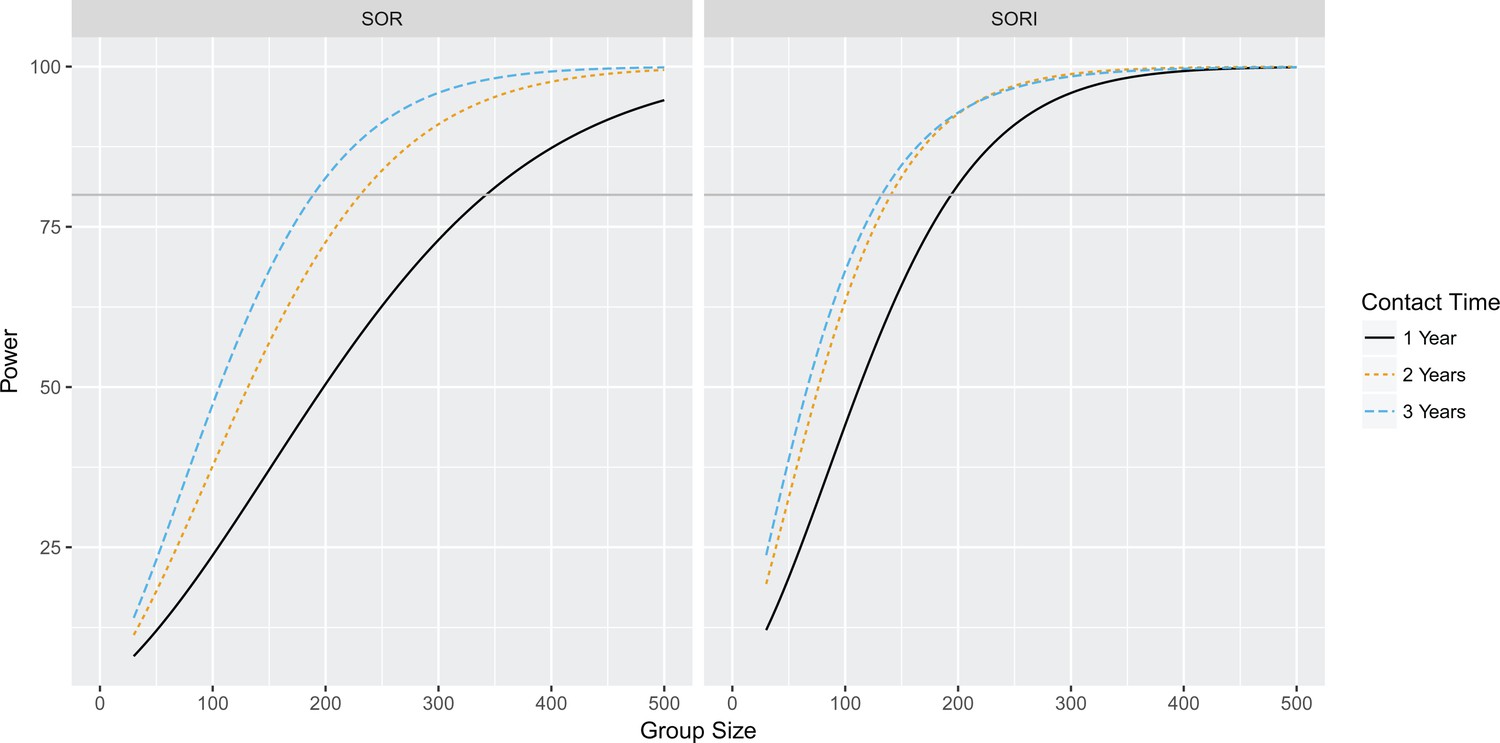
Appendix 2—figure 2 with 2 supplements

Power to estimate 75% total vaccine efficacy for SOR and SORI parameter estimates for contact times of one, two and three years Statistical power as a function of group size to estimate a significant difference in vaccinated and unvaccinated groups at the 95% level for an effect size of 75% total vaccine efficacy based upon SOR and SORI parameter estimates.
Grey line indicates the 80% power level.
Appendix 2—figure 2—figure supplement 1
Power to estimate 50% total vaccine efficacy for SOR and SORI parameter estimates for contact times of 1, 2 and 3 years Statistical power as a function of group size to estimate a significant difference in vaccinated and unvaccinated groups at the 95% level for an effect size of 50% total vaccine efficacy based upon SOR and SORI parameter estimates.
Grey line indicates the 80% power level.
Appendix 2—figure 2—figure supplement 2
Power to estimate 25% total vaccine efficacy for SOR and SORI parameter estimates for contact times of one, two and three years Statistical power as a function of group size to estimate a significant difference in vaccinated and unvaccinated groups at the 95% level for an effect size of 25% total vaccine efficacy based upon SOR and SORI parameter estimates.
Grey line indicates the 80% power level.
Appendix 3—figure 1
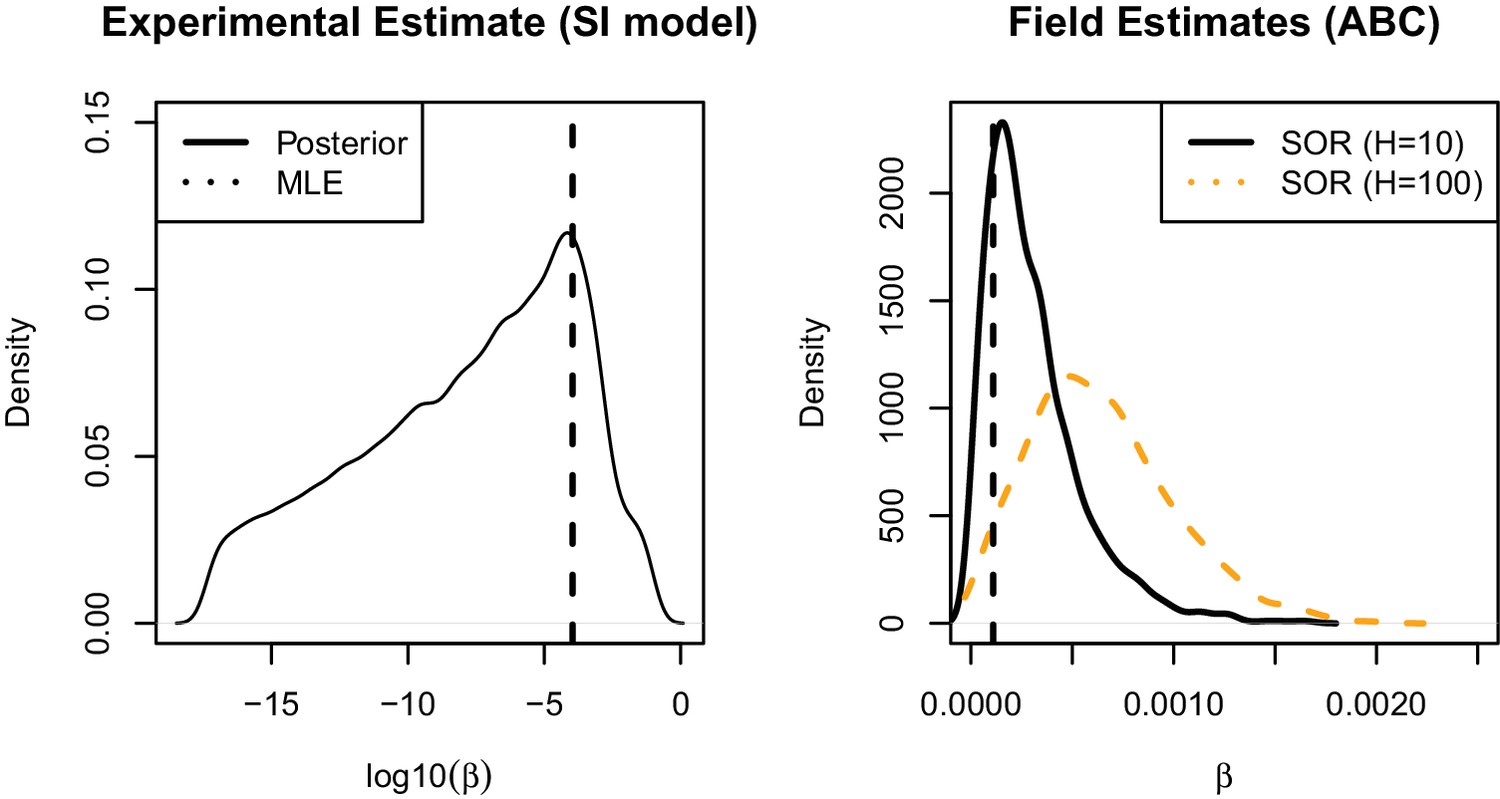
Posterior estimates of rates of cattle-to-cattle transmission from Weybridge pilot study (Left) Posterior distribution and maximum likelihood estimate for frequency dependent transmission rate () calculated from final size distribution (Khatri et al., 2012
(Right) Posterior predictive distributions for effective (frequency dependent) transmission parameter () from field estimates of the SOR transmission model with an assumed herd size of 10 (black) and 100 (orange, dashed). MLE estimate from Weybridge pilot study is show by vertical black dashed line.
Appendix 3—figure 2
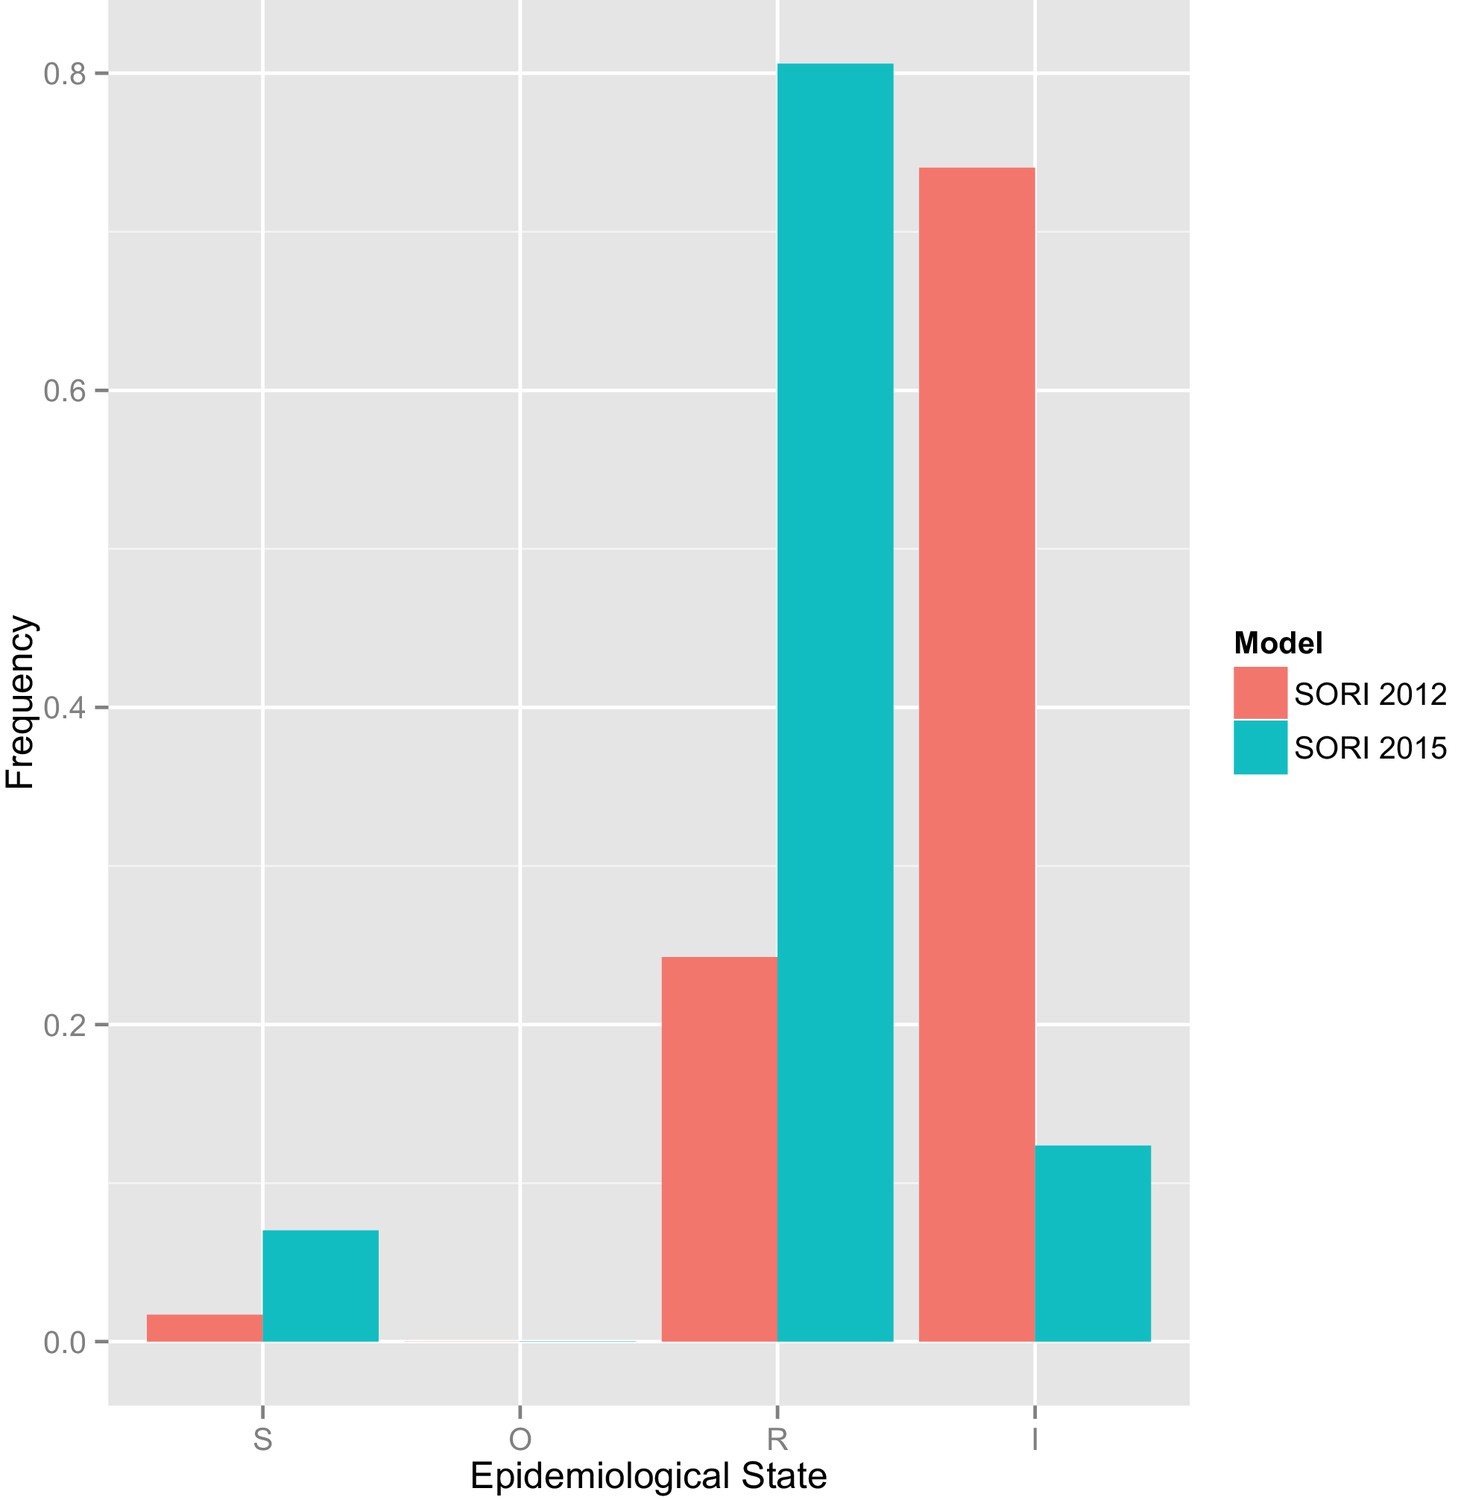
Simulated probability of a randomly selected reactor being in the S, R or I compartment for the SORI 2012 and SORI 2015 models Predictive distributions for the probability of reactor animals being in the S, O, R and I compartments for the SORI 2012 and SORI 2015 models.
For consistency, these proportions are used as initial conditions for ‘reactor’ animals used as seeders in Phase I for the respective model scenarios. The true proportion of individuals in each epidemiological state will depend on the distribution of latent periods – which is unknown – but assumed to be exponential for these models (constant rate of progression).
Appendix 3—figure 3
Point predictions for the predicted experimental for a 1 year transmission experiment from field estimates of bTB transmission rates (Appendix 3—table 1).
https://doi.org/10.7554/eLife.27694.041Tables
Appendix 1—table 1
Model parameters.
https://doi.org/10.7554/eLife.27694.024| Parameter | Description |
|---|---|
| Standard SICCT Sensitivity. Probability of positive tuberculin test for individuals at standard definition. | |
| Standard SICCT Specificity. Probability of negative tuberculin test for individuals at standard definition (1 - probability of a false positive ). | |
| Severe SICCT Sensitivity. Probability of positive tuberculin test for individuals at severe definition. | |
| Severe SICCT Specificity. Probability of negative tuberculin test for individuals at severe definition. ( probability of false positive ). | |
| Slaughterhouse detection. Relative sensitivity of finding lesioned or culture positive animals ( status) under routine inspection compared to reactor inspection. | |
| Occult Period. Mean length of time that animals are undetectable (occult) to SICCT test. | |
| Reactive Period. Mean length of time between infection and animals becoming infectious. | |
| Transmission parameter associated with density dependence (rate per day, dimensions change with ). | |
| Transmission parameter measuring the strength of density dependence (range 0–1) | |
| Transmission parameter measuring infectious pressure per susceptible per year in PTI 1 | |
| Transmission parameter measuring infectious pressure per susceptible per year in PTI 2 | |
| Transmission parameter measuring infectious pressure per susceptible per year in PTI 4 | |
| Herd size. Sampled from empirical distribution and maintained constant through individual simulations | |
| Constant equal to mid-point of range of herd sizes within study population. Used to transform density dependence of force of infection. | |
| DIVA sensitivity Probability of positive DIVA test in infected vaccinates . | |
| DIVA specificity Probability of negative DIVA test for uninfected vaccinates ( probability of a false positive ) | |
| Vaccine Efficacy Reduction in risk of infection for susceptible vaccinates (status ) | |
| Vaccine Efficacy Reduction in risk of infectiousness for infected vaccinates for SORI model, and in addition for SOR model. | |
| Protective Period. Mean length of time that animals are protected by BCG vaccination (status ) |
Appendix 1—table 2
Markov events defining SOR(V) and SORI(V) stochastic transmission models.
https://doi.org/10.7554/eLife.27694.025| Event | Status | Effect | Probability per unit time |
|---|---|---|---|
| Infection | | ||
| Emergence (Occult) | | ||
| Emergence (Reactive) | | ||
| Loss of Protection |
Appendix 1—table 3
Relative Risk of Infection .
https://doi.org/10.7554/eLife.27694.026| Age range (Years) | Relative risk |
|---|---|
| 0–1 | 1.0 |
| 1–2 | 1.8 |
| 2–3 | 2.3 |
| 3–4 | 1.5 |
| 4+ | 1.3 |
Appendix 1—table 4
Summary ABC posterior estimates and 95% Credible Intervals.
https://doi.org/10.7554/eLife.27694.027| Parameter | SOR estimate | SORI estimate |
|---|---|---|
| 0.50 (0.12, 0.99) | 0.51 (0.16, 0.88) | |
| 1.7e-4 (1.5e-5, 2.9e-4) | 1.8e-4 (9.7e-6, 3.0e-4) | |
| 0.8 (0.29, 1.0) | 0.79 (0.34, 0.98) | |
| 5.5e-4 (1.3e-4, 9.6e-4) | 5.7e-4 (1.3e-4, 9.8e-4) | |
| 0.53 (0.15, 0.94) | 0.68 (0.16, 0.98) | |
| 0.18 years (0.01, 0.34) | 0.19 years (0.17, 0.34) | |
| - | 7.0 years (2.1, 9.9) | |
| 1.8e-3 per year (1.5e-4, 4e-3) | 2.5e-2 per year (1.9e-3, 9.4e-2) | |
| 0.63 (0.32,0.94) | 0.48 (0.1, 0.9) | |
| 9.0e-6 per year (4.0e-6, 2.3e-5) | 9.6e-6 per year (5.1e-6, 2.2e-5) | |
| 5.0e-6 per year (1.5e-6, 1.3e-5) | 5.7e-6 per year (2.7e-6, 1.1e-5) | |
| 2.0e-6 per year (5.0e-7, 8.6e-6) | 2.5e-6 per year (7.8e-7, 5.8e-6) |
Appendix 1—table 5
Age stratified probability of reactors with visible lesions/culture positive .
https://doi.org/10.7554/eLife.27694.028| Age range (Days) | Probability of VL/Culture |
|---|---|
| 0–200 | 0.58 |
| 200–400 | 0.59 |
| 400–600 | 0.57 |
| 600–800 | 0.50 |
| 800–1000 | 0.41 |
| 1000–1200 | 0.31 |
| 1200–1400 | 0.29 |
| 1400–1600 | 0.27 |
| 1600–1800 | 0.26 |
| 1800–2000 | 0.26 |
| 2000–2200 | 0.28 |
| 2200–2400 | 0.28 |
| 2400–2600 | 0.27 |
| 2600–2800 | 0.28 |
| 2800–3000 | 0.32 |
| 3000–3200 | 0.27 |
| 3200–3400 | 0.31 |
| 3400–3600 | 0.28 |
| 3600–3800 | 0.27 |
| 3800–4000 | 0.28 |
| 4000–8000 | 0.28 |
Appendix 1—table 6
Time-dependent sensitisation of vaccinates to SICCT (Whelan et al., 2011)
https://doi.org/10.7554/eLife.27694.029| Time from vaccination (Days) | SICCT interpretation | Probability classified as reactor |
|---|---|---|
| 0–90 | Standard | 0.0 |
| Severe | 0.0 | |
| 90–180 | Standard | 0.60 |
| Severe | 0.84 | |
| 180–270 | Standard | 0.80 |
| Severe | 0.95 | |
| 270–360 | Standard | 0.09 |
| Severe | 0.30 | |
| 360–450 | Standard | 0.05 |
| Severe | 0.10 | |
| 450–720 | Standard | 0.11 |
| Severe | 0.30 | |
| 720+ | Standard | 0.10 |
| Severe | 0.30 |
Appendix 1—table 7
Herd level incidence for SORI model (3 Year trial period).
https://doi.org/10.7554/eLife.27694.030| Vaccine coverage | εS | εI | Incidence (Herds) |
|---|---|---|---|
| 0% | 0% | 0% | 92% |
| 50% | 30% | 0% | 91% |
| 50% | 60% | 0% | 89% |
| 50% | 90% | 0% | 88% |
| 100% | 30% | 0% | 90% |
| 100% | 60% | 0% | 86% |
| 100% | 90% | 0% | 82% |
Appendix 1—table 8
Herd level incidence for SOR model (3 Year trial period)
https://doi.org/10.7554/eLife.27694.031| Vaccine coverage | εS | εI | Incidence (Herds) |
|---|---|---|---|
| 0% | 0% | 0% | 92% |
| 50% | 30% | 0% | 91% |
| 50% | 60% | 0% | 90% |
| 50% | 90% | 0% | 89% |
| 100% | 30% | 0% | 89% |
| 100% | 60% | 0% | 87% |
| 100% | 90% | 0% | 83% |
Appendix 2—table 1
Group sizes to achieve at least ~ 80% power for constant experimental .
https://doi.org/10.7554/eLife.27694.037| Effect size (Total Vaccine Efficacy) | Experimental reproductive ratio R | Group size | Power |
|---|---|---|---|
| 75% | 2.0 | 52 | 82% |
| 75% | 1.5 | 52 | 80% |
| 50% | 2.0 | 128 | 82% |
| 50% | 1.5 | 128 | 80% |
| 25% | 2.0 | 600 | 82% |
| 25% | 1.5 | 600 | 80% |
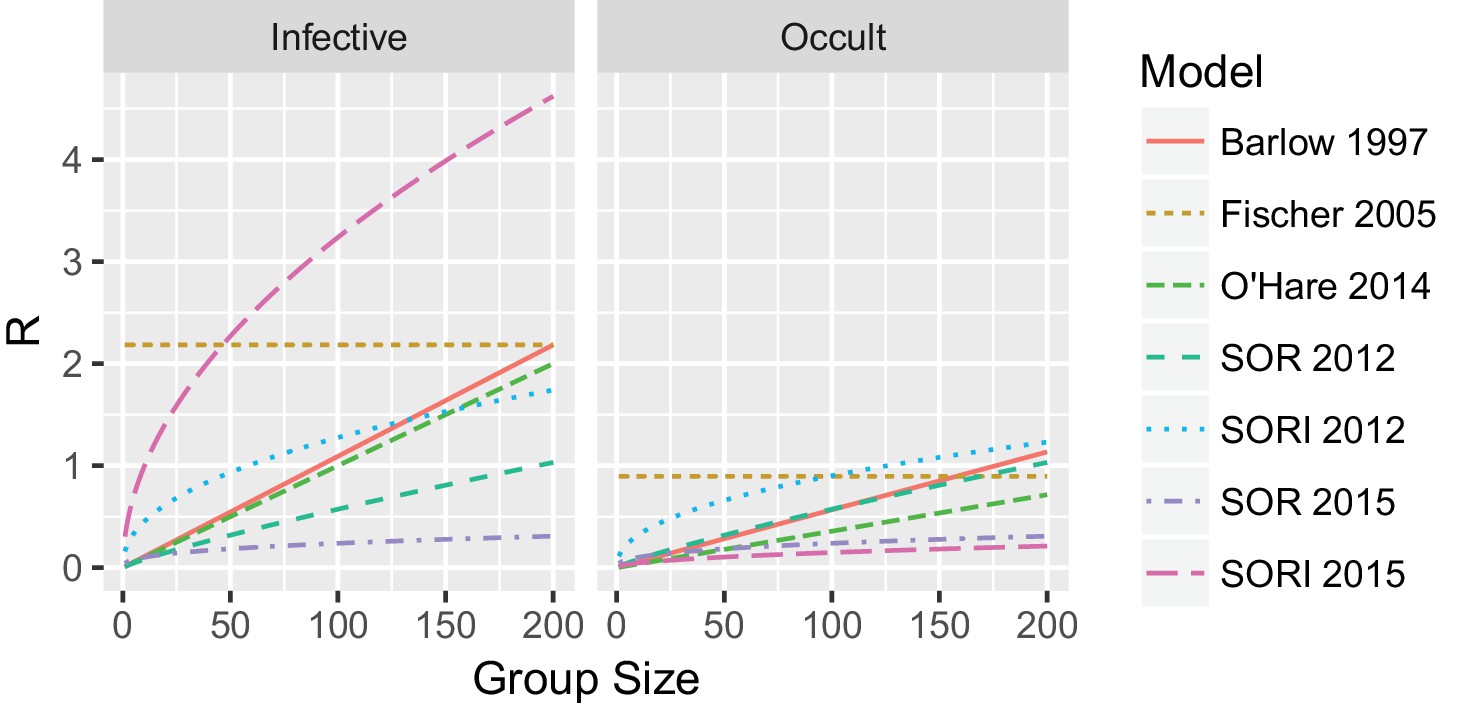
Appendix 3—table 1
Point estimates of rates of cattle-to-cattle transmission of bTB.
https://doi.org/10.7554/eLife.27694.042| Model | Transmission parameter | Transmission parameter | Occult period | Reactive period |
|---|---|---|---|---|
| Barlow et al., 1997 | 3 × 10⁻⁵ days−1 | 0 | 22 days | 180 days |
| Fischer et al., 2005 | 6 × 10⁻³ days−1 | 1 (Note ) | 41 days | 233 days |
| O'Hare et al., 2014 | 2.7 × 10⁻⁵ days−1 | 0 | 100 days | 190 days |
| Conlan et al. (2012) | 1.5 × 10⁻⁵ days−1 | 0.15 | 4 days | NA |
| Conlan et al. (2012) | 2.7 × 10⁻⁵ days−1 | 0.56 | 28 days | 77 days |
| Conlan et al. (2015) | 4.9 × 10⁻⁵ days−1 | 0.63 | 63 days | NA |
| Conlan et al. (2015) | 7.2 × 10⁻⁵ days−1 | 0.49 | 73 days | 2,572 days |
Additional files
-
Transparent reporting form
- https://doi.org/10.7554/eLife.27694.022
Download links
A two-part list of links to download the article, or parts of the article, in various formats.
Downloads (link to download the article as PDF)
Open citations (links to open the citations from this article in various online reference manager services)
Cite this article (links to download the citations from this article in formats compatible with various reference manager tools)
The intractable challenge of evaluating cattle vaccination as a control for bovine Tuberculosis
eLife 7:e27694.
https://doi.org/10.7554/eLife.27694


