Structural insight into the activation of a class B G-protein-coupled receptor by peptide hormones in live human cells
- Leipzig University, Germany
- Bridge Institute, University of Southern California, United States
Figures
Figure 1 with 1 supplement
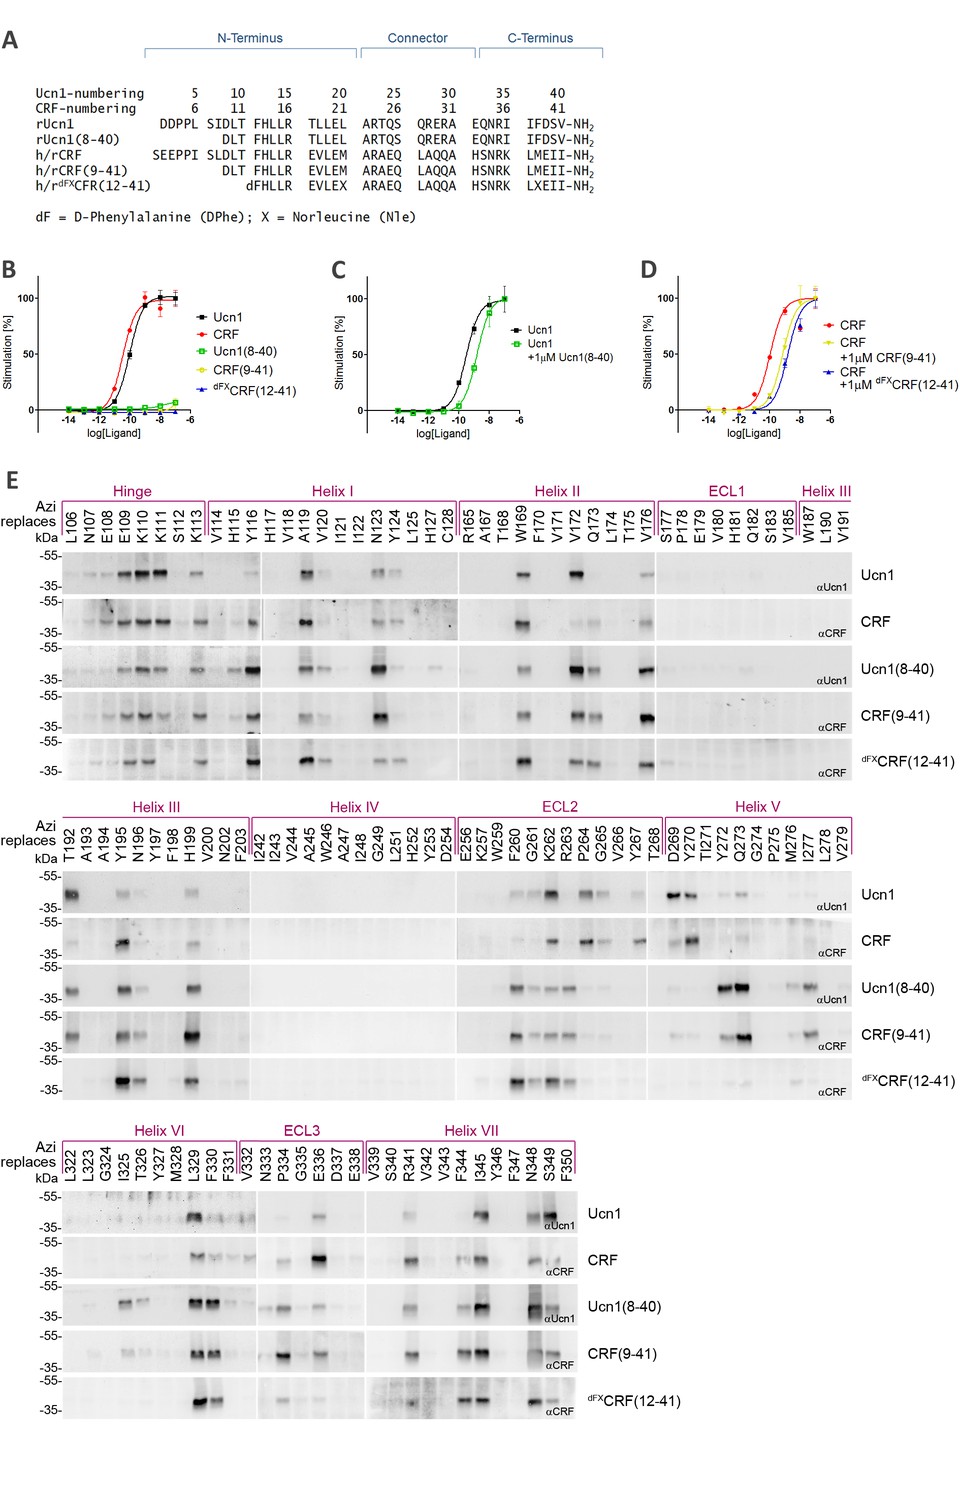
Photo-crosslinking mapping of CRF1R to determine footprints of agonists and antagonists.
(A) Sequence alignment of CRF1R peptide ligands. The classification into N-terminus, C-terminus and helical connector is adopted from Beyermann et al. (2000). Antagonists derived from CRF are well characterized in the literature (Rivier and Rivier, 2014), while Ucn1(8-40) was introduced in this work for the first time for direct comparison of agonist/antagonist pairs. In dFXCRF(12-41), substitutions of the two native Met residues to Nle and the N-terminal D-amino acid to enhance its stability and potency (Rivier and Rivier, 2014). (B–D) Activation of CRF1R by CRF and Ucn1 in the presence and absence of competitive antagonists. The assay measures cAMP accumulation in live HEK293 cells stimulated with serial dilutions of each ligand via a luciferase reporter. Plots are representative mean ± s.e.m. of at least three independent experiments, each run in triplicates. (B) CRF1R activation elicited by each of the ligands used in this study. Sub-nanomolar EC50 values for the two agonists CRF and Ucn1 agree with literature data (Rivier and Rivier, 2014). As expected, dFXCRF(12-41) did not elicit any significant receptor activation up to the maximal tested concentration of 100 nM, while CRF(9-41) and Ucn1(8-40) showed minimal residual activity (<10%). (C, D) CRF1R activation by either CRF or Ucn1, in the presence of a constant concentration of each of the antagonists used in this study. (E) Photo-crosslinking experiments. Transiently transfected 293T cells expressing each Azi-CRF1R mutant (residues replaced by Azi are indicated in the upper row) were incubated with each of the five peptide ligands indicated in the right column, followed by UV irradiation (365 nm). Whole-cell lysates were separated on 10% SDS-PAGE and analyzed by Western blotting using either anti-CRF or anti-Ucn1 antibodies as indicated. To obtain sharper bands, samples were deglycosylated by PNGaseF. The subdivision of transmembrane helices and ECLs is based on the crystal structure of the CRF1R TMD (Hollenstein et al., 2013). The deglycosylated ligand-CRF1R complex runs at an apparent MW of ~40 kDa (Coin et al., 2013). The non-crosslinked ligand is not detected (MW ~3–4 kDa).
-
Figure 1—source data 1
Numerical values of cAMP accumulation assay.
The assay measures cAMP accumulation in live HEK293 cells stimulated with serial dilutions of each ligand via a luciferase reporter. Raw luminescence data of the firefly reporter luciferase were normalized to the Renilla control and to 100% activation of agonists. At least three independent experiments were performed per ligand, and each experiment was run in triplicate. Values in the table represent a single measurement. Mean ± s.e.m. of triplicates for one representative experiment are reported in Figure 1B–D.
- https://doi.org/10.7554/eLife.27711.003
-
Figure 1—source data 2
Numerical values of whole-cell ELISA of HA-Azi-CRF1R mutants.
Related to Figure 1—figure supplement 1. The absorption was measured at 492 nm. Each data point was obtained as mean of three independent experiments, each performed in triplicate. Mean ± s.e.m. of the means of the triplicates are plotted in Figure 1—figure supplement 1B.
- https://doi.org/10.7554/eLife.27711.004
Figure 1—figure supplement 1
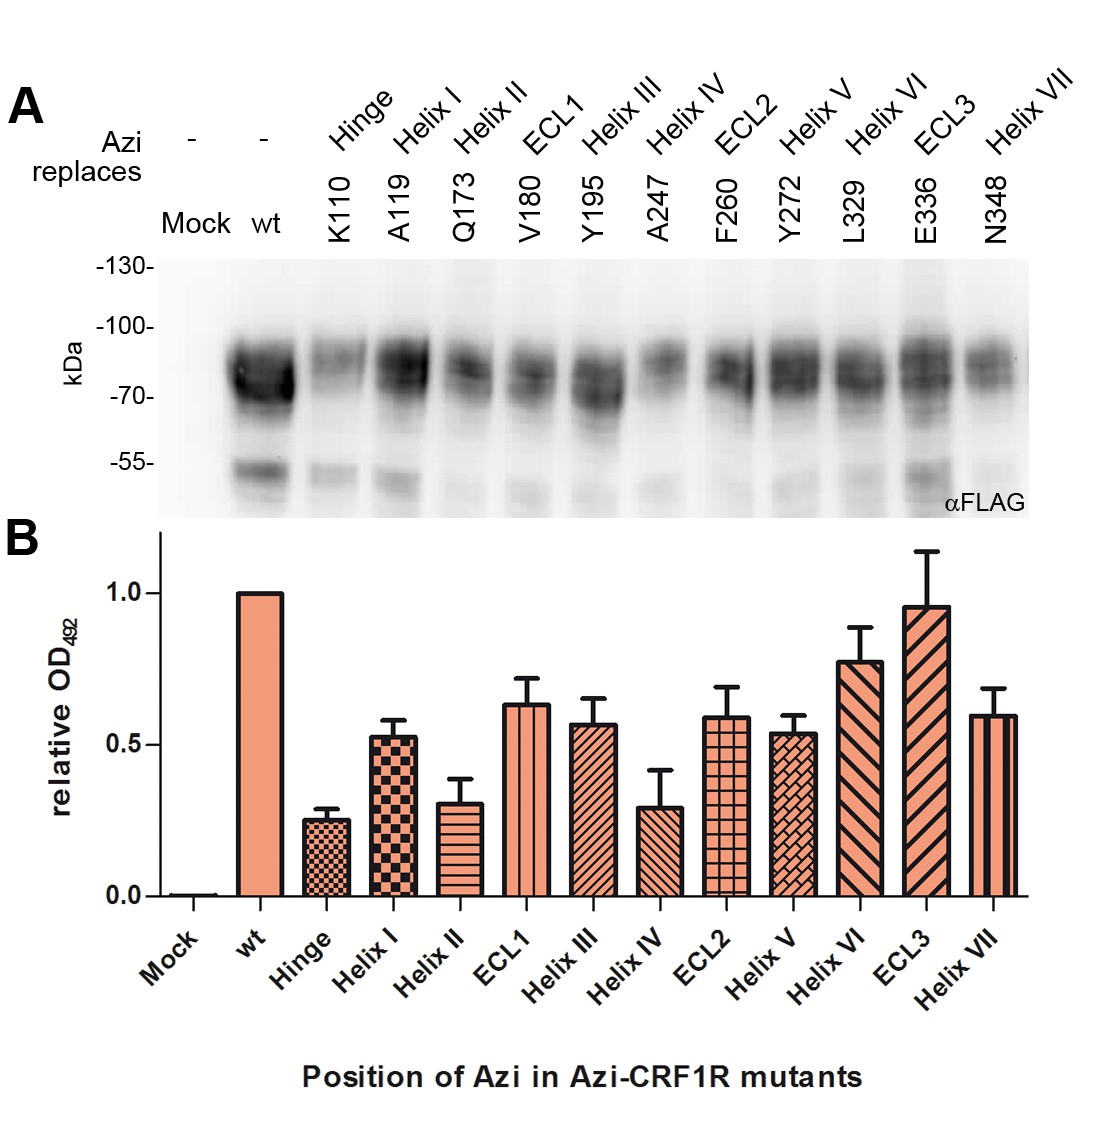
Expression profiles of a subset of Azi-CRF1R mutants.
Western blot analysis of expression levels of the whole set of mutants used in this study has been reported previously (Coin et al., 2013). Based on those results, we selected here a representative mutant for each domain of CRF1R (top row). (A) Whole-cell lysates of 293T cells transiently expressing each Azi-CRF1R mutant were resolved on 10% SDS-PAGE and analyzed by Western blotting using an M2 anti-FLAG-HRP antibody. The Azi mutation site is indicated in the top row. The fully glycosylated mature CRF1R runs at an apparent MW of ~70–100 kDa. Bands at a lower MW represent non-mature forms (Coin et al., 2013). (B) Whole-cell ELISA of HA-Azi-CRF1R mutants. The absorptions at 492 nm (OD492) are shown as mean ± s.e.m. obtained from three independent experiments each performed in triplicates and normalized to wild type (wt). The positions replaced by Azi are identical to (A).
Figure 2 with 1 supplement
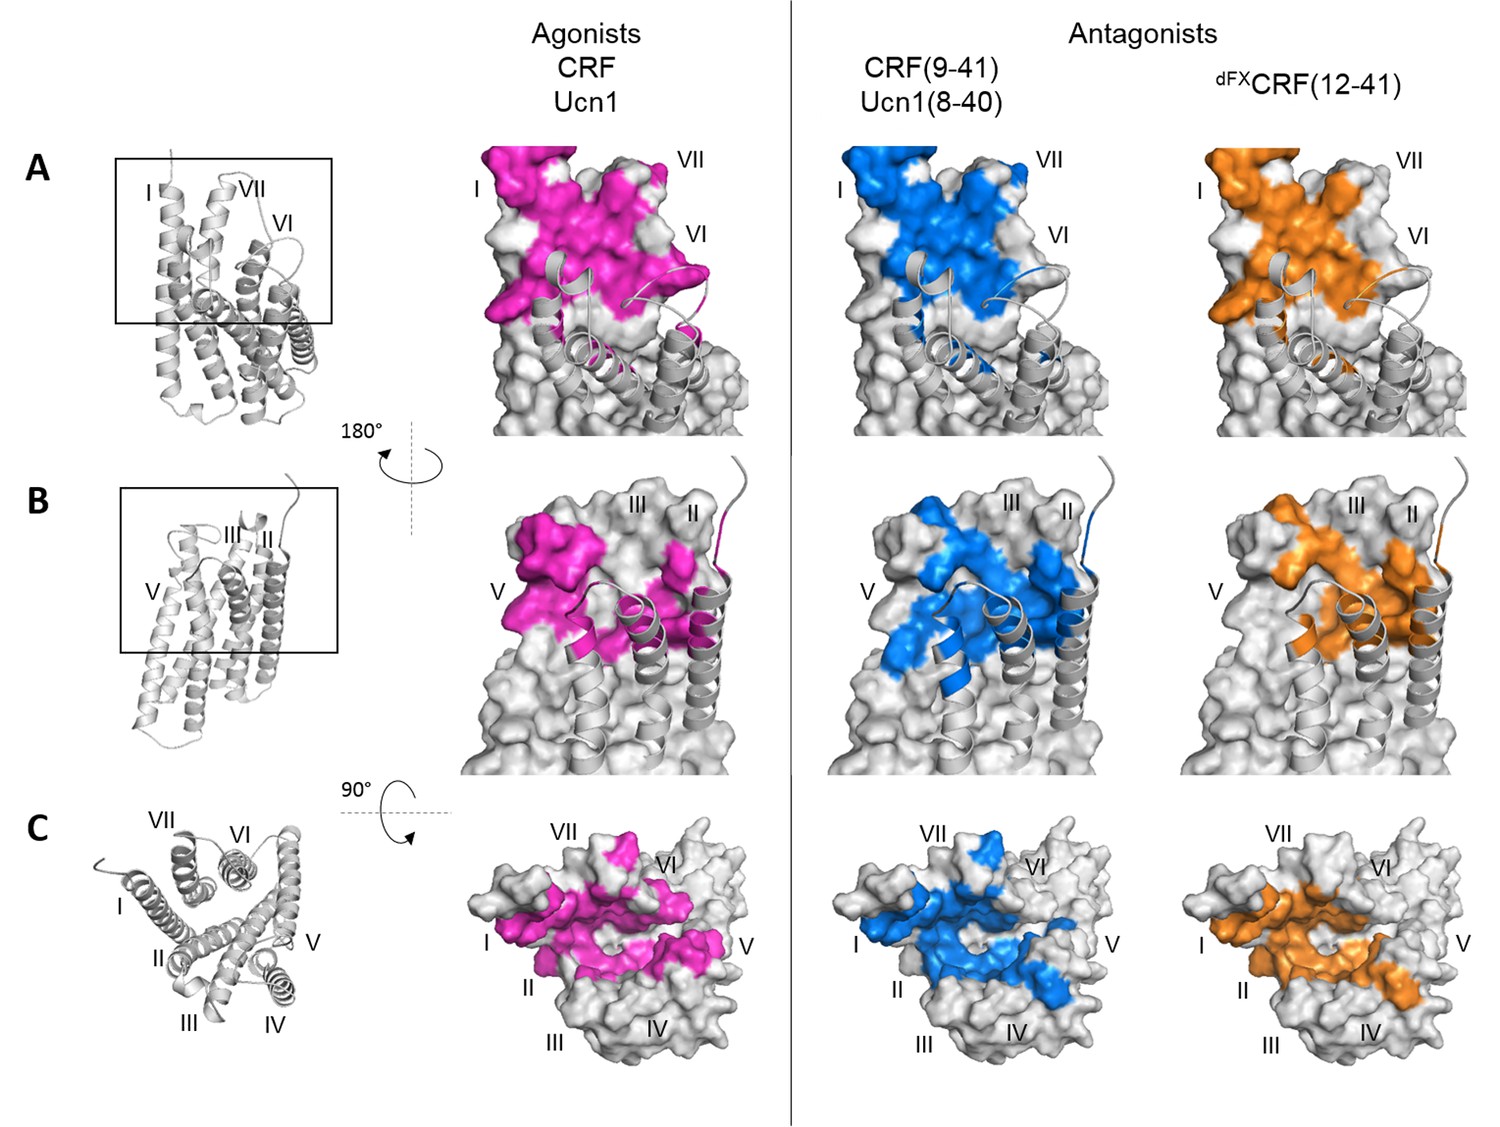
Footprints of peptide agonists and antagonists on CRF1R.
Surface representation of the CRF1R TMD adapted from Coin et al. (2013). The CRF1R ECD is not shown. Positions of CRF1R that crosslinked the ligand when substituted by Azi are highlighted. Footprints of the peptide agonists CRF and Ucn1 are highlighted in magenta and footprints of the antagonists CRF(9-41) and Ucn1(8-40) in blue. The footprint of the antagonist dFXCRF(12-41) is highlighted in orange. (A) Side view of the binding pocket from the membrane plane showing the surface of helices I, VI and VII. Helices II, III, IV and V are drawn as cartoon. (B) Side view of the binding pocket from the membrane plane showing the surface of helices II, III, IV and V. Helices I, VI and VII are drawn as cartoon. (C) Top view into the binding pocket from the extracellular side.
Figure 2—figure supplement 1
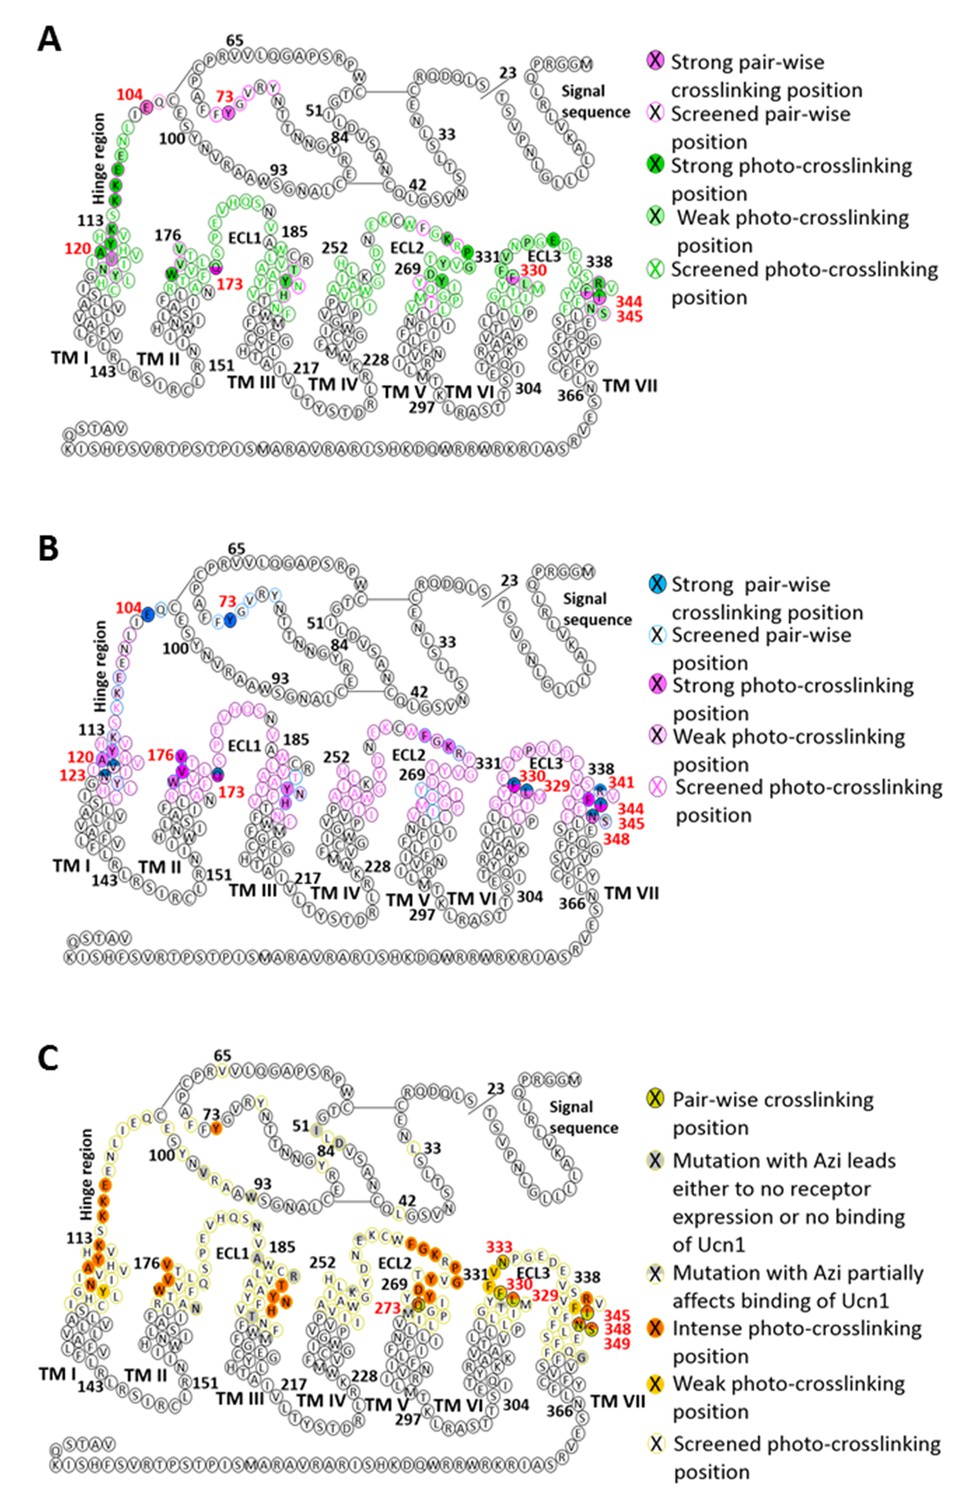
Snake plot of rat CRF1R with highlighted pair-wise and photo-crosslinking data obtained with (A) CRF, (B) dFXCRF(12-41) and (C) Ucn1 (adapted from [Coin et al., 2013]).
TM domains are represented on the basis of the crystal structure of the CRF1R TMD (PDB: 4K5Y) (Hollenstein et al., 2013).
Figure 3 with 1 supplement
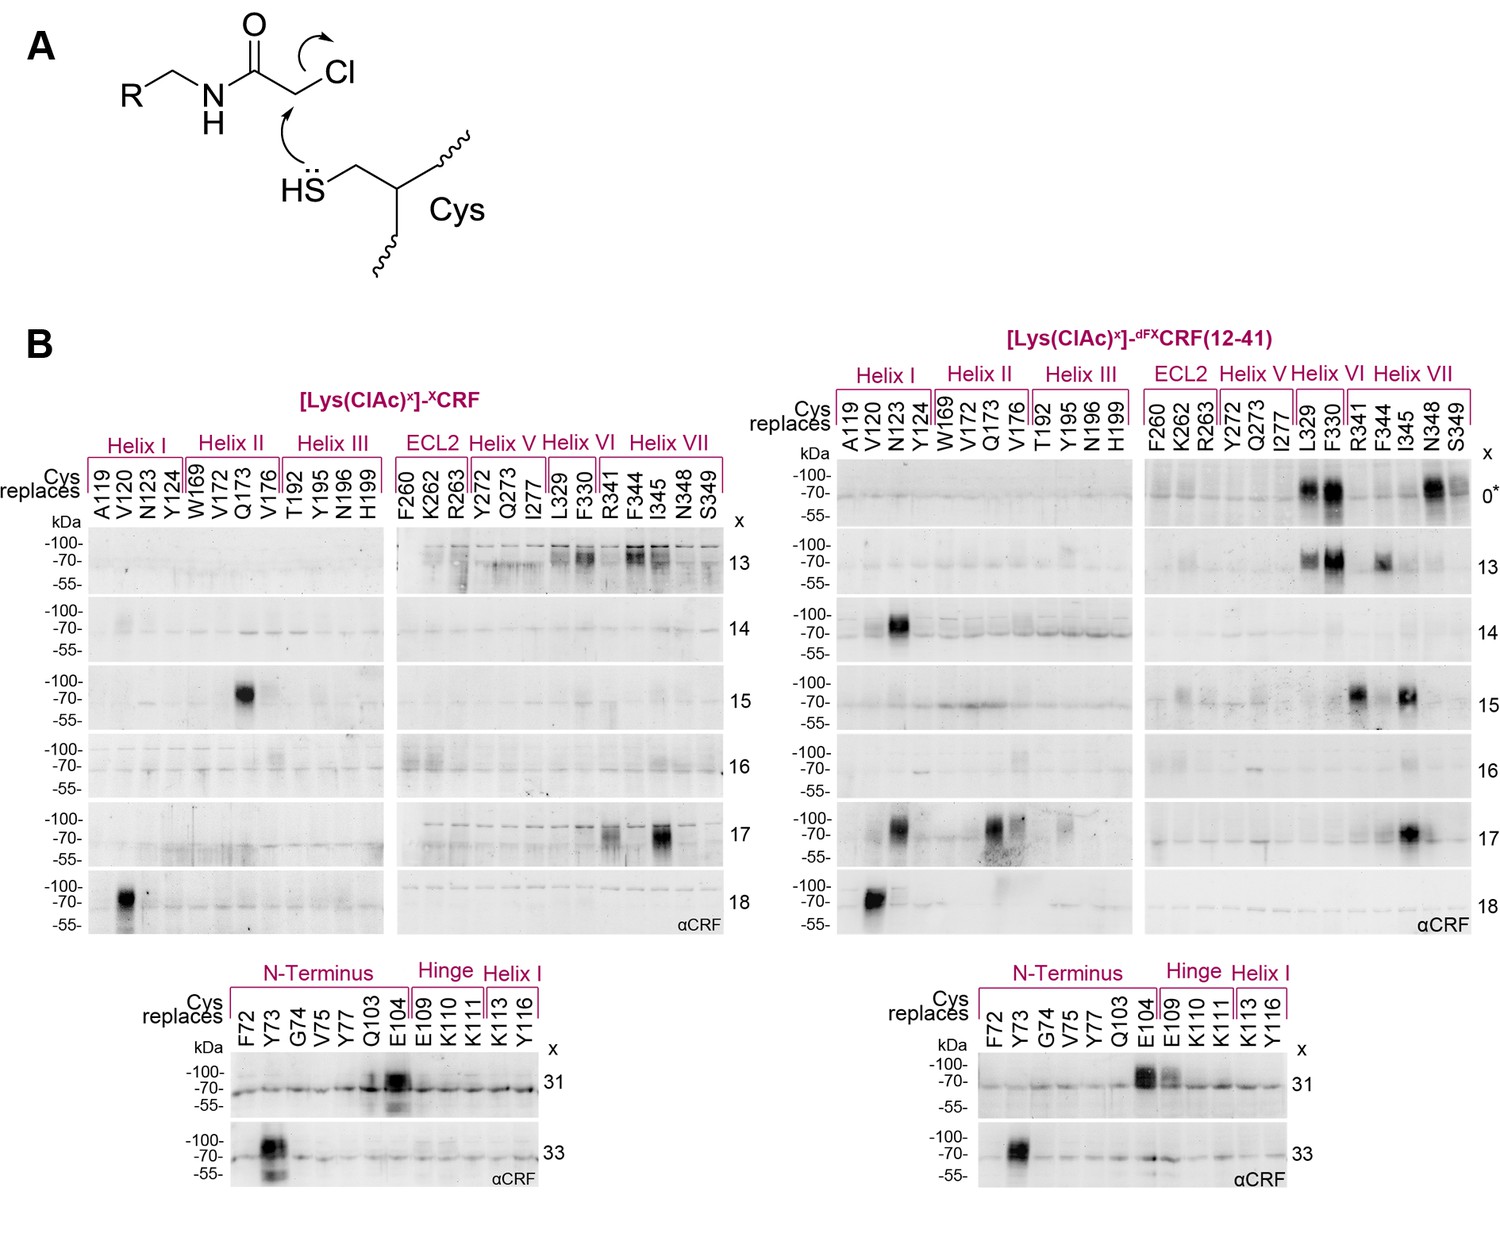
Cys-ClAc pair-wise crosslinking to pinpoint intermolecular pairs of proximal amino acids in ligand-CRF1R complexes.
(A) Nucleophilic substitution reaction between a cysteine (Cys) thiol and a α-chloroacetamide (ClAc) moiety. (B) Transiently transfected 293T cells expressing each Cys-CRF1R mutant were incubated with each of the ClAc-peptide ligands. The mutation site in CRF1R is indicated in the upper row. The positions of ClAc moiety in the ligands are indicated in the right column of each panel. The peptide indicated with a star (*) bears the ClAc not on the side chain of a Lys, but directly on the N-terminus (see Table 1). Whole-cell lysates were separated on 10% SDS-PAGEs and analyzed by Western blotting using an anti-CRF antibody. The non-deglycosylated ligand-CRF1R complex runs at an apparent molecular weight of ~70–100 kDa (Coin et al., 2013). The non-crosslinked ligand is not detected (MW ~3–4 kDa). Signals were considered as hits if their intensity was higher than a threshold defined as 50% of the most intense signal per ligand.
Figure 3—figure supplement 1
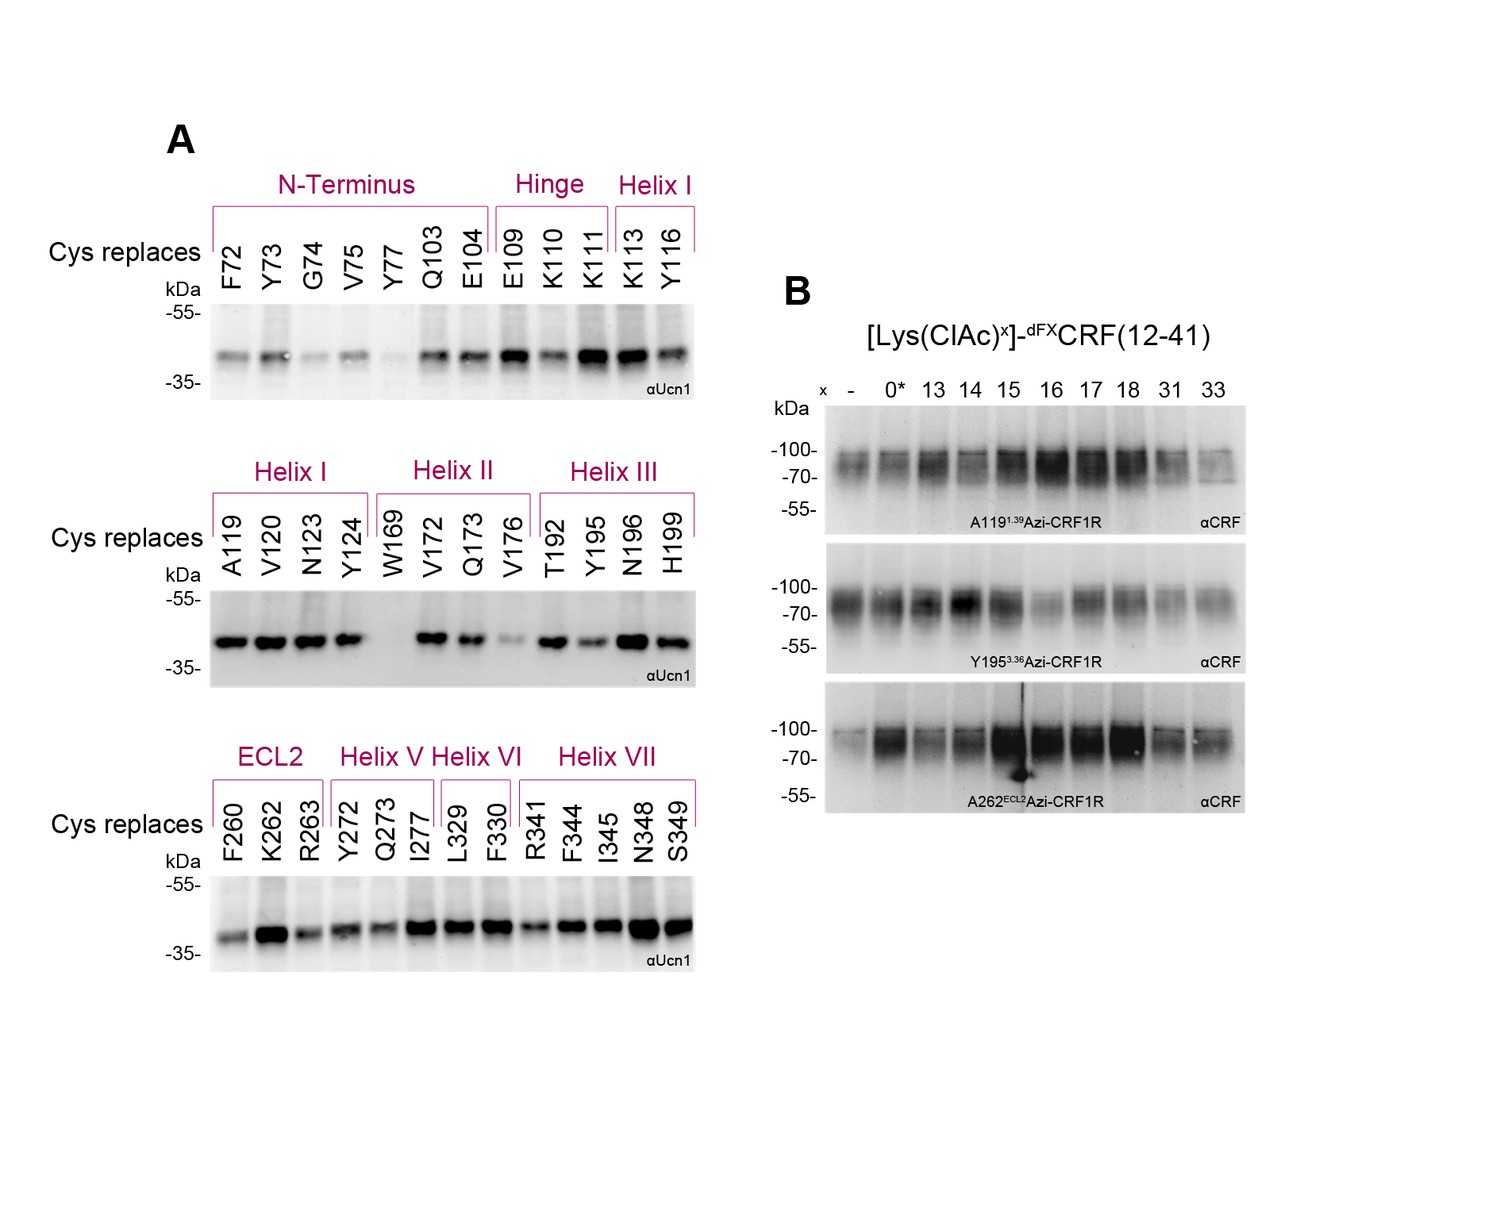
Photo-labeling of Cys-CRF1R mutants and photo-crosslinking of [Lys(ClAc)]-dFXCRF(12-41) analogues.
Whole-cell lysates of transiently transfected 293T cells were separated on 10% SDS-PAGE gels and analyzed by Western blotting using an anti-ligand antibody as indicated. The non-crosslinked ligands were not detected (MW ~3–4 kDa). (A) To ensure that the Cys-CRF1R mutants are expressed on the cell surface and still retain the ability to bind CRF1R ligands, cells expressing each of the mutants were photo-labeled with 100 nM [Bpa12]-Ucn1. The latter is a Ucn1 analogue containing the photo-activatable amino acid p-benzoyl-Phe (Bpa), which binds to CRF1R with about the same affinity as Ucn1 and gives high labeling yields of the receptor at the cell surface (Kraetke et al., 2005). The residues noted at the top of each panel indicate the Cys-mutation site in CRF1R. The lysates were deglycosylated by PNGase F to obtain sharper bands. The detected bands refer to the covalent [Bpa12]-Ucn1-CRF1R complex running at an apparent MW of ~40 kDa and demonstrate that the labeled mutants are expressed at the cell surface and able to bind the ligand. Except for Y77ECDC-CRF1R and W1692.64C-CRF1R, all mutants gave a detectable crosslinking band. (B) To assess whether the dFXCRF(12-41) analogues containing ClAc moieties bind CRF1R, each of the peptide antagonists indicated at the top was applied to cells transiently expressing A1191.39Azi-, Y1953.36Azi- and K262ECL2Azi-CRF1R mutants and crosslinked with UV light. The peptide indicated with a star (*) bears the ClAc not on the side chain of a Lys, but directly on the N-terminus (see Table 1). Bands corresponding to the fully glycosylated ligand-CRF1R complex at an apparent MW of ~70–100 kDa were detected with all Azi-CRF1R mutants for all nine ligands.
Figure 4
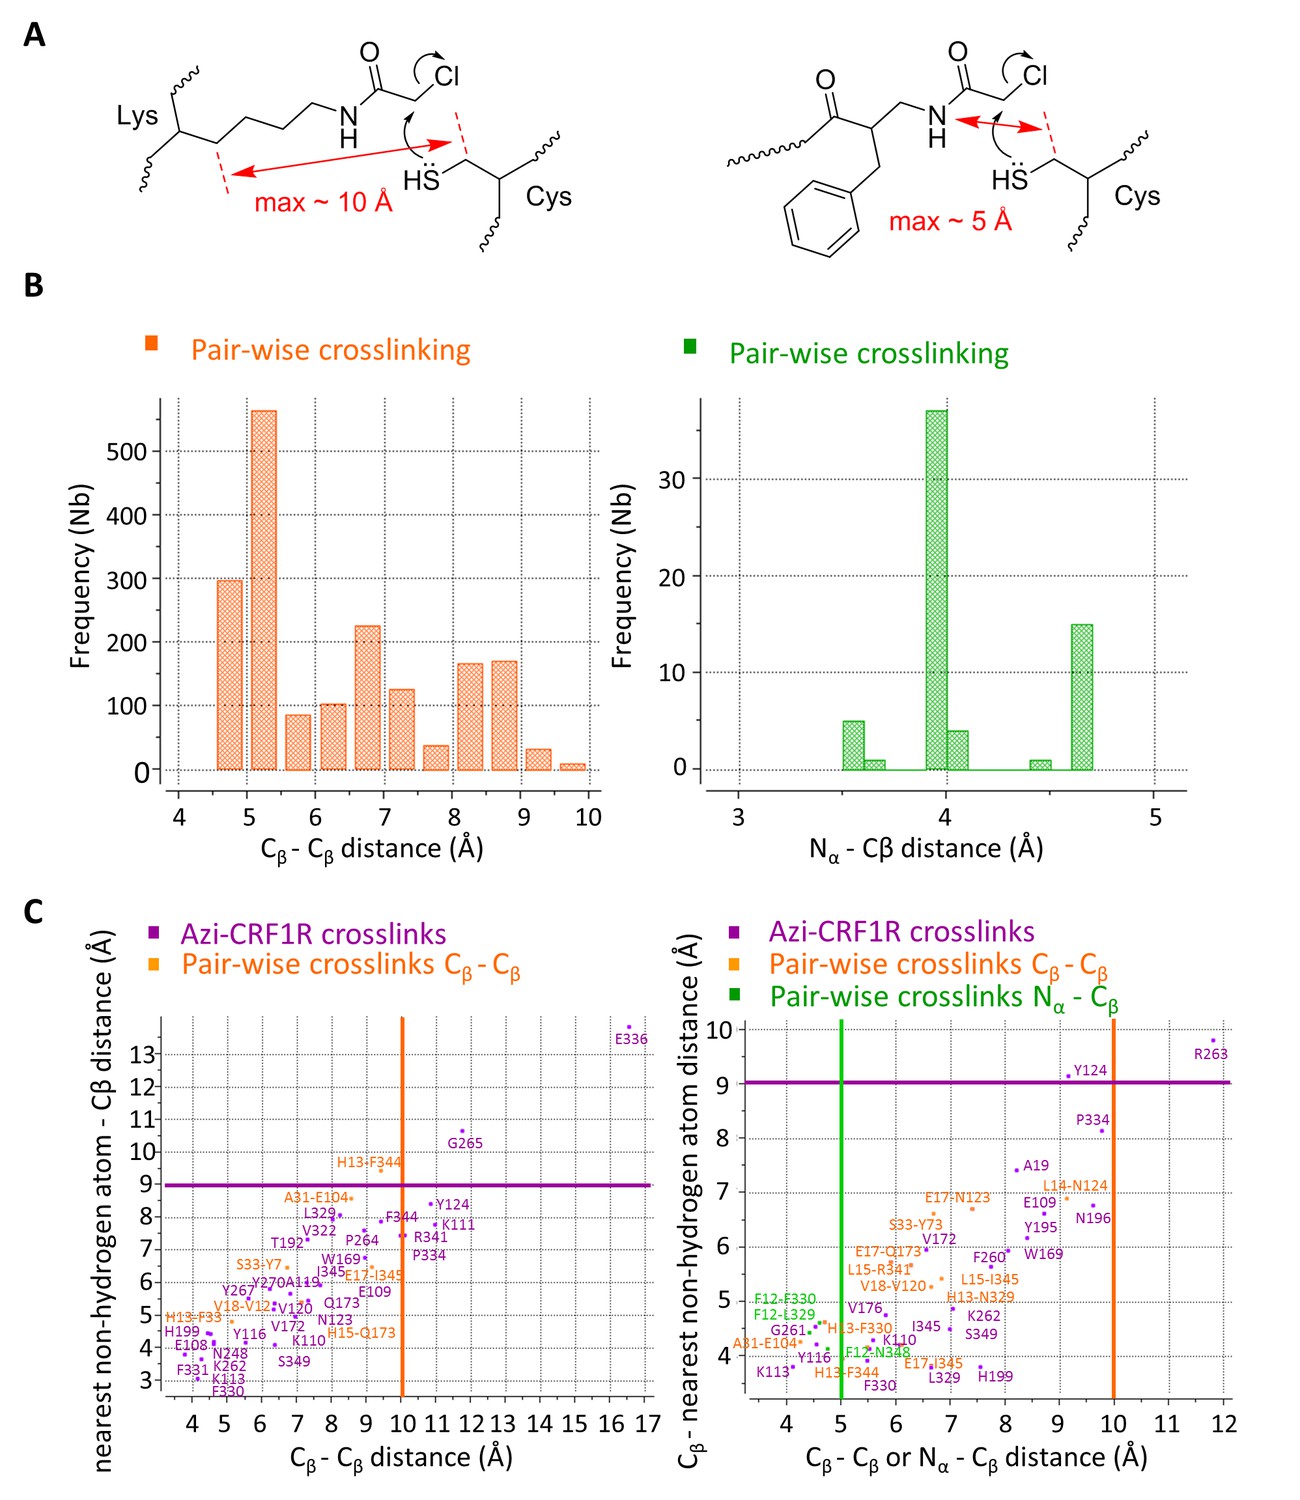
Atom-atom distances of residue pairs in the peptide-CRF1R complexes.
(A) Geometrical estimation of the Cβ-Cβ distance or N-Cβ distance for the ClAc-Cys reaction to happen when the ClAc moiety is installed on the side chain of a Lysine residue (left) or at the N-terminus of the peptide (right). (B) Range of sterically possible Cβ-Cβ distances (left) or N-Cβ distances (right) in the covalent crosslinked product for residues involved in pair-wise crosslinking. The distance range distributions were calculated based on the Monte Carlo sampling of the free molecule conformations in ICM software. (C) Measured distances for Azi photo-crosslinking and pair-wise chemical crosslinking hits between ligand and receptor in the predicted model of the CRF-CRF1R (left) and the dFXCRF(12-41)-CRF1R complex (right). For Azi photo-crosslinking hits (magenta), distances are measured from the Cβ atom of the indicated CRF1R residue to the nearest Cβ atom of CRF (x-axis) or to the nearest non-hydrogen atom of CRF (y-axis) or dFXCRF(12-41). For pairs of amino acids involved in chemical crosslinking, distances plotted along the x-axis are measured either as Cβ-Cβ (orange) or N-Cβ (green). The horizontal magenta line shows the approximate 9 Å radius for the reach of Azi crosslinking (from Cβ of Azi), vertical lines show the approximate 10 Å (orange) and 5 Å (green) cutoff for pair-wise crosslinking between Cβ-Cβ or N-Cβ, respectively.
Figure 5 with 2 supplements
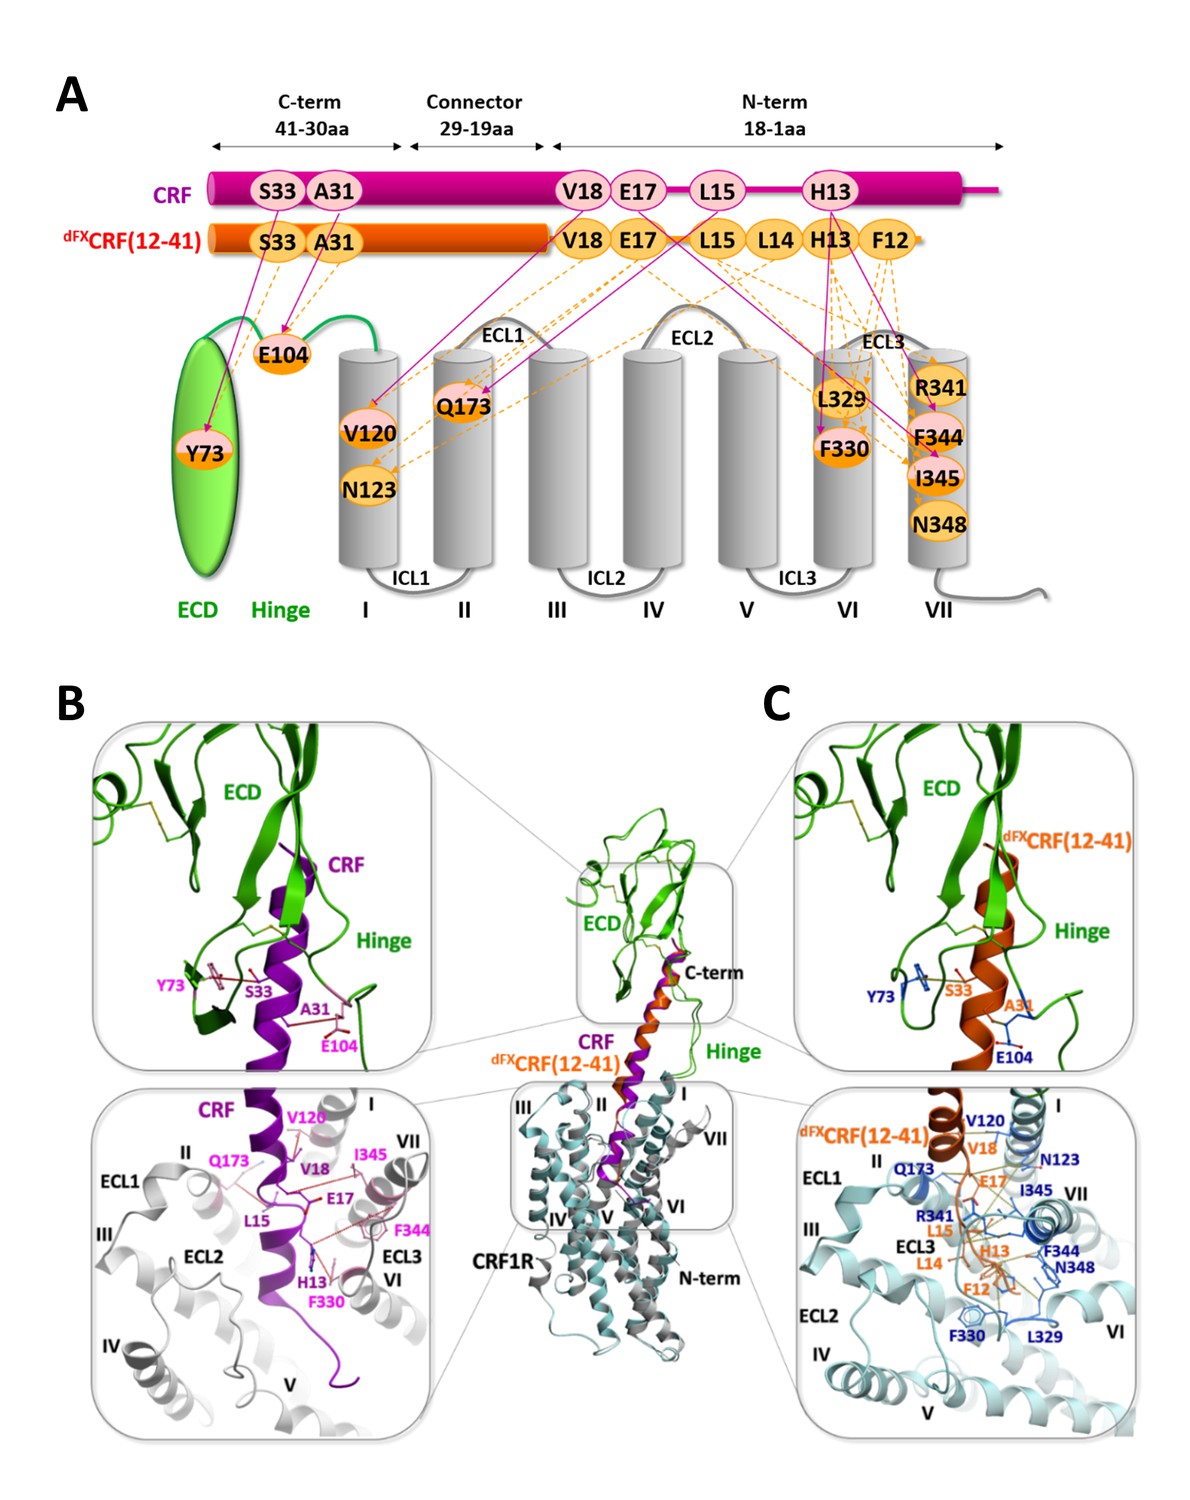
Comparison of the agonist-bound model CRF-CRF1R with the antagonist-bound model dFXCRF(12-41)-CRF1R.
(A) Pair-wise crosslinking hits of CRF (magenta) and dFXCRF(12-41) (orange). (B, C) Overall view and zoom into the details of the superimposed models of the CRF (magenta)-CRF1R (grey) complex and the dFXCRF(12-41) (orange)-CRF1R (light blue) complex. The framed sections are magnified in the panels (B) (CRF-CRF1R) and (C) (dFXCRF(12-41)-CRF1R). Residue pairs shown in sticks and connected by dotted lines (distances are presented in Table 2) indicate distance restraints derived from pair-wise crosslinking.
Figure 5—figure supplement 1
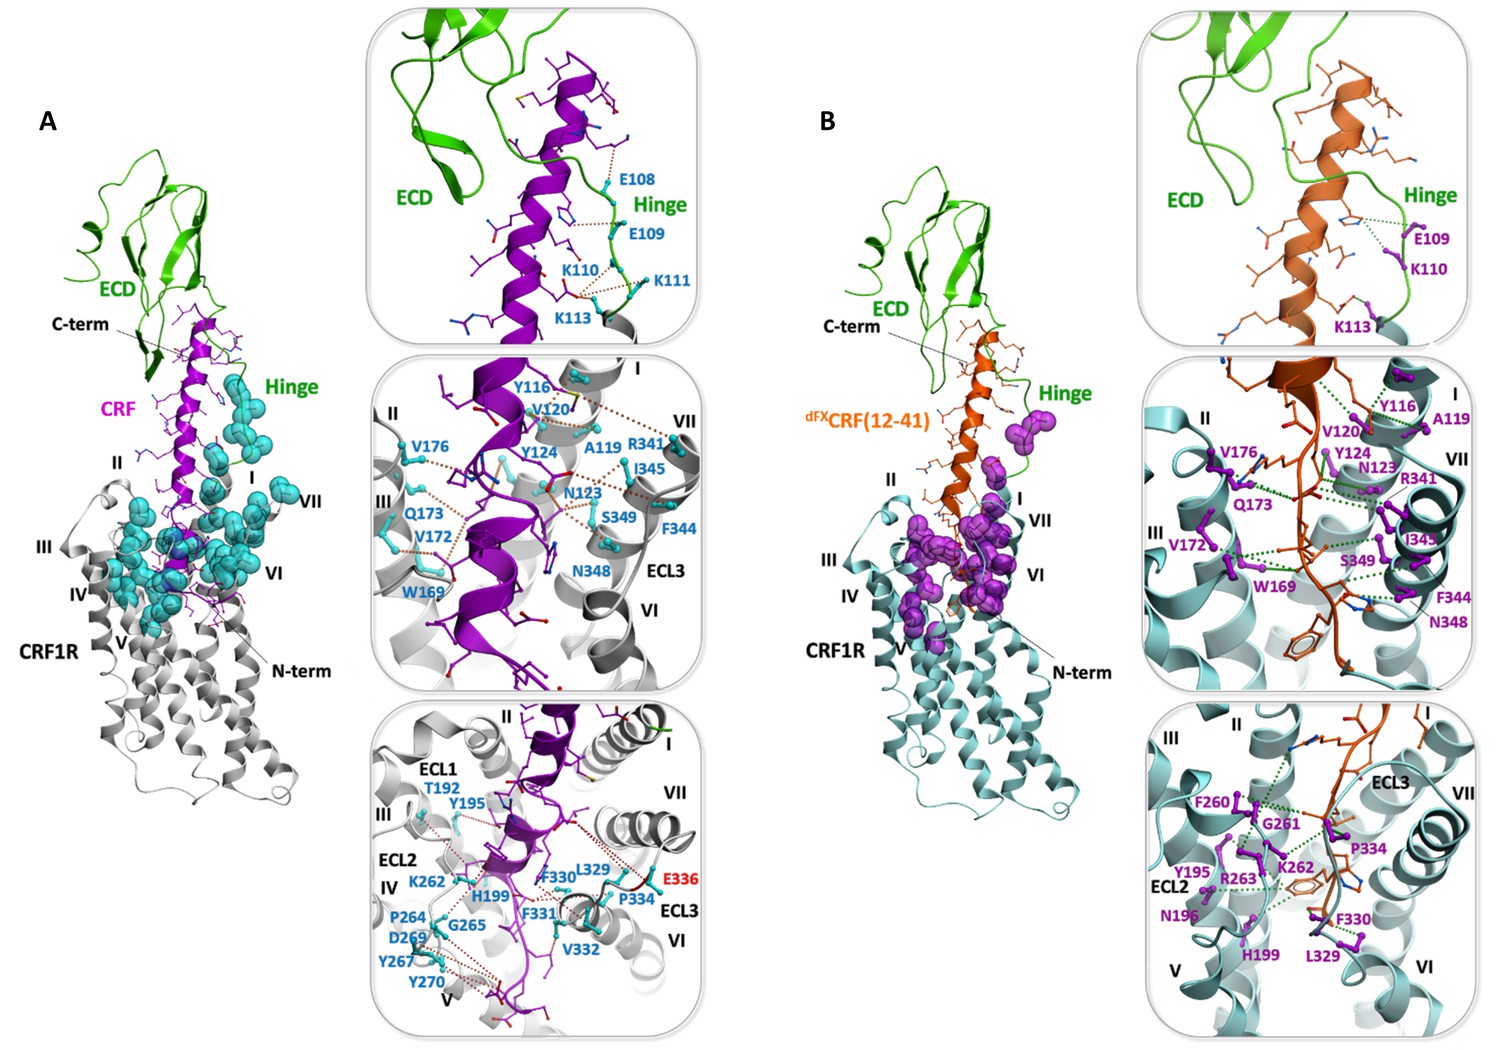
Validation of the peptide-CRF1R complexes by photo-crosslinking hits.
(A) Validation of the CRF-CRF1R complex. (B) Validation of the dFXCRF(12-41)-CRF1R complex. An overview of each model is shown on the left. The peptide binding pocket is magnified in the panels on the right, showing the side view of the hinge region (top), helices I, II and VII (middle) and helices III, V and VI (bottom). The dotted lines connect positions in CRF1R identified by Azi photo-crosslinking screen (cyan or magenta, sticks are shown only up to Cβ) with the nearest non-hydrogen atom of CRF (magenta) or dFXCRF(12-41) (orange). Peptide side chains are shown as sticks. All distances shown, except for residue E336ECL3 (red label), are shorter than 9 Å.
Figure 5—figure supplement 2
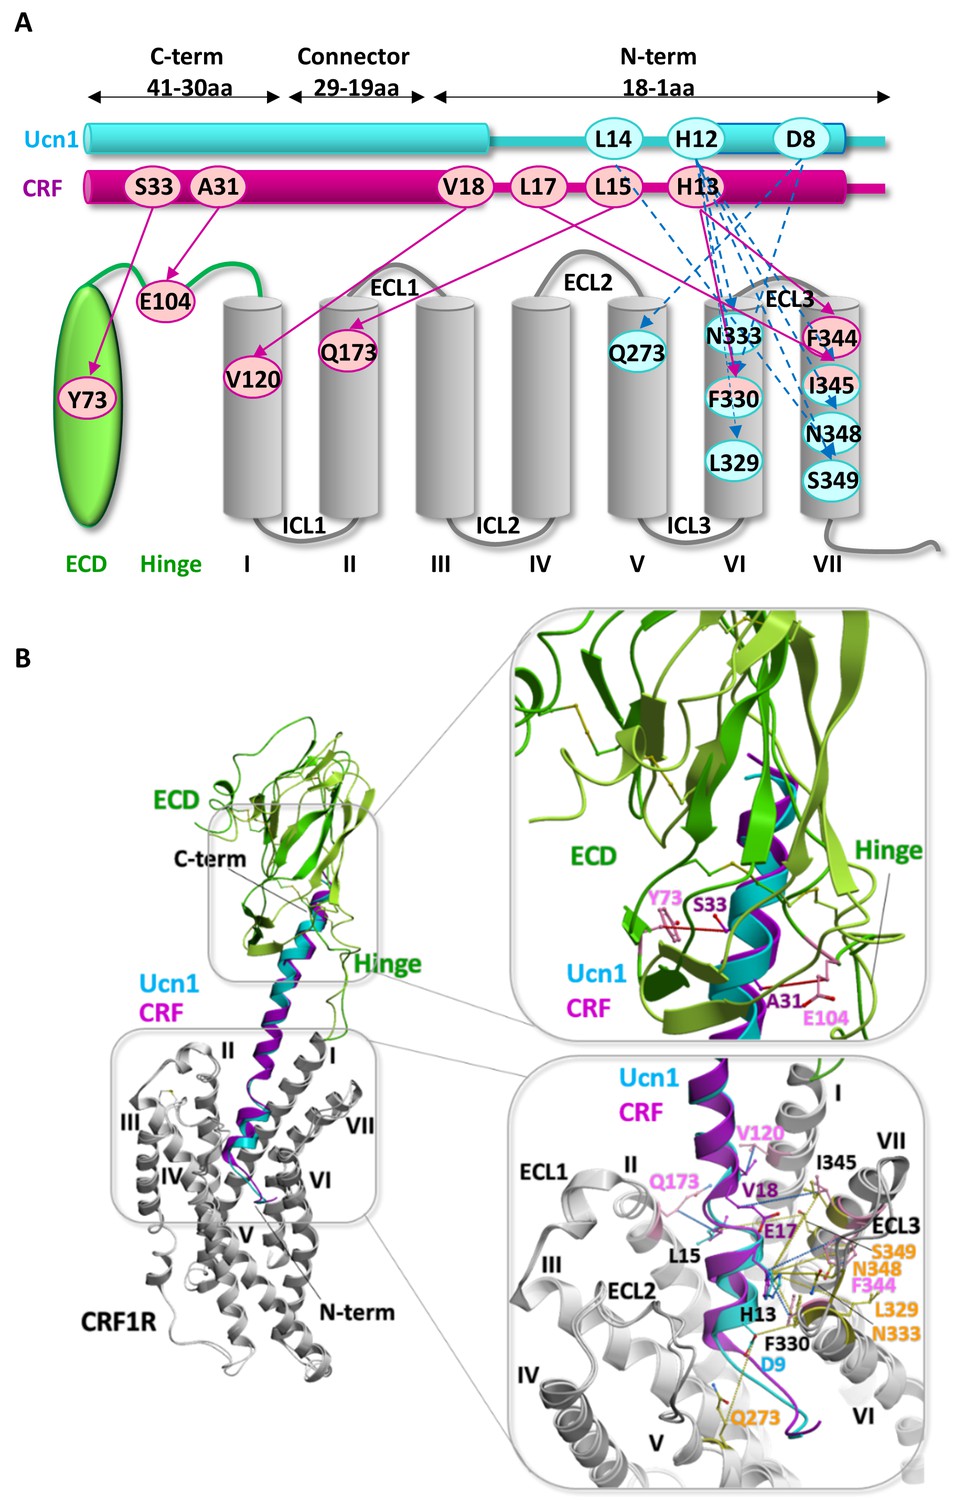
Comparison of the two agonist-bound models Ucn1-CRF1R and CRF-CRF1R.
(A) Pair-wise crosslinking hits of Ucn1 (cyan) and CRF (magenta) with CRF1R. Notably, pair-wise crosslinking was performed using different electrophilic moieties and a different experimental approach in the two cases. For the Ucn1-CRF1R complex, the electrophilic p-2′-fluoroacetylphenylalanine (Ffact) was genetically incorporated into the receptor and Cys residues were incorporated into the ligand. For the CRF-CRF1R complex, the Lys(ClAc) electrophilic moiety was incorporated into the ligand and Cys in the receptor. The two different approaches yielded two distinct sets of pair-wise crosslinking hits, sharing only one overlapping restraint to F3306.56 (H13CRF, H13Ucn1). The models of both peptide complexes, however, are absolutely consistent with each other, validating the predictive power of the models. (B) Side view of the superimposed models of the Ucn1 (cyan)-CRF1R complex and the CRF (magenta)-CRF1R complex. The peptide-binding pocket is magnified showing the interactions with ECD and TMD. Residue pairs shown in sticks (Ucn1: cyan and yellow, CRF: magenta and pink) and connected by dotted lines (Ucn1: blue, CRF: red, distances are presented in Table 3) indicate distance restraints derived from pair-wise crosslinking.
Figure 6
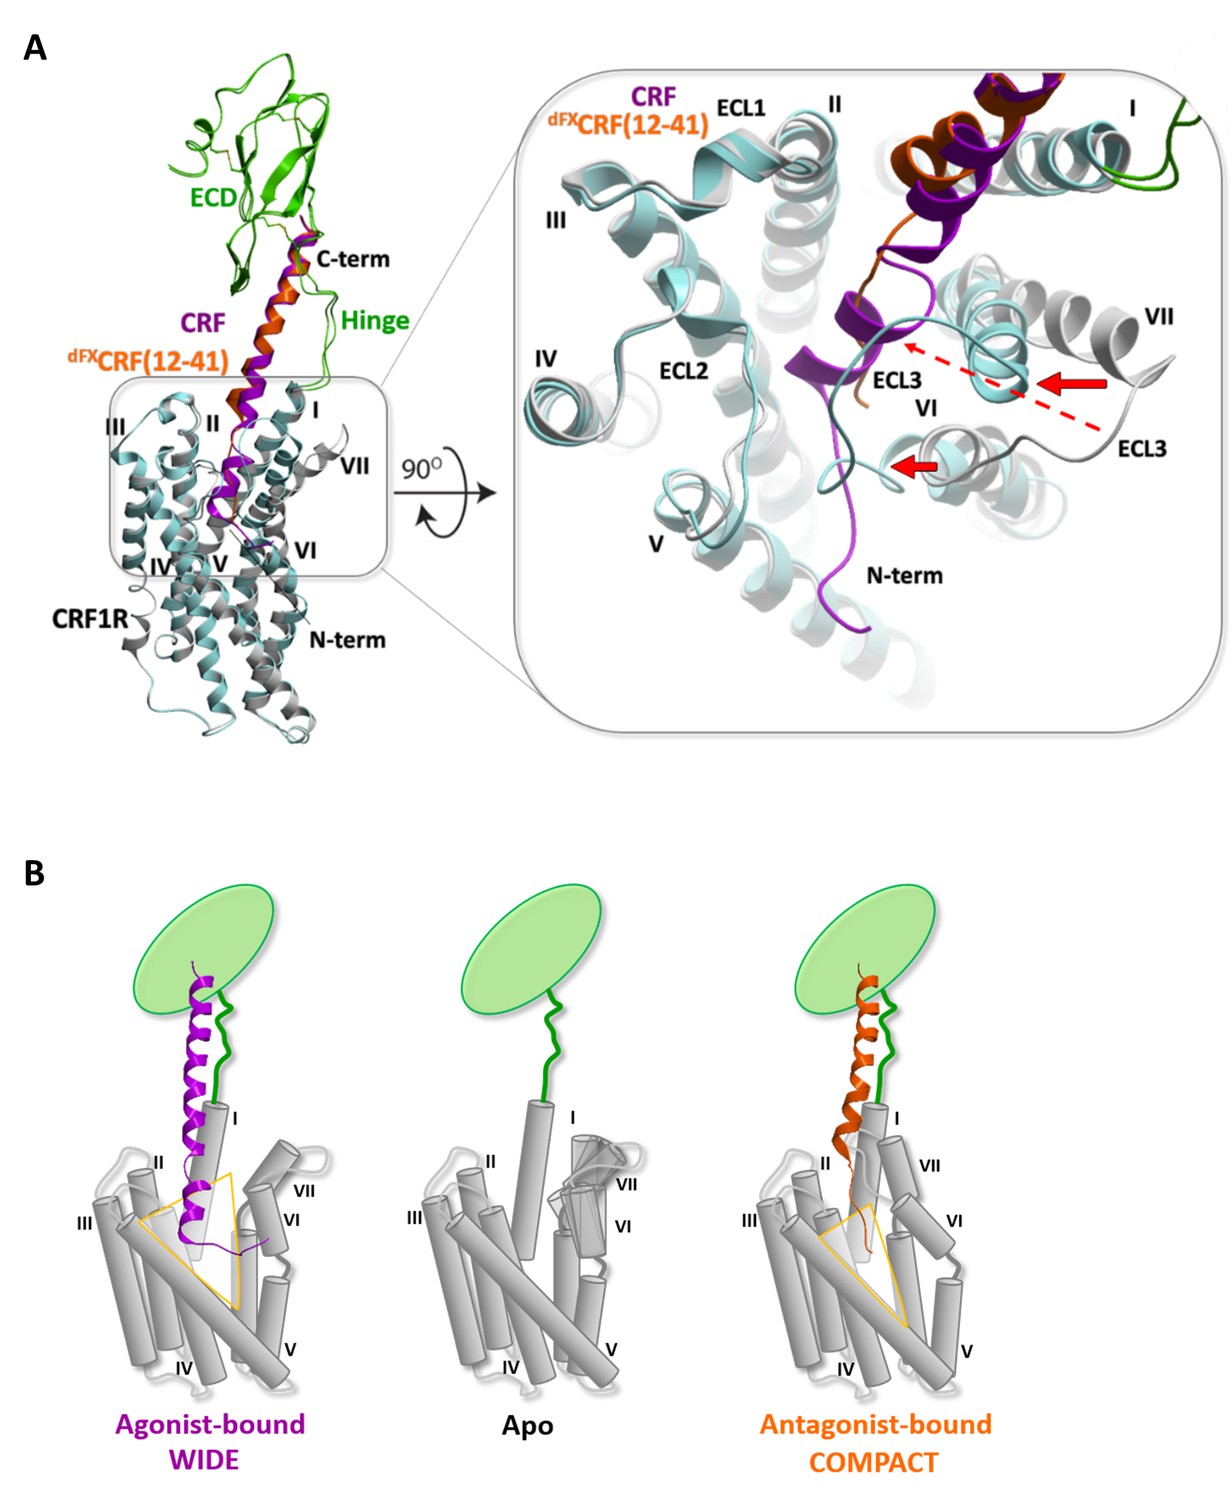
Conformational changes within the receptor between the agonist- and antagonist bound complexes.
(A) Overall view and extracellular zoom into the binding pocket of the superimposed models CRF (magenta)-CRF1R (grey) and dFXCRF(12-41) (orange)-CRF1R (light blue) highlighting the inward shift of helices VI and VII in the antagonist-bound model. (B) Schematic presentation of the active CRF (magenta)-CRF1R complex and the inactive dFXCRF(12-41) (orange)-CRF1R complex showing the predicted conformational changes between the ‘wide’ agonist-bound and the ‘compact’ antagonist-bound states of the receptor. Apo CRF1R is expected to have a more flexible conformation of the TMD and sample a range of conformations.
Figure 7 with 1 supplement
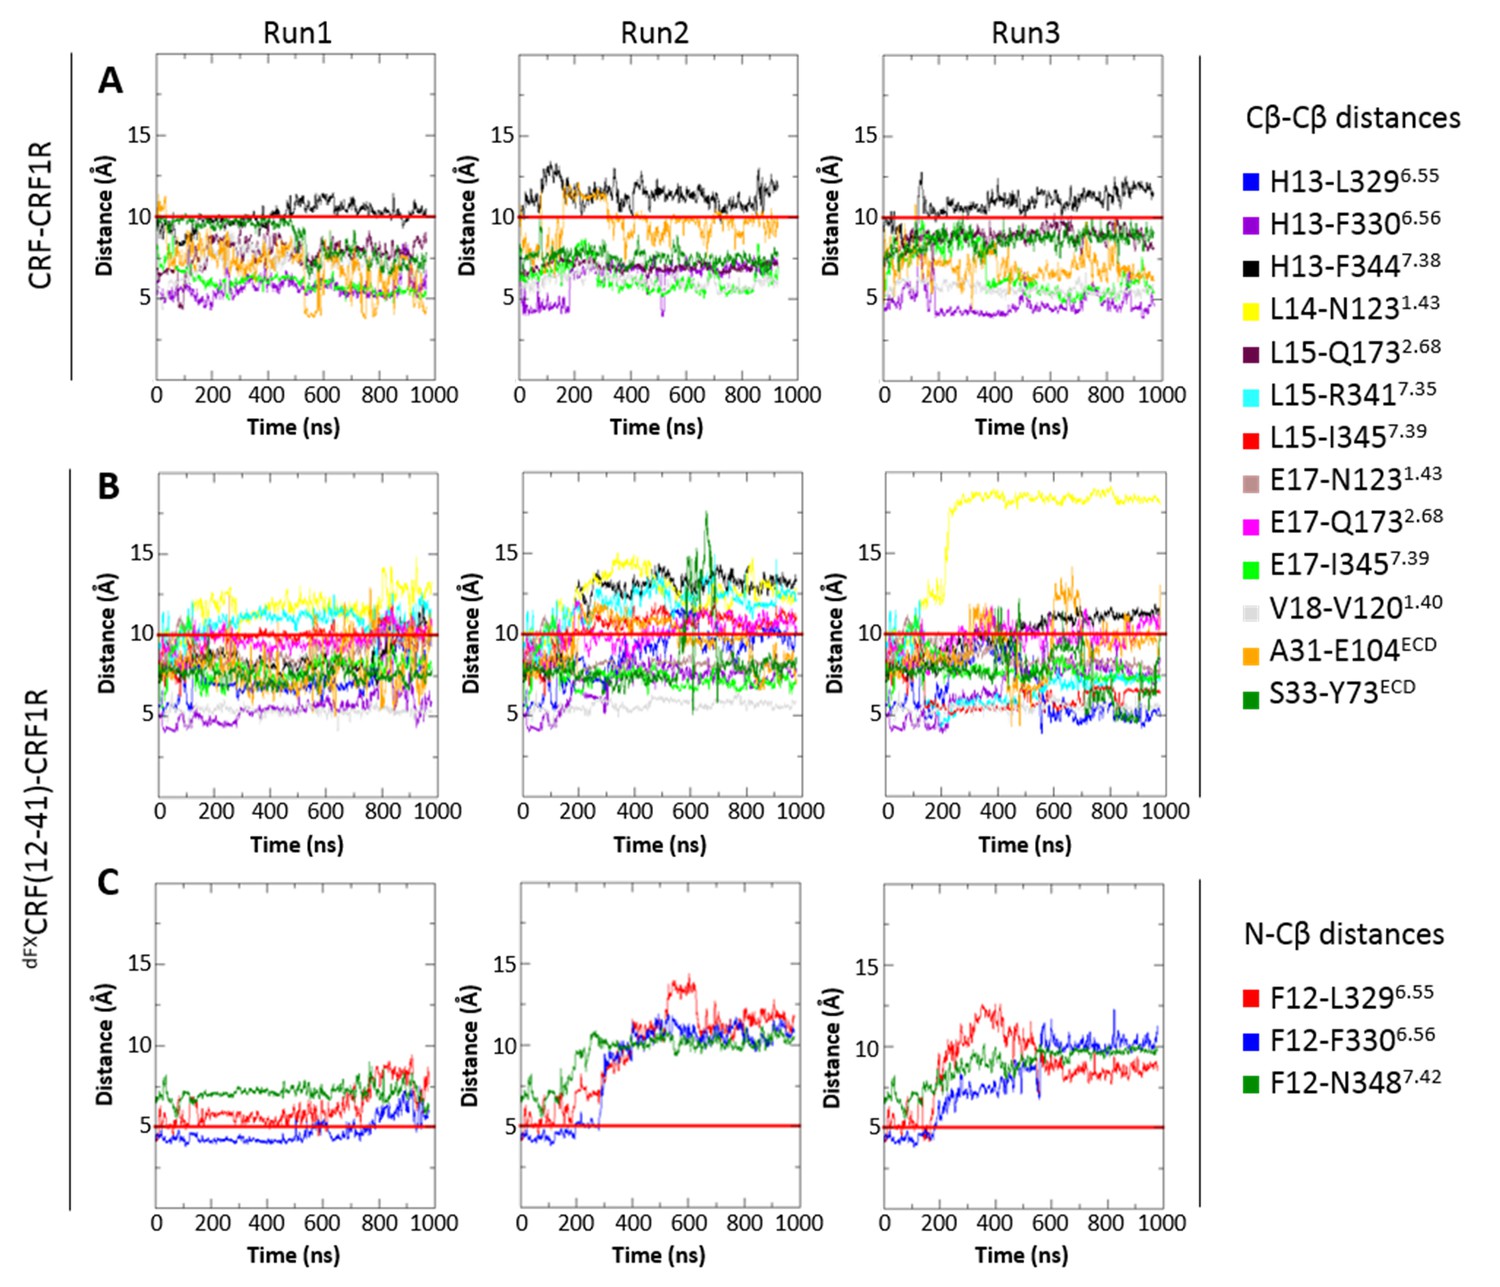
Interresidue distances during MD simulations.
(A) Cβ-Cβ distances of CRF-CRF1R residue pairs during the MD simulations of the CRF-CRF1R complex. (B, C) Cβ-Cβ (B) or N-Cβ (C) distances of dFXCRF(12-41)-CRF1R residue pairs during the MD simulations of the dFXCRF(12-41)-CRF1R complex. MD Run1 was performed under 7 (A) or 15 (B, C) harmonic distance restraints corresponding to the crosslinked residue pairs (see Table 2). In MD Run2 and Run3, the distance restraints were removed after 20 ns in each run. The red horizontal line represents the 10 Å (A, B) or 5 Å (C) distance threshold.
Figure 7—figure supplement 1
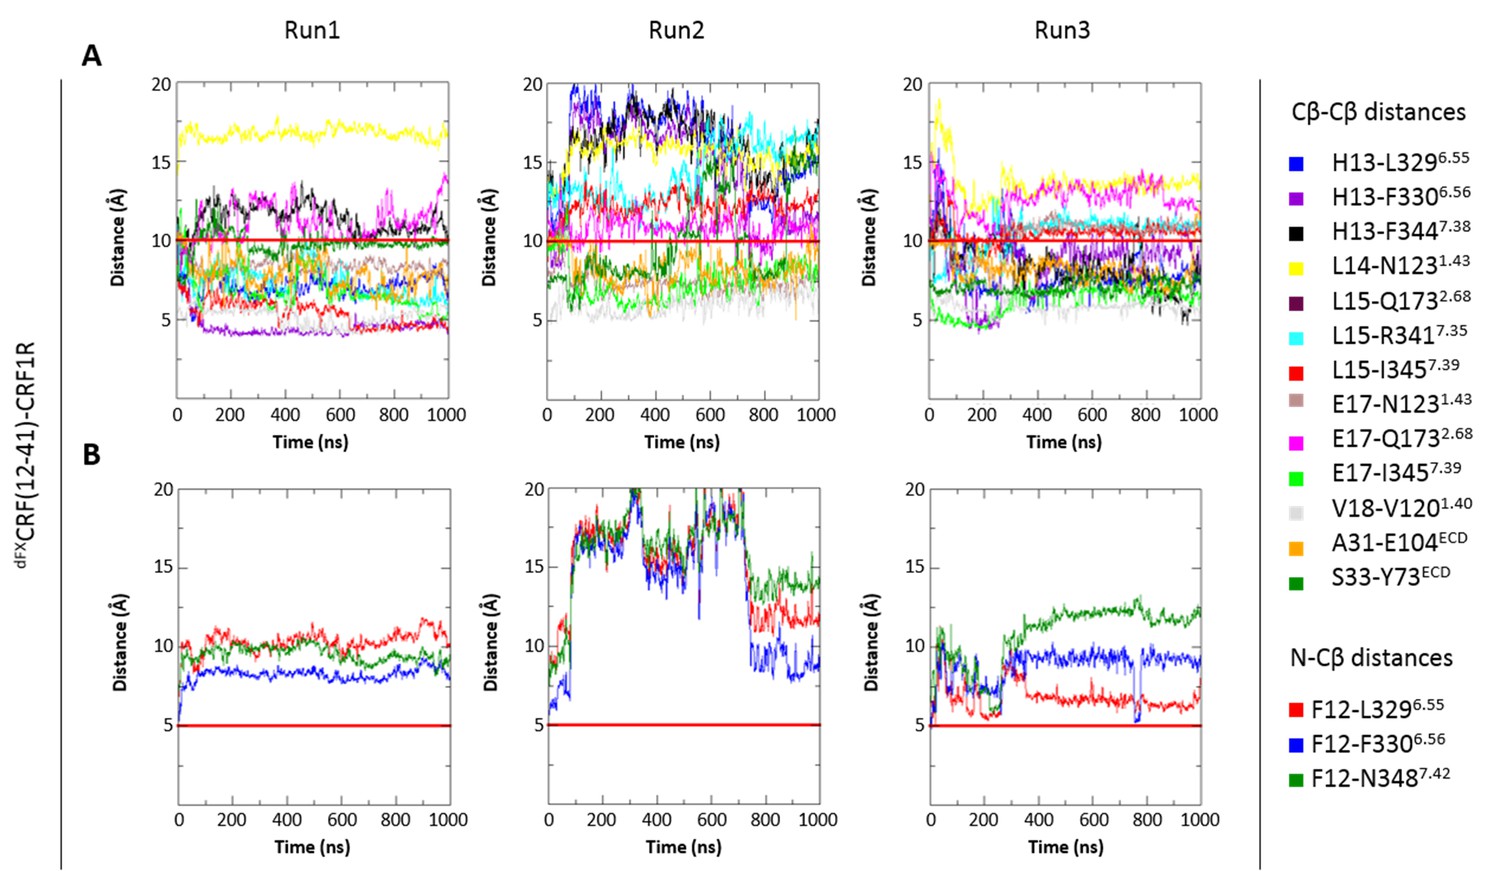
Interresidue distances during control MD simulations of antagonist dFXCRF(12-41)-wide-CRF1R complex.
The initial ‘wide’ conformation of the ligand pocket was copied from the agonist-bound model and does not represent the fully optimized dFXCRF(12-41)-CRF1R complex conformation. (A) Cβ-Cβ distances of dFXCRF(12-41)-wide-CRF1R complex residue pairs during the MD simulations of the dFXCRF(12-41)-wide-CRF1R complex. (B) N-Cβ distances of dFXCRF(12-41)-wide-CRF1R residue pairs during the MD simulations of the dFXCRF(12-41)-wide-CRF1R complex. MD Run1 was performed under 15 harmonic distance restraints corresponding to the crosslinked residue pairs (see Table 2). In MD Run2 and Run3, the distance restraints were removed after 20 ns in each run. The red horizontal line represents the 10 Å (A) or 5 Å (B) distance threshold.
Figure 8
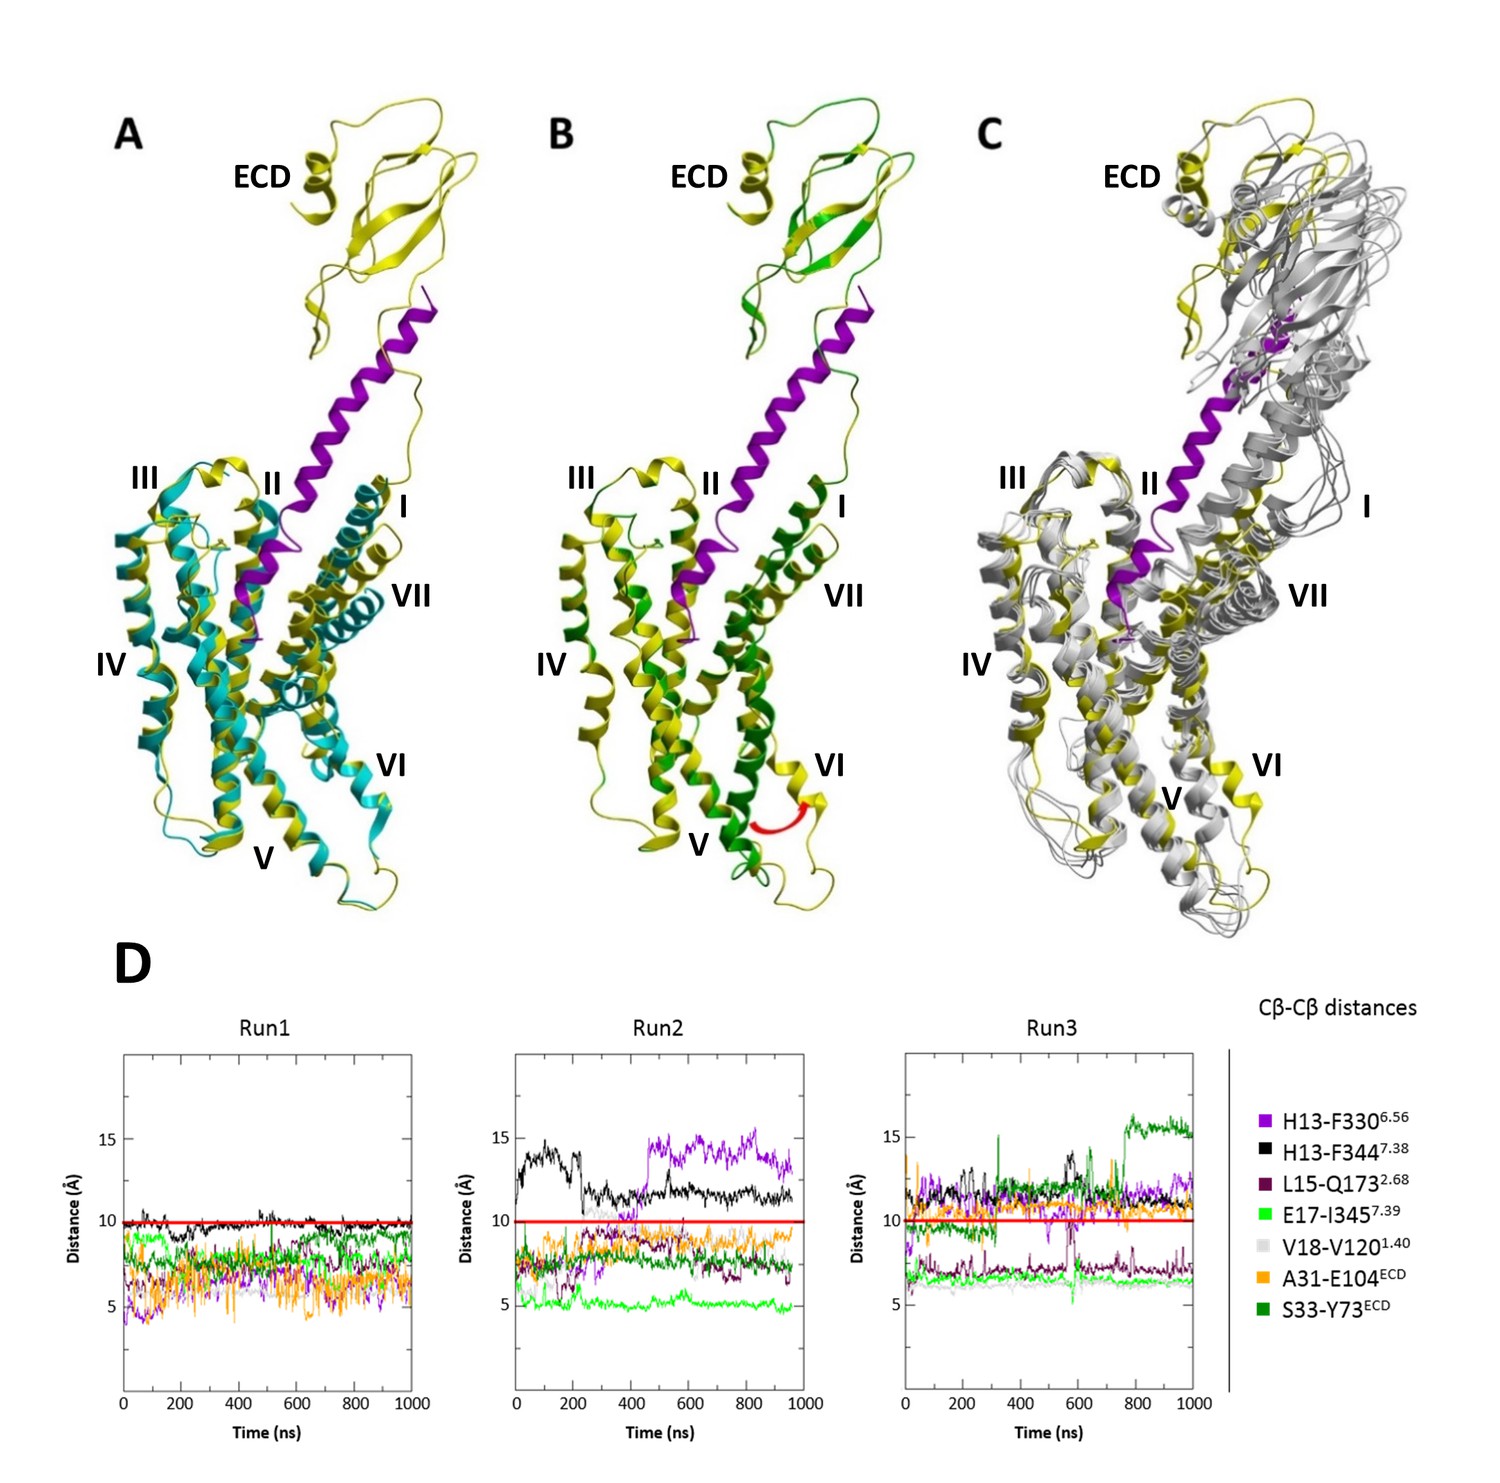
MD simulations of the modified CRF-CRF1R complex model with active-like conformation of the intracellular TMD region.
(A) Superimposition of the cryo-EM structure of calcitonin receptor (PDB ID: 5UZ7) (cyan) and the modified active-like CRF (magenta)-CRF1R (yellow) complex model with outward movement of helix VI. (B) Superimposition of the initial CRF (magenta)-CRF1R (green) model and active-like CRF (magenta)-CRF1R (yellow). The red arrow indicates the outward movement of the intracellular part of helix VI in the active-like CRF-CRF1R complex. (C) Superimposition of the active-like CRF (magenta)-CRF1R (yellow) model with MD simulation snapshots obtained at 200 ns, 400 ns, 600 ns, 800 ns and 1 μs (gray) of MD simulation (Run1). (D) Interresidue distances during MD simulations. Cβ-Cβ distances of CRF-CRF1R residue pairs during the MD simulations of the active-like CRF-CRF1R complex. MD Run1 was performed under 7 harmonic distance restraints corresponding to the crosslinked residue pairs (see Table 2). In MD simulation Run2 and Run3, the distance restraints were removed after 20 ns in each run. The red horizontal line represents the 10 Å distance threshold.
Figure 9
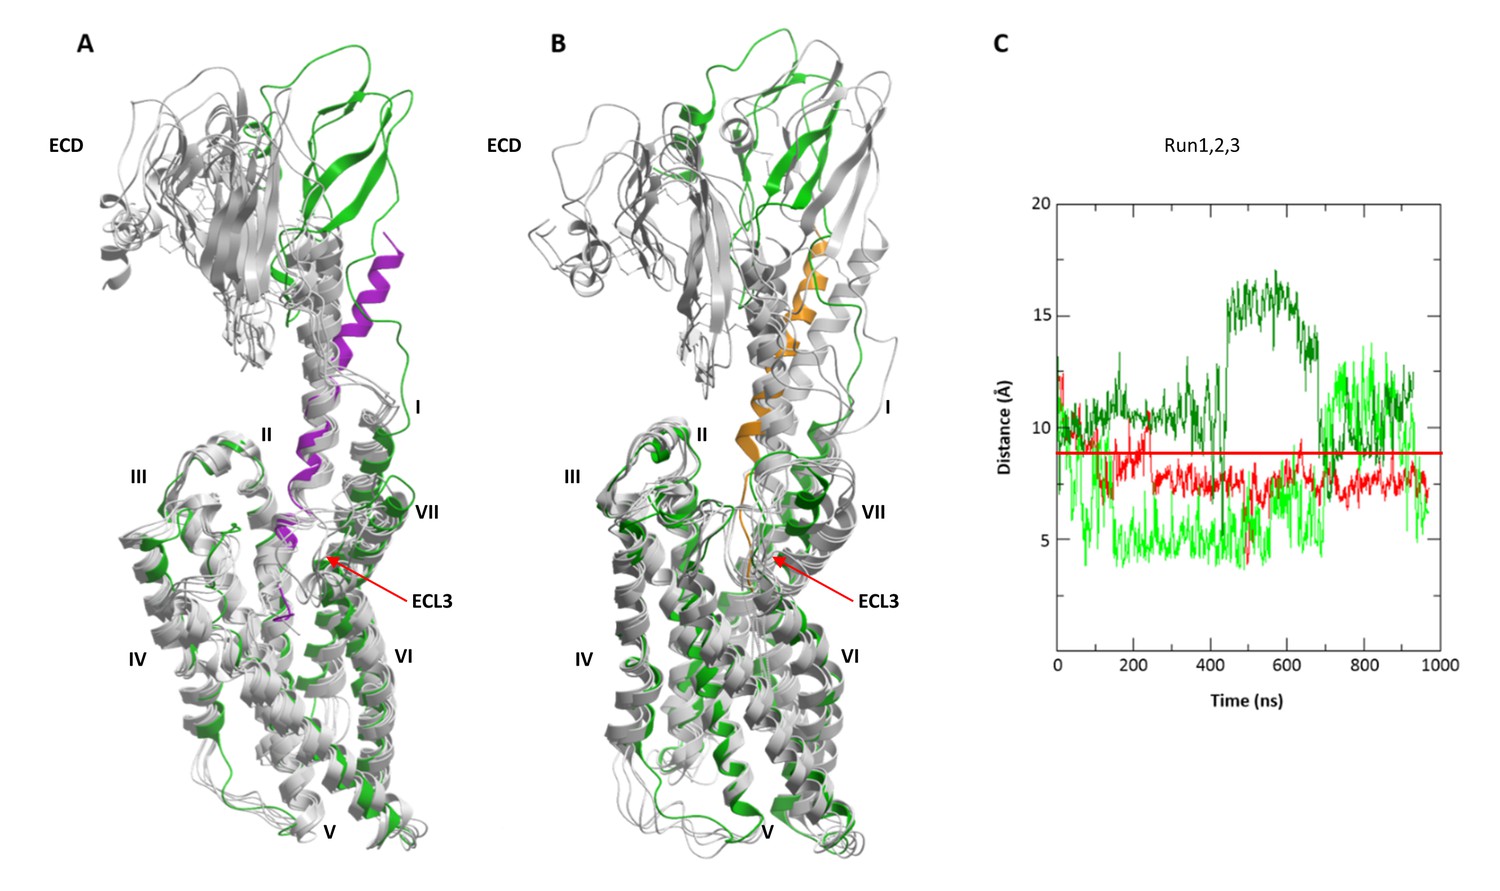
Conformational flexibility of ECD and ECL3 during MD simulations.
(A, B) The range of ECD movement. (A) Superimposition of the initial CRF (magenta)-CRF1R (green) model with models obtained at 200 ns, 400 ns, 600 ns, 800 ns and 1 µs (gray) of unrestrained MD simulation (Run2). (B) Superimposition of the initial dFXCRF(12-41) (orange)-CRF1R (green) model with models obtained at 100 ns, 200 ns, 300 ns, 400 ns and 500 ns (gray) of unrestrained MD simulation (Run2). (C) Conformational flexibility of ECL3 around residue E336ECL3 in MD simulations of agonist CRF-CRF1R complex. Traces show minimum distances between the Cβ atom of E336 and any heavy atom of CFR in Run1 (red, with restraints), Run2 (green, no restraints) and Run3 (light green, no restraints). The red horizontal line represents the 9 Å distance threshold.
Tables
Table 1
Properties of synthesized [Lys(ClAc)]-peptide derivatives. X represents substitution of the two Met residues in position 21 and 38 to Norleucine. dF indicates the N-terminal D-Phe12 of the CRF(12-41) analogues. EC50 values of agonists were derived from the function of cAMP level in transiently transfected HEK293 cells and are shown as mean ± s.e.m. The percentage of receptor activation at 100 nM concentration of antagonists are normalized to either Ucn1 or CRF and are shown as mean ± s.e.m [%]. All values are obtained from at least three independent experiments, each performed in triplicate. Purity is given as the area% of the peak corresponding to the peptide with respect to total area in analytic HPLC (UV detection, 220 nm). Molecular weights and m/z values from MALDI-Tof mass spectrometry are monoisotopic.
| Peptides | Receptor activation | Analytic data | ||
|---|---|---|---|---|
| Purity (Area%) | M calculated | [M+H]+ found | ||
| Agonists | EC50 [nM] | |||
| Ucn1 | 0.16 ± 0.11 | |||
| CRF | 0.11 ± 0.13 | |||
| [Lys(ClAc)12]-XCRF | 3.39 ± 0.02 | >96% | 4775.57 | 4776.52 |
| [Lys(ClAc)13]- XCRF | 0.03 ± 0.16 | >96% | 4785.58 | 4786.55 |
| [Lys(ClAc)14]- XCRF | 0.79 ± 0.07 | >95% | 4809.56 | 4810.52 |
| [Lys(ClAc)15]- XCRF | 0.08 ± 0.22 | >95% | 4809.56 | 4810.55 |
| [Lys(ClAc)16]- XCRF | 0.20 ± 0.03 | >95% | 4766.54 | 4767.58 |
| [Lys(ClAc)17]- XCRF | 0.08 ± 0.26 | >95% | 4793.60 | 4794.64 |
| [Lys(ClAc)18]- XCRF | 0.03 ± 0.16 | >97% | 4823.57 | 4824.30 |
| [Lys(ClAc)31]- XCRF | 0.06 ± 0.11 | >98% | 4851.61 | 4852.88 |
| [Lys(ClAc)33]- XCRF | 0.04 ± 0.16 | >95% | 4835.61 | 4836.90 |
| Antagonists | Receptor activation at 100 nM [%] | |||
| Ucn1(8-40) | 8.20 ± 2.76 | |||
| CRF(9-41) | 4.03 ± 1.27 | |||
| dFXCRF(12-41) | 0.53 ± 0.47 | |||
| [ClAc0]- dFXCRF(12-41) | 0.62 ± 0.57 | >95% | 3612.97 | 3613.91 |
| [Lys(ClAc)13]- dFXCRF(12-41) | 2.41 ± 0.71 | >95% | 3604.00 | 3605.09 |
| [Lys(ClAc)14]- dFXCRF(12-41) | 1.49 ± 0.98 | >95% | 3627.98 | 3628.99 |
| [Lys(ClAc)15]- dFXCRF(12-41) | 0.39 ± 0.27 | >97% | 3627.98 | 3628.97 |
| [Lys(ClAc)16]- dFXCRF(12-41) | 1.06 ± 0.81 | >95% | 3584.96 | 3585.99 |
| [Lys(ClAc)17]- dFXCRF(12-41) | 0.31 ± 0.10 | >95% | 3612.02 | 3613.08 |
| [Lys(ClAc)18]- dFXCRF(12-41) | 0.59 ± 0.14 | >95% | 3641.99 | 3643.07 |
| [Lys(ClAc)31]- dFXCRF(12-41) | 0.52 ± 0.15 | >95% | 3670.02 | 3671.03 |
| [Lys(ClAc)33]- dFXCRF(12-41) | 1.85 ± 0.19 | >99% | 3654.03 | 3655.13 |
Table 2
Cβ-Cβ and N-Cβ interresidue distance restraints, measured in the molecular models of the CRF- and dFXCRF(12-41)-CRF1R complexes.
| CRF1R bound to agonist CRF | |||||
|---|---|---|---|---|---|
| No | CRF-CRF1R residue pair | Region of CRF | Region of CRF1R | Cβ-Cβ distance [Å] | |
| Constraint | Measured | ||||
| 1 | H13-F330 | N-term | Helix VI | 10.0 | 5.1 |
| 2 | H13-F344 | N-term | Helix VII | 10.0 | 9.4 |
| 3 | L15-Q173 | N-term | Helix II | 10.0 | 7.1 |
| 4 | E17-I345 | N-term | Helix VII | 10.0 | 9.2 |
| 5 | V18-V120 | C-term | Helix I | 10.0 | 6.4 |
| 6 | A31-E104 | C-term | Hinge | 10.0 | 8.6 |
| 7 | S33-Y73 | C-term | ECD | 10.0 | 6.7 |
| CRF1R bound to Antagonist dFXCRF(12-41) | |||||
| No | CRF1R-dFXCRF(12-41) residue pair | Region of dFXCRF(12-41) | Region of CRF1R | Cβ-Cβ or N-Cβ* distance [Å] | |
| Constraint | Measured | ||||
| 1 | F12-L329 | N-term | Helix VI | 5.0* | 4.4* |
| 2 | F12-F330 | N-term | Helix VI | 5.0* | 4.6* |
| 3 | F12-N348 | N-term | Helix VII | 5.0* | 4.8* |
| 4 | H13-L329 | N-term | Helix VI | 10.0 | 6.7 |
| 5 | H13-F330 | N-term | Helix VI | 10.0 | 5.5 |
| 6 | H13-F344 | N-term | Helix | 10.0 | 5.0 |
| 7 | L14-N123 | N-term | Helix I | 10.0 | 9.1 |
| 8 | L15-R341 | N-term | Helix VII | 10.0 | 5.9 |
| 9 | L15-I345 | N-term | Helix VII | 10.0 | 6.8 |
| 10 | E17-N123 | N-term | Helix I | 10.0 | 7.4 |
| 11 | E17-Q173 | N-term | Helix II | 10.0 | 6.3 |
| 12 | E17-I345 | N-term | Helix VII | 10.0 | 6.1 |
| 13 | V18-V120 | C-term | Helix I | 10.0 | 4.7 |
| 14 | A31-E104 | C-term | Hinge | 10.0 | 4.3 |
| 15 | S33-Y73 | C-term | ECD | 10.0 | 6.7 |
-
*Pair-wise crosslinking between N-terminal ClAc in the peptide and Cys thiol in CRF1R.
Table 3
(A) Cβ-Cβ Interresidue distance restraints experimentally derived for the CRF-CRF1R complex, measured in the model of the CRF-CRF1R complex, and measured at homologous positions in the model of the Ucn1-CRF1R complex. (B) Cβ-Cβ Interresidue distance restrains experimentally derived for the Ucn1-CRF1R complex, measured in the model of the Ucn1-CRF1R complex, and measured at homologous positions in the model of the CRF-CRF1R complex.
| A | Agonist CRF | Agonist Ucn1 | |||||
|---|---|---|---|---|---|---|---|
| No | CRF-CRF1R residue pair | Position in the ligand | Position in CRF1R | Cβ-Cβ [Å] constraint | Cβ-Cβ [Å] in the CRF model | Cβ-Cβ [Å] in the Ucn1 model | |
| 1 | H13-F330 | N-term | Helix VI | 10.0 | 5.1 | H12-F330 | 5.3 |
| 2 | H13-F344 | N-term | Helix VII | 10.0 | 9.4 | H12-F344 | 8.7 |
| 3 | L15-Q173 | N-term | Helix II | 10.0 | 7.1 | L14-Q173 | 6.5 |
| 4 | E17-I345 | N-term | Helix VII | 10.0 | 9.2 | T16-I345 | 6.0 |
| 5 | V18-V120 | C-term | Helix I | 10.0 | 6.4 | L17-V120 | 4.1 |
| 6 | A31-E104 | C-term | Hinge | 10.0 | 8.6 | A30-E104 | 12.3 |
| 7 | S33-Y73 | C-term | ECD | 10.0 | 6.7 | Q32-Y73 | 10.1 |
| B | Agonist Ucn1 | Agonist CRF | |||||
| No | Ucn1-CRF1R Residue Pair | Position in the ligand | Position in CRF1R | Cβ-Cβ [Å] Constraint | Cβ-Cβ [Å] In the Ucn1 model | Cβ-Cβ [Å] In the CRF model | |
| 1 | D8-Q273 | N-term | Helix V | 9.0 | 8.6 | D9-Q273 | 9.0 |
| 2 | D8-F330 | N-term | Helix VI | 9.0 | 4.5 | D9-F330 | 4.2 |
| 3 | H12-L329 | N-term | Helix VI | 9.0 | 8.0 | H13-L329 | 8.5 |
| 4 | H12-F330 | N-term | Helix VI | 9.0 | 5.3 | H13-F330 | 5.1 |
| 5 | H12-N333 | N-term | Helix VI | 9.0 | 6.9 | H13-N333 | 6.1 |
| 6 | H12-I345 | N-term | Helix VII | 9.0 | 8.4 | H13-I345 | 9.3 |
| 7 | H12-N348 | N-term | Helix VII | 9.0 | 6.5 | H13-N348 | 6.8 |
| 8 | H12-S349 | N-term | Helix VII | 9.0 | 9.4 | H13-S349 | 10.7 |
| 9 | L14-S349 | N-term | Helix VII | 9.0 | 9.0 | L15-S349 | 9.6 |
-
Bold – residue pairs tested in both models.
-
Blue – residue pairs that satisfied distance restraints.
-
Red – residue pairs that did not exactly satisfiy distance restraints.
Additional files
-
Supplementary file 1
Model with bound agonist.
- https://doi.org/10.7554/eLife.27711.022
-
Supplementary file 2
Model with bound antagonist.
- https://doi.org/10.7554/eLife.27711.023
Download links
A two-part list of links to download the article, or parts of the article, in various formats.
Downloads (link to download the article as PDF)
Open citations (links to open the citations from this article in various online reference manager services)
Cite this article (links to download the citations from this article in formats compatible with various reference manager tools)
Structural insight into the activation of a class B G-protein-coupled receptor by peptide hormones in live human cells
eLife 6:e27711.
https://doi.org/10.7554/eLife.27711


