Distinct SoxB1 networks are required for naïve and primed pluripotency
- School of Biological Sciences, University of Edinburgh, Scotland
- University of Tsukuba, Japan
Figures
Figure 1 with 6 supplements
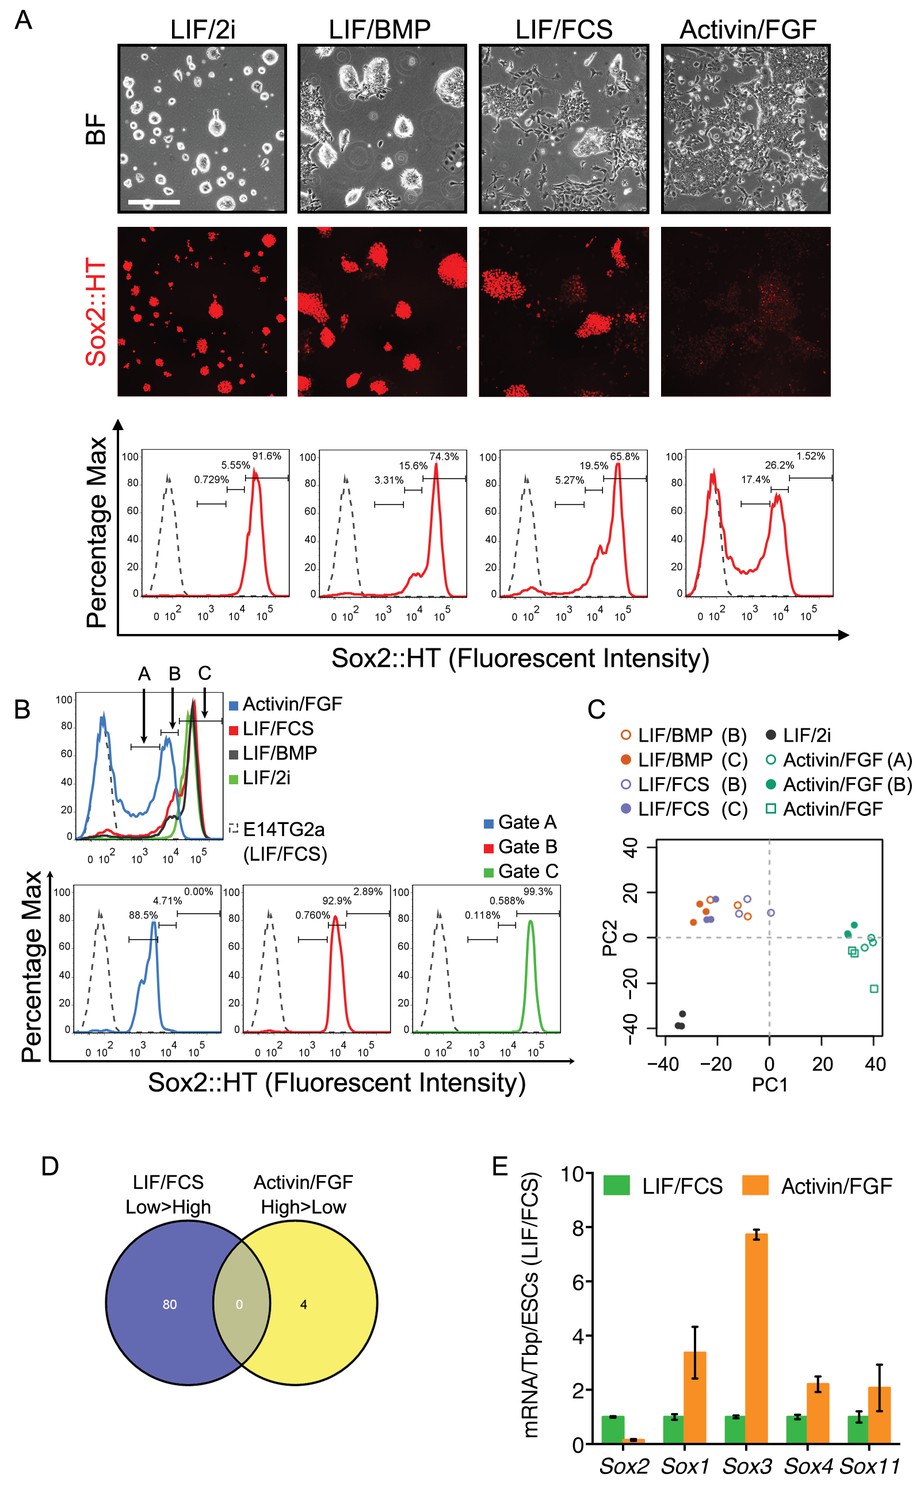
Different roles of Sox2 in preimplantation and postimplantation pluripotency.
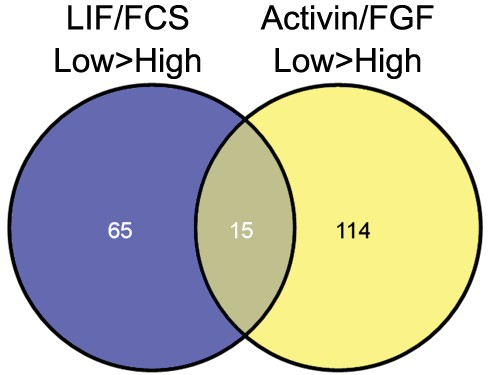
(A) Expression of the Sox2-T2A-H2b-tdTomato (Sox2::HT) reporter from the endogenous Sox2 allele in targeted TST18 cells. TST18 cells cultured in LIF/FCS/GMEMβ were replated in LIF/2i/N2B27 or LIF/BMP4/N2B27 for four passages or in Activin/FGF/N2B27 (Activin/FGF) for nine passages, examined microscopically (top) and assessed by flow cytometry (bottom); E14Tg2a cells were represented as a grey dashed line. (B) Three gates (A, B, C) were used to purify cells for microarray analysis. Gate C captured the Sox2::HT level in LIF/2i cultured ESCs. Gate B captured the overlapping Sox2::HT level in LIF/FCS, LIF/BMP and Activin/FGF cultured cells. Gate A captured the lower Sox2::HT level in Activin/FGF. (C) Principal component analysis of cells in different culture conditions, either unsorted or sorted using the gates indicated by brackets. (D) Despite similar Sox2::HT levels, no differentially expressed genes (DEGs, FDR = 0.1) were common to LIF/FCS-low and Activin/FGF-high cell populations. (E) RT-qPCR analysis of the indicated transcripts in ESCs (LIF/FCS, red bars) and EpiSCs (Activin/FGF, cultured for 16 passages, blue bars). Transcript levels were normalized to Tbp and plotted relative to ESCs. Error bars represent standard error of the mean (n = 3 to 4).
Figure 1—figure supplement 1
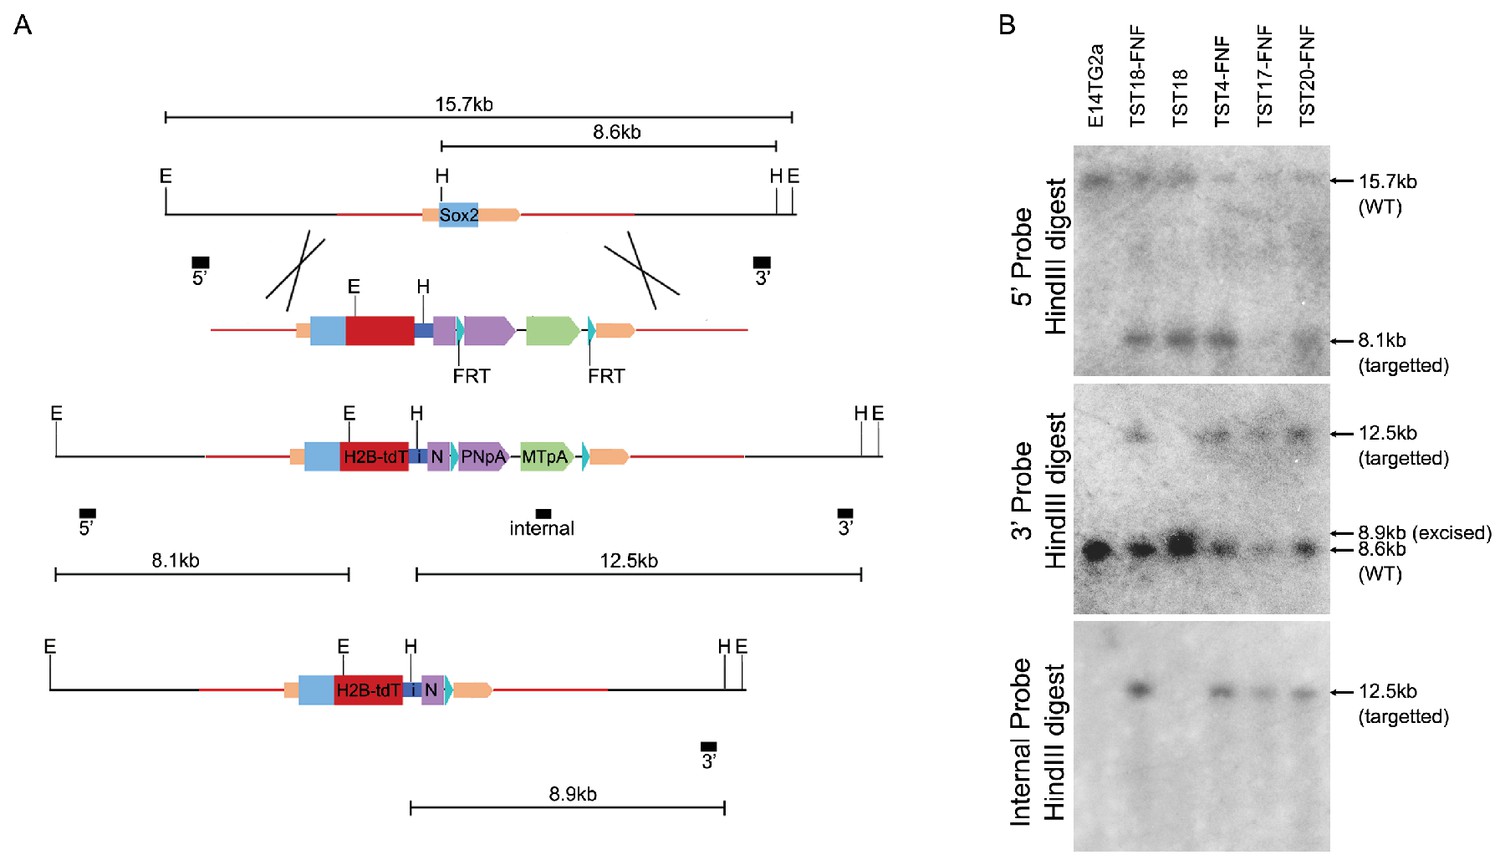
(A) Targeting T2A-H2b-tdTomato to the Sox2 locus stop codon yields the Sox2::HT fluorescent reporter allele.
The Sox2 ORF is represented by a blue box and the Sox2 UTRs by beige boxes; homology arms are shown (red line). The Sox2::HT ORF is followed by GtxIRES-Neo and an FRT-flanked PGK-Neo-pA (PNpA)/MC1-TK-pA (MTpA) selection cassette. The FRT sites (cyan triangles), EcoRI sites (E), HindIII sites (H) and probes (black boxes) used for Southern analysis are shown. Sizes of relevant fragments produced before and after targeting and excision of the FRT-flanked cassette are indicated. (B) Southern analysis of TST cell lines expanded after G418 selection. FNF denotes lines prior to excision of the FRT-flanked cassette.
Figure 1—figure supplement 2
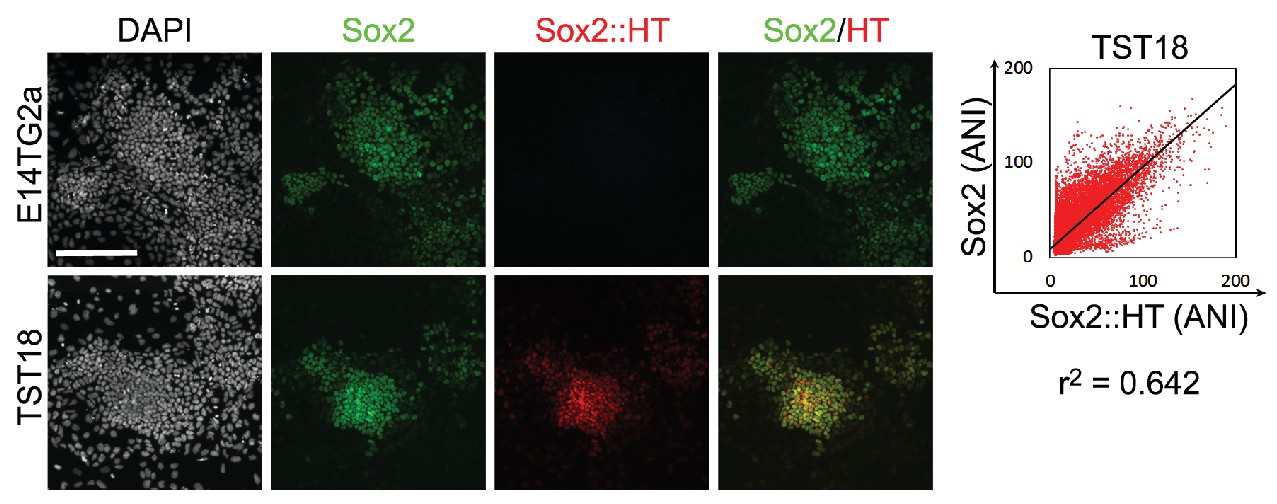
Imaging of E14Tg2a and TST18 ESCs for SOX2 by immunofluorescence (green) and of Sox2::HT fluorescence (red); DAPI is grey.
Scale bar, 100 μm. Trend line was plotted between Sox2 and Sox2::HT average nuclear intensity (ANI) distributions of TST18 cells. Correlation coefficient (PMCC, r2) is indicated for the trend line.
Figure 1—figure supplement 3
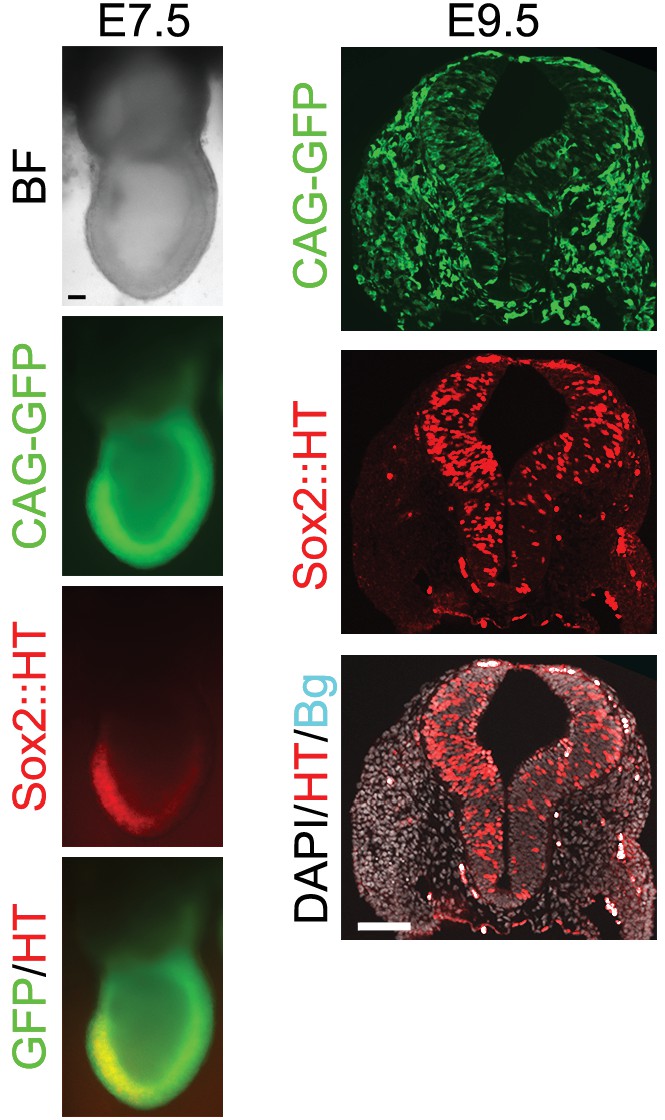
TST18 cells transfected with a CAG-GFP constitutive reporter were aggregated with isolated morulae and chimeric embryos assessed at the indicated stages for contribution of TST18 cells.
Transverse cryostat-sectioning of E9.5 chimeric embryos showed appropriate restriction of Sox2::HT expression. Non-specific auto-fluorescence (cyan) was captured in the far-red (647 nm) channel. Scale bar, 100 μm.
Figure 1—figure supplement 4
Differentially expressed genes common to LIF/FCS-low and Activin/FGF-low were not associated with any gene ontology (GO) terms using high-stringency GO term clustering analysis.
https://doi.org/10.7554/eLife.27746.006
Figure 1—figure supplement 5
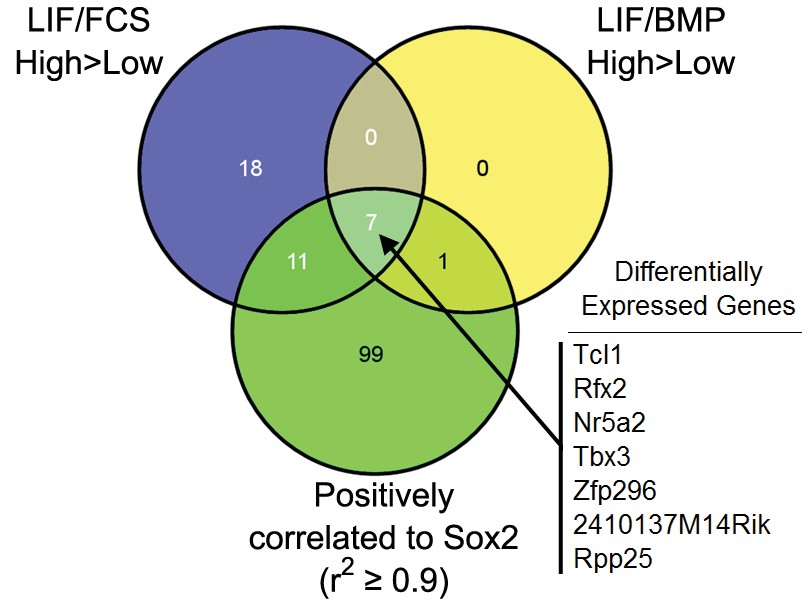
Common differentially expressed genes (DEGs, FDR = 0.1) enriched in LIF/FCS-high, LIF/BMP-high and DEGs positively correlated to Sox2 (r2 ≥0.9).
DEGs listed in descending order of fold-change between LIF/FCS-high and LIF/FCS-low cells.
Figure 1—figure supplement 6
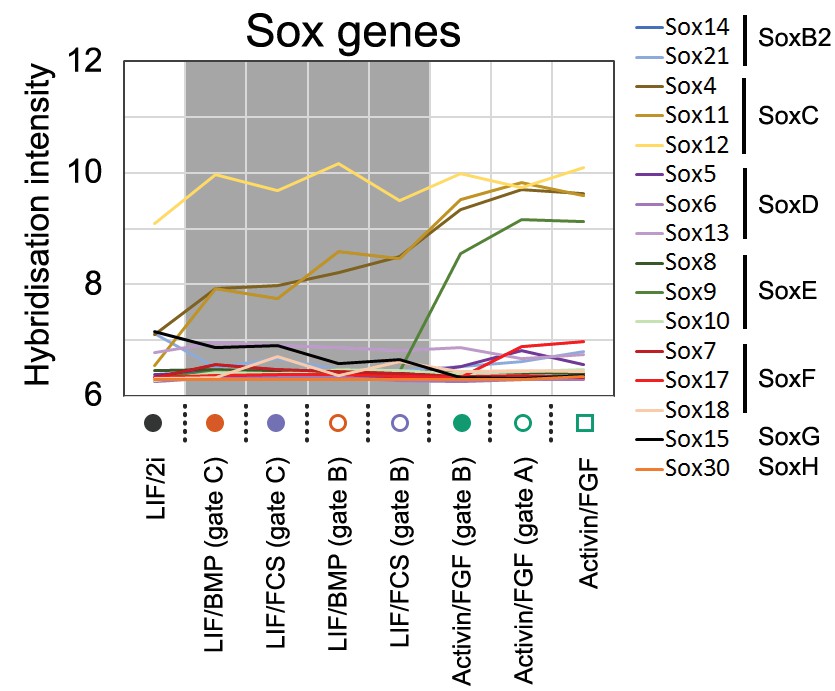
Microarray signal intensity of Sox family members in all sorted populations.
Sample legend and culture conditions refer to Figure 1C.
Figure 2 with 2 supplements

The ESC function of Sox2 can be substituted by SOXB1 and SOXG proteins.
(A) Strategy for testing the ability of candidate Sox cDNAs to rescue ESC self-renewal upon Sox2 deletion. Sox2fl/- (SCKO) ESCs were treated with 4-hydroxy-tamoxifen (4OHT) to induce nuclear localisation of CreERT2 and consequent loxP-mediated Sox2 excision. Simultaneous transfection of test cDNAs linked to hygromycin phosphotransferase via an IRES (i) were tested for Sox2 complementation activity. (B) SCKO ESCs transfected with the indicated cDNAs were cultured in the presence of hygromycin B and in the absence (−4OHT) or presence (+4 OHT) of 4-hydroxyl-tamoxifen for 8 days before being fixed and stained for alkaline phosphatase (AP) activity. (C) Stained colonies were scored based on AP+ (undifferentiated), mixed or AP− (differentiated) morphology. Error bars represent standard error mean (n = 3). (D) RT-qPCR analysis of the rescuing transgenes in Sox1-, Sox2- and Sox3-rescued (S1R, S2R, S3R) ESC populations grown in the presence of 4-hydroxyl-tamoxifen as described in Figure 2A,B. RT-qPCR was performed using common primers designed across the CAG intron upstream of the rescuing transgene. Values were normalised over Tbp and expressed relative to S2R cells. Error bars represent the standard error of the mean (n = 3).
Figure 2—figure supplement 1
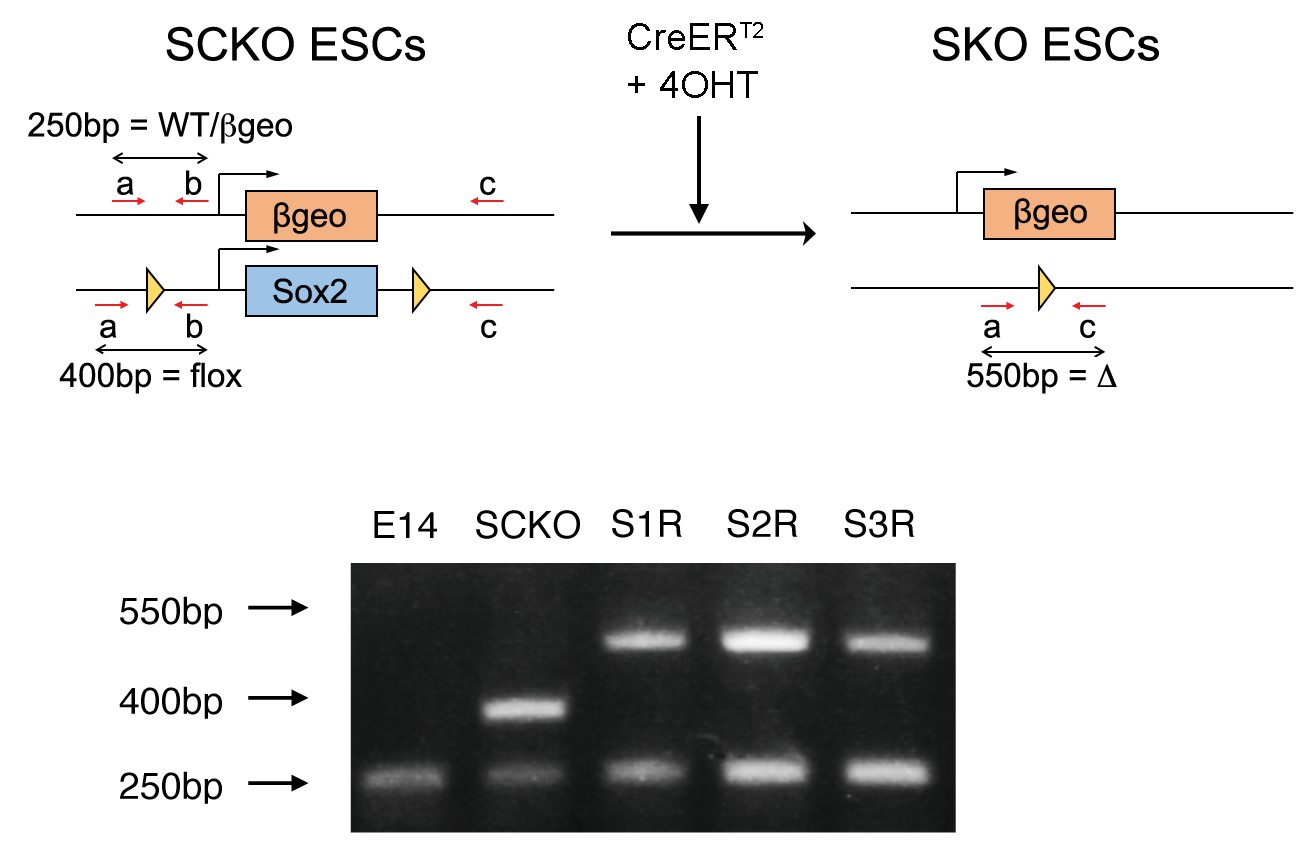
(TOP) Strategy for genotyping the Sox2 deletion by PCR.
Primers a and b flank the position of the loxP site 5’ to Sox2; primer c flanks the loxP site 3’ to Sox2. Amplification of wild-type (WT) and βgeo targeted alleles produces a 250 bp band whereas the loxP-flanked Sox2 allele (flox) produces a 400 bp band. Upon Cre-mediated recombination, the deleted (Δ) allele produces a 550 bp band amplified by primers a + c. (BOTTOM) Wild-type E14Tg2a ESCs (E14) exhibited only the 250 bp band. SCKO ESCs exhibited both 250 bp and 400 bp bands whereas Sox2-/- S1R, S2R and S3R ESCs retained the 250 bp band and exhibited the 550 bp band corresponding to the deleted allele.
Figure 2—figure supplement 2
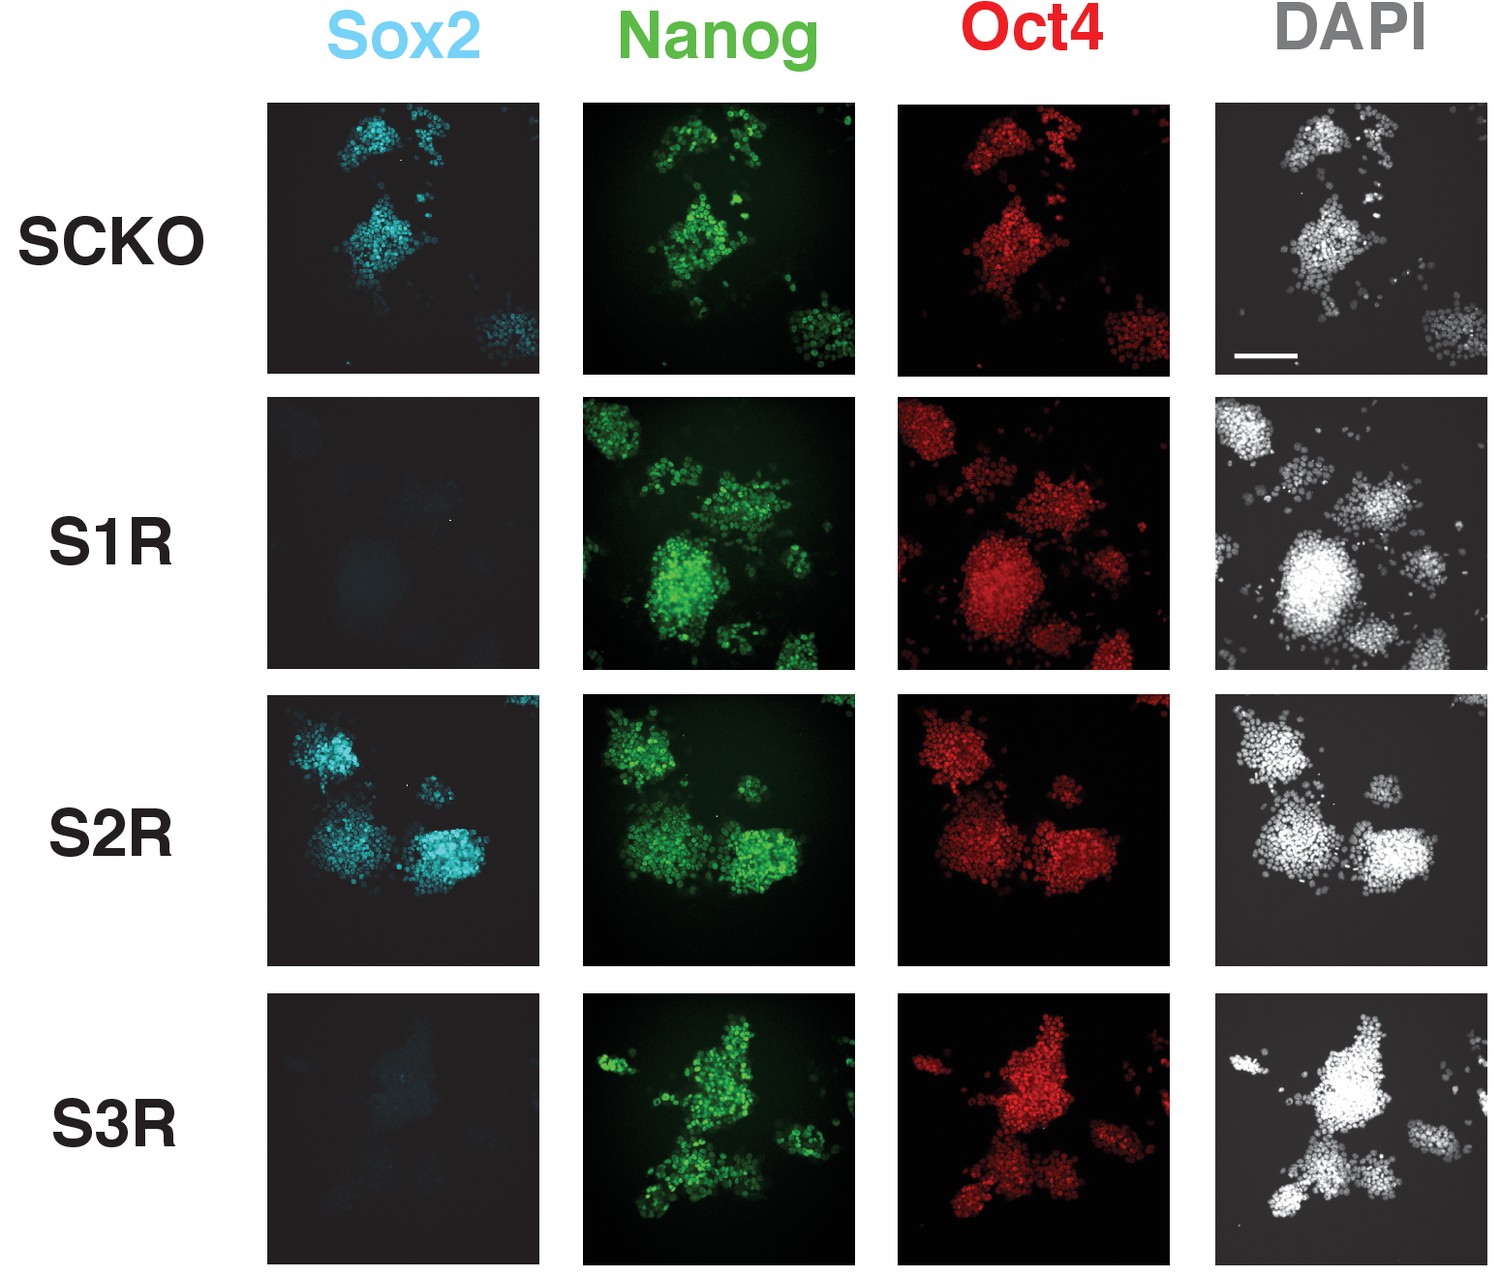
Immunofluorescence staining of SOX2, NANOG and OCT4 in SCKO, S1R, S2R and S3R ESCs.
Scale bar, 100 μm.
Figure 3 with 1 supplement

Sox3 is dispensable for pluripotent cell maintenance.
(A) Schematic representation of the Sox3 locus on the mouse X chromosome showing the CRISPR/Cas9 strategy for the generation and genotyping of Sox3 knockout ESCs. The positions of sgRNA1 and sgRNA2 used for the deletion of the Sox3 locus are indicated alongside the positions of PCR primers used for genotyping. (B) PCR genotyping of parental ESCs (E14Tg2a), a wild-type clone (37) and two Sox3 knockout clones (S3KO8, S3KO35) after CRISPR/Cas9 targeting of the Sox3 locus. Band sizes for the WT (~2 kb) and targeted (~600 bp) alleles are shown. (C) Alkaline phosphatase staining in S3KO8, S3KO35 and WT (Clone 37 and E14Tg2a) ESCs grown at clonal density for 7 days. (D–E) RT-qPCR analysis of the indicated transcripts in wild-type E14Tg2a and Sox3-/Y (S3KO8, S3KO35) ESCs (D) and EpiSCs (E) derived by serial passaging (>10 passages) in Activin/FGF conditions. Error bars represent standard error of the mean (n = 3). (F-G) Immunofluorescence staining of SOX2 (F), SOX3 (G) and OCT4 proteins in E14Tg2a and Sox3-/Y EpiSCs (S3KO8, S3KO35). Scale bar, 100 μm.
Figure 3—figure supplement 1
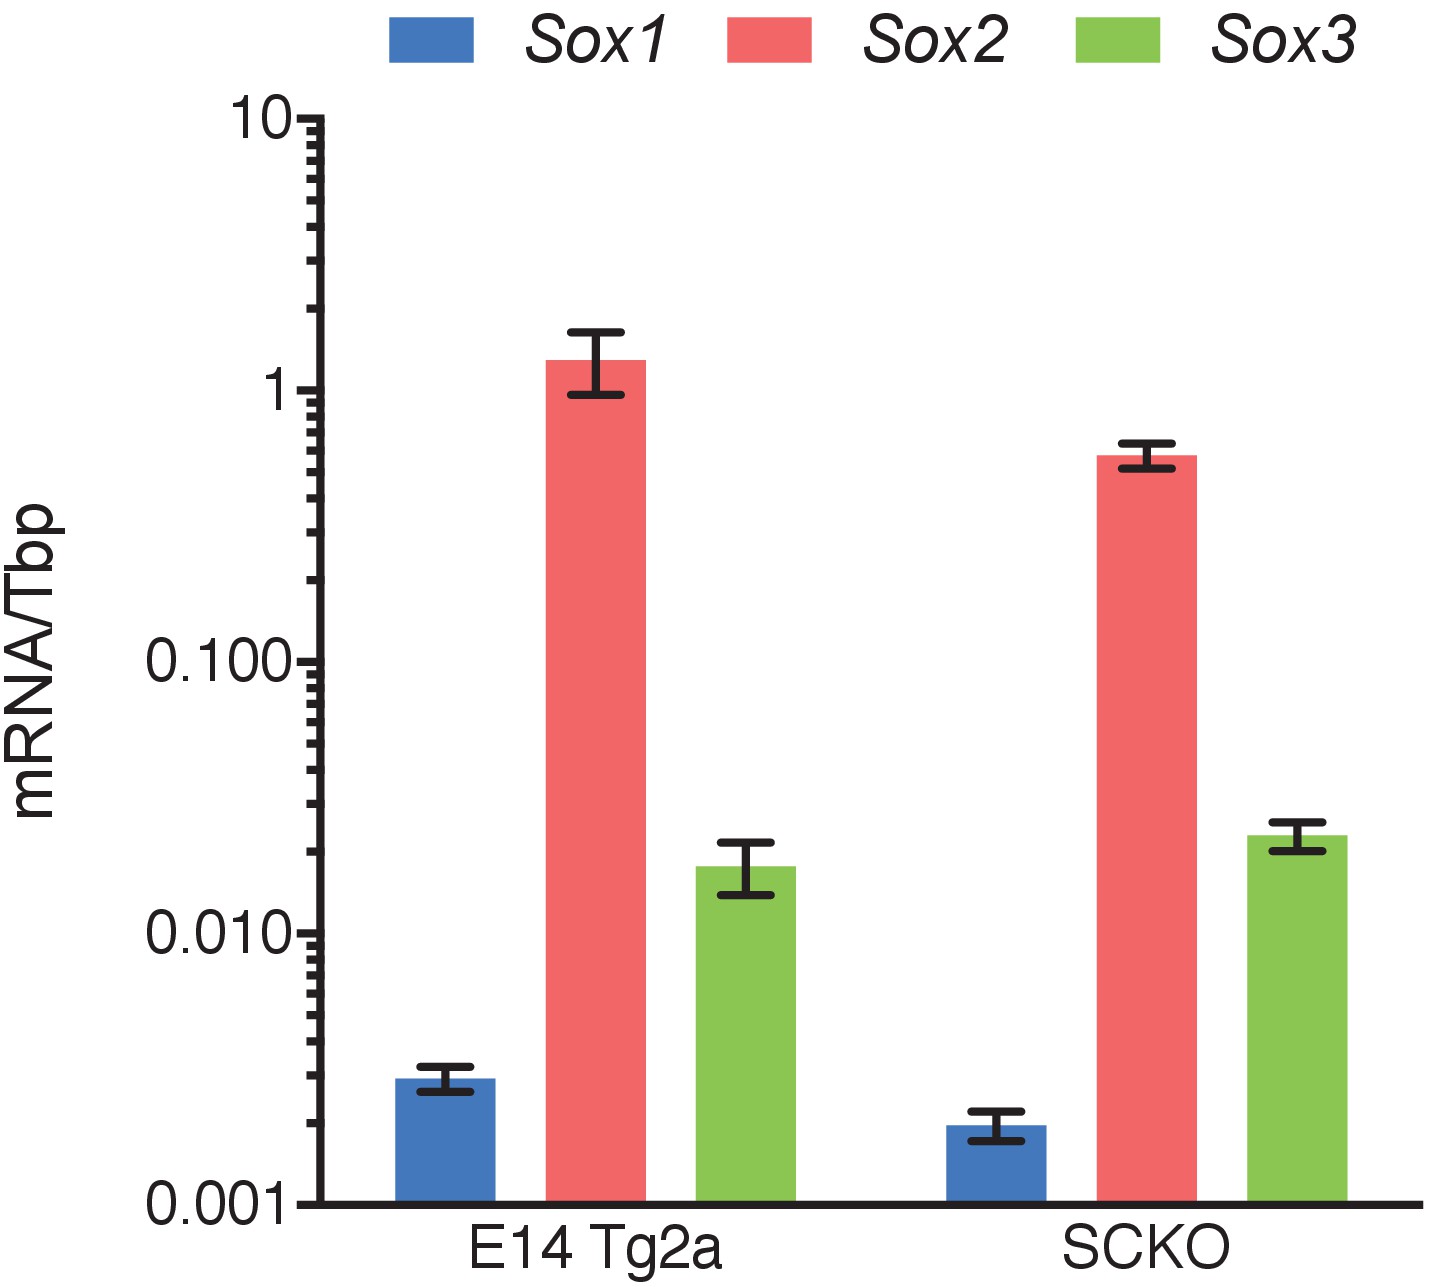
RT-qPCR analysis of the indicated transcripts in E14Tg2a and SCKO ESCs.
mRNA levels were normalised over Tbp. Error bars represent standard error of the mean (n = 3).
Figure 4
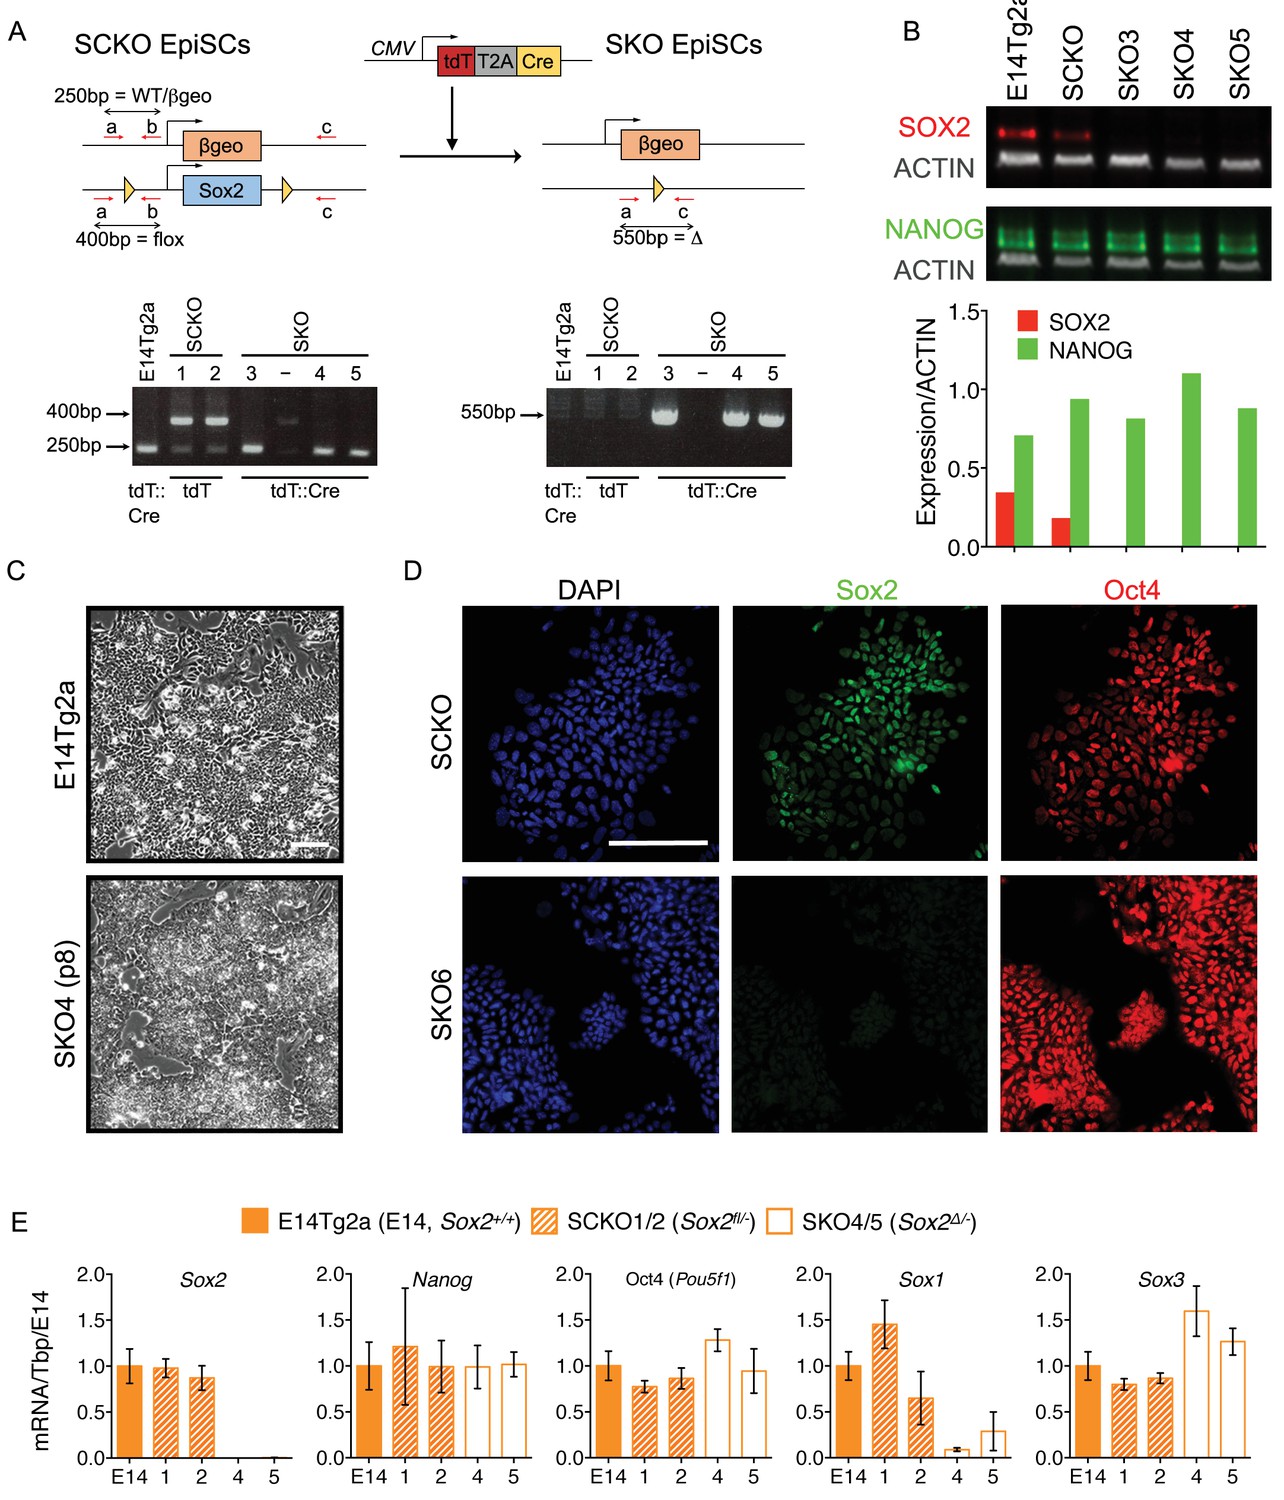
Sox2 is dispensable for the maintenance of EpiSCs.
(A) Strategy for Sox2 deletion in EpiSCs. Sox2fl/- (SCKO) EpiSCs were transfected with pCMV-tdTomato-T2A-Cre. After 12–24 hours, cells were sorted for tdTomato expression and re-plated in the presence of ROCK inhibitor. Clones were picked and expanded before genotyping by PCR as indicated in Figure 2—figure supplement 1 . SCKO EpiSCs were also transfected with pCMV-tdTomato (lacking Cre). Expanded clones were numbered as indicated. (B) Immunoblot analysis of E14Tg2a, Sox2fl/- (SCKO) and Sox2-/- (SKO) EpiSCs showing that SOX2 protein (red) is reduced in SCKO and absent in SKO EpiSCs. NANOG protein levels (green) were unaffected. Protein levels (normalized to the βactin level) are graphed below. (C) Bright-field morphology of E14Tg2a and SKO4 EpiSCs after 2 weeks (8 passages) in culture. Scale bar, 100 μm. (D) Immunofluorescence staining of SOX2 and OCT4 in SCKO and SKO6 EpiSCs. Scale bar, 100 μm. (E) RT-qPCR analysis of the indicated transcripts in E14Tg2a, Sox2fl/- (SCKO) and Sox2-/- (SKO) EpiSCs. Clone numbers are indicated. Error bars represent the standard error of the mean (n = 2 to 3).
Figure 5 with 2 supplements
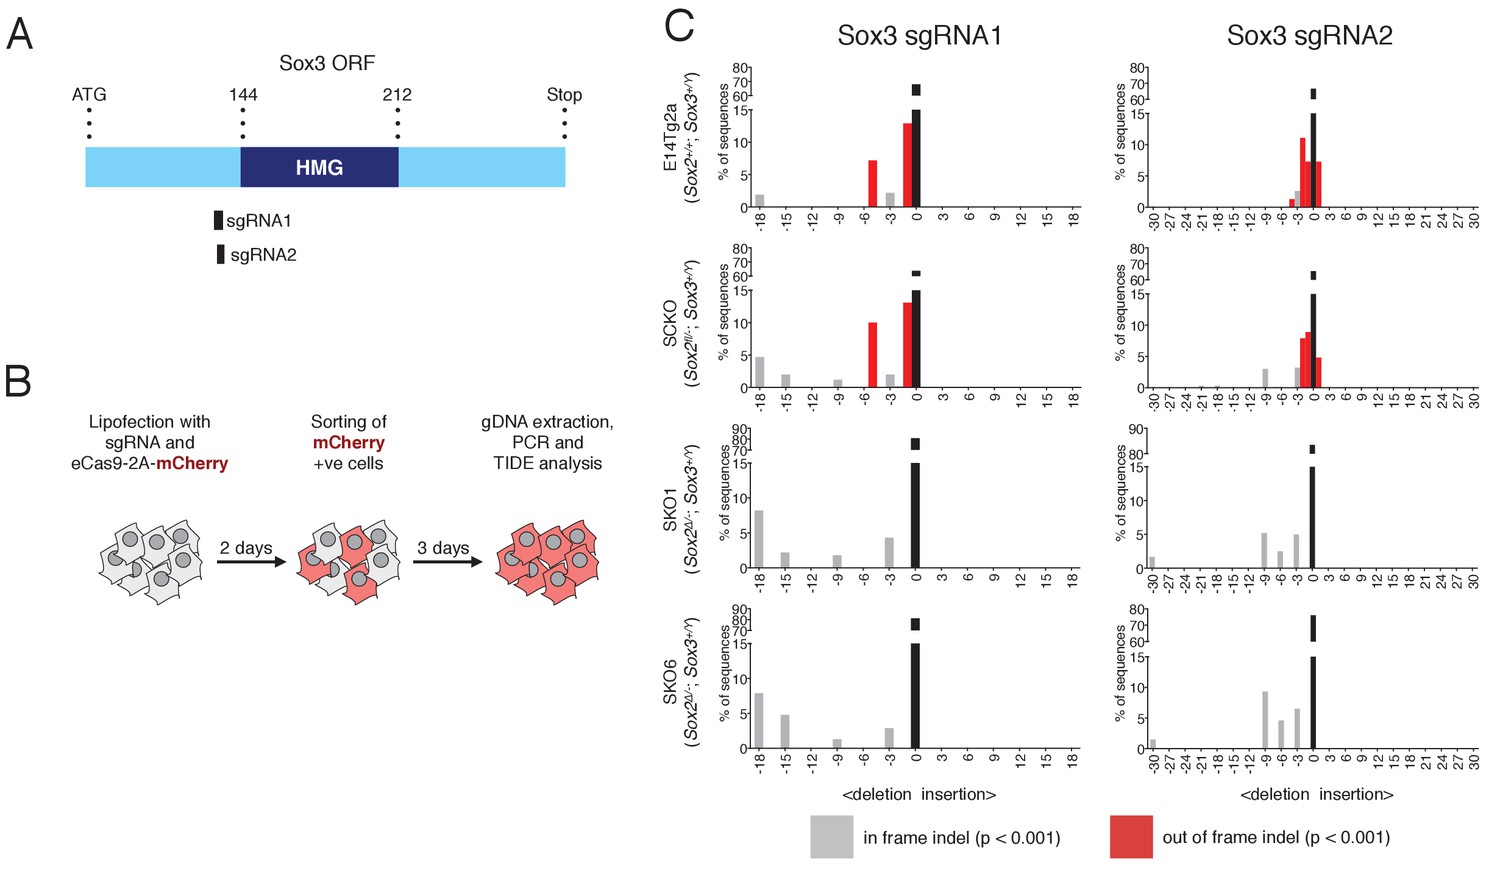
Sox3 indel analysis in Sox2-/- EpiSCs.
(A) Schematic representation of the Sox3 ORF with the HMG box highlighted in dark blue. The amino-acid positions of the HMG box relative to the start (ATG) codon of the ORF are shown. The positions of the sgRNAs 1 and 2 used are represented as black bars. (B) Experimental design for Sox3 indel analysis in Sox2-/- EpiSCs. (C) Indel analysis performed using the TIDE tool (https://tide-calculator.nki.nl/) in two Sox2-/- EpiSC lines (SKO1 and SKO6), in the parental Sox2fl/- (SCKO) EpiSCs and in control E14Tg2a EpiSCs using Sox3 sgRNAs 1 and 2. Histograms represent indel frequency and size. Black bars indicate the frequency of unmodified (WT) alleles; grey bars indicate significant in frame indels and red bars indicate significant out of frame indels (p<0.001). Non-significant (n/s, p≥0.001) indels are not shown.
Figure 5—figure supplement 1
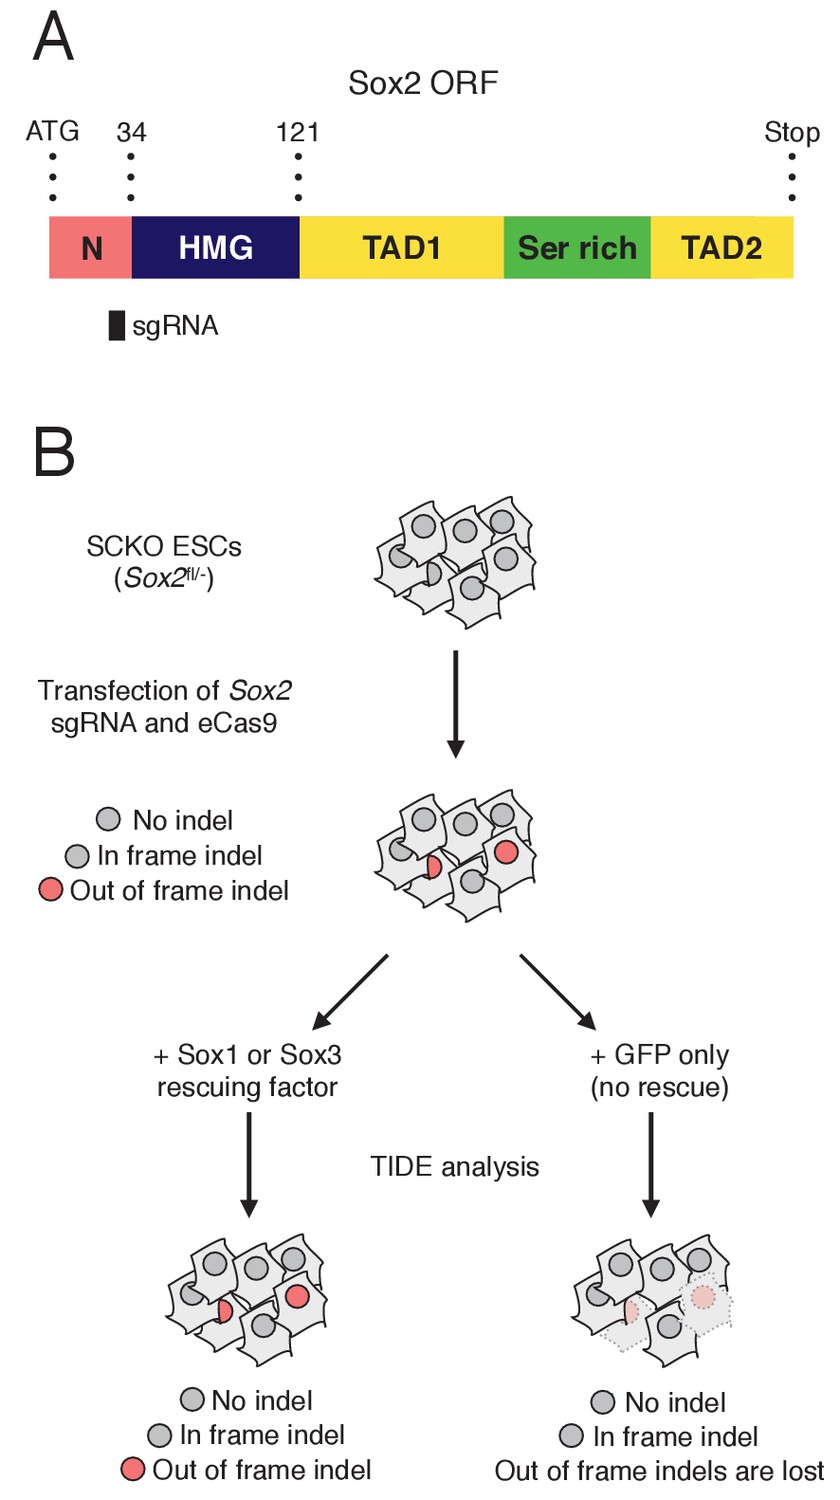
(A) Schematic representation of the Sox2 ORF showing the N-terminal domain (N, pink), the HMG box (dark blue), two transactivation domains (TAD1/2, yellow) and the serine-rich domain (green) (Gagliardi et al., 2013). The amino-acid positions of each domain relative to the start (ATG) codon of the ORF are shown. The position of the sgRNA used is represented as a black bar. (B) Experimental rationale for the expected Sox2 indel pattern in Sox2fl/- ESCs (SCKO).
Figure 5—figure supplement 2
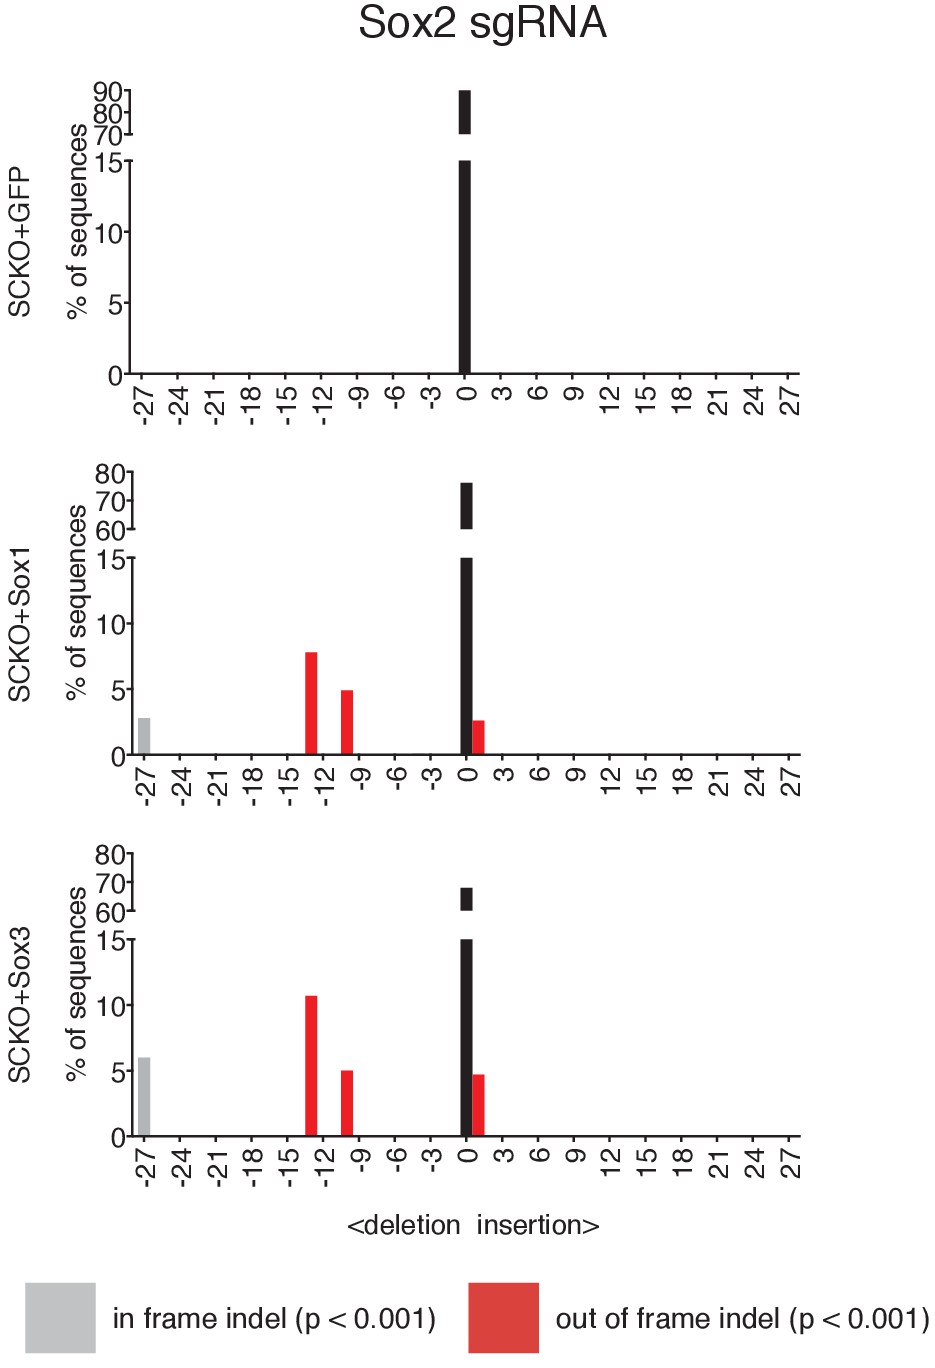
Indel analysis performed using the TIDE tool (https://tide-calculator.nki.nl/) in SCKO ESCs expressing either Sox1, Sox3 or GFP transgenes.
Histograms represent indel frequency and size. Black bars indicate the frequency of unmodified (WT) alleles; grey bars indicate significant in frame indels and red bars indicate significant out of frame indels (p<0.001). Non-significant (n/s, p≥0.001) indels are not shown.
Figure 6 with 1 supplement
Increased SOXB1 levels skew ESC differentiation towards the neural lineage.
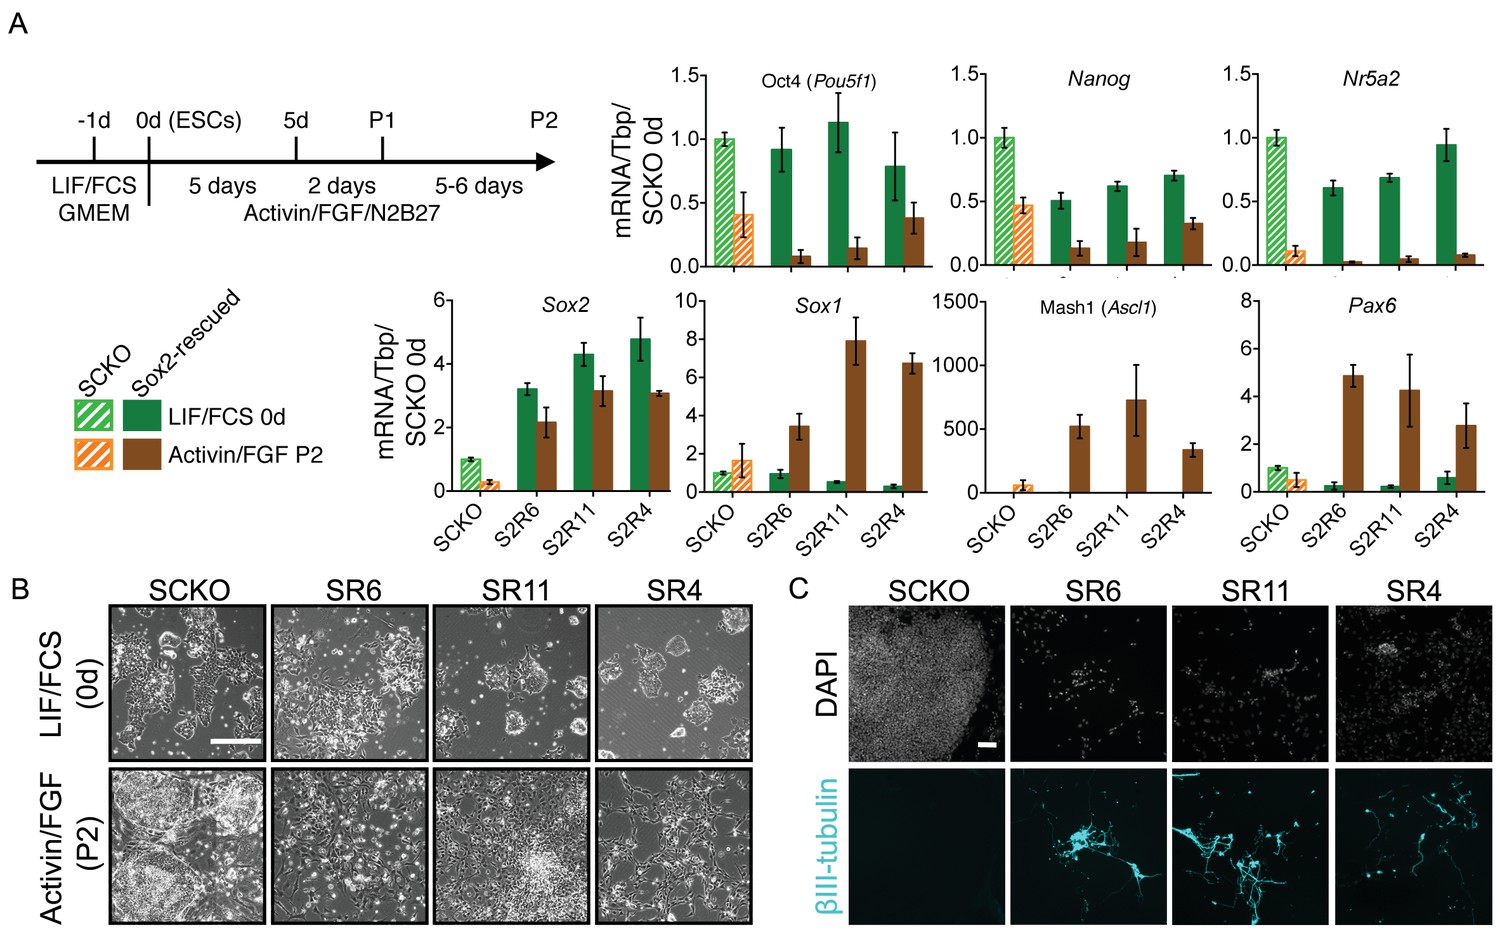
(A) Schematic diagram showing the experimental plan. RT-qPCR analysis of the indicated transcripts in SCKO cells stably transfected and rescued with a Sox2 transgene (12–24 hr prior to a 24 hr treatment with 4OHT) (termed Sox2-rescued, S2R cells). Cells were grown in LIF/FCS conditions or differentiated in Activin/FGF conditions for 13 days (P2). Transcript levels were normalized to Tbp and plotted relative to SCKO ESCs. Error bars represent standard error of the mean (n = 3 to 5). (B) Bright field images of the indicated cells maintained in LIF/FCS or differentiated in Activin/FGF conditions (P2) . Scale bar, 100 μm. (C) Immunofluorescence staining of the neural marker βIII-tubulin (cyan) in cells differentiated in Activin/FGF conditions (P2); DAPI represented in grey. Scale bar, 100 μm.
Figure 6—figure supplement 1
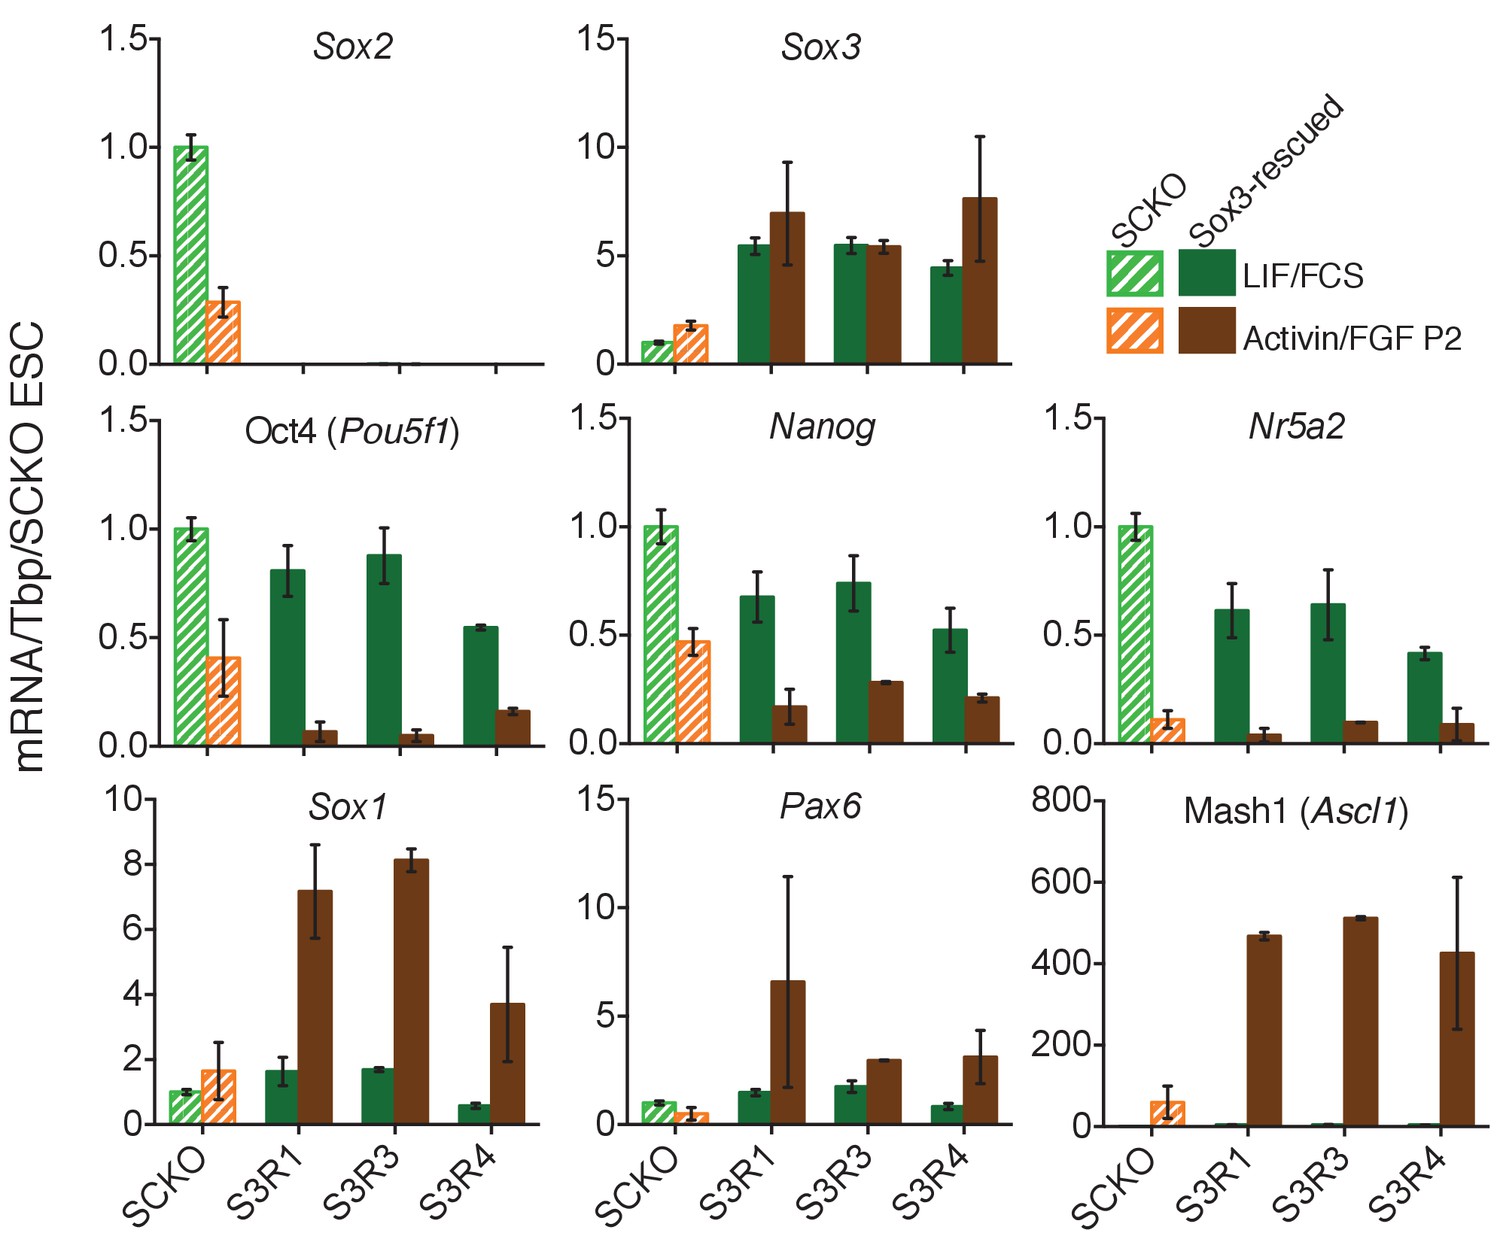
RT-qPCR analysis of the indicated transcripts in E14Tg2a cells, Sox2fl/- cells (SCKO), and Sox2-/- Sox3-rescued (S3R) cells maintained in LIF/FCS or differentiated in Activin/FGF conditions (P2) .
Transcript levels were normalized to Tbp and plotted relative to SCKO ESCs. Error bars represent standard error of the mean (n = 3 to 5).
Figure 7 with 1 supplement
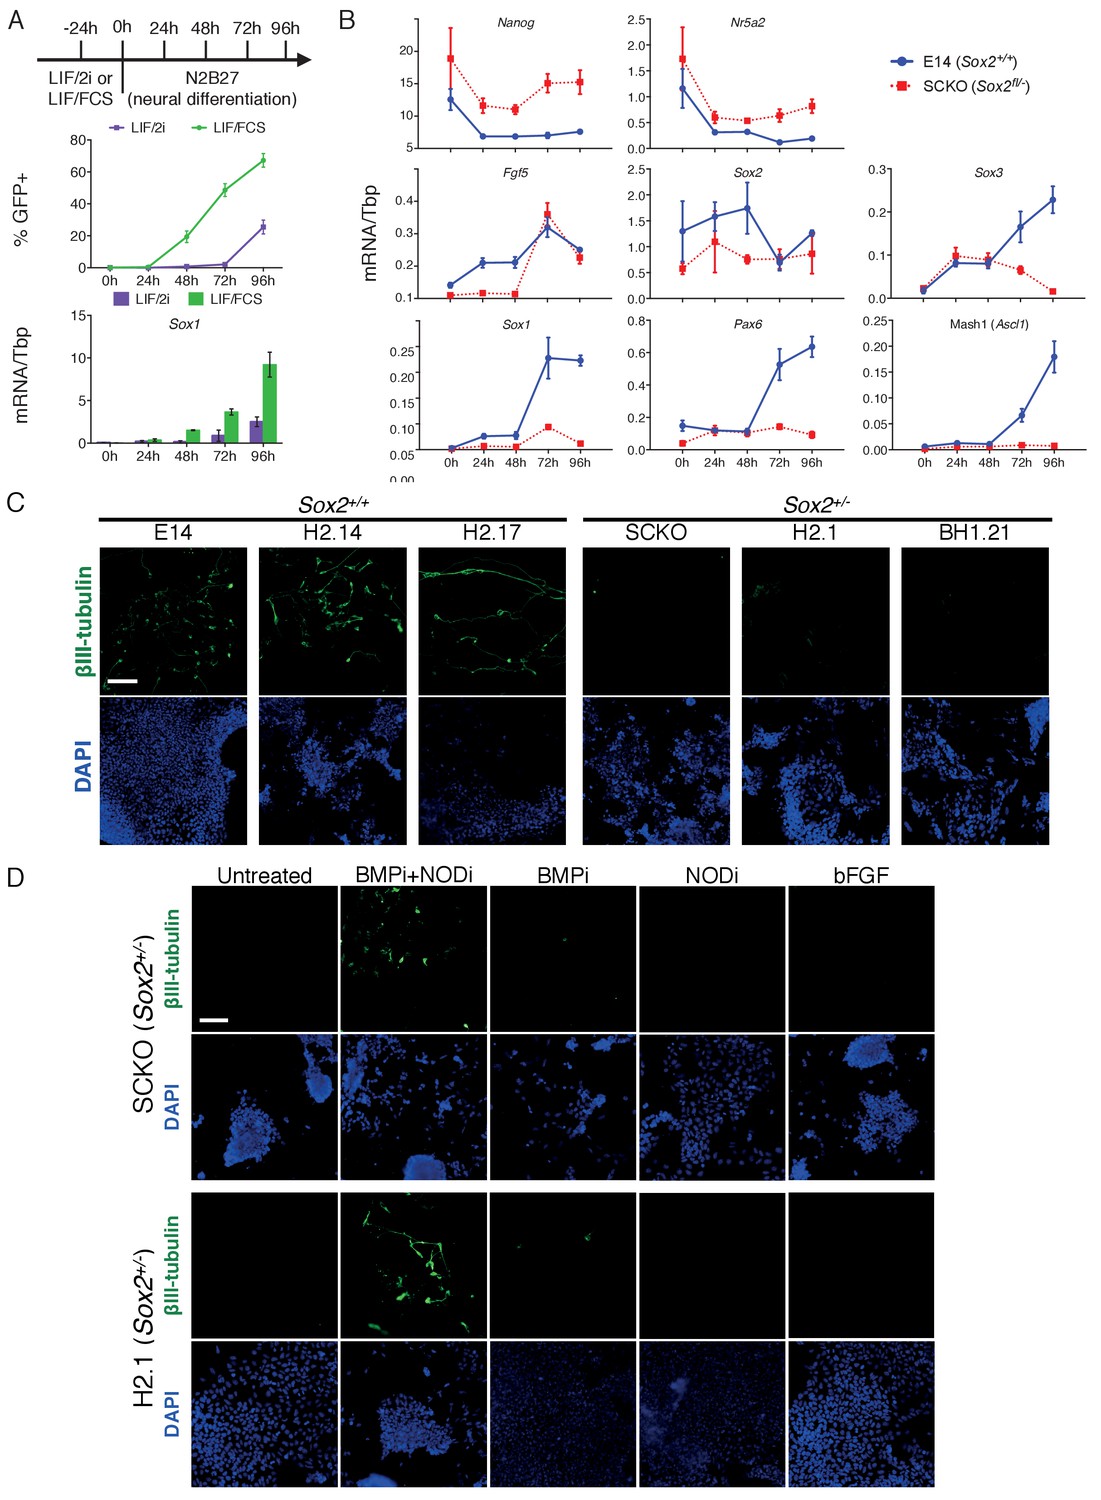
Decreased SOX2 levels prevent ESC differentiation into neurons.
(A) (TOP) Schematic diagram showing experimental plan for neural differentiation. (MIDDLE) Sox1-GFP (Aubert et al., 2003) expression in 46C cells cultured in LIF/FCS (green) or LIF/2i (purple) and for the indicated number of hours in N2B27 neural differentiation medium were assessed by flow cytometry. The positive (+) gate was set above the GFP expression level observed in 46C ESCs. The error bars indicate the standard error of the mean (n = 4). (BOTTOM) RT-qPCR analysis of Sox1 mRNA level in 46C cells during neural differentiation. Error bars indicate the standard error of the mean (n = 2). (B) RT-qPCR analysis of the indicated transcripts in differentiating E14Tg2a (E14, Sox2+/+) and SCKO (Sox2fl/−) cells. Transcript levels were normalized to Tbp. Error bars represent standard error of the mean (n = 3). (C) Immunofluorescence staining of the neural marker βIII-tubulin (green) in Sox2+/+ E14Tg2a (E14), H2.14 and H2.17 ESCs, and in Sox2+/- SCKO, H2.1 and BH1.21 ESCs differentiated in N2B27 medium for 4 days; DAPI represented in blue. Scale bar, 100 μm. (D) Immunofluorescence staining of the neural marker βIII-tubulin (green) in Sox2+/-and H2.1 ESCs differentiated in N2B27 medium for 4 days in the presence or in the absence of the LDN-193189 BMP inhibitor (BMPi), of the SB-431542 Nodal inhibitor (NODi) and of recombinant bFGF; DAPI represented in blue. Scale bar, 100 μm.
Figure 7—figure supplement 1
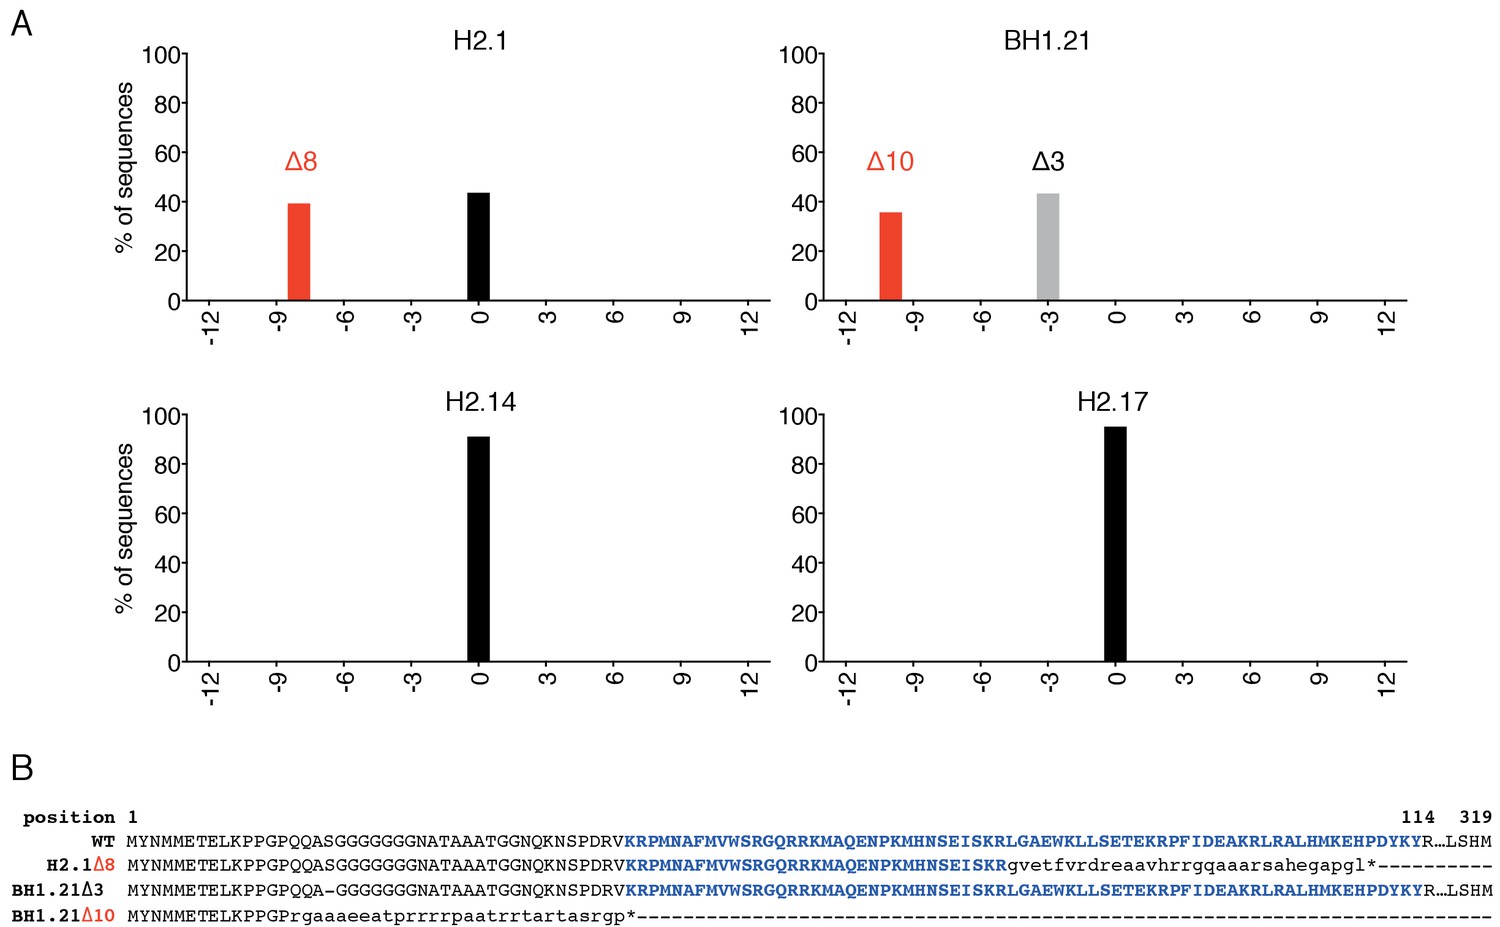
Genotyping analysis of four ESC clones generated after transfection of CRISPR/Cas9 reagents to induce indels within the Sox2 ORF in E14Tg2a ESCs.
(A) PCR amplicons surrounding the Cas9 cutting site were generated starting from gDNA of the individual clones and submitted for Sanger sequencing. Electropherograms containing possible indels were then analysed using the TIDE tool (https://tide-calculator.nki.nl/). Histograms represent frequency and size of the deletions found within the Sox2 alleles of the indicated clones. Black bars indicate the frequency of unmodified (WT) alleles; grey bars indicate in frame indels and red bars indicate out of frame indels. Clone H2.1 carries an out of frame 8 bp (Δ8) on one allele and no deletion on the other allele; clone BH1.21 carries an out of frame 10 bp (Δ10) on one allele and an in frame 3 bp deletion (Δ3) on the other allele; two clones that did not carry any deletion on either Sox2 allele (H2.14 and H2.17) were also isolated as controls. (B) WT SOX2 aminoacid sequence aligned with the sequences produced by the mutated Sox2 alleles in clones H2.1 and BH1.21 (as indicated). Bold blue font indicates residues forming the HMG DNA-binding domain of the protein; small font indicates mutated residues and * indicates premature stop codons generated by the alleles containing out of frame indels; - indicates the deleted serine (S)residue produced by the BH1.21 Δ3 allele.
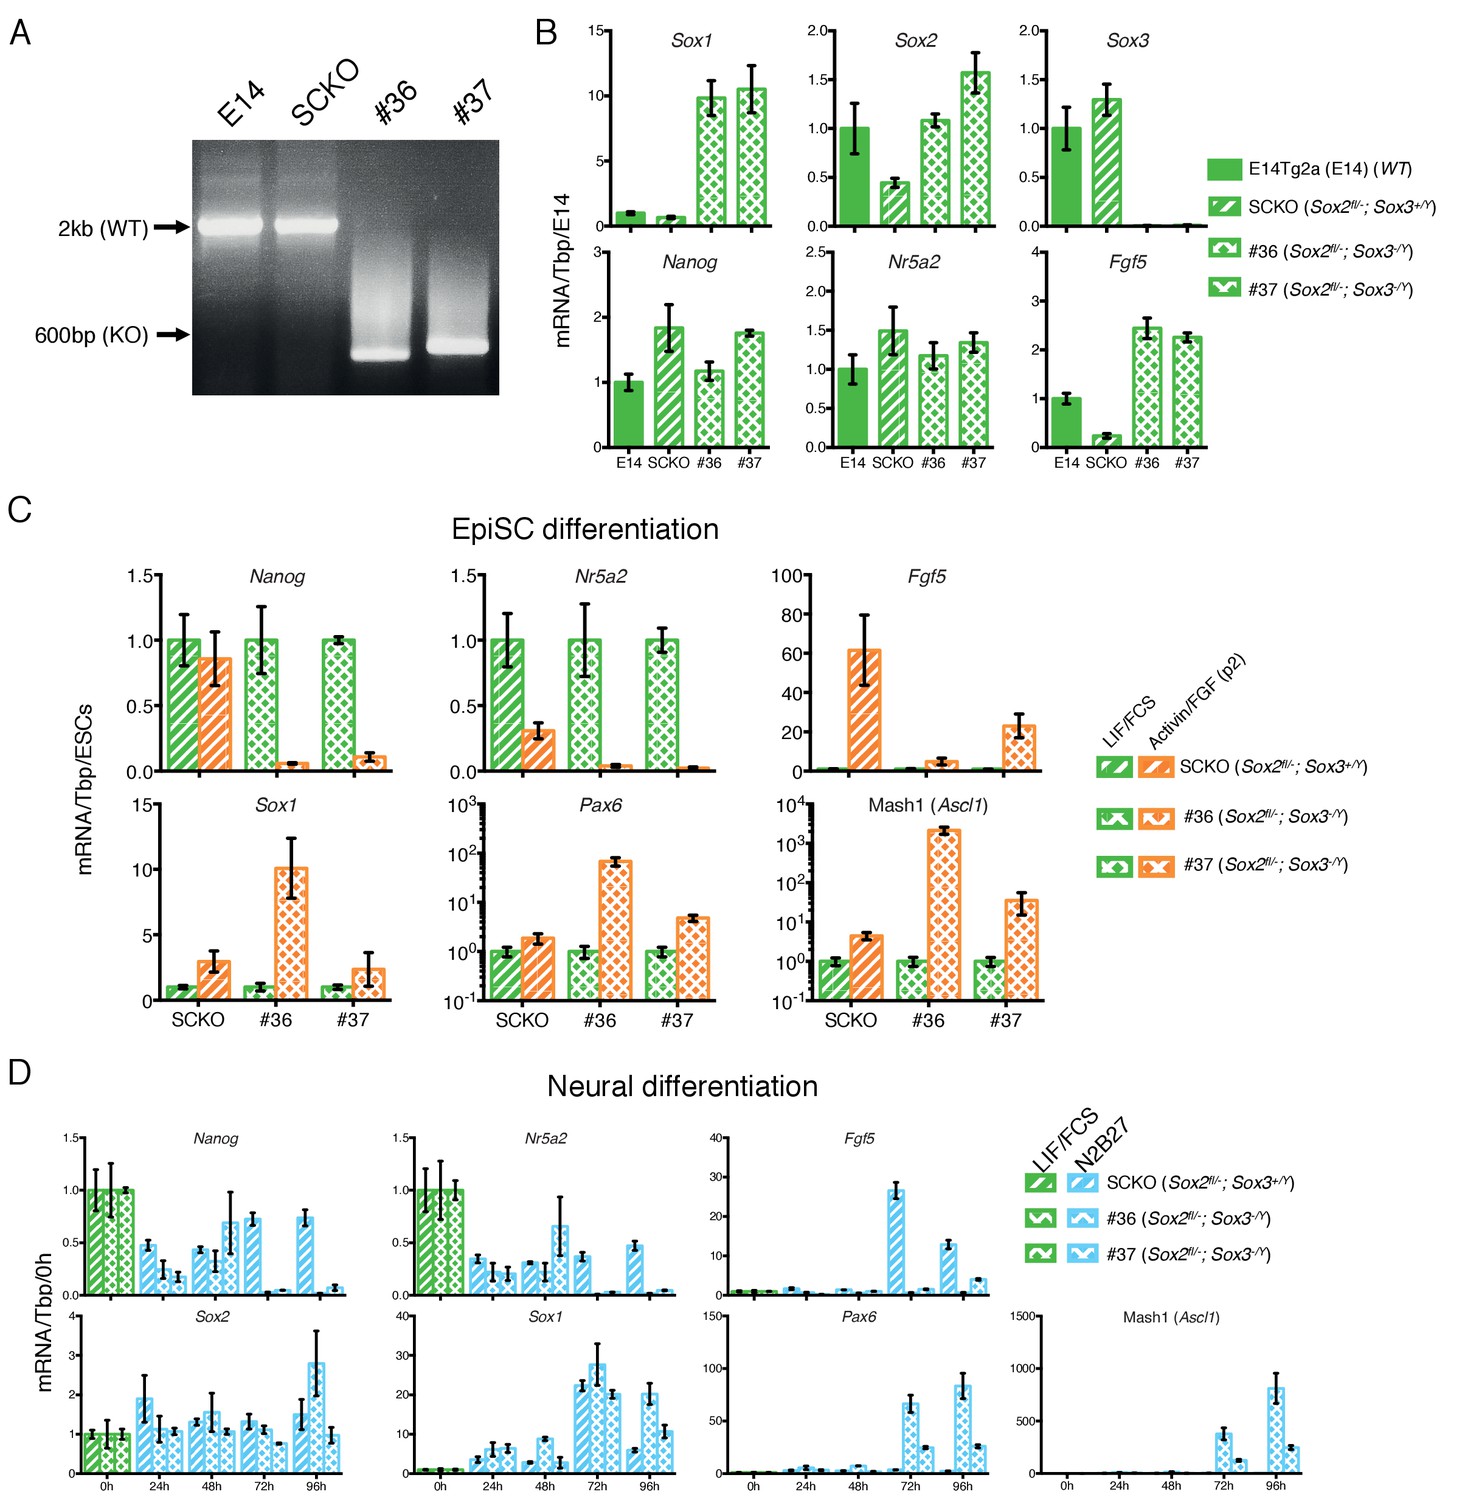
Figure 8 with 2 supplements
Sox2/Sox3 requirements during EpiSCs differentiation.
(A) Genotyping analysis of the Sox3 locus in E14Tg2a (E14, Sox2+/+), SCKO (Sox2fl/-) ESCs (∼2 kb band) and in two Sox2fl/-; Sox3-/Y ESC clones (#36 and #37) derived after deletion of the Sox3 locus (∼600 bp band). Gene targeting was performed following the strategy depicted in Figure 3A. (B) RT-qPCR analysis of the indicated transcripts in E14Tg2a ESCs (E14, Sox2+/+), SCKO ESCs (Sox2fl/-) and in two Sox2fl/-; Sox3-/Y ESC clones (#36 and #37). mRNA levels were normalised over Tbp and plotted relative to E14Tg2a. Error bars indicate the standard error of the mean (n = 3). (C) RT-qPCR analysis of the indicated transcripts in SCKO cells (Sox2fl/-) and in two Sox2fl/-; Sox3-/Y; Sox2fl/- clones (#36 and #37) grown in LIF/FCS condition and in Activin/FGF conditions for 2 passages (P2). mRNA levels were normalised to Tbp and plotted relative to ESCs (LIF/FCS). Error bars indicate the standard error of the mean (n = 3). (D) RT-qPCR analysis of the indicated transcripts in SCKO cells (Sox2fl/-) and in two Sox2fl/-; Sox3-/Y clones (#36 and #37) grown in LIF/FCS condition and in neural differentiation medium (N2B27) for the indicated number of hours. mRNA levels were normalised to Tbp and plotted relative to ESC (LIF/FCS). Error bars indicate the standard error of the mean (n = 3).
Figure 8—figure supplement 1
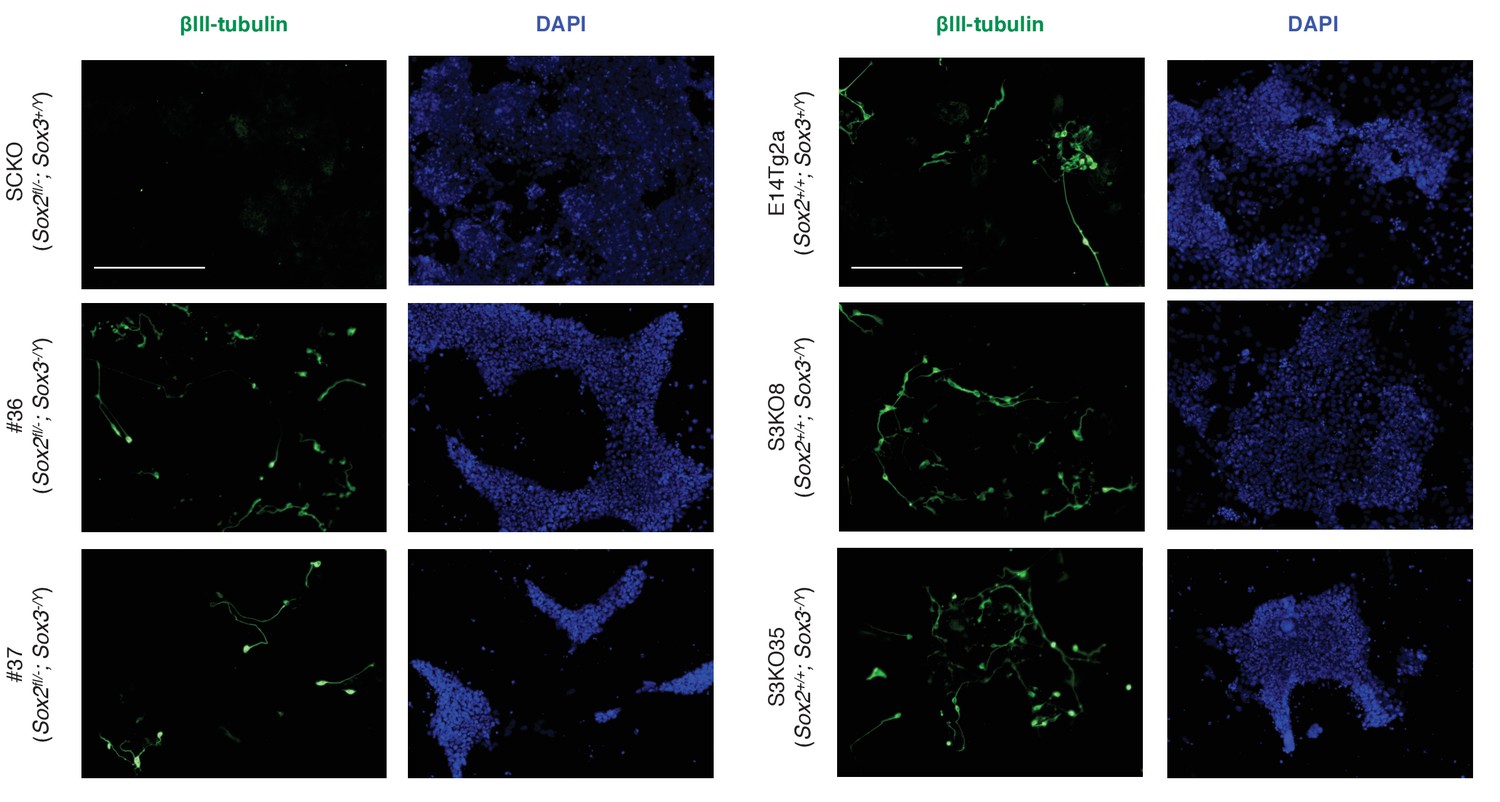
Immunofluorescence staining of the neural marker βIII-tubulin (TUJ1, green) in the indicated cells grown for 96 hr in neural differentiation medium (N2B27); DAPI staining represented in blue. Scale bar, 100 μm.
https://doi.org/10.7554/eLife.27746.023
Figure 8—figure supplement 2
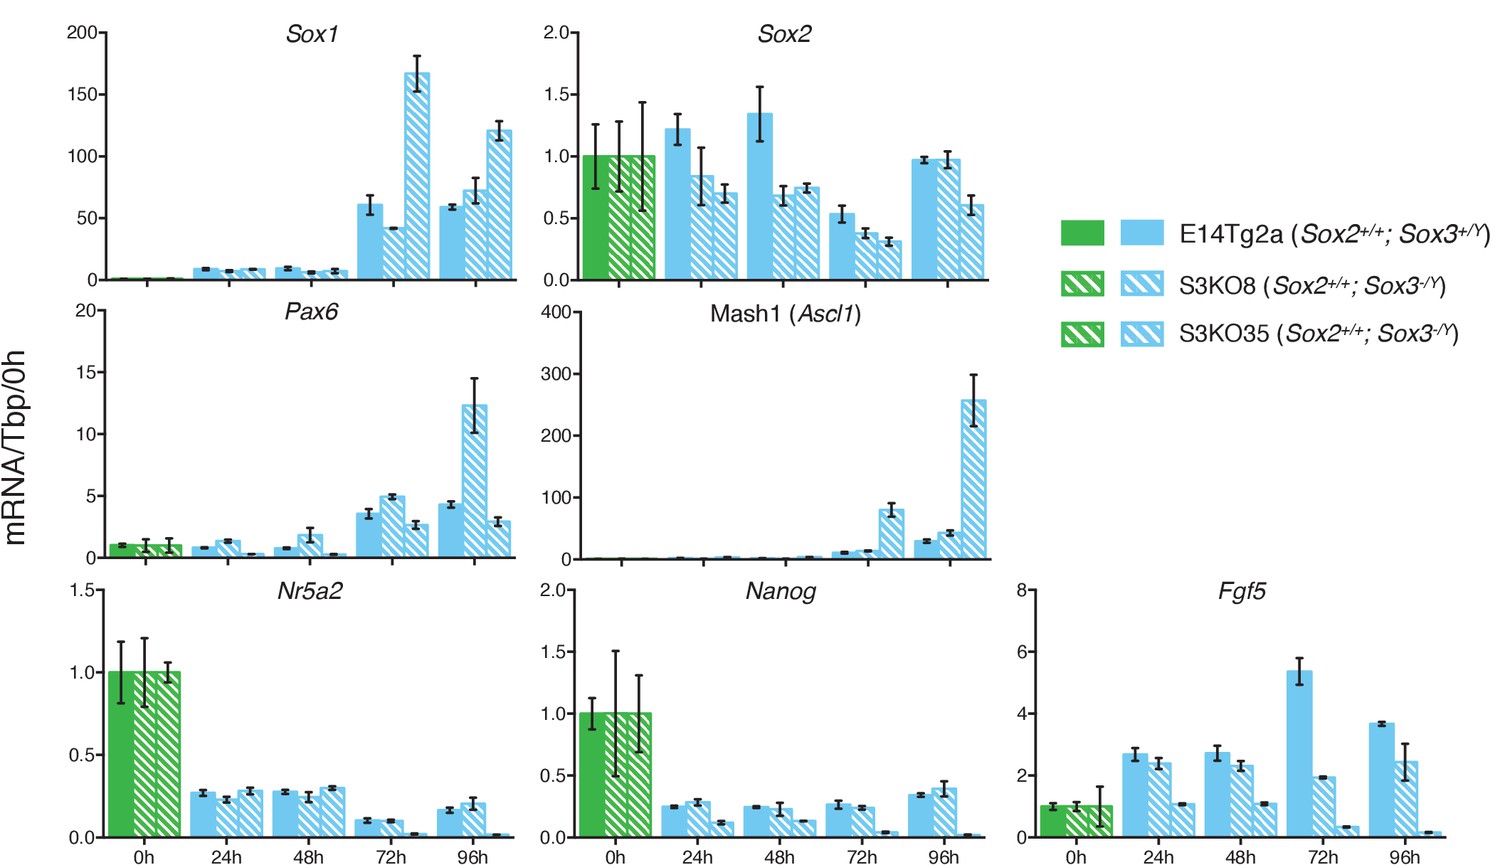
RT-qPCR analysis of the indicated transcripts in wild type E14Tg2a cells (Sox2+/+; Sox3+/Y) and in two Sox2+/+; Sox3-/Y clones (S3KO8 and S3KO35) (see Figure 3) grown in LIF/FCS conditions and neural differentiation medium (N2B27) for the indicated number of hours.
mRNA levels were normalised to Tbp and plotted relative to ESC (LIF/FCS). Error bars indicate the standard error of the mean (n = 3).
Figure 9

Dependence of cell fate potential of ESCs on the total SOXB1 concentration.
The overall SOXB1 concentration inferred from SoxB1 transcript levels in different SoxB1 mutant cell lines. Naïve ESCs self-renew in a wide range of SOXB1 concentrations. However, only ESCs with approximately wild-type SOXB1 levels can differentiate towards both primed EpiSCs and neural cells. ESCs with increased SOXB1 concentrations are poised towards neural differentiation, preventing their capture as primed EpiSCs in FGF/ActivinA. Decreased SOXB1 concentrations are insufficient to enable neural differentiation due to increased activity of neural antagonists (BMP and Nodal). A further reduction in SOXB1 is tolerated in the primed state due to SOX2/SOX3 functional redundancy but complete loss of the predominant SoxB1 forms is incompatible with self-renewal of both naïve and primed pluripotent cells. Depicted below are diagrams of pre- (E3.5) and postimplantation (E5.5 and E7.5) mouse embryos indicating the published expression patterns of SoxB1 mRNAs (Wood and Episkopou, 1999; Uchikawa et al., 2011; Avilion et al., 2003; Cajal et al., 2012), and the areas of BMP/Nodal signalling and inhibition during gastrulation (Constam and Robertson, 2000; Bachiller et al., 2000; Kinder et al., 2001; Levine et al., 2006; Pereira et al., 2012; Norris et al., 2002; Lawson et al., 1999; Perea-Gomez et al., 2002).
Additional files
-
Supplementary file 1
Microarray gene expression data described in Figure 1.
- https://doi.org/10.7554/eLife.27746.026
-
Supplementary file 2
List of the cell lines used in this study with their genotype and additional transgenes if present.
- https://doi.org/10.7554/eLife.27746.027
-
Supplementary file 3
List of the PCR primers and sgRNAs used in this study.
- https://doi.org/10.7554/eLife.27746.028
-
Transparent reporting form
- https://doi.org/10.7554/eLife.27746.029
Download links
A two-part list of links to download the article, or parts of the article, in various formats.
Downloads (link to download the article as PDF)
Open citations (links to open the citations from this article in various online reference manager services)
Cite this article (links to download the citations from this article in formats compatible with various reference manager tools)
Distinct SoxB1 networks are required for naïve and primed pluripotency
eLife 6:e27746.
https://doi.org/10.7554/eLife.27746


