The divergent mitotic kinesin MKLP2 exhibits atypical structure and mechanochemistry
- I-Mei Yu

- Alexander Cook
- Joseph M Muretta
- Agnel Joseph
- Jennifer Major
- Yannick Sourigues
- Jeffrey Clause
- Maya Topf
- Steven S Rosenfeld
- Anne Houdusse
- Carolyn A Moores
- Birkbeck College, United Kingdom
- Centre National de la Recherche Scientifique, Unité Mixte de Recherche, France
- University of Minnesota, United Sates
- Cleveland Clinic, United States
Figures
Figure 1 with 1 supplement
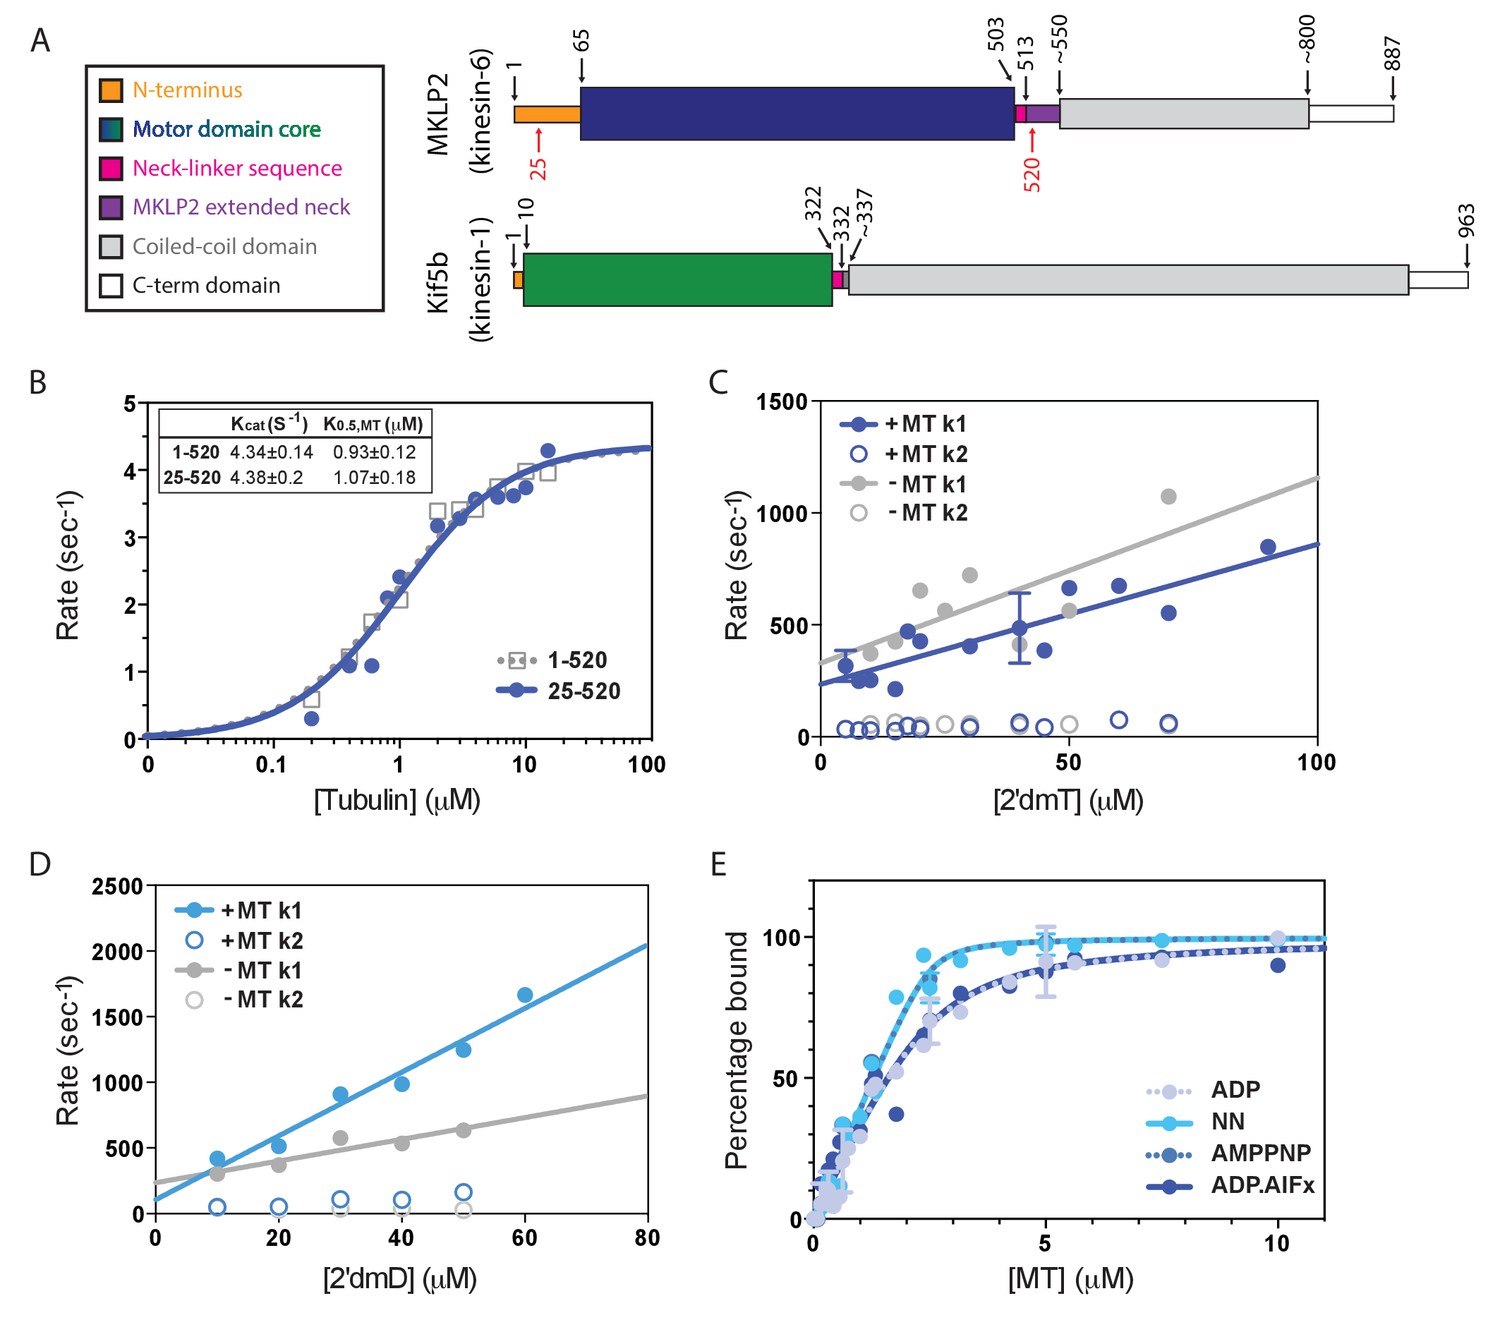
Atypical biochemistry of MKLP2 motor domain.
(A). Domain organisation of MKLP2 and Kif5b (Kin1). Residues at domain boundaries are shown; the construct characterised in this study is indicated by red numbers. The motor domains are coloured in dark blue and green for MKLP2 and Kin1, respectively, and this colour scheme is used throughout. (B) MT-activated steady state ATPase velocity plotted as a function of [tubulin] for MKLP2 1–520 (grey) or 25–520 (blue). Data were fit to a Michaelis Menten kinetic (dashed grey, solid blue curves) yielding values for kcat and K0.5,MT shown (inset). (C) Kinetics of binding of 2’ deoxy 3’ mant ATP (2’dmT) to MKLP2-MD (25-520). The fluorescence increase consists of a fast (solid circles) and slow (open circles) phase. The rate constants for the two phases for a complex of MKLP2 with MTs (blue) showed a dependence on [2’dmT] that is very similar to those in the absence of MTs (grey). In both the presence/absence of MTs, the rate constant for the faster phase varied linearly with [2’dmT], defining apparent second order rate constants and y intercepts that are very similar to each other. (D) Kinetics of binding of 2’ deoxy mant ADP (2’dmD) to MKLP2-MD (25-520). As in panel C, nucleotide free MKLP2 (grey) and nucleotide free MKLP2:MT (blue) were mixed with 2’dmD. (E) MT binding affinities of MKLP2-MD with different nucleotides. Kds were determined by fitting to a quadratic equation. Two technical replicates for 7 data points of the NN- and ADP- states were performed. Where technical replicates were performed, the average and SEM are plotted, otherwise individual data points are shown.
Figure 1—figure supplement 1
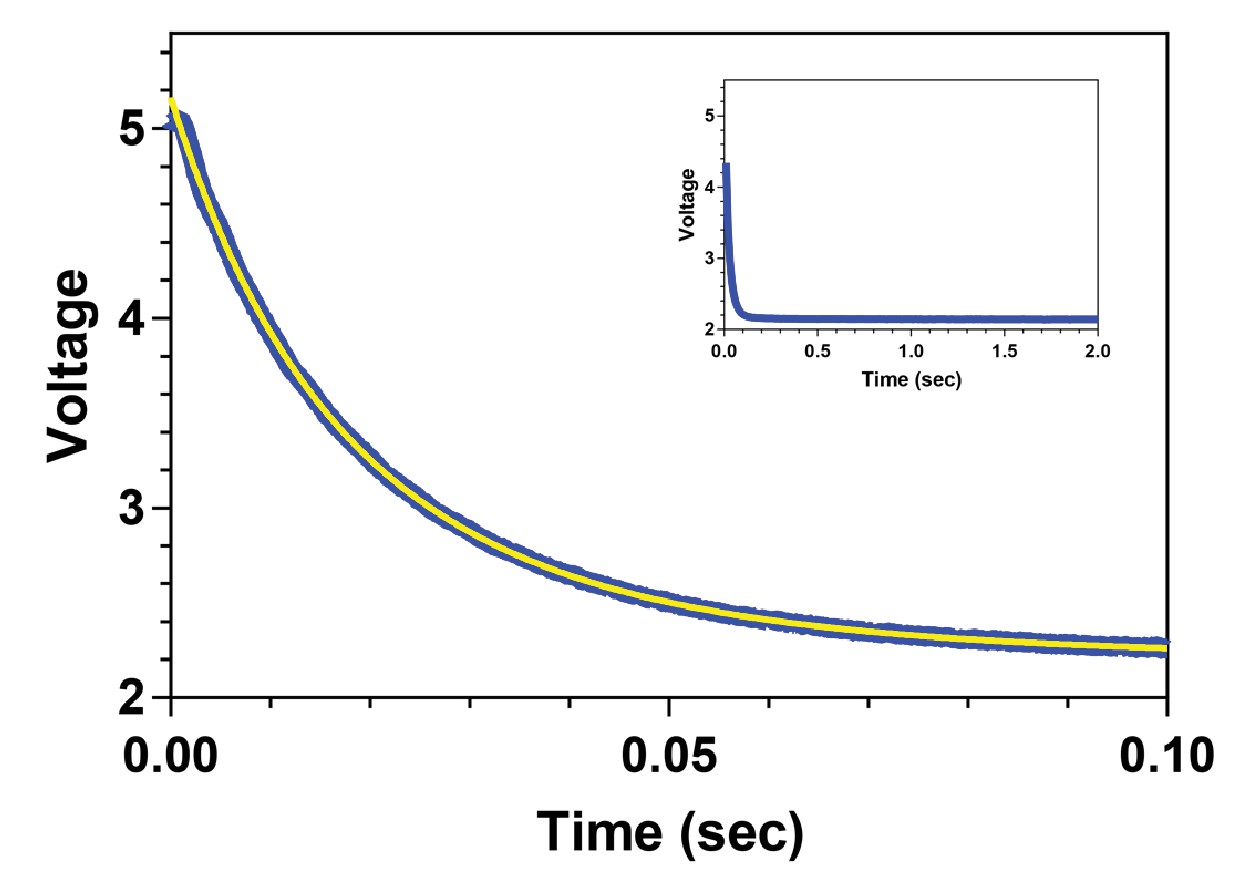
The rate of ADP release from MKLP2-MD in the absence of MTs is unusually high.
Fluorescence transient for the release of 2’ deoxy mant ADP (2’dmD) from MKLP2-MD in the presence of high concentrations of unlabelled ADP in the absence of MTs. The data are plotted in blue with the fit to a single exponential decay shown in yellow. The inset depicts a similar experiment on a 20-fold longer time scale, demonstrating that larger, slower kinetic components are not present in these data.
Figure 2 with 4 supplements
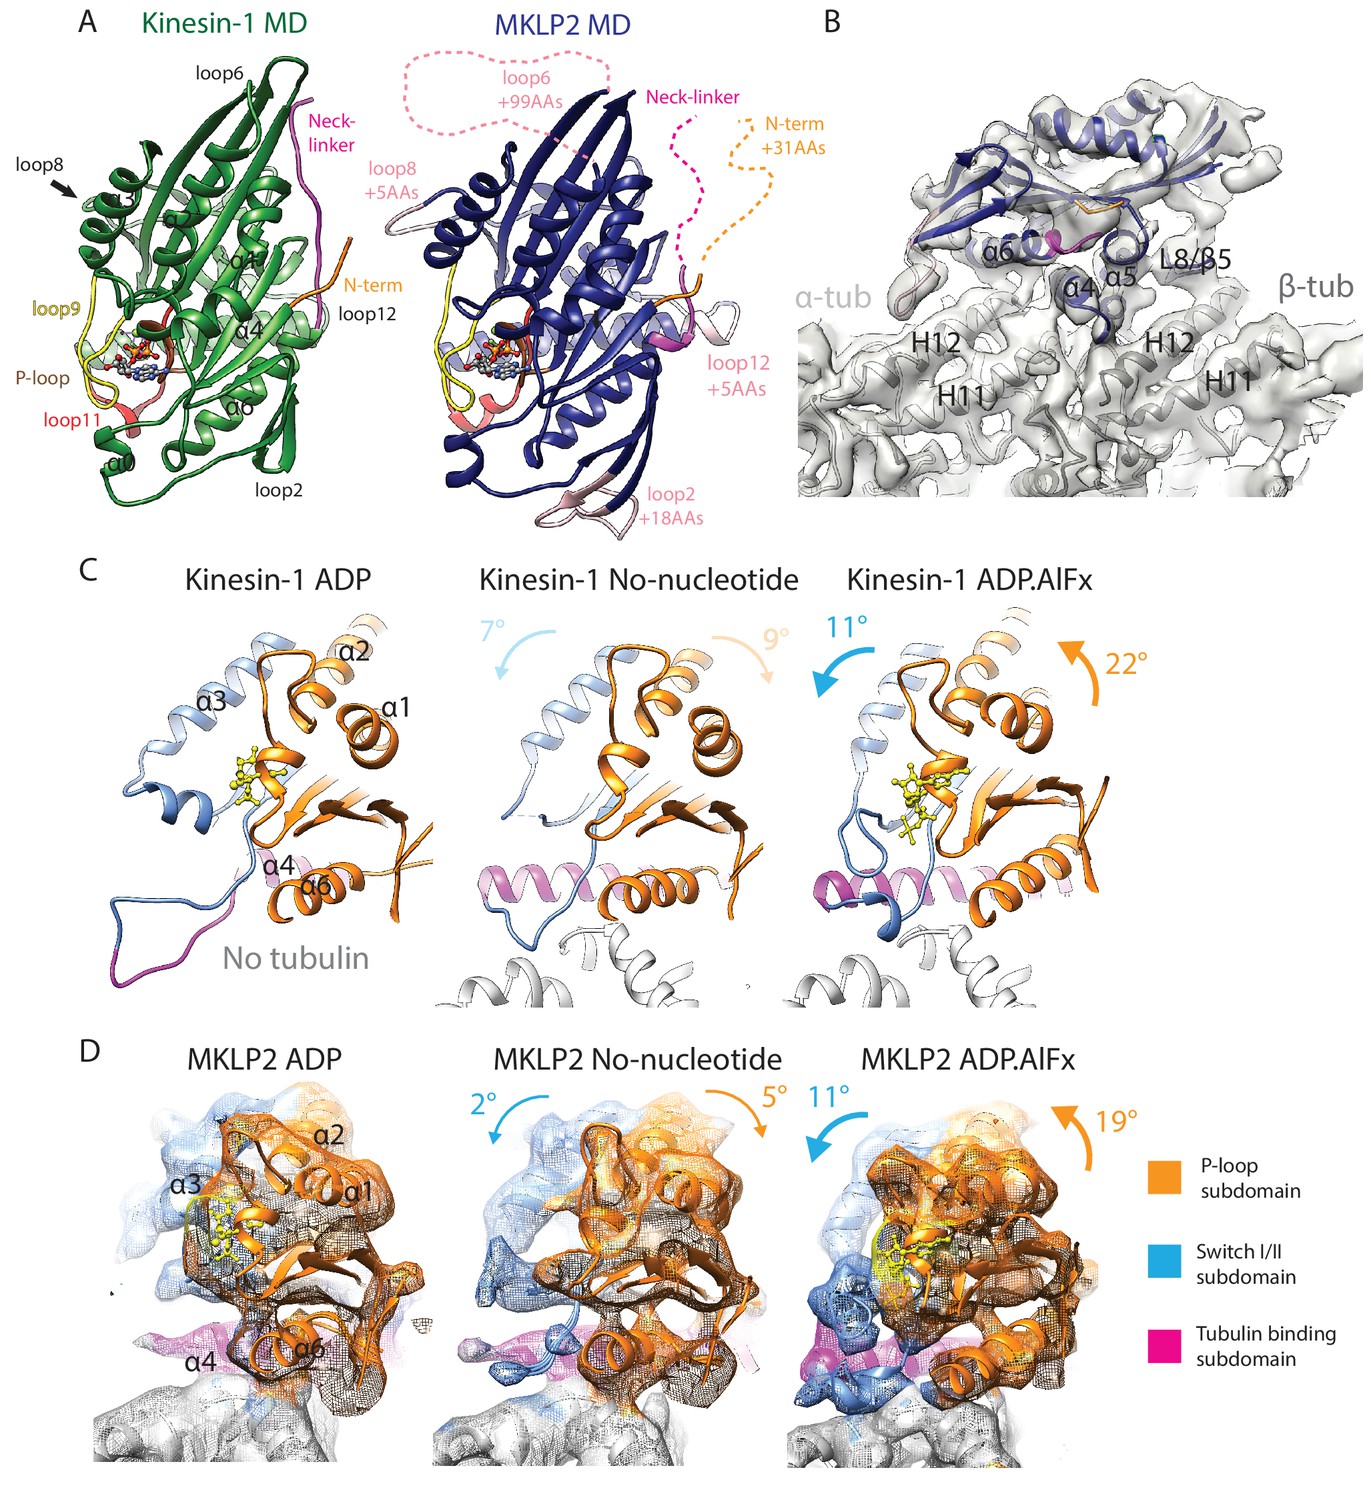
MKLP2 motor domain, cryo-EM reconstructions and nucleotide-dependent subdomain movements.
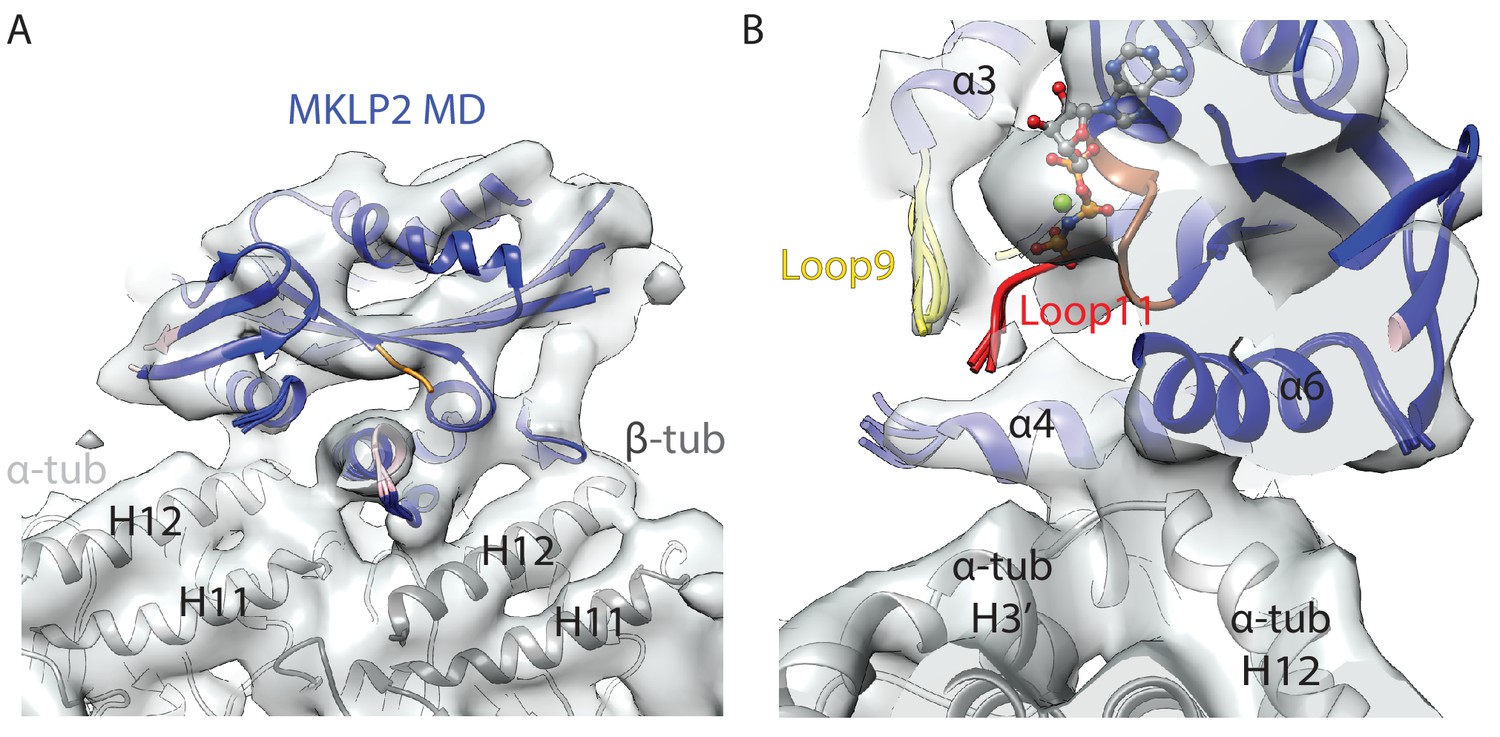
(A). The MKLP2-MD has multiple loop inserts compared to Kin1. The Kin1 MD-ADP.AlFx structure (PDB: 4HNA) is shown on the left. Our MKLP2-MD-ADP.AlFx model is shown on the right, with its specific loop inserts coloured and labelled in pink. The 25–520 construct contains 31 extra residues at its N-terminus compared to Kin1, while its C-terminus ends at an equivalent length. (B) The asymmetric unit of the MKLP2-MD-ADP.AlFx MT-bound cryo-EM reconstruction (grey transparent density) with docked MKLP2-MD model in blue, α-tubulin model in light grey and β-tubulin model in dark grey. MKLP2-MD and tubulin secondary structure elements at the interface are labelled. (C and D) Subdomain rearrangements in Kin1 crystal structures (C) and MKLP2-MD (D) viewed towards the MT plus end. Subdomains for kinesin-1 and MKLP2-MD are assigned and coloured based on Cao et al (Cao et al., 2014). (C) Kinesin-1: left, ADP (PDB: 1BG2); middle, NN + tubulin (PDB: 4LNU); right ADP.AlFx +tubulin (PDB: 4HNA). (D) The MKLP2-MD models are shown within cryo-EM density also coloured by subdomain. For each nucleotide-dependent transition, subdomain rotations for the P-loop and SwitchI/II subdomains are shown in degrees relative to the tubulin binding subdomain, which remains static in all states. Subdomain movements between Kin1 ADP and NN states (indicated in light text) are not directly comparable to their MKLP2-MD counterparts, because the Kin1-ADP structure is not tubulin-bound and has an atypical tubulin-binding subdomain conformation.
Figure 2—figure supplement 1
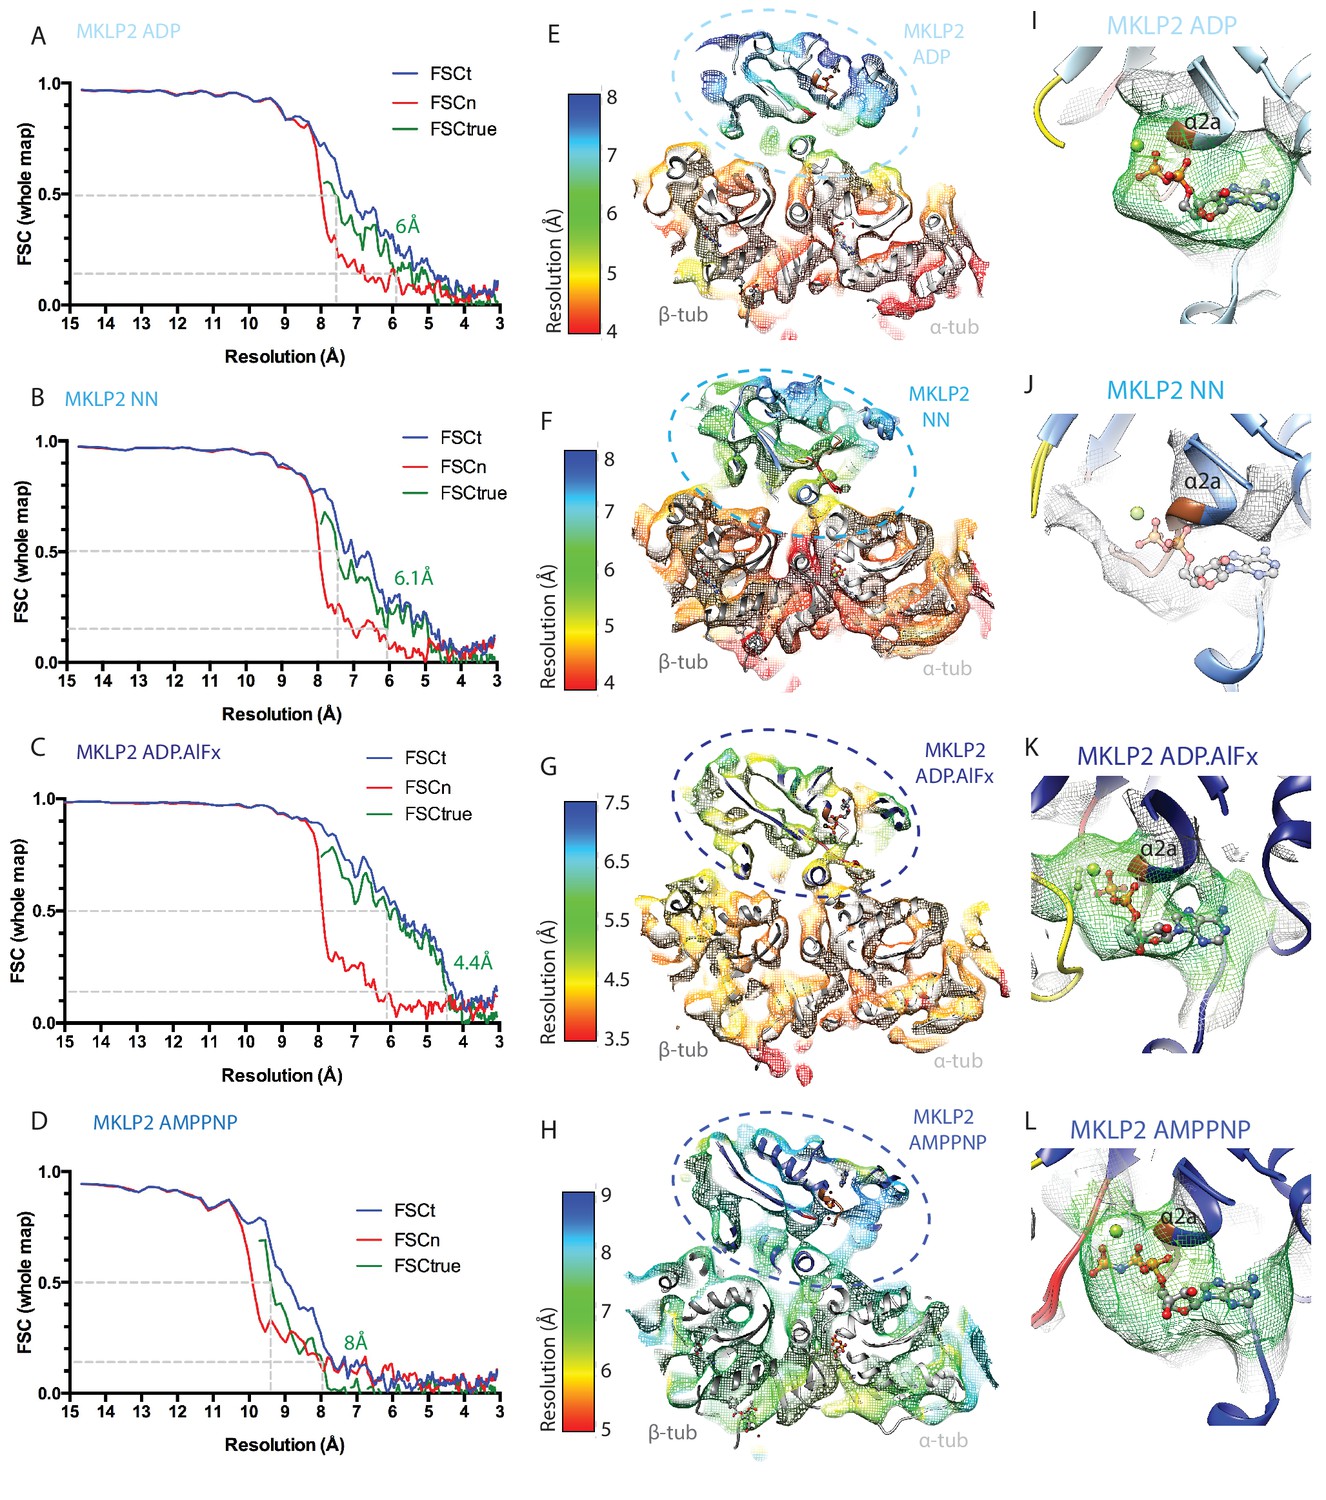
Evaluation of the resolutions and nucleotide occupancy of the MKLP2-MD-MT reconstructions.
(A-D) Overall resolutions of each reconstruction were estimated from 0.143 criteria of the FSCtrue curves calculated according to the gold-standard noise-substitution method (Chen et al., 2013); (A) MKLP2-MD-ADP-MT, (B) MKLP2-MD-NN-MT, (C) MKLP2-MD-ADP.AlFx-MT D) MKLP2-MD-AMPPNP-MT. (E–H) Local resolutions in the asymmetric unit of each reconstruction were estimated using the blocres program implemented in Bsoft (Cardone et al., 2013), and are depicted as slices through the reconstruction with the comparative models docked. These show generally higher resolutions for tubulin and regions of the MKLP2-MD proximal to tubulin; (E) MKLP2-MD-ADP-MT, (F) MKLP2-MD-NN-MT, (G) MKLP2-MD-ADP.AlFx-MT, (H) MKLP2-MD-AMPPNP-MT. Each reconstruction is coloured using the most individually informative color range. (I–L) Zoomed in view of the nucleotide pocket in I) MKLP2-MD-ADP, (J) MKLP2-MD-NN, (K) MKLP2-MD-ADP.AlFx, (L) MKLP2-MD-AMPPNP reconstructions. Density, represented as mesh, <8 Å away from the model’s nucleotide is shown and density <5 Å away is coloured in green. In the case of the MKLP2-MD-NN, the ADP of the MKLP2-MD-ADP model is shown as translucent sticks after the two models were superimposed, reflecting the absence of density for nucleotide in the MKLP2-MD-NN reconstruction consistent with our sample preparation procedures.
Figure 2—figure supplement 2
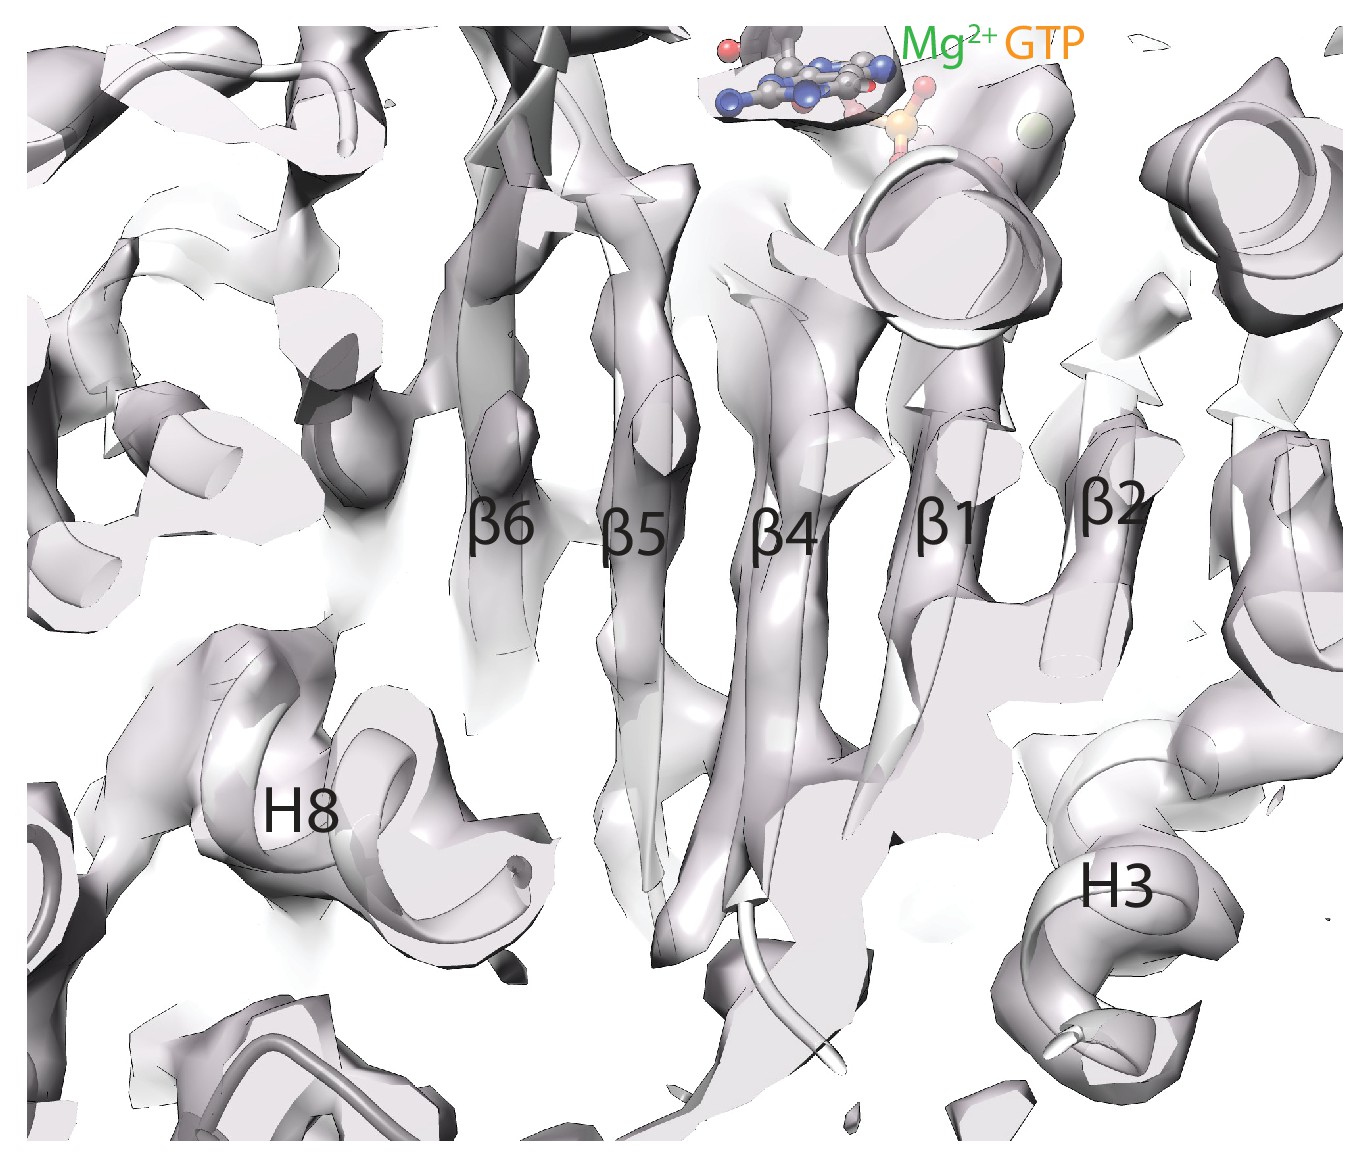
High-resolution tubulin density features.
Cryo-EM density for the central region of α-tubulin in the MKLP2-MD ADP.AlFx reconstruction after a B-factor of −200 is applied to 4.2 Å to reflect local resolution estimates (as shown in Figure 2—figure supplement 1). Beta-strand separation and helical pitch are resolved, consistent with a resolution in this region of <4.5 Å.
Figure 2—figure supplement 3
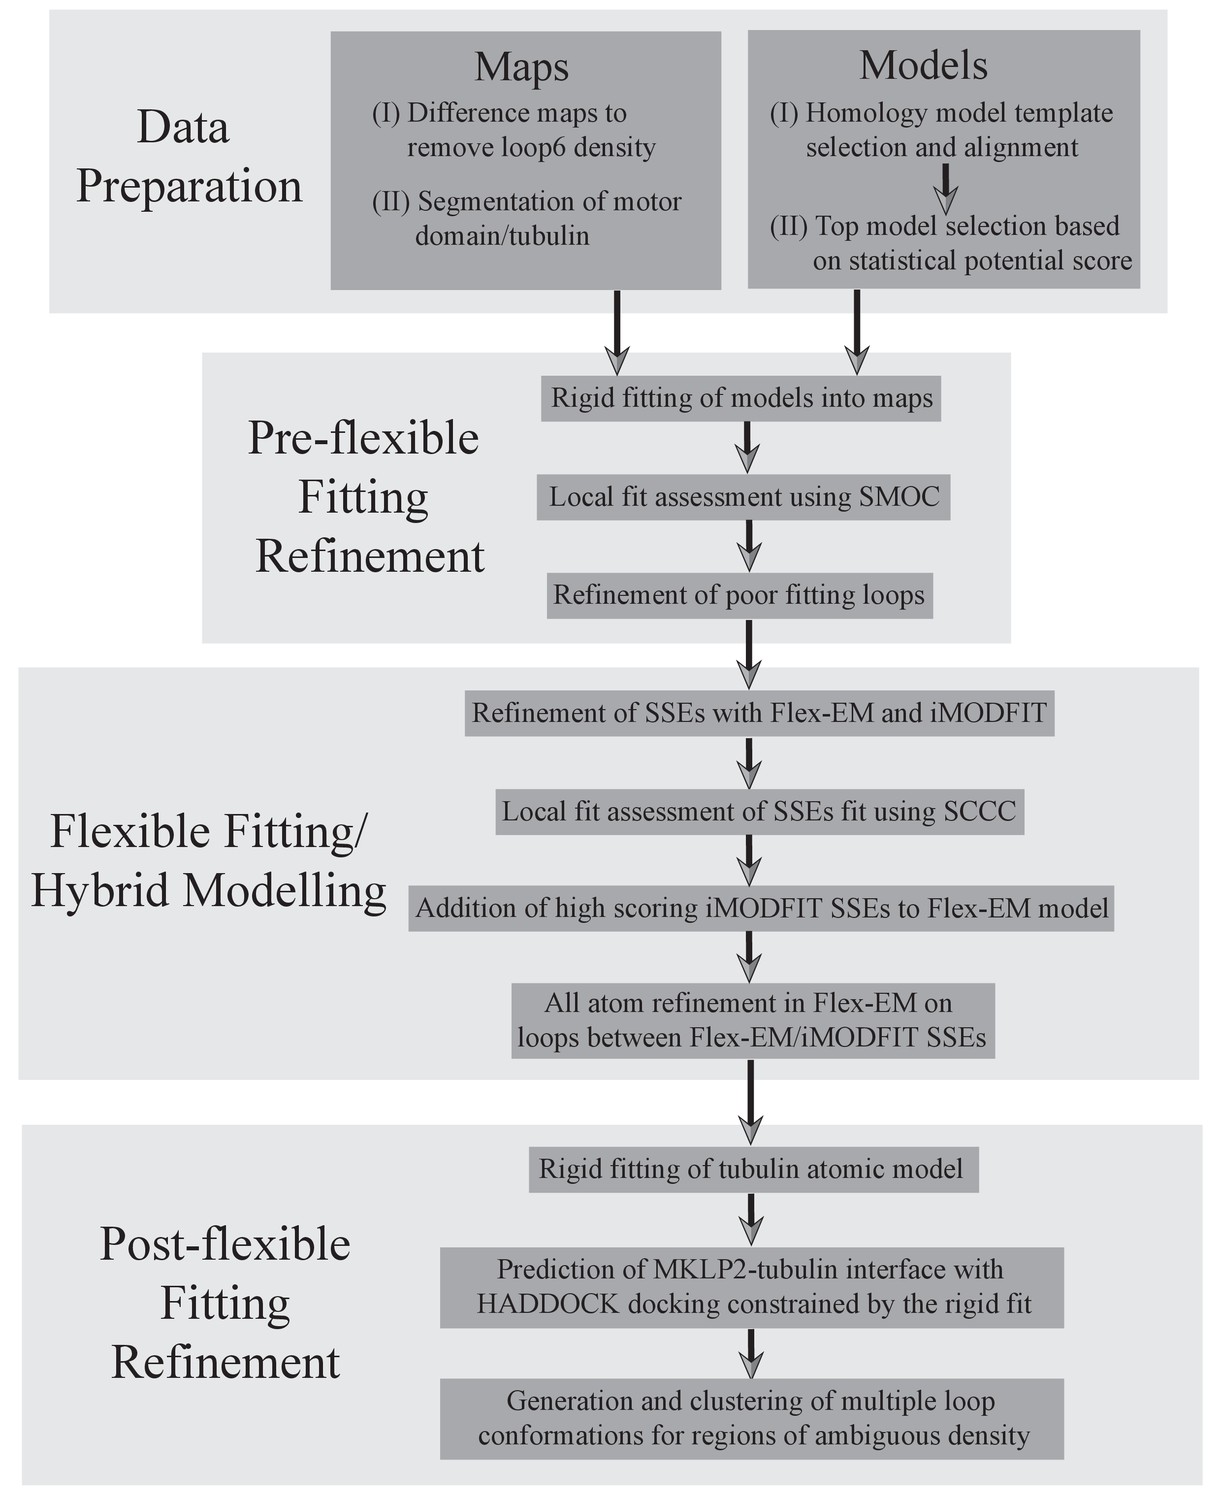
A protocol describing the different stages for creating atomic models of MKLP2-MD.
The first step was a data preparation stage, involving generation and selection of MKLP2-MD homology models (described in detail in methods), and appropriate segmentation of the maps to avoid model biases. Second, a pre-flexible fitting refinement stage was used to identify poor fitting loops using local cross-correlation calculations (Figure 2—figure supplement 4), and to generate and select better fitting loops. In the third stage, flexible fitting was performed in a hybrid manner, combining results from Flex-EM and iMODFIT as guided by local cross-correlation calculations for secondary structure elements. Finally, docking was used to predict the MKLP2-MD-tubulin interface, and multiple loop conformations were calculated to represent regions of ambiguous density.
Figure 2—figure supplement 4
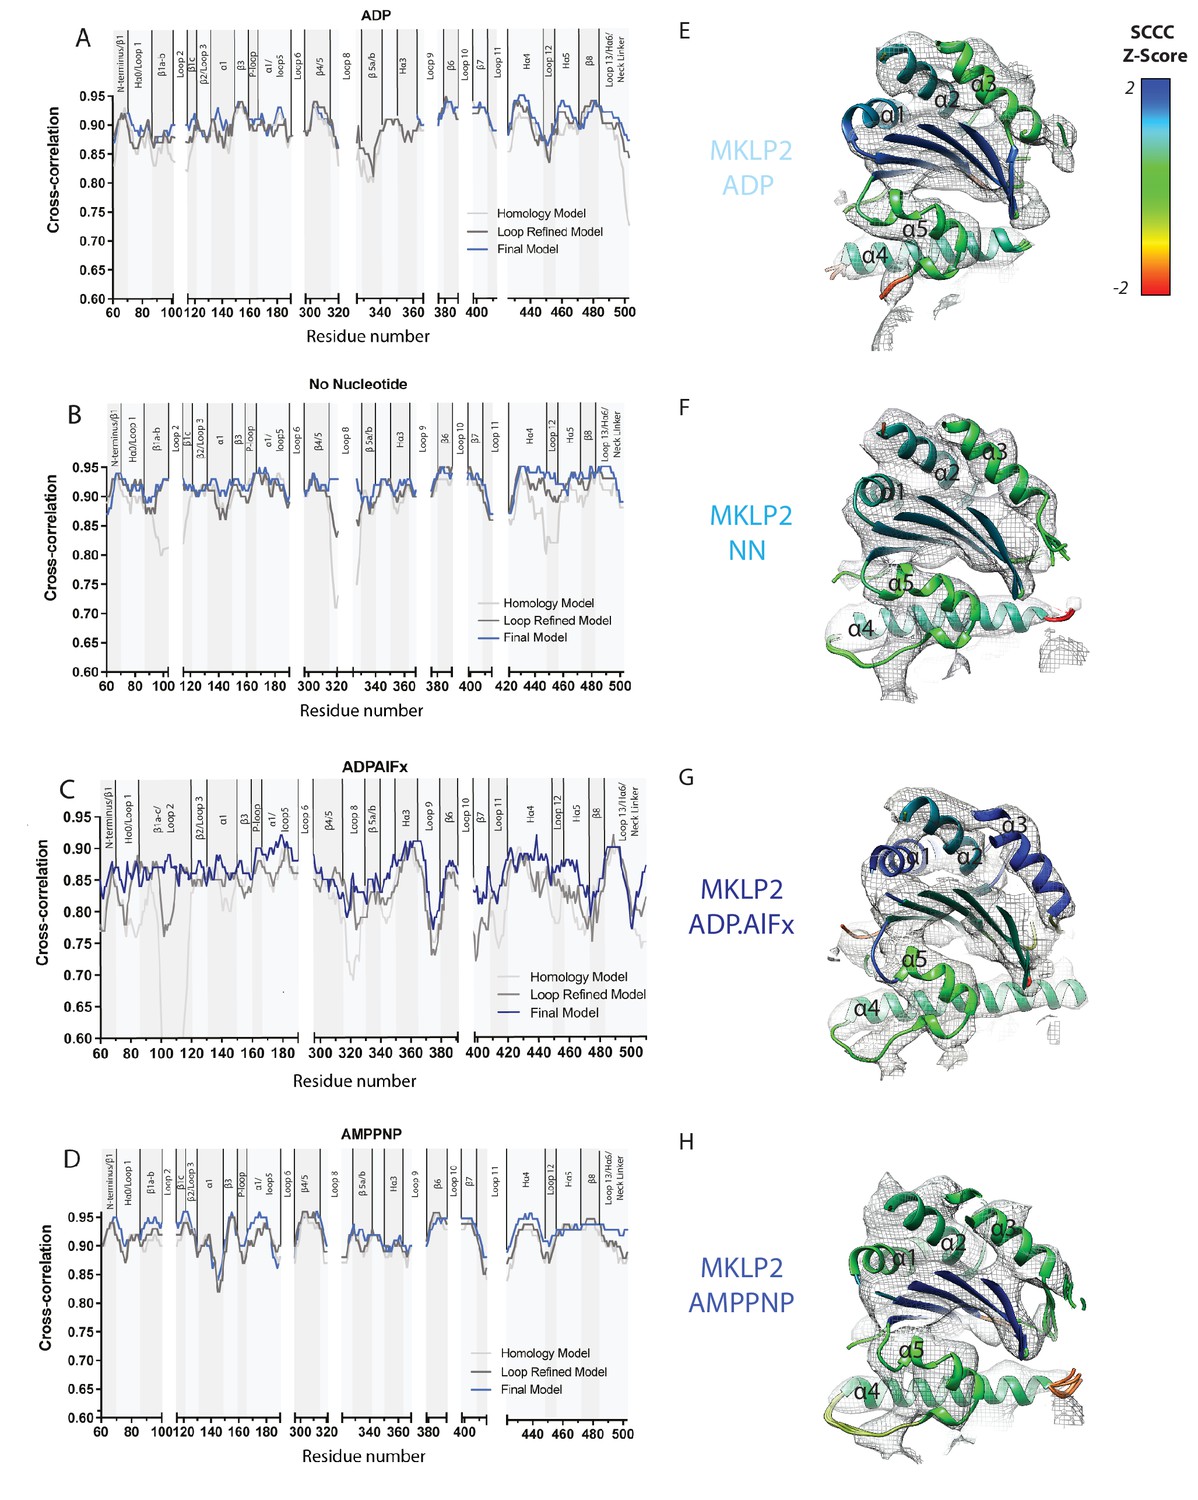
Local Fitting Improves at Each Model Refinement Stage.
Local cross-correlation scores were calculated for (A) MKLP2-MD-ADP (B) MKLP2-MD-NN (C) MKLP2-MD-ADP.AlFx (D) MKLP2-MD-AMPPNP models using SMOC scoring in TEMPy. SMOC scores were sequentially calculated for homology models (light grey), loop refined models (dark grey), and the final flexibly fitted models (blue) to represent progression in model fitting. Exemplar SCCC scores for flexible fits of SSEs in MKLP2 as shown in cut-away views of the E) MKLP2-MD-ADP, (F) MKLP2-MD-NN, (G) MKLP-MD-ADP.AlFx, (H) MKLP2-MD-AMPPNP reconstructions, with density in mesh and the corresponding fitted models colored according to normalised SCCC score as a measure of local fit quality for individual secondary structural elements. Secondary structural elements with poor density at density at conservative thresholds, such as loop12 shown for the AMPPNP model, are represented where possible with clusters of multiple solutions to reflect the uncertainty in their conformational modelling or are removed where this is not possible.
Figure 3 with 3 supplements
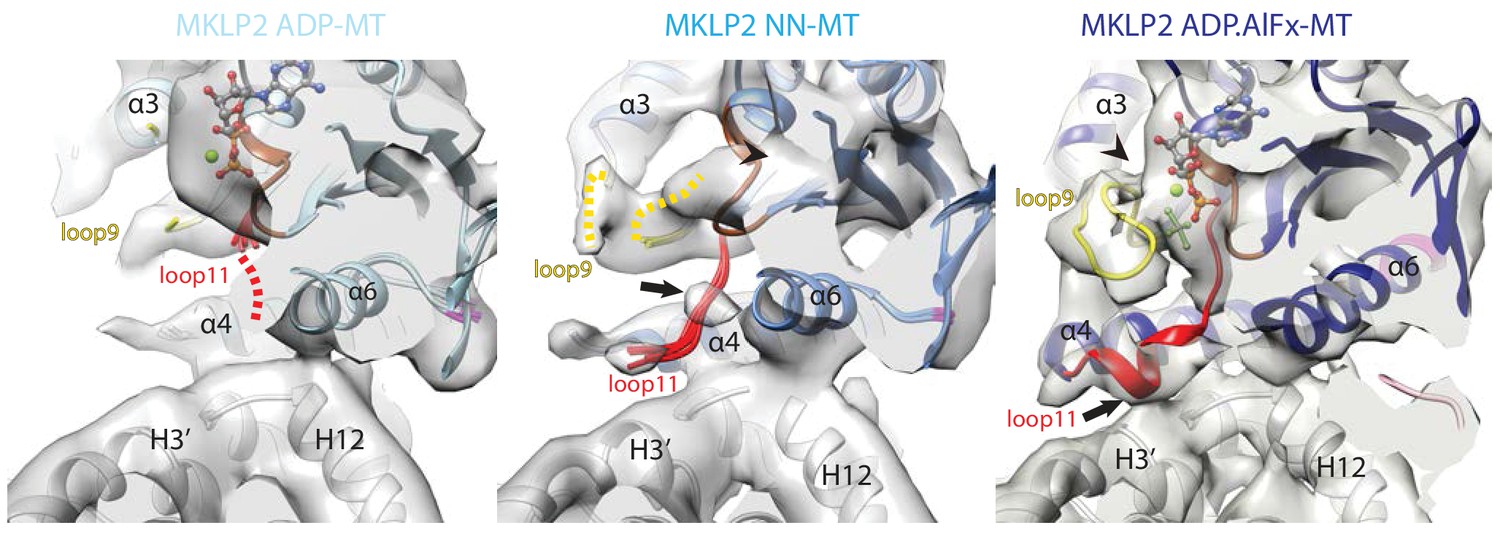
Conservation and divergence at the MKLP2-MD nucleotide binding pocket.
View of the MKLP2-MD nucleotide binding pocket showing nucleotide-dependent transitions in helix-α4, P-loop (brown), loop9 (yellow) and loop11 (red). In the ADP state (left), density corresponding to ADP is visible and connected to the P-loop, while in the NN state (middle), density for nucleotide is no longer present (arrowhead). In the ADP.AlFx state, a hydrolysis-competent ‘closed’ nucleotide pocket conformation is observed, loop11 becomes fully ordered with a single helical turn contacting α–tubulin H3’ (arrow), and loop9 forms an ordered β-hairpin which contacts the nucleotide (arrowhead).
Figure 3—figure supplement 1
Comparison of MKLP2 nucleotide binding site with other N-kinesins.
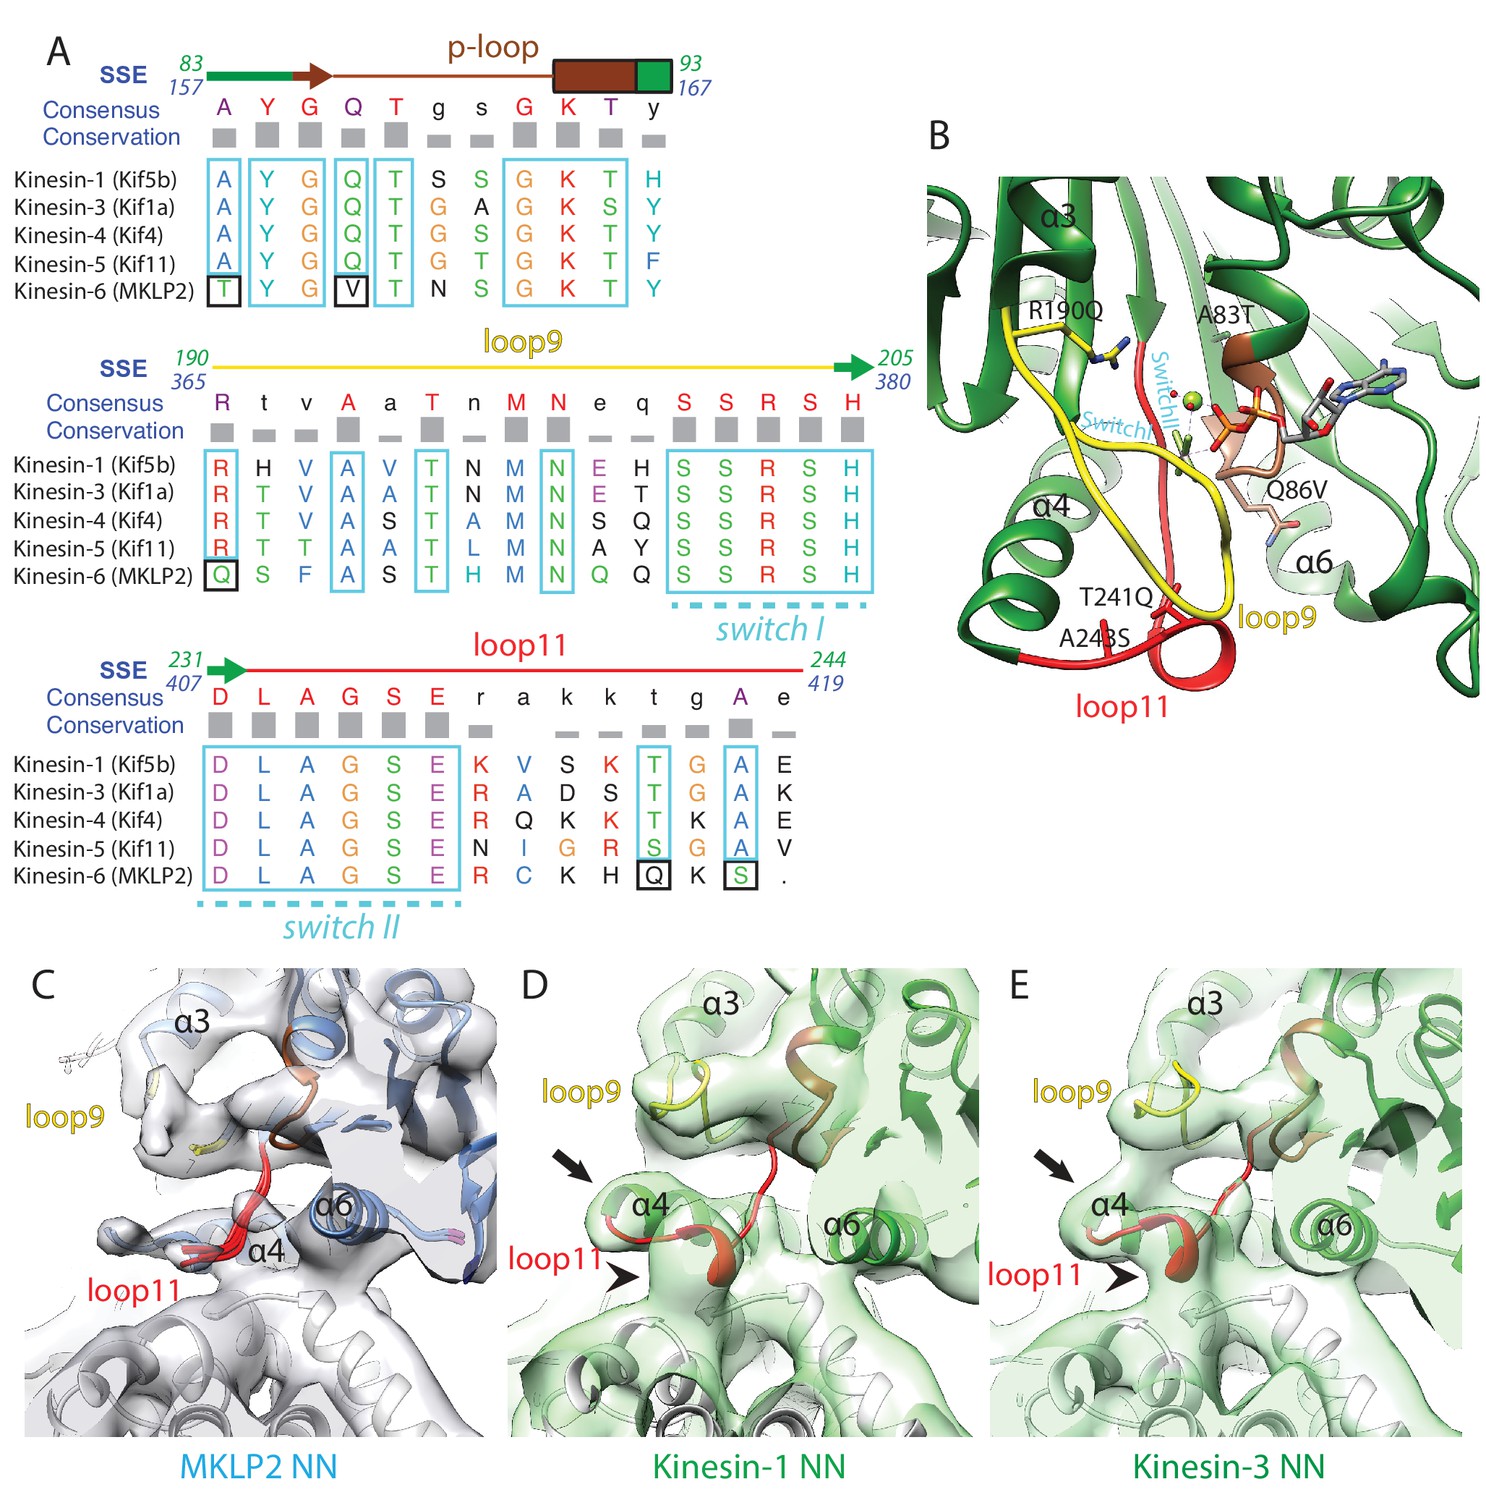
(A) Sequence alignment of important regions at the nucleotide pocket for kinesin-6 MKLP2 and representative members from other Kin1/3/4/5 for which X-ray structures are available. Residue letters are coloured according to their properties according to the Clustal X scheme (Larkin et al., 2007). Information on consensus, conservation and secondary structure is shown above the alignments. Sequence numberings for Kif5B (Kin1, green) and MKLP2 (kinesin-6, blue) are shown adjacent to the secondary structure schematics. Highly conserved/similar kinesin residues are boxed in light blue, whereas highly conserved kinesin residues which have diverged are boxed in black. The signature kinesin switch I and II sequences are indicated. (B) The nucleotide pocket of the X-ray structure of tubulin-bound Kin1 in the presence of ADP.AlFx (PDB 4HNA, [Gigant et al., 2013]). The position of the switch I/II sequences are annotated in cyan, whilst those that have diverged in MKLP2 are shown in sticks and annotated in black, in format Kin1 amino-acid, Kin1 amino-acid number, mouse MKLP2 amino-acid. (C–E) The nucleotide binding regions in the NN states of (C) kinesin-6 MKLP2, (D) Kin1 Kif5a and (E) Kin3 Kif1A (Atherton et al., 2014) are shown in their corresponding experimental densities (grey density for MKLP2-MD, green densities for Kin1 and Kin3). Arrows indicate full extension of helix-α4’s N-terminus in this state and arrowheads indicate formation of a single-turn helix in loop11 for Kin3 and Kin1 that contacts the MT, in contrast to MKLP2 where these regions are less ordered.
Figure 3—figure supplement 2
Conservation of nucleotide-dependent subdomain movements and location and configuration of the clefts that separate them in Kin1 and MKLP2.
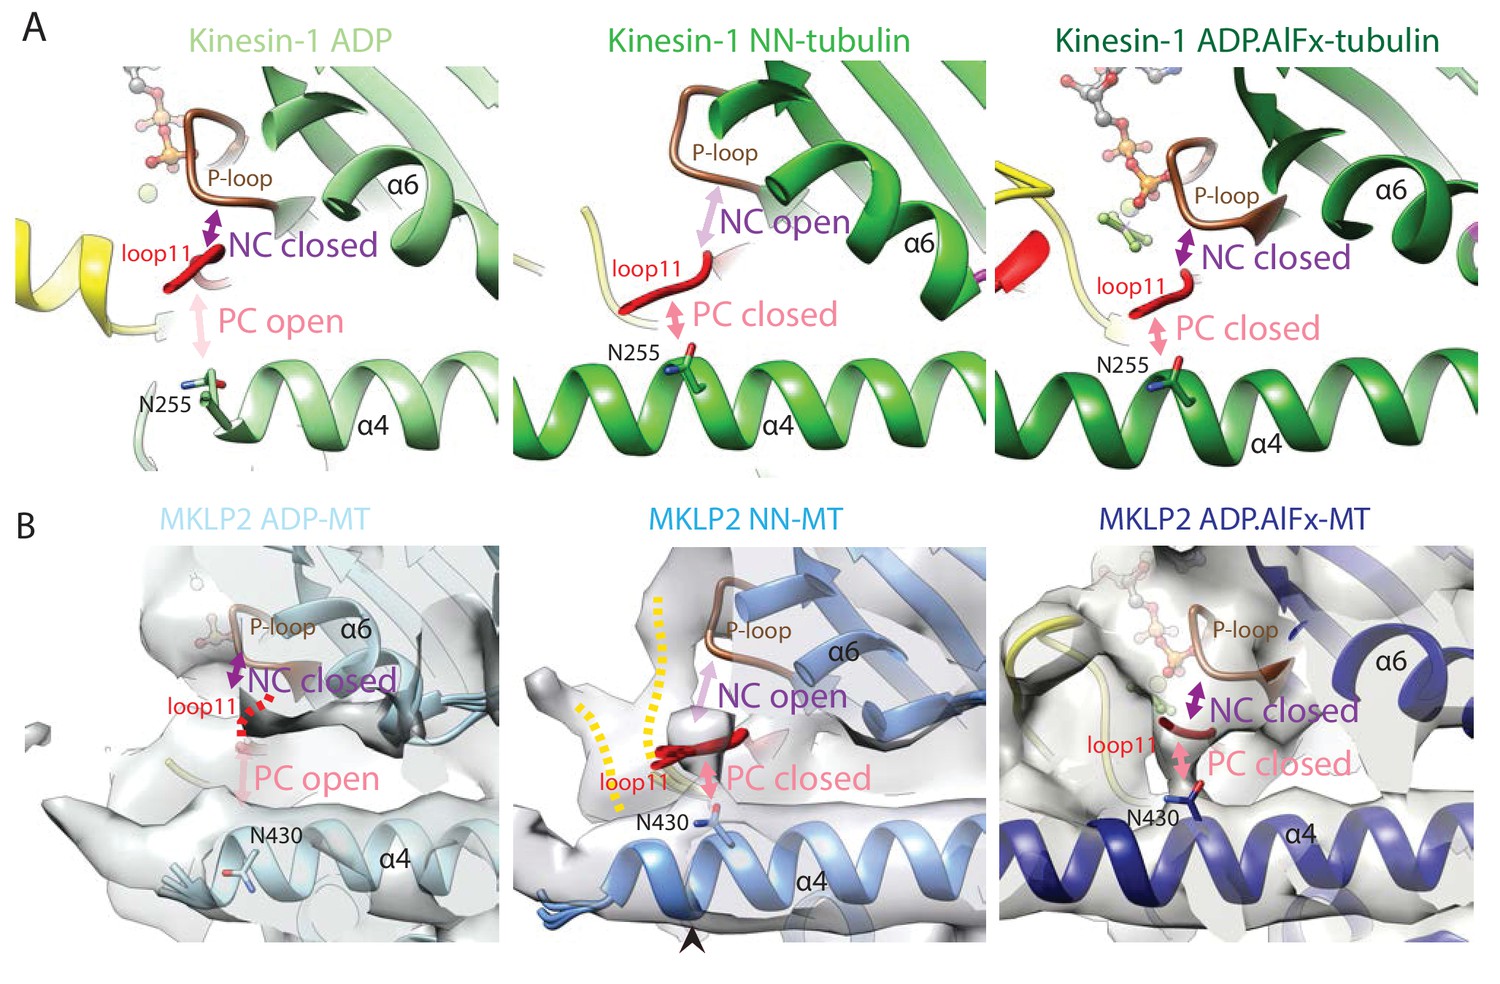
(A). The NC and PC in Kin1 ADP (PDB: 1BG2), NN (PDB: 4LNU) and ADP.AlFx crystal structures (PDB: 4HNA). With ADP, the NC is closed (loop11 contacts the P-loop) while the PC is open (loop11 does not contact helix-α4). In the NN state, the NC opens (loop11 releases its contact with the P-loop and instead associates with helix-α4) and the PC closes. In the ADP.AlFx state the PC remains closed and the NC closes as loop11 contacts both the P-loop and helix-α4. The position of N255, which reorientates upon nucleotide release to contact loop11 and close the polymer cleft is shown (Shang et al., 2014). (B) MKLP2 follows the same state-dependent sequence of changes at the NC and PC clefts as Kin1. MKLP2-MD cryo-EM density is shown in transparent grey with the same views shown as for Kin1 in panel A. The predicted position of N430 (corresponding to kinesin-1’s N255) in the models is indicated.
Figure 3—figure supplement 3
MT-bound MKLP2-MD-AMPPNP does not adopt an ‘ATP-like state’.
(A) Side profile of the asymmetric unit of the MKLP2-MD-AMPPNP reconstruction, showing MT binding site similar to that seen in other nucleotide states. The fitted MKLP2-MD-AMPPNP model is in blue, the α-tubulin model is in light grey and the β-tubulin model is in dark grey. (B) View, similar to Figure 3C, of the nucleotide-binding site of the MKLP2-MD-AMPPNP reconstruction.
Figure 4 with 2 supplements
MKLP2-specific loop insertions at the MT interface and global tilt and shift of MKLP2-MD on the MT surface.
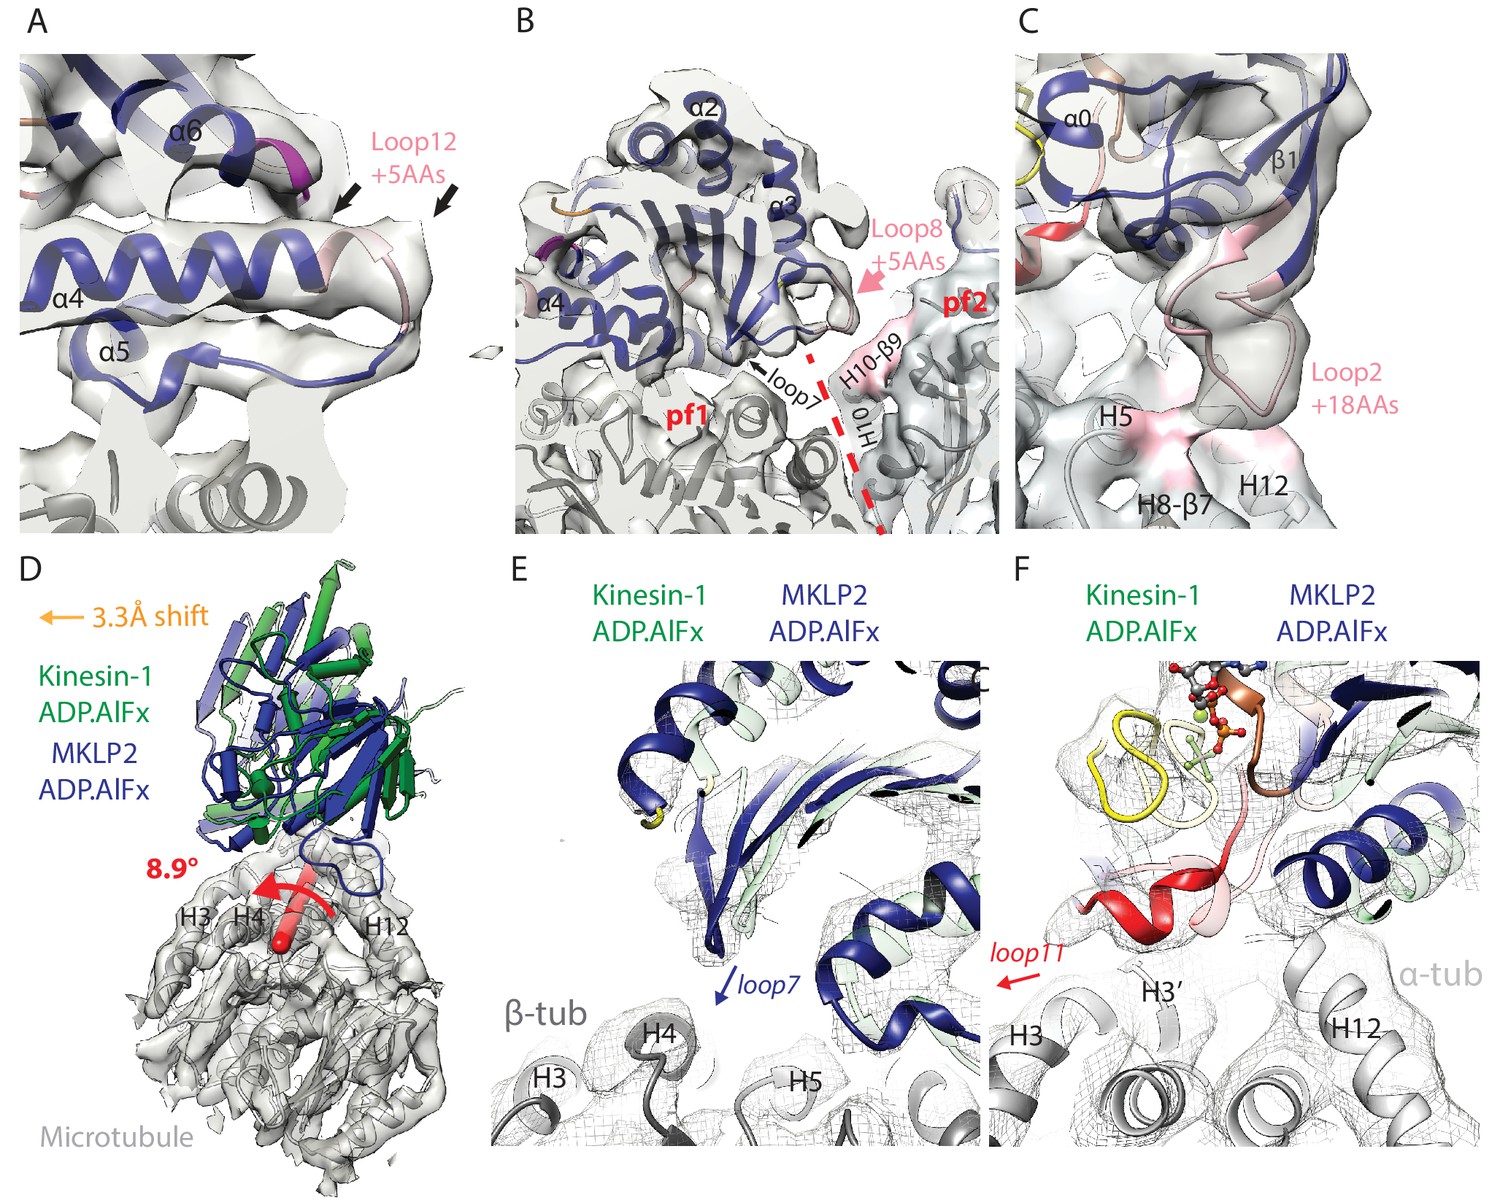
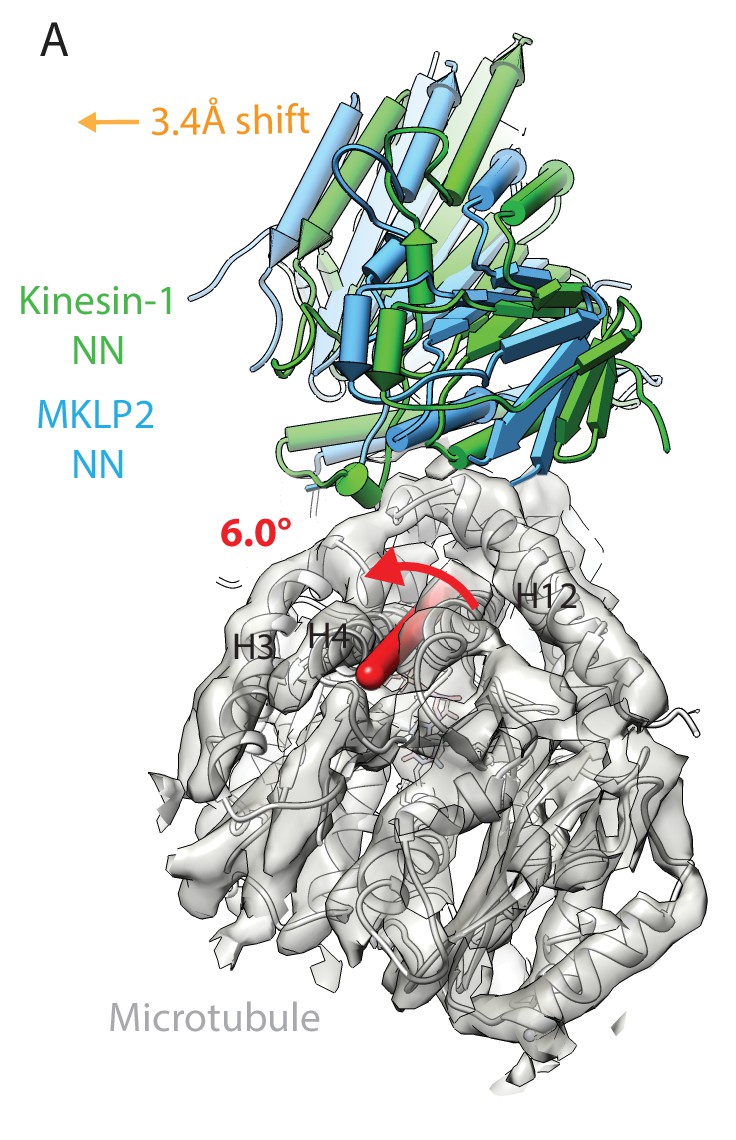
(A). Loop12 insertion (pink) partially contributes to the C-terminal extension of helix-α4 (extra length indicated by arrows) but does not contact the MT. This extension is present in all nucleotide states; shown here for MKLP2-MD-ADP.AlFx. (B) In MKLP2-MD-ADP.AlFx the loop8 insertion (pink) reaches across to β-tubulin in the adjacent protofilament (pf, demarcated by a red dashed line). Tubulin density <7 Å away from the insertion is coloured in pink. (C) In MKLP2-MD-ADP.AlFx the loop2 insertion (pink) reaches towards the MT minus end contacting α-tubulin. Tubulin density <7 Å away from the insertion is coloured in pink. (D) Overlay of asymmetric unit MKLP2-MD-ADP.AlFx MT-bound model (blue pipes and planks) and Kin1 (green pipes and planks) MT-bound model (Atherton et al., 2014) when the tubulin dimers are superimposed. The density and model of tubulin in the MKLP2-MD-ADP.AlFx model is shown (transparent grey density). When their tubulins are aligned, a global shift (orange arrow indicates shift direction) and rotation (on the axis shown in red) of the MKLP2-MD on the MT surface is observed compared to Kin1. (E) This relative shift and rotation moves MKLP2-MD’s (blue model) loop7 closer to β-tubulin. (F) MKLP2-MD Loop11 is further from α-tubulin H12 and closer to H3 in comparison to Kin1 (green transparent model). Density for MKLP2-MD-ADP.AlFx-MT (grey mesh).
Figure 4—figure supplement 1
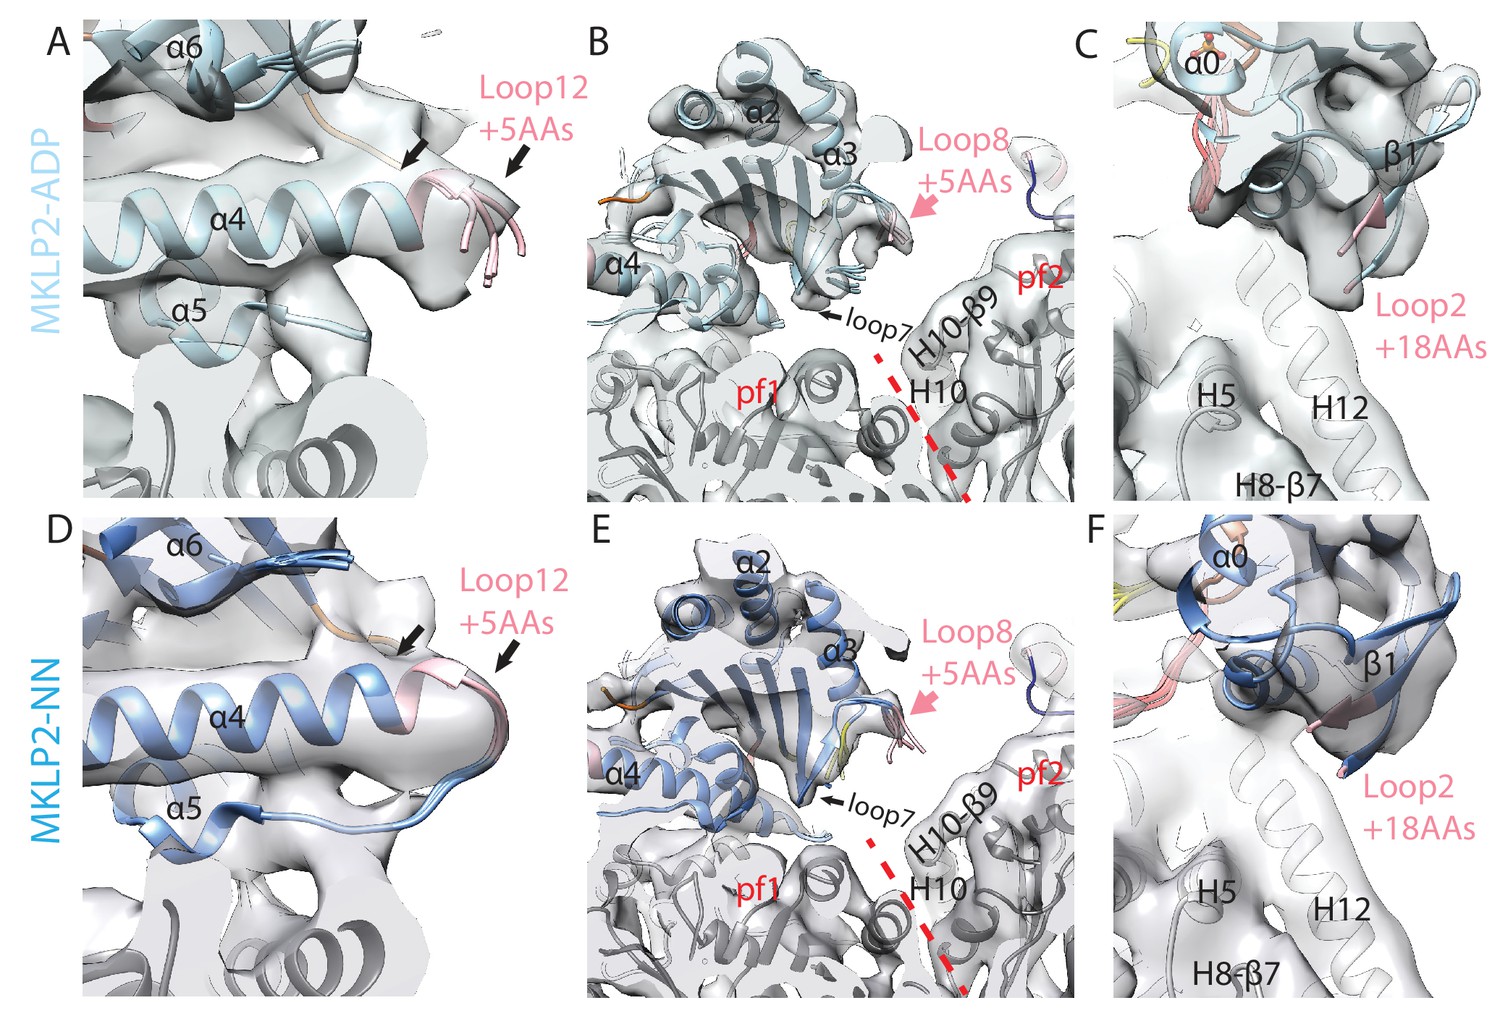
MKLP2 specific inserts are nucleotide sensitive.
Views of (A) loop12, (B) loop8 and C) loop2 as in Figure 4A,B and C respectively for the MKLP-MD-ADP reconstruction. Views of D) loop12, (E) loop8 and F) loop2 as in Figure 4A,B and C respectively for the MKLP-MD-NN reconstruction. Loop12 density was not clear in the ADP and NN states at the thresholds used in Figure 4A for the MKLP2-MD-ADP.AlFx reconstruction, suggesting higher flexibility; although there was some density at less conservative thresholds (not shown) allowing modelling of conformers. Densities for loop8 and loop2 in the ADP and NN states were absent except at much less conservative thresholds and therefore were not modelled.
Figure 4—figure supplement 2
MKLP2 has an altered binding orientation on the MT surface in all nucleotide states.
(A) Overlay of asymmetric unit MKLP2-MD-NN MT-bound model (blue pipes and planks) and kinesin-1 (green pipes and planks) MT-bound model (Atherton et al., 2014) when the tubulin dimers are superimposed. The density and model of tubulin in the MKLP2-MD-NN model is shown (transparent grey density). When their tubulins are aligned, a global shift (orange arrow indicates shift direction) and rotation (on the axis shown in red) of the MKLP2-MD on the MT surface is observed with respect to Kin1.
Figure 5 with 1 supplement
MKLP2 has an altered footprint on the MT surface.
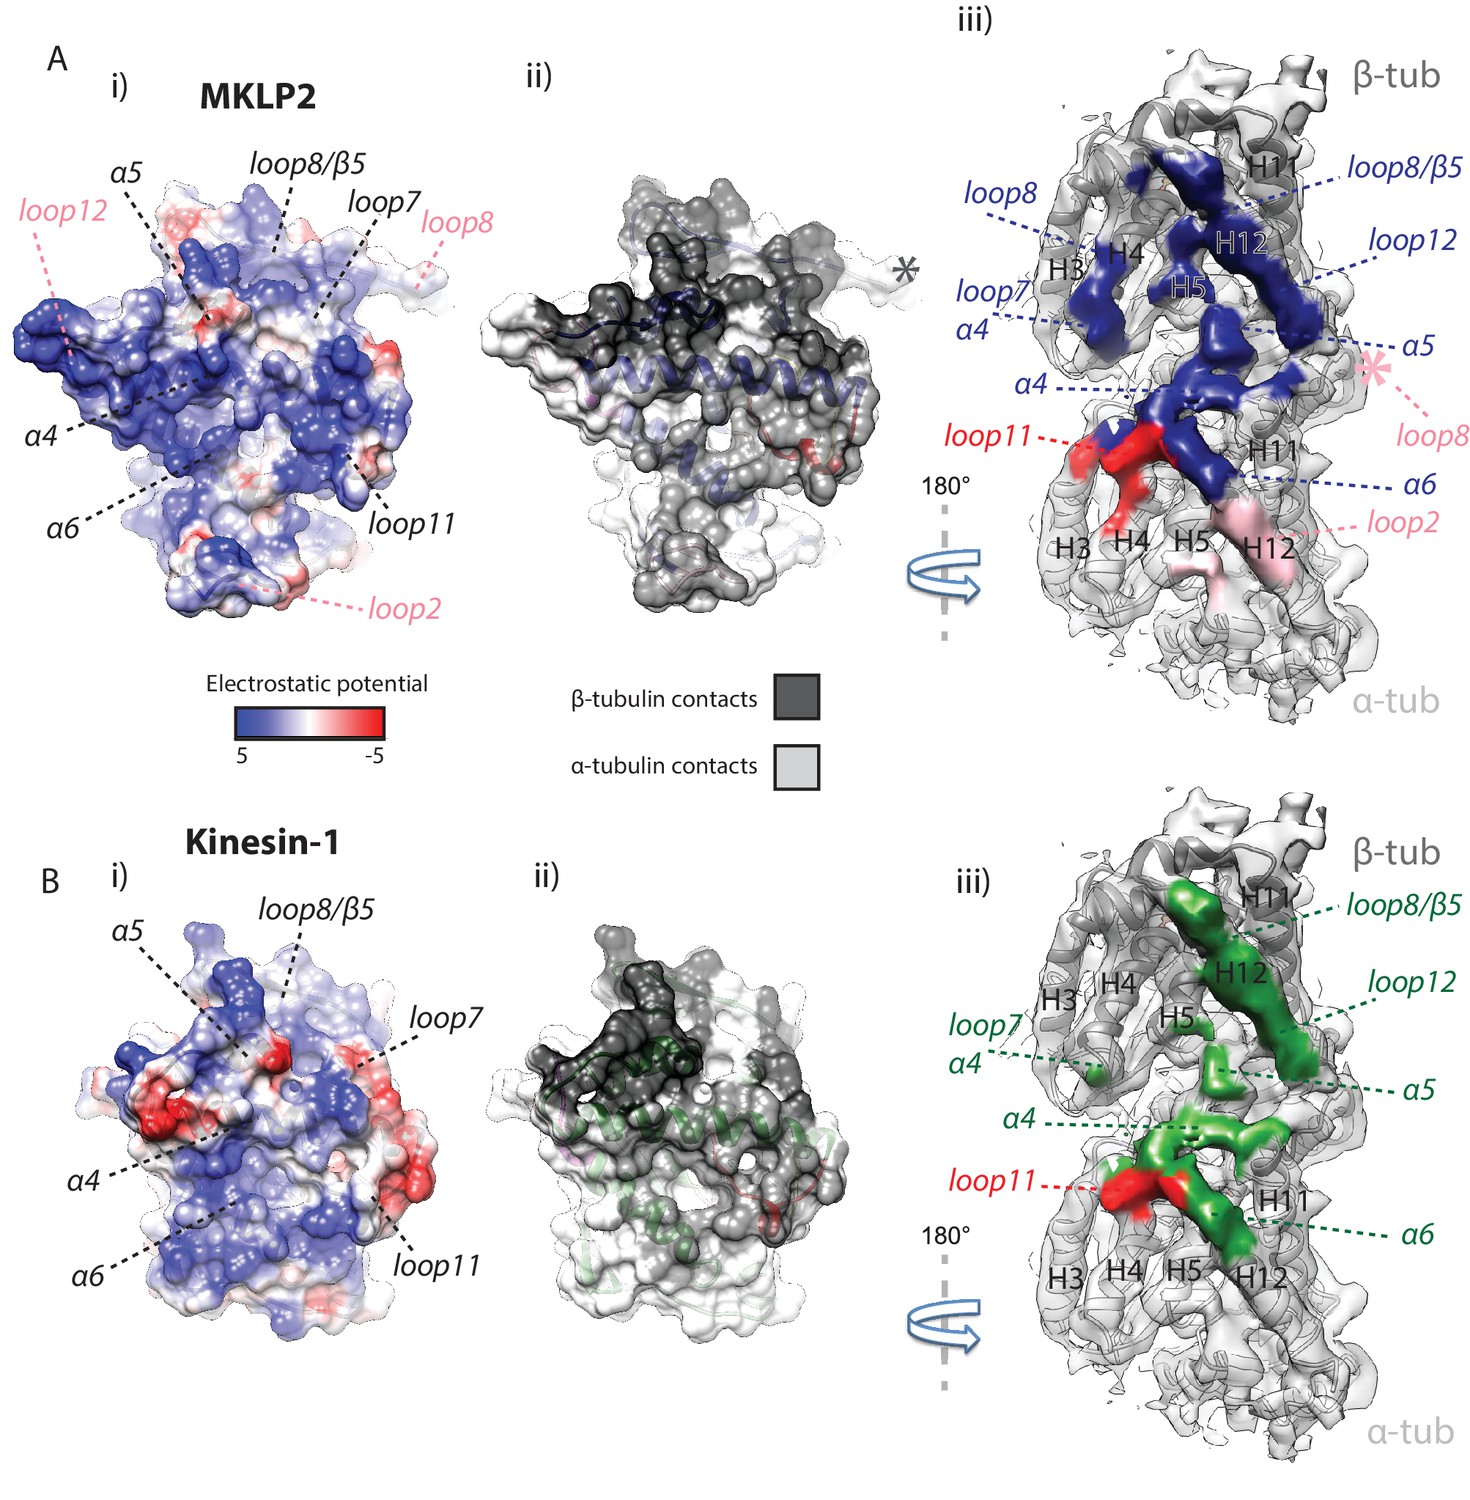
The binding interface of (A) MKLP2-MD-ADP.AlFx compared to (B) Kin1-MD-ADP.AlFx. (i) The binding surface of MKLP2-MD and Kin1 coloured according to the electrostatic potential. (ii) The binding surface of MKLP2-MD and Kin1 coloured according to α- or β-tubulin contacts. (iii) MT footprint of MKLP2-MD (top) compared to Kin1 (bottom). Coloured labels and dashed lines indicate contacting secondary structure elements in each motor. Tubulin density <7 Å distance from the bound motors is coloured. In MKLP2-MD-ADP.AlFx, loop2 is ordered and contacts α-tubulin (pink density) while the ordered loop8 contacts the neighbouring tubulin asymmetric unit (pink asterisk).
Figure 5—figure supplement 1
MKLP2 has an altered footprint on the MT surface in all nucleotide states.
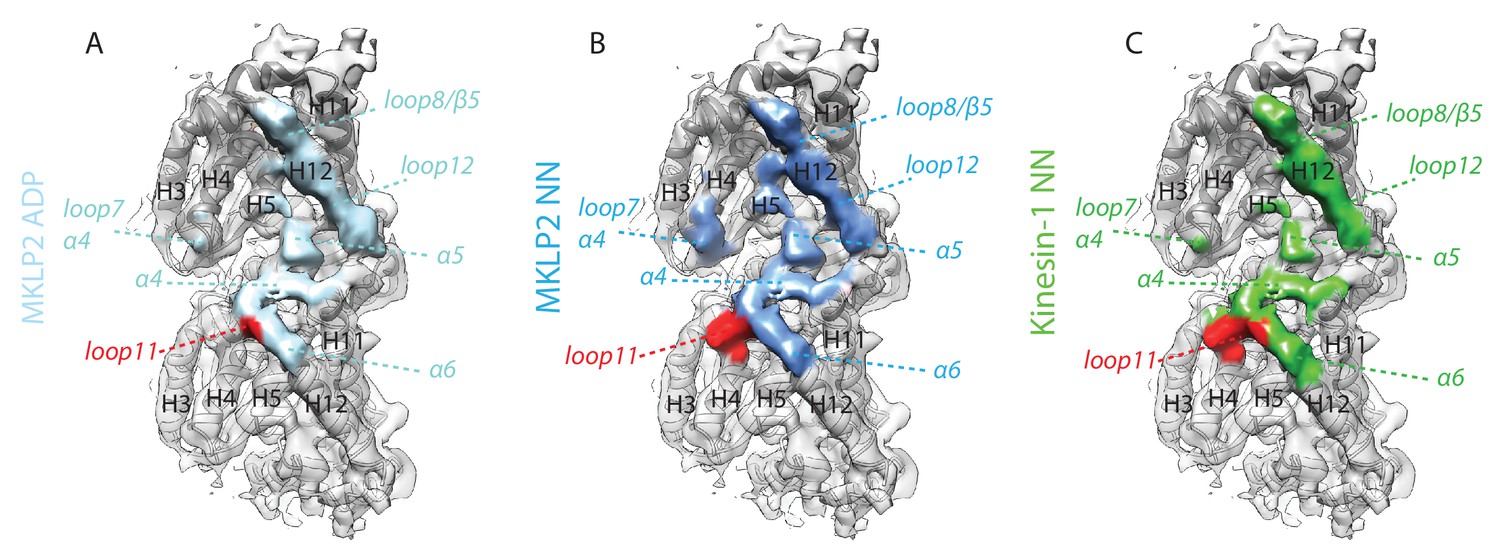
The MT binding surface of (A) MKLP2-MD-ADP, (B) MKLP-MD-NN compared to (C) Kin1-NN. Secondary structure elements at the binding interface are annotated. A single tubulin dimer is shown where black labels indicate tubulin secondary structure elements on α-tubulin (light grey model) and β-tubulin (dark grey model). Colored labels and dashed lines indicate respective contacting secondary structure elements of MKLP2-MD or kinesin-1. Tubulin density <7 Å distance from the bound motors is coloured.
Figure 6 with 2 supplements
MKLP2 neck-linker response to nucleotide.
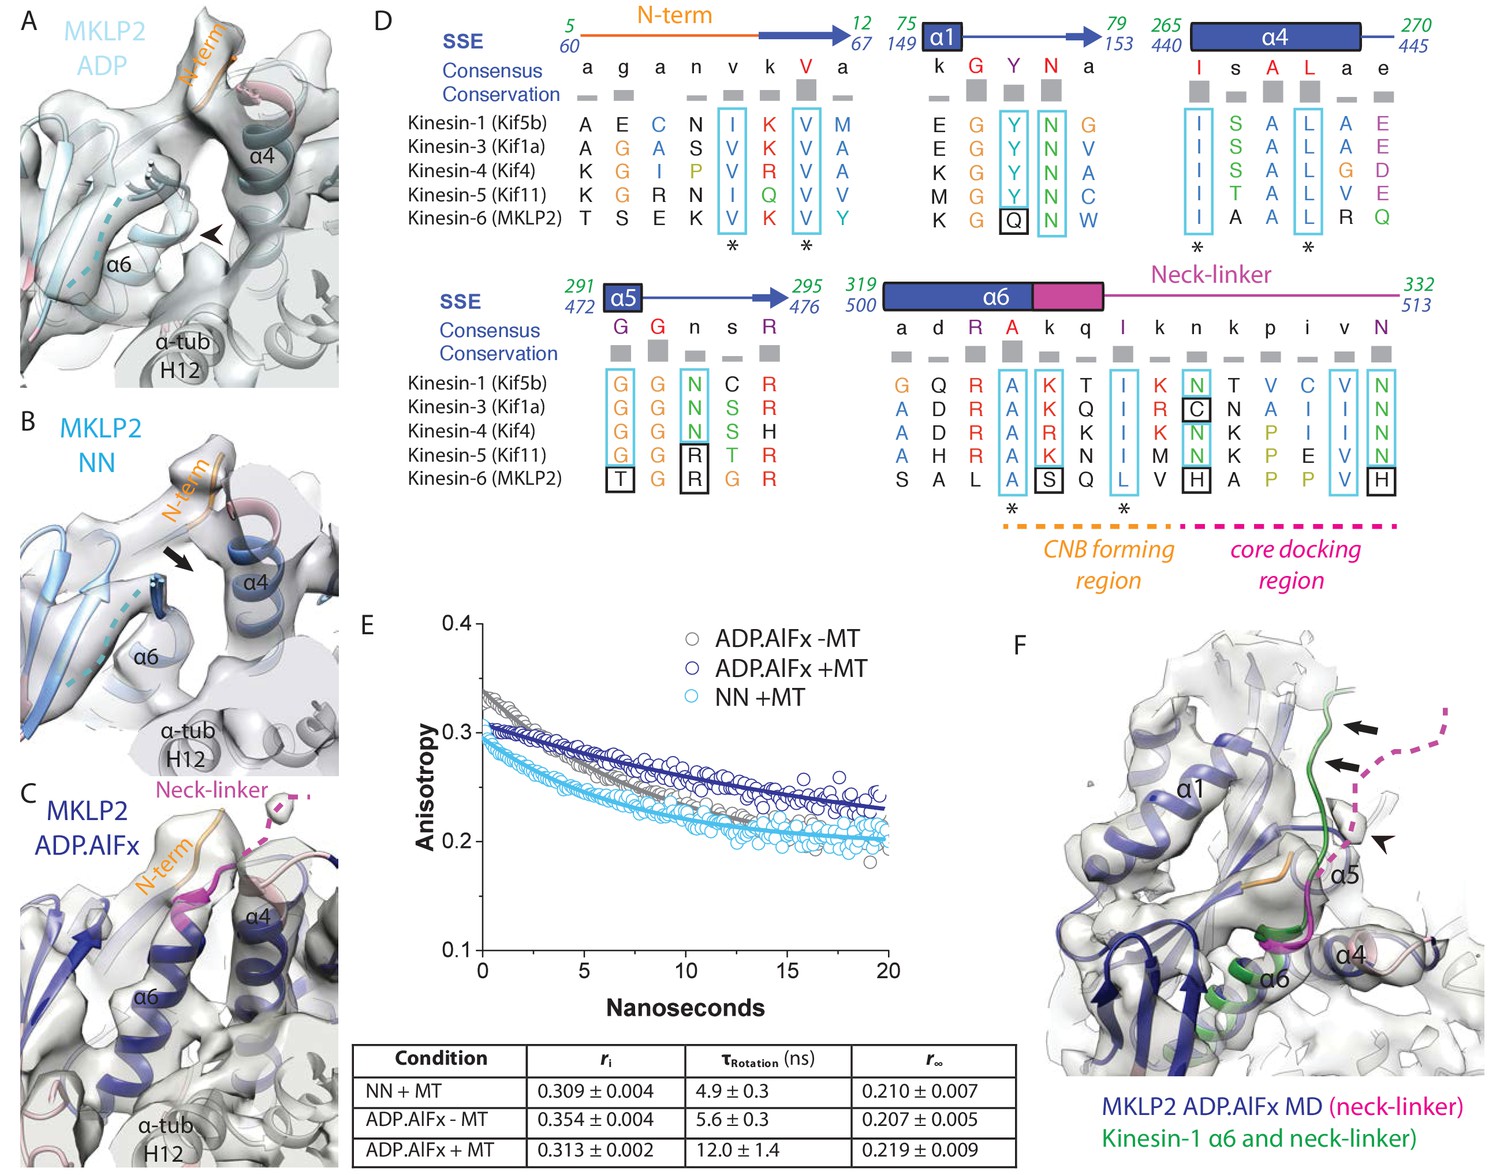
(A) MKLP2-MD-ADP has a short helix-α6 leaving a gap between its terminus and helix-α4 (arrow), showing the cleft for the neck linker is closed and the CNB is not formed. Helix-α6 has relatively poor density, suggesting it may be partially disordered at its C-terminus (arrowhead). Density that could flexibly accommodate part of the neck linker is present connected to β-sheet1 (blue dotted line). (B) MKLP2-MD-NN also has a short helix-α6 leaving a gap between its terminus and helix-α4 (arrow). (C) MKLP2-MD-ADP.AlFx has an extended helix-α6, the initial portion of the neck-linker (magenta) inserts between the N-terminus (orange) and helix-α4 forming the CNB (arrowhead). The remaining portion of the neck-linker is flexible. (D) Sequence alignments of representative members (in brackets) of the Kin1/3/4/5/6 families for the neck-linker and its contact regions. Residue colouring using the Clustal X scheme (Larkin et al., 2007). Sequence numberings for Kif5b (Kin1, green) and MKLP2 (kinesin-6, blue) are shown adjacent to the secondary structure schematics. Well conserved residues in MKLP2 are boxed in light blue, whereas otherwise well conserved residues which have diverged in MKLP2 are boxed in black (see also Figure 6—figure supplement 2). Asterisks indicate conserved hydrophobic residues participating in CNB formation. Regions of the neck-linker involved in CNB formation or core docking are indicated by dashed lines in orange and magenta, respectively. (E) Time-resolved fluorescence anisotropy of FlAsH labeled MKLP2-MD: (1) NN + MT, light blue; (2) ADP.AlFx –MT, grey and (3) ADP.AlFx +MT, dark blue. Data shown in the table below are representative of 5 replicate samples. (F) MKLP2-MD-ADP.AlFx neck-linker in magenta (disordered region, dashed line). Kin1 helix-α6 and neck-linker (dark green) has been superimposed on helix-α6 of MKLP2-MD, showing the expected position of the neck-linker. There is no density corresponding to a docked neck-linker (arrows) suggesting it is mainly disordered. A small amount of density close to helix-α5 (arrowhead) likely indicates that alternative conformations are flexibly explored.
Figure 6—figure supplement 1

The neck-linker in MT-bound MKLP2-MD-AMPPNP is not directed towards the MT plus end.
(A) View, similar to Figure 6A–C, of the N-terminus, helix-α6 and neck-linker of the MKLP2-MD-AMPPNP reconstruction. The arrow indicates a gap between helix-α6 and helix-α4, suggesting a shortened helix-α6, a closed docking cleft and therefore no CNB formation or neck-linker docking. The fitted MKLP2-MD-AMPPNP model is in blue and the α-tubulin model is in light grey.
Figure 6—figure supplement 2
MKLP2’s neck-linker has an atypical sequence across species that precludes core-docking.
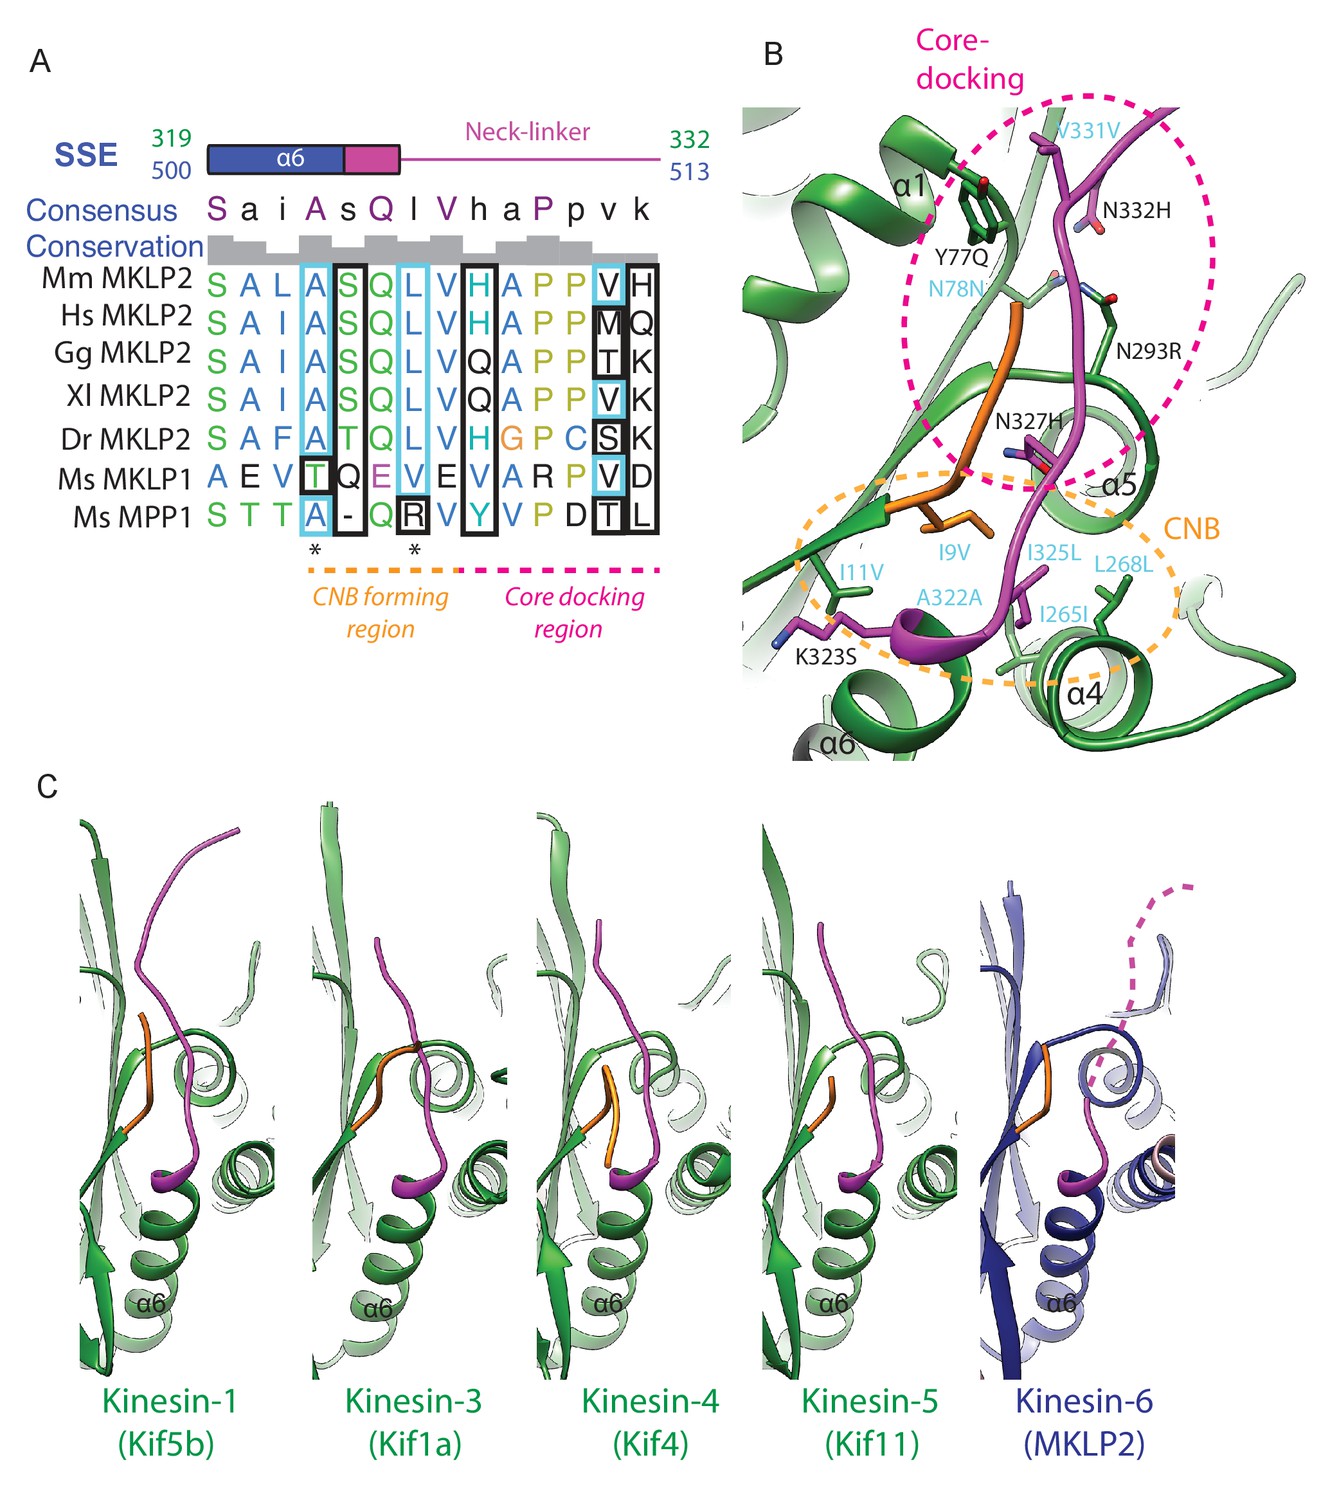
(A) Sequence alignment of the mouse MKLP2 neck-linker sequence with the two other mouse kinesin-6s MKLP1 and MPP1 and MKLP2 from selected animal species. Species abbreviations are; Mm, Mus musculus, Hs, Homo sapiens, Gg, Gallus gallus, Xl, Xenopus laevis, Dr, Danio rerio. Residue letters are coloured according to their properties according to the Clustal X scheme (Larkin et al., 2007). Information on consensus, conservation and secondary structure is shown above the alignments. Sequence numberings for Kif5B (Kin1, green) and mouse MKLP2 (kinesin-6, blue) are shown adjacent to the secondary structure schematics. Highly conserved residues in plus end kinesins which remain conserved or have similar properties in kinesin-6s are boxed in light blue, whereas highly conserved kinesin residues which have diverged are boxed in black (see also Figure 6D). Conserved hydrophobic residues participating in forming the CNB are marked by asterisks. Regions of the neck-linker involved in CNB formation or core-docking are indicated by dashed lines in orange and magenta, respectively. (B) The cover-neck bundle (CNB) and docked-neck linker in the x-ray structure of tubulin-bound Kin1 Kif5b (PDB: 4HNA). Side chains are shown for conserved kinesin residues involved in CNB formation (region within the orange-dashed circle) and neck-linker docking (region within the magenta-dashed circle). Highly conserved residues that remain conserved or highly similar are annotated in cyan, whilst those that have diverged are annotated in black, in format Kin1 amino-acid, Kin1 amino-acid number, mouse MKLP2 amino-acid. (C) Full neck-linker docking is observed in all structures with an ATP analogue and a ‘closed’ hydrolysis-competent nucleotide pocket apart from kinesin-6 MKLP2; Kin1 Kif5b (PDB: 4HNA, [Gigant et al., 2013]), Kin3 Kif1a (PDB: 4UXR, [Atherton et al., 2014]), Kin4 Kif4 (PDB: 3ZFD, [Chang et al., 2013]), Kin5 Kif11 (PDB: 3HQD, [Parke et al., 2010]). For MKLP2, a dashed magenta line is used to represent neck-linker flexibility.
Figure 7 with 1 supplement
Visualisation of MKLP2’s loop6 insertion.
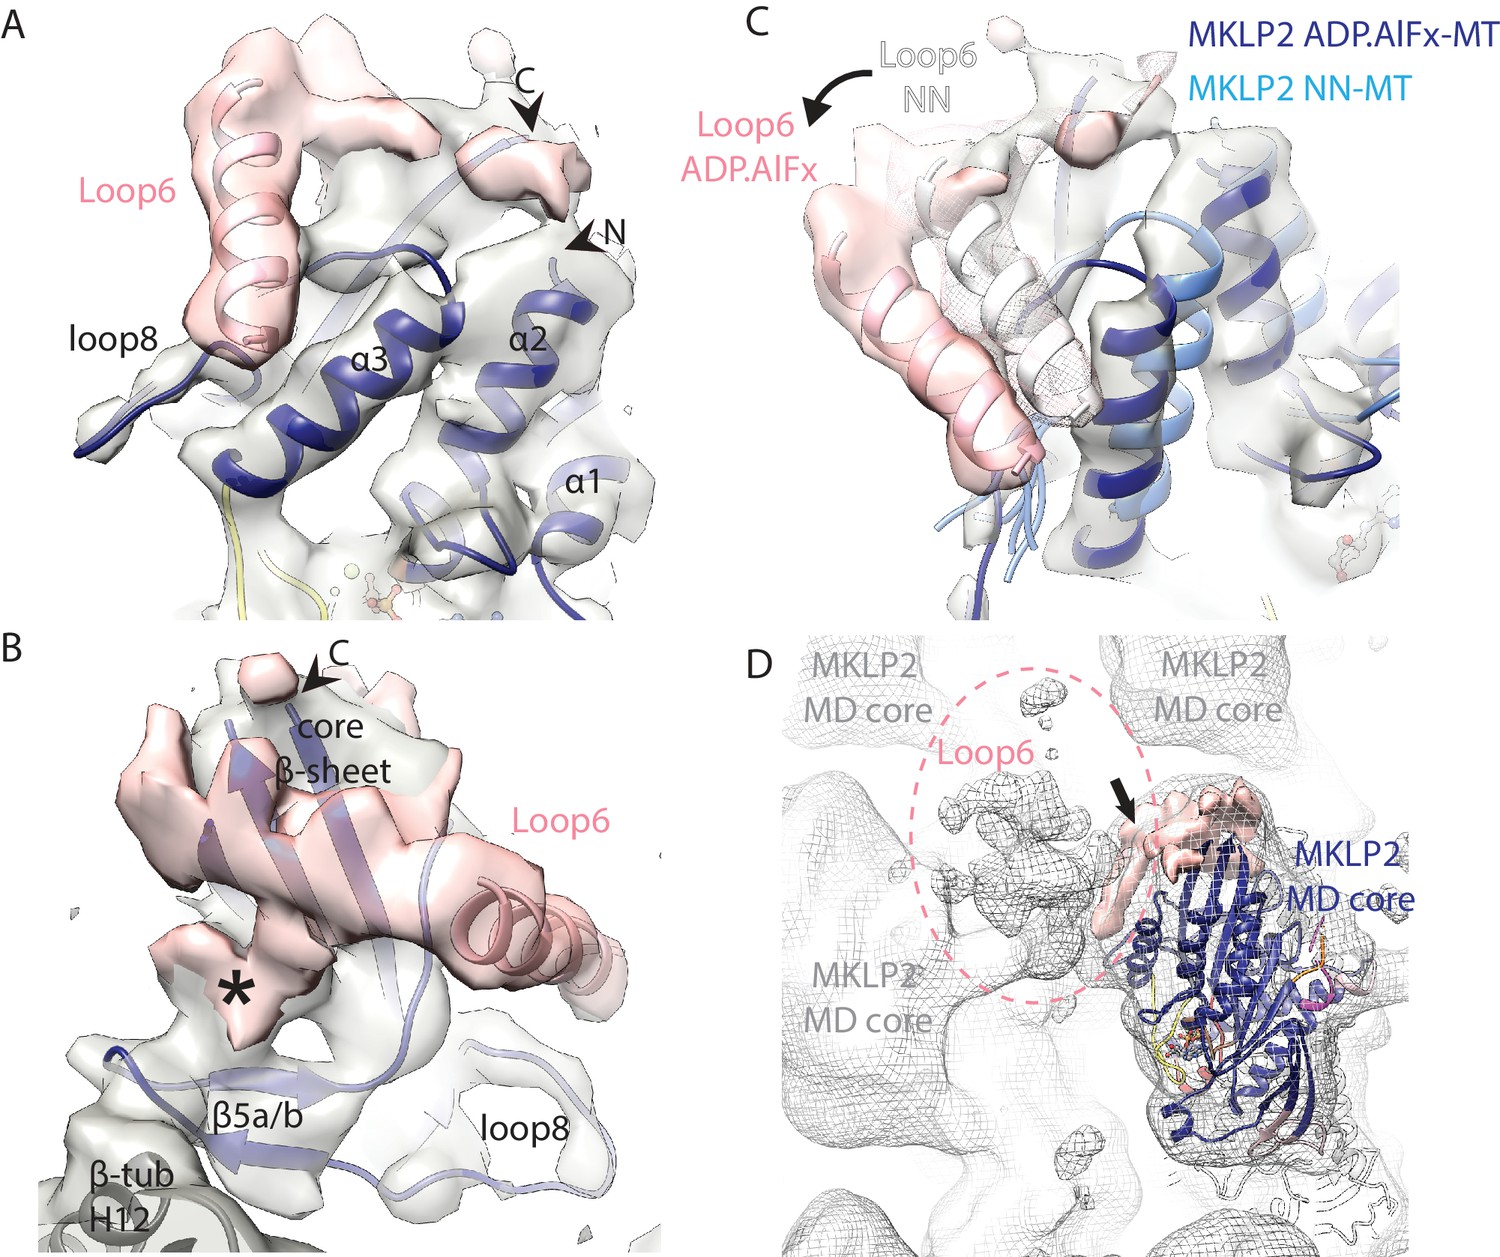
(A,B). MKLP2-MD-ADP.AlFx model (dark blue) within the cryo-EM density (grey) with ordered loop6 density (pink). A model of the predicted α-helix at the loop6 N-terminus fits well into a ‘sausage’ of loop6 density (pink helix). The termini of loop6 in the model are indicated (arrowheads). (B) View from the MT proximal side of the MKLP2-MD. Loop6 density (pink) connects the core β-sheet and β5a/b of the tubulin-binding subdomain (asterisk). (C) Movement of loop6 in NN (medium blue) to ADPAlFx (navy blue) transition, with the loop6 helices shown as white or pink ribbons respectively. The MKLP2-MD-ADP.AlFx motor core density is shown as transparent grey solid, MKLP2-MD-ADP.AlFx loop6 density is shown as pink transparent solid and MKLP2-MD-NN loop6 density is shown as pink mesh. (D) View of ~4 asymmetric units with the MT plus end towards the top of the panel. Mesh shows density for the MKLP2-MD-ADP.AlFx reconstruction when low pass filtered to ~15 Å. The MKLP2-MD-ADP.AlFx model is docked in one asymmetric unit. After low pass filtering, additional less ordered density attributable to loop6 was observed to the top left of the motor domain (indicated within pink dashed ring). Ordered loop6 density as in the previous panels is shown in pink (and arrowhead).
Figure 7—figure supplement 1
Density visualised for MKLP2’s loop6 is not dependent on nucleotide state.
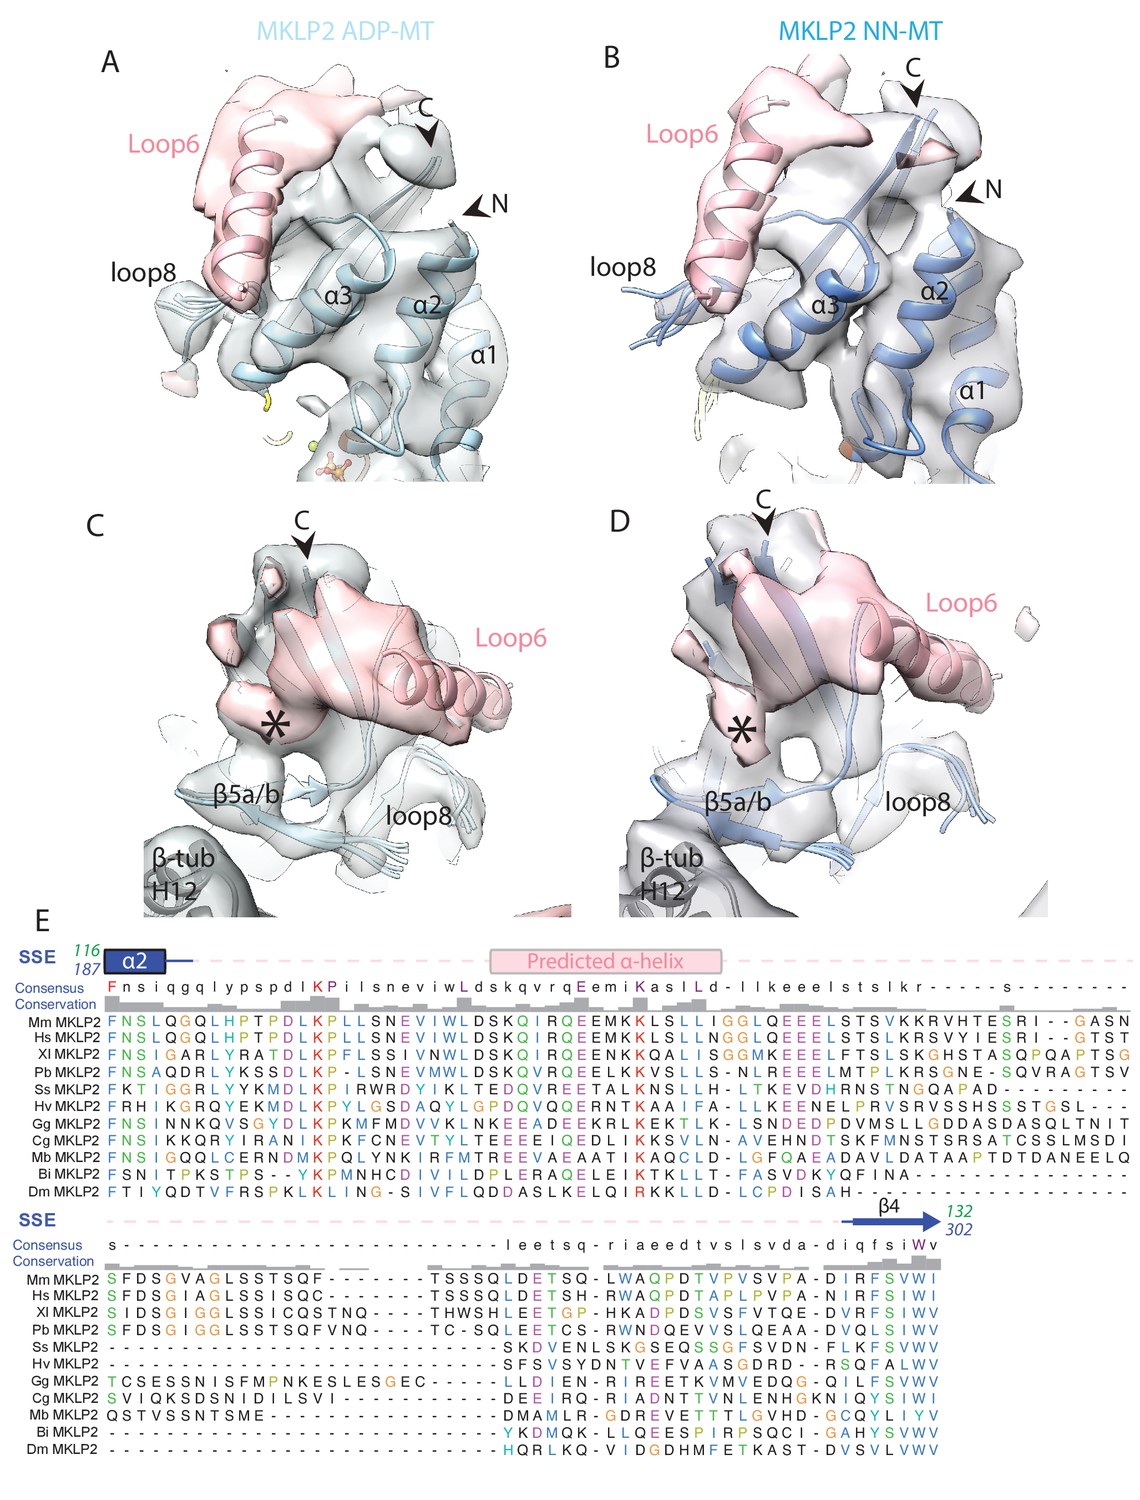
Views of loop6 density for the (A) MKLP2-MD-ADP or (B) MKLP2-MD-NN (as in Figure 7A), and (C) MKLP2-MD-ADP or the (D) MKLP2-MD-NN reconstructions (as in Figure 7B). The MKLP2-MD atomic models are shown within cryo-EM density (blue for NN or light blue for ADP). A model of the predicted α-helix at the loop6 N-terminus fits well into a ‘sausage’ of loop6 density (pink helix). The termini of loop6 in the model are indicated (arrowheads). Loop6 density (pink) connects the core β-sheet and β5a/b of the tubulin-binding subdomain (asterisk). (E) Sequence alignment of loop6 in MKLP2 from various animal species and the chanoflagellate Monosiga brevcollis. Species abbreviations are; Mm, Mus musculus, Hs, Homo sapiens, Xl, Xenopus laevis, Pb, Python bivittatus, Ss, Salmo Salar, Hv, Hydra Vulgaris, Gg, Gallus gallus, Cg, Crassostrea gigas, Mb, Monosiga brevcollis, Bi, Bombus impatiens, Dm, Drosophila melanogaster. Residue letters are coloured according to their properties as in Clustal X scheme (Larkin et al., 2007). Information on consensus, conservation and secondary structure, including prediction of SSEs in loop6 (see Materials and methods) is shown above the alignments. Sequence numberings for Kif5b (Kin1, green) and mouse MKLP2 (kinesin-6, blue) are shown adjacent to the secondary structure schematics.
Videos
Video 1
Subdomains within MKLP2-MD-ADP.AlFx cryo-EM reconstruction.
The organisation of kinesin subdomains is illustrated within the MKLP2-MD-ADP.AlFx model, with cryo-EM density shown as colored mesh and the model as colored ribbon (Switch I/II subdomain, blue, P-loop subdomain, orange, Tubulin-binding subdomain magenta, α-tubulin, light grey and β-tubulin, dark grey). ADP.AlFx nucleotide is shown as yellow ball-and-stick representation; nucleotides and paclitaxel have been removed from the tubulin model for clarity. Also for clarity, density mesh for loop6 is not colored. A clipping plane is moved though the MD to show the boundaries of the subdomains, the model is rotated, and the cryo-EM density and the tubulin model are removed for a clearer view of the tubulin-binding subdomain. Finally, the colour scheme is changed to that used in the majority of figures; the MKLP2-MD-ADP.AlFx model is in navy blue except for the colored key structural elements.
Video 2
Changes at the nucleotide-binding site during the MKLP2-MD ATPase cycle.
Nucleotide-state transitions are represented by morphing cryo-EM density between MKLP2-MD-ADP and MKLP2-MD-NN reconstructions then MKLP2-MD-NN and MKLP2-MD-ADP.AlFx reconstructions using Chimera’s (Goddard et al., 2007) ‘Morph Map’ tool (with the option of adjusting threshold for a constant volume). The MKLP2-MD-ADP fitted model is shown first and substituted for the MKLP2-MD-NN fitted model halfway through the ADP to NN density morph. The MKLP2-MD-NN fitted model is then substituted for the MKLP2-MD-ADP.AlFx fitted model halfway through the ADP to NN density morph.
Video 3
Loop6 density in the MKLP2-MD-ADP.AlFx cryo-EM reconstruction.
Cryo-EM density for the MD core and tubulin are shown in transparent grey solid, whilst additional density attributable to loop6 is shown as transparent pink solid. An α-helix at the N-terminus of loop6, suggested by secondary structure prediction (see Materials and methods and Figure 7—figure supplement 1E), which when modelled (pink helix) fits well into a ‘sausage’ of density attributable to a portion of loop6, is introduced. All density apart from loop6 density is then removed for clarity.
Tables
Table 1
Kinetic and affinity data of monomeric Kinesin-1,–3, and −5 compared to MKLP2-MD.
A summary of steady state ATPase activities and MT affinities of monomeric Kin1 (Atherton et al., 2014; Woehlke et al., 1997; Hackney, 1988; Gilbert et al., 1995; Ma and Taylor, 1995; Rosenfeld et al., 1996; Nitta et al., 2004; Gigant et al., 2013), whose structures were used to compared with MKLP2, as well as Kin3 (Nitta et al., 2004). Kin5’s MT-stimulated ATPase activity has similar values as MKLP2 (Cochran et al., 2004; Cochran et al., 2006).
| Monomeric motor | MT-stimulated ATPase | MT affinity; Kd (μM) | ||||
|---|---|---|---|---|---|---|
| K0.5, MT (μM) | kcat (S−1) | ADP | NN | ADP.AlFx | AMPPNP | |
| MKLP2-MD | 1.07 ± 0.18 | 4.38 ± 0.20 | 0.363 ± 0.057 | 0.043 ± 0.002 | 0.355 ± 0.073 | 0.043 ± 0.035 |
| Kin1 (Kif5a/b) | 12.7 ± 4.0 (Atherton et al., 2014) 26.0 ± 5.8 (Rosenfeld et al., 1996) | 34.2 ± 5.7 (Atherton et al., 2014) 43.6 ± 7.8 (Rosenfeld et al., 1996) 50.3 ± 1.6 (26) | 20.8 ± 2.4 (Rosenfeld et al., 1996) 2.0 ± 0.3 (Gigant et al., 2013) | n.a. | 1.4 ± 0.2 (Rosenfeld et al., 1996) 0.3 ± 0.006 (Gigant et al., 2013) | 1.1 ± 0.1 (Rosenfeld et al., 1996) 0.045 ± 0.012 (Gigant et al., 2013) |
| Kin3 (Kif1a) | 0.0537 ± 0.0057 (Atherton et al., 2014) | 43.4 ± 1.0 (Atherton et al., 2014) | 0.0068 ± 0.0025 (Nitta et al., 2004) | n.a. | 0.0059 ± 0.0015 (Nitta et al., 2004) | 0.0042 ± 0.0013 (Nitta et al., 2004) |
| Kin5 (Eg5) | 4.5 (Cochran et al., 2004) 0.29 ± 0.02 (Cochran et al., 2006) | 2.9 (Cochran et al., 2004) 5.5 ± 0.1 (Cochran et al., 2006) | n.a. | n.a. | n.a. | n.a. |
-
n.a.: not available.
Table 2
MKLP2 Homology modelling and validation.
Columns 2–3 show the list of PDB IDs that were used as templates for specific structural regions of each MKLP2 nucleotide state (4LNU (Cao et al., 2014), 4HNA (Gigant et al., 2013), 4OZQ (Arora et al., 2014), 1VFV (Nitta et al., 2004), 3GBJ and 4Y05 are structures from the Structural Genomics Consortium). Columns 4–5 show the overall QMEAN scores calculated before, and after refinement and show that model quality is maintained following refinement. Columns 6–7 show the global cross-correlation scores before and after refinement.
| Nucleotide state | Templates used for homology modelling | QMEAN scores | Global Cross-correlation scores | |||
|---|---|---|---|---|---|---|
| MKLP2 Structure | Template | Homology Model | Refined Model | Homology Model | Refined Model | |
| ADP | Main template | 3GBJ | 0.636 | 0.623 | 0.908 | 0.931 |
| Helix α4, helix α5, loop 8 | 4LNU | |||||
| Helix α4/loop 12 | 4OZQ | |||||
| Loop 2 | 4Y05 | |||||
| NN | Main template | 4LNU | 0.669 | 0.663 | 0.913 | 0.930 |
| Helix α4/loop 12 | 4OZQ | |||||
| Loop 2 | 4Y05 | |||||
| Loop 5 | 3GBJ | |||||
| ADP.AlFx | Main template | 4HNA | 0.671 | 0.689 | 0.860 | 0.890 |
| Helix α4/loop 12 | 4OZQ | |||||
| Loop 2 | 4Y05 | |||||
| Loop 5 | 3GBJ | |||||
| AMPPNP | Main template | 1VFV | 0.658 | 0.679 | 0.925 | 0.943 |
| Helix α4, helix α5, loop 8 | 4LNU | |||||
| Helix α4/loop 12 | 4OZQ | |||||
| Loop 2 | 4Y05 | |||||
Additional files
-
Transparent reporting form
- https://doi.org/10.7554/eLife.27793.029
Download links
A two-part list of links to download the article, or parts of the article, in various formats.
Downloads (link to download the article as PDF)
Open citations (links to open the citations from this article in various online reference manager services)
Cite this article (links to download the citations from this article in formats compatible with various reference manager tools)
The divergent mitotic kinesin MKLP2 exhibits atypical structure and mechanochemistry
eLife 6:e27793.
https://doi.org/10.7554/eLife.27793


