Rapid re-identification of human samples using portable DNA sequencing
- New York Genome Center, United States
- Columbia University, United States
- New York University, United States
Figures
Figure 1
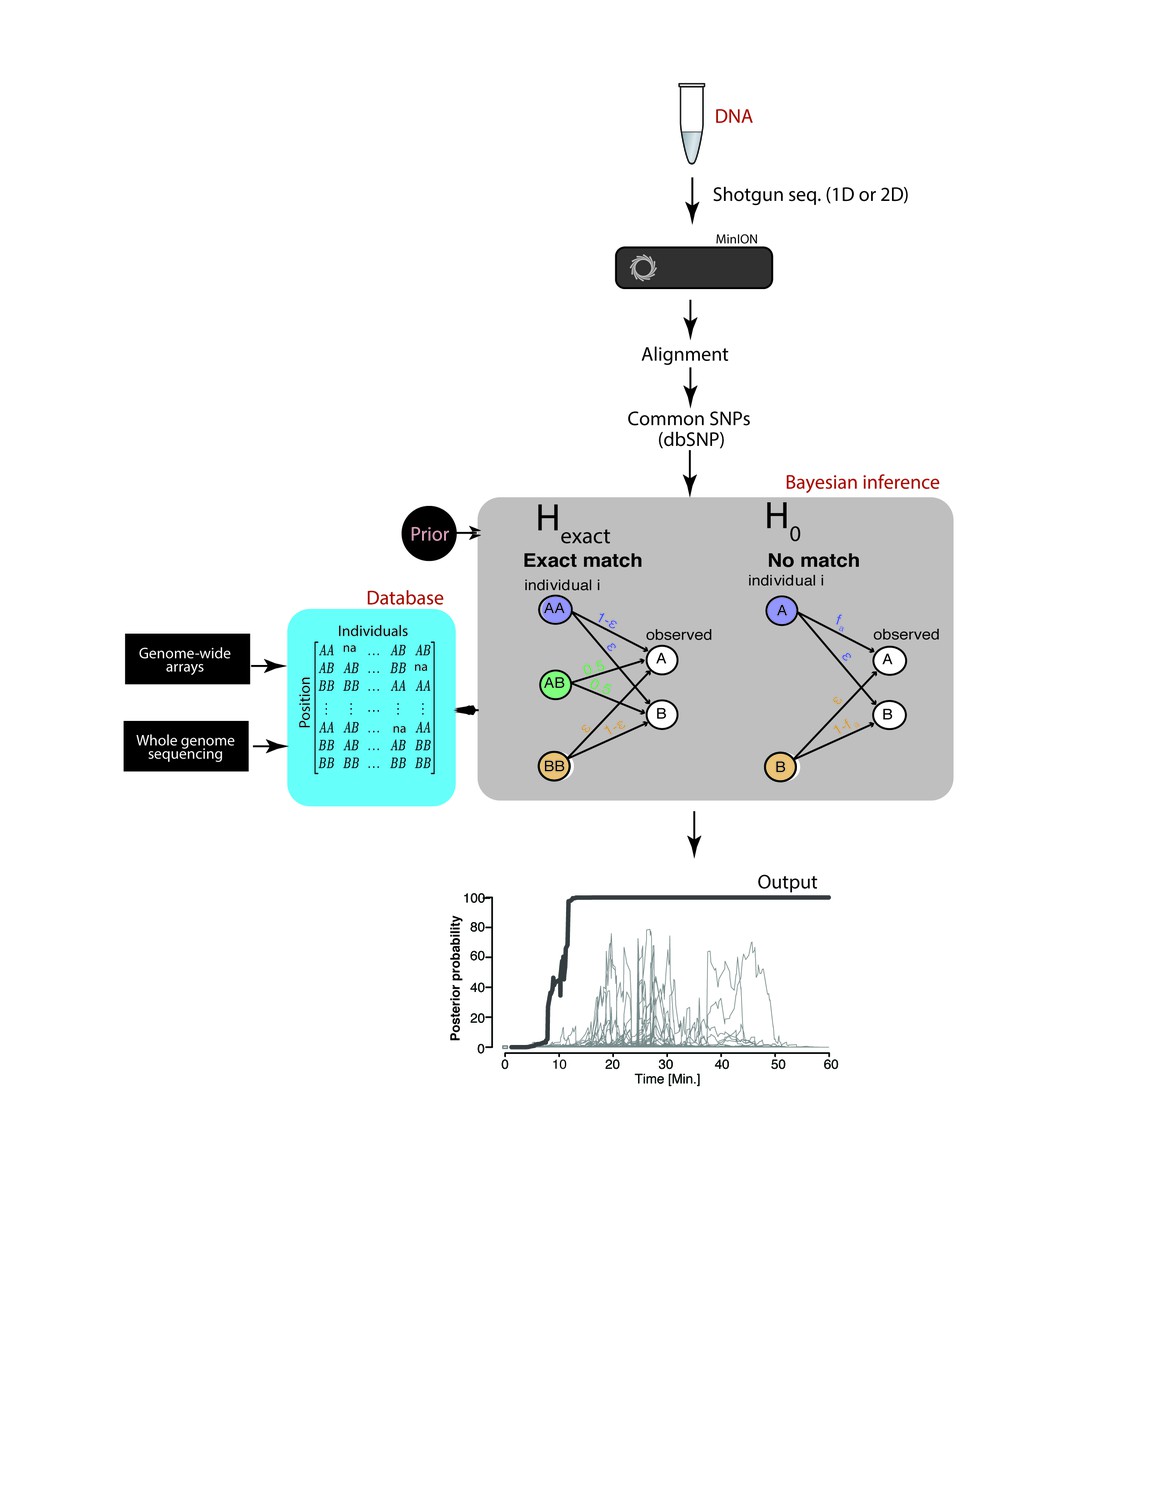
Schematic overview of MinION sketching.
A DNA sample is prepared for shotgun sequencing. Libraries are prepared either for 1D or 2D MinION sequencing (without and with hairpin, respectively). Variants observed in aligned MinION reads are only selected if they coincide with known polymorphic loci while others are treated as errors. These SNPs are compared to a candidate reference database comprised of samples genotyped with whole genome sequencing or sparse genome-wide arrays (~600K-900K SNPs per candidate file). A Bayesian framework computes the posterior probability that the sample matches an individual in the database by accounting for the sequencing error rate (ε). This results in an output plot where the posterior probability is visualized as a function of time and the number of SNPs used in the computation.
Figure 2 with 1 supplement
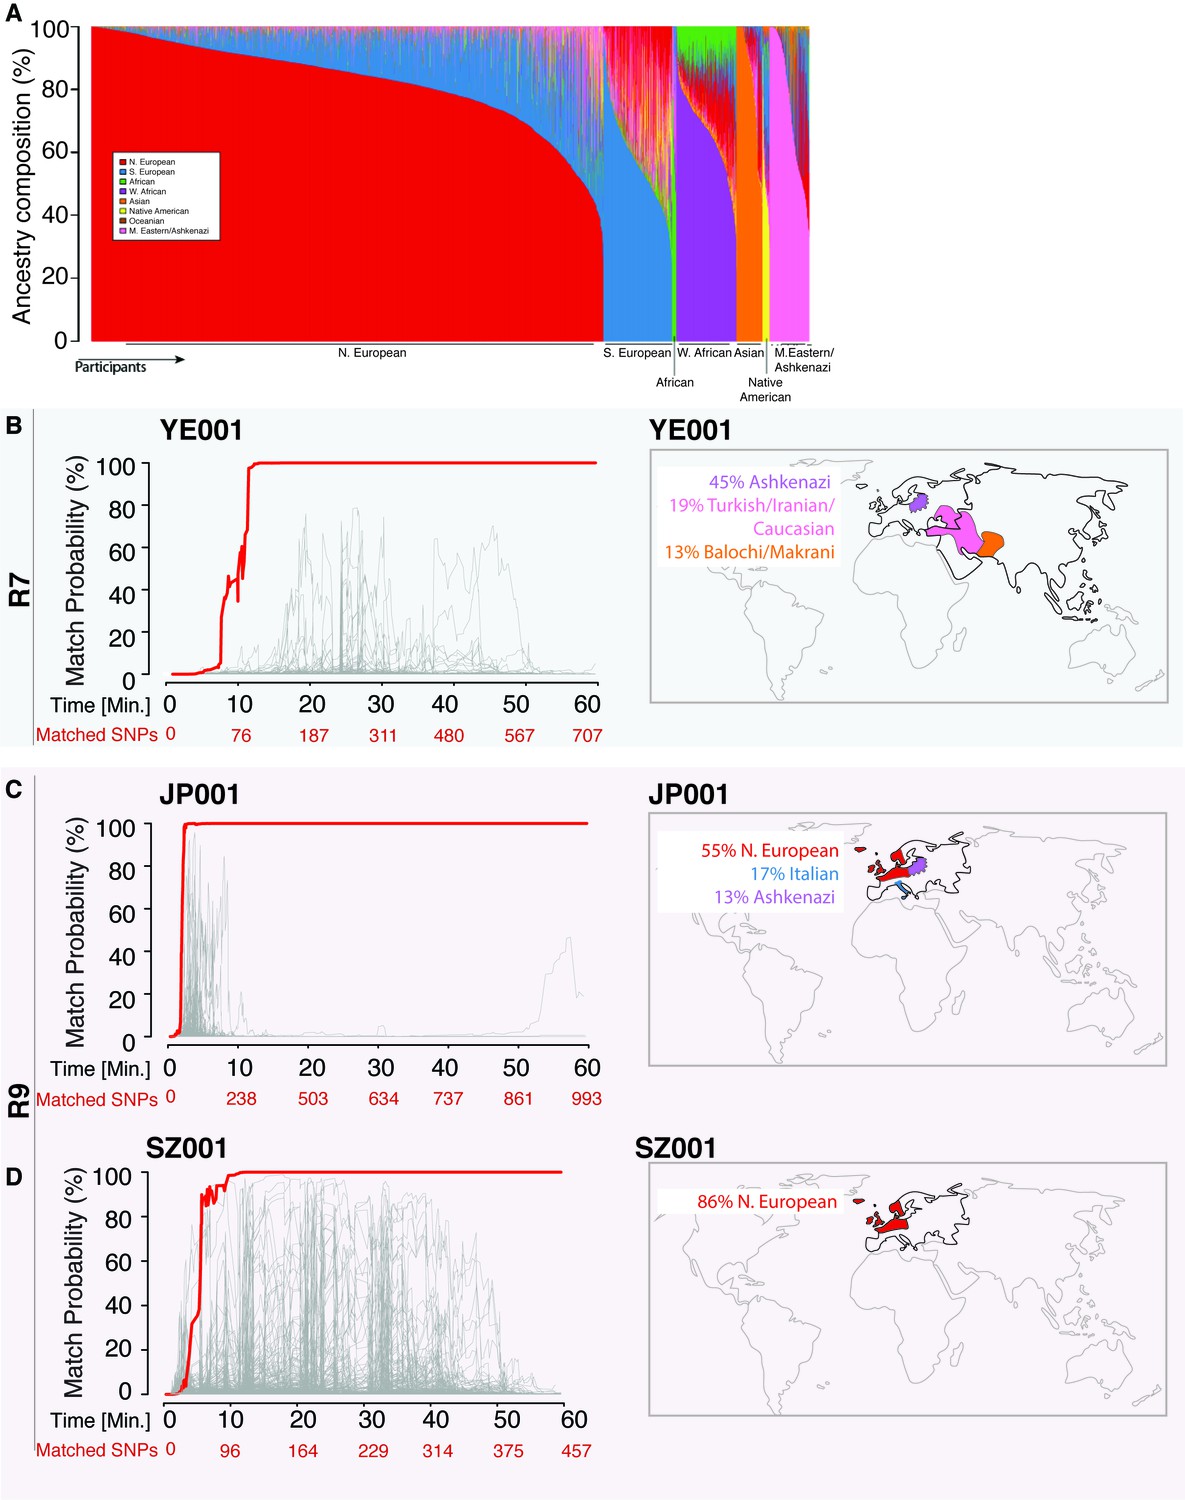
Re-identification of three DNA samples against a database with 31,000 individuals.
(A) A Frappe plot showing the population structure of the database with a collection of 31,000 genome-wide SNP arrays. (B–D) The match probability is inferred by comparing a MinION sketch to its reference file as a function of the MinION sketching time (red line) and the number of SNPs analyzed. The prior probability for a match was set to 10−5. The match probabilities are inferred by comparing the MinION sketches to a database with 31,000 genome-wide SNP arrays (including the matched individuals). Right: Ancestral background of the corresponding individuals; only ancestry predictions of >10% are indicated. (B) The DNA sample was collected from an Ashkenazi-Uzbeki male (YE001) and sequenced using R7 chemistry. (C) The sample was collected from a Northern European female (SZ001) and sequenced using R9 chemistry. (D) The sample was collected from a Northern European-Italian-Ashkenazi male (JP001) and sequenced using R9 chemistry.
Figure 2—figure supplement 1
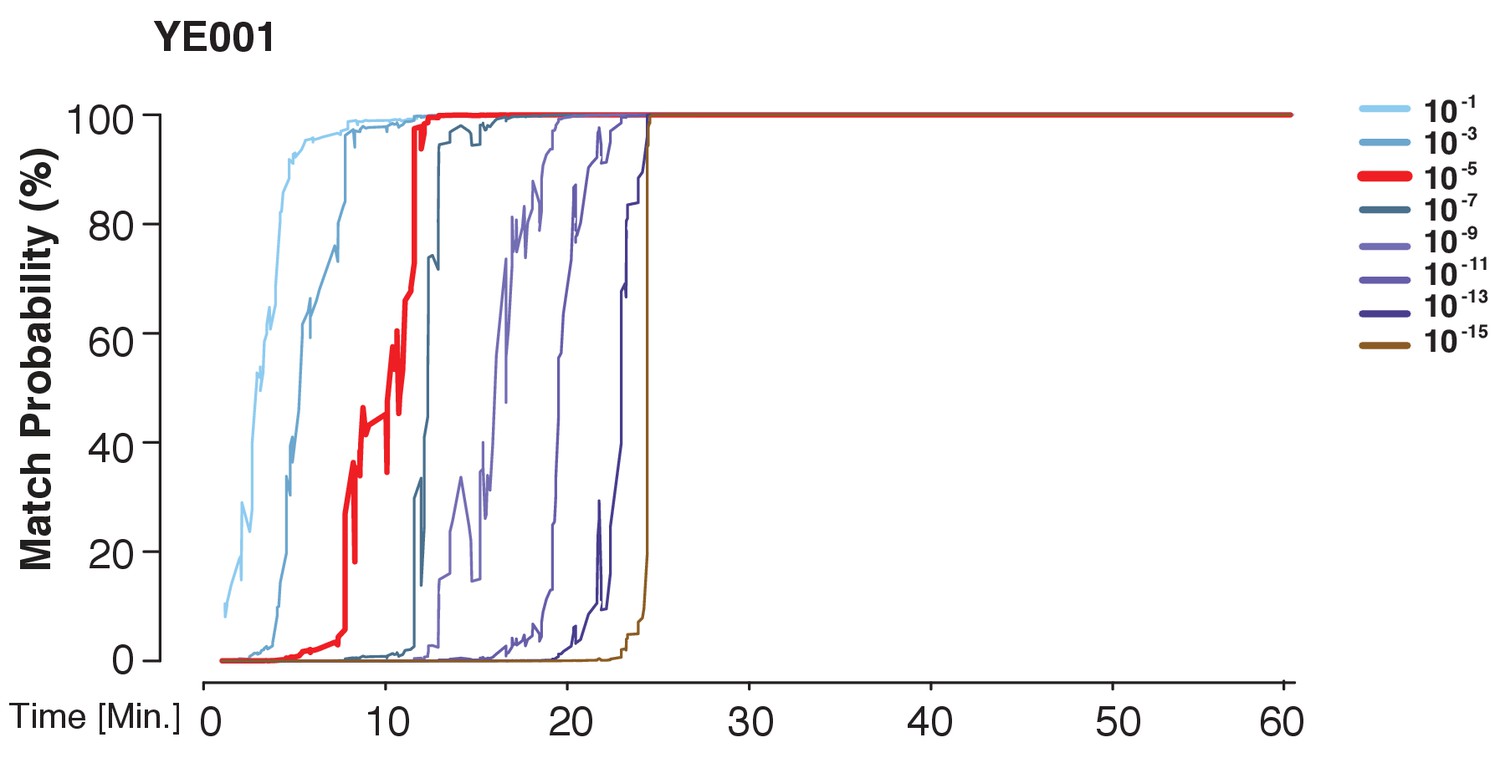
A prior representing a database larger than the world population still allows for identification power.
The match probability is inferred by comparing a MinION sketch of YE001 to its reference file as a function of the MinION sketching time. The prior probability for a match was modified as indicated.
Figure 3
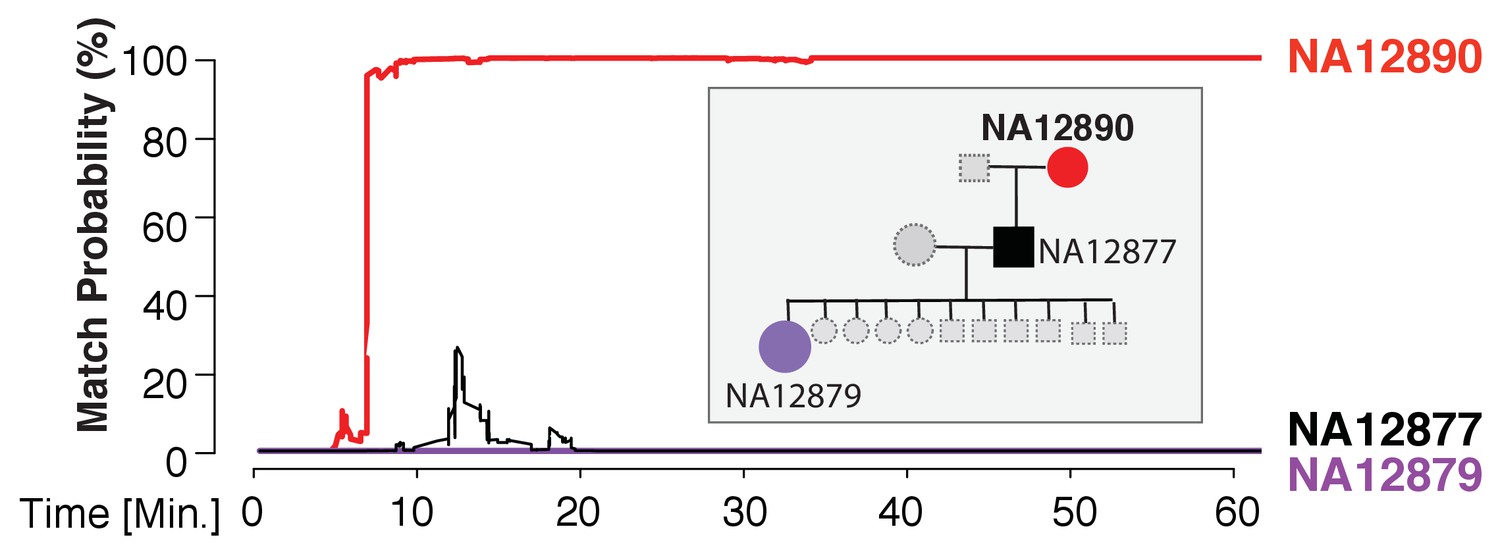
Re-identification of HapMap sample NA12890.
The match probability is inferred by comparing a MinION sketch of NA12890 to the reference files of her own genome (red), her son’s genome (black), and her granddaughter’s genome (purple), as a function of the MinION sketching time (red line). The prior probability for a match was set to 10−5. Inset: the pedigree of 1000Genomes sample NA12890
Figure 4 with 1 supplement

Cell line authentication.
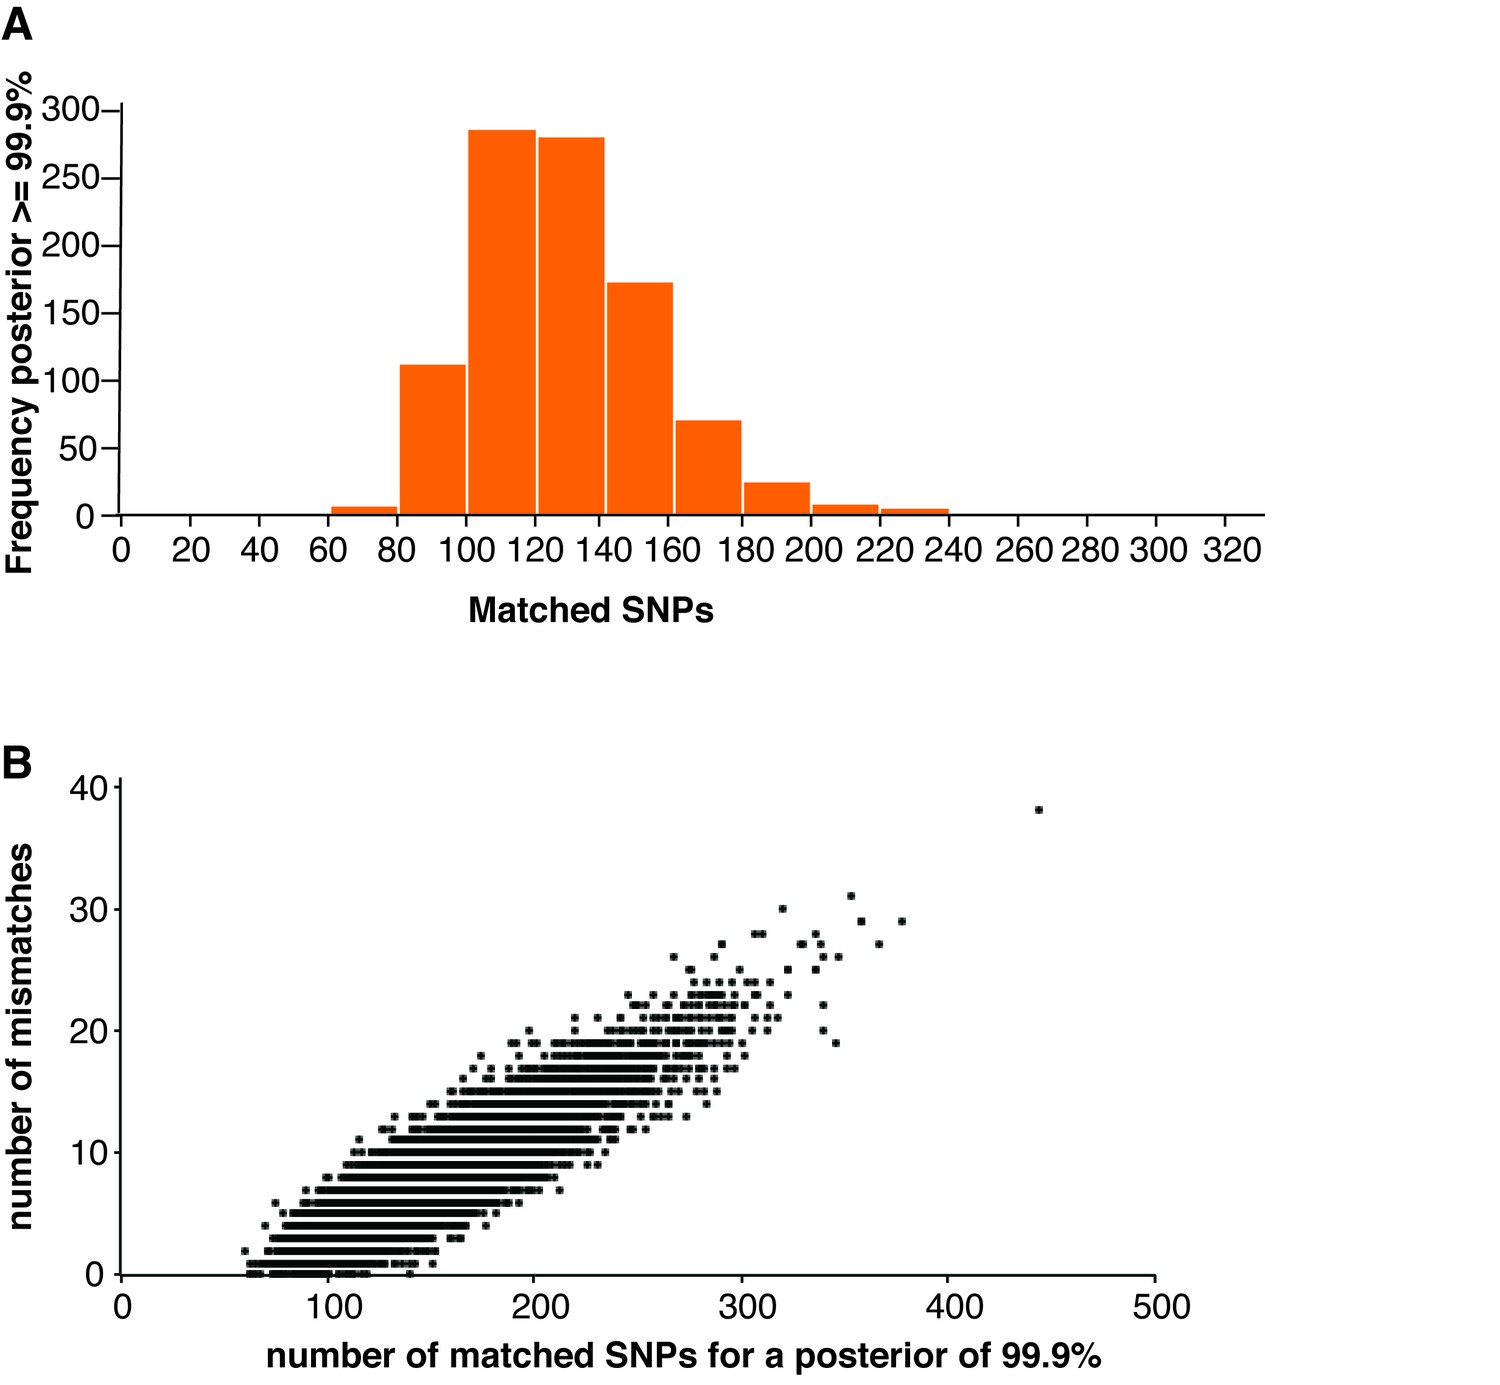
Barcoded DNA from the THP1 cell line is mixed 1:1 with a random, barcoded sample. Analysis of only the THP1 reads was used to infer ‘pure’ matches, while analyses of the mixture were used to characterize the efficiency of matching using contaminated samples. The match probability is inferred by comparing a MinION sketch to 1,099 reference files that are part of the cancer cell line encyclopedia (CCLE) generated by the Broad Institute (grey). (A) The posterior probability for an exact match between the MinION sketch of the ‘pure’ cell line THP1 (considering a single barcode) and the reference file generated by the CCLE (the red line indicates the THP1 reference file, other strains are depicted in grey). The posterior probability is plotted as a function of the sketching time and number of SNPs analyzed. (B) 10,000 simulated runs of sketching the THP1 cell line were matched against its reference file. The number of SNPs used to reach a 99.9% match (x-axis), is plotted against the number of times it is observed (y-axis). (C) The posterior probability that the contaminated (50% mixed) sample matched THP1 is plotted as a function of the sketching time and number of SNPs analyzed.
Figure 4—figure supplement 1
Cell line authentication.
(A) 10,000 simulated runs of sketching SZ001 were matched against its reference file. The number of SNPs used to reach a 99.9% match is depicted in a histogram. (B) The number of mismatches encountered between the MinION sketch and the reference file to reach a match probability of 99.9% for the 10,000 simulated runs of the THP1 cell line against its reference file. The x-axis shows the number of SNPs needed to infer a 99.9% match. The y-axis shows the number of (homozygous) mismatches.
Figure 5 with 1 supplement
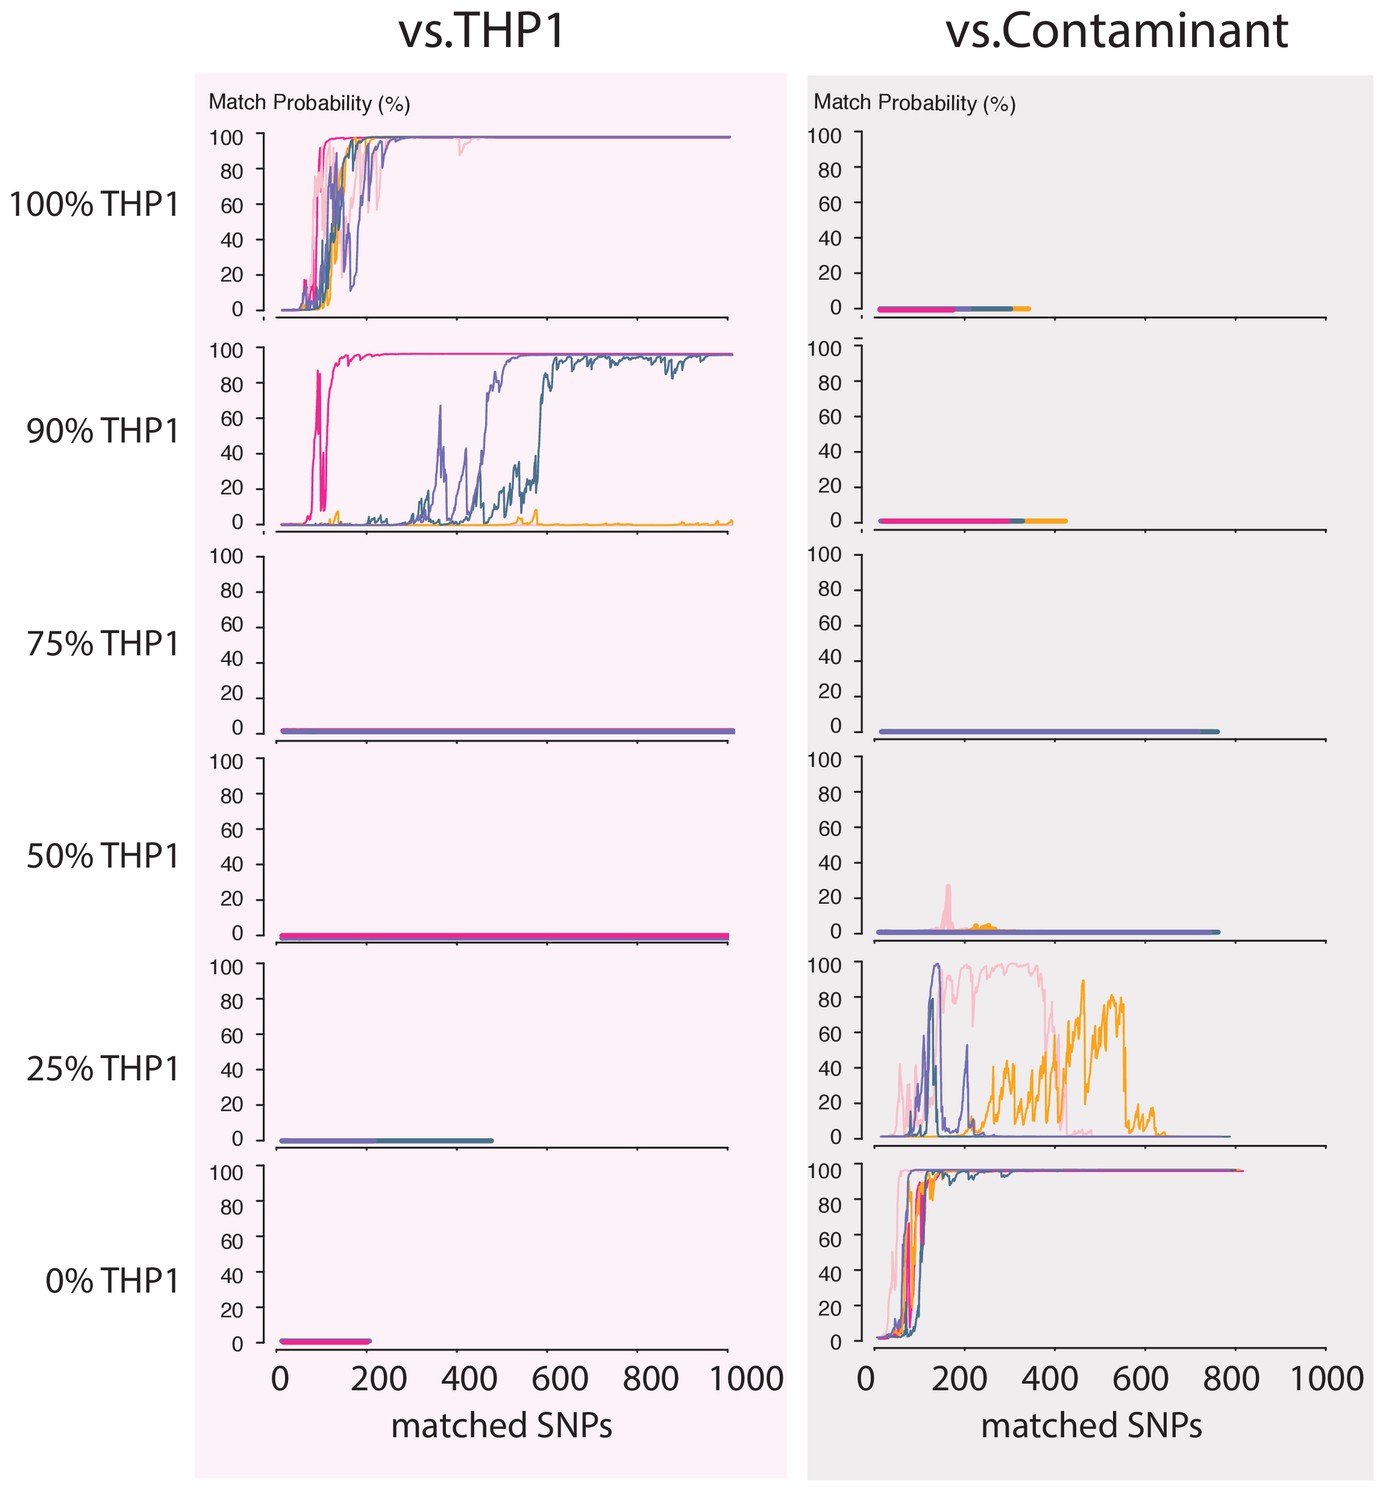
Contamination simulations.
Random reads from a run with DNA from THP1 cells and a random, barcoded sample (the contaminant) are mixed in the indicated proportions and shuffled. This simulated MinION sketch is matched against the THP1 reference file, and the contaminant reference file. This process is repeated five times for each simulated contamination (pink, light-pink, purple, green and yellow lines). The match probability here is a function of the number of SNPs analyzed.
Figure 5—figure supplement 1
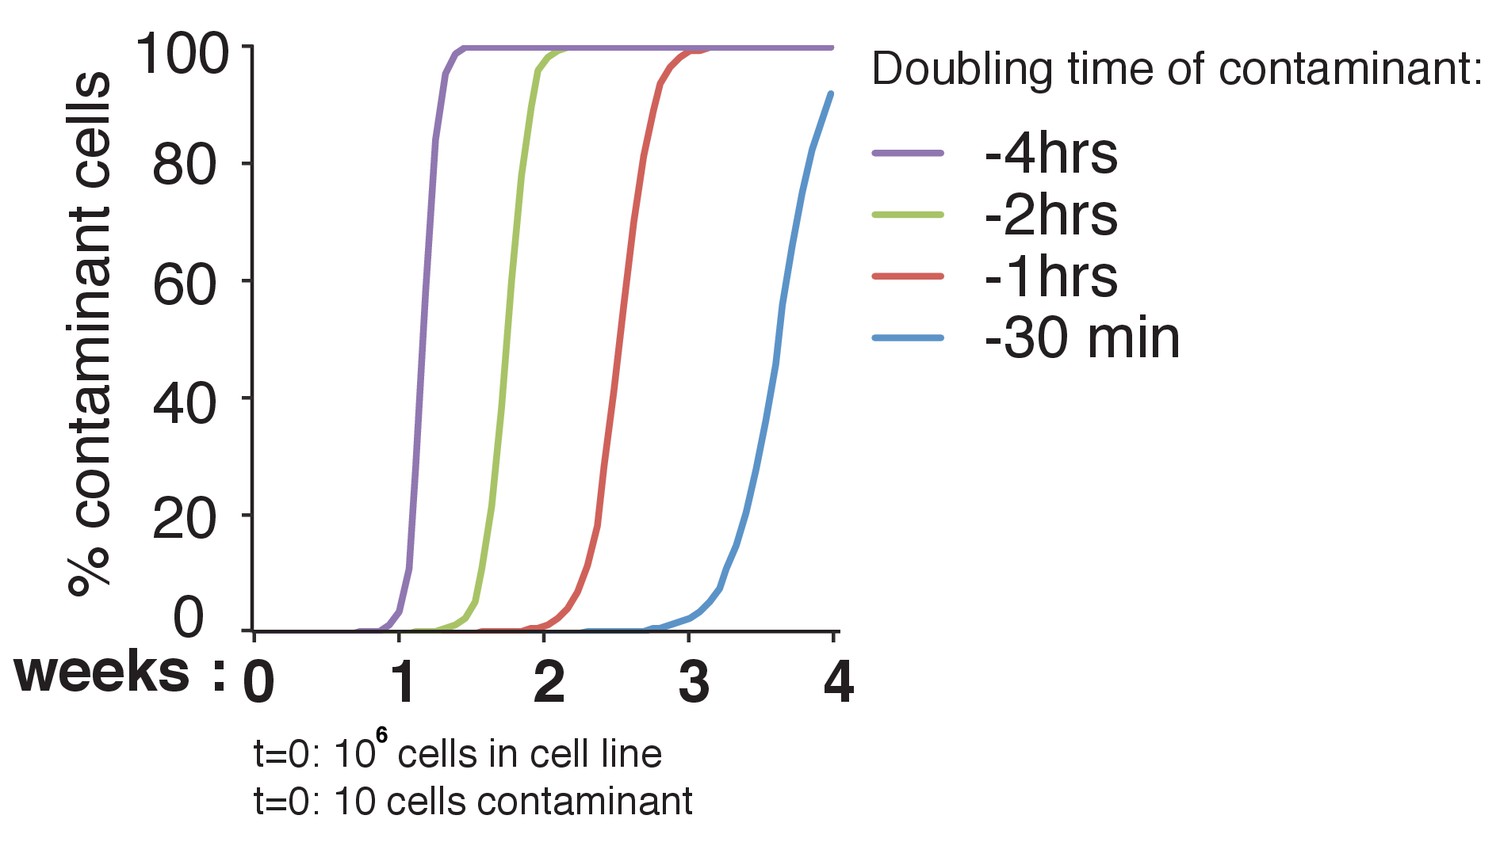
Theoretical effect of differences in doubling time of contaminants in a cell culture.
We set the doubling time of our cell line of interest to 24 hr. We hypothesized that our culture (with a starting number of 106 cells) would be contaminated with 10 foreign cells. We considered a doubling time of the contaminant cell line that is 4 hr, 2 hr, 1 hr and 30 min shorter than that of the original cell line. Taking various differences in doubling time shows the change in cell population over a 4-week period; this is assuming the cells are in log phase. The x-axis shows the time in weeks, the y-axis the percentage of contaminant cells in the population (number of contaminant cells/total number of cells).
Figure 6 with 1 supplement
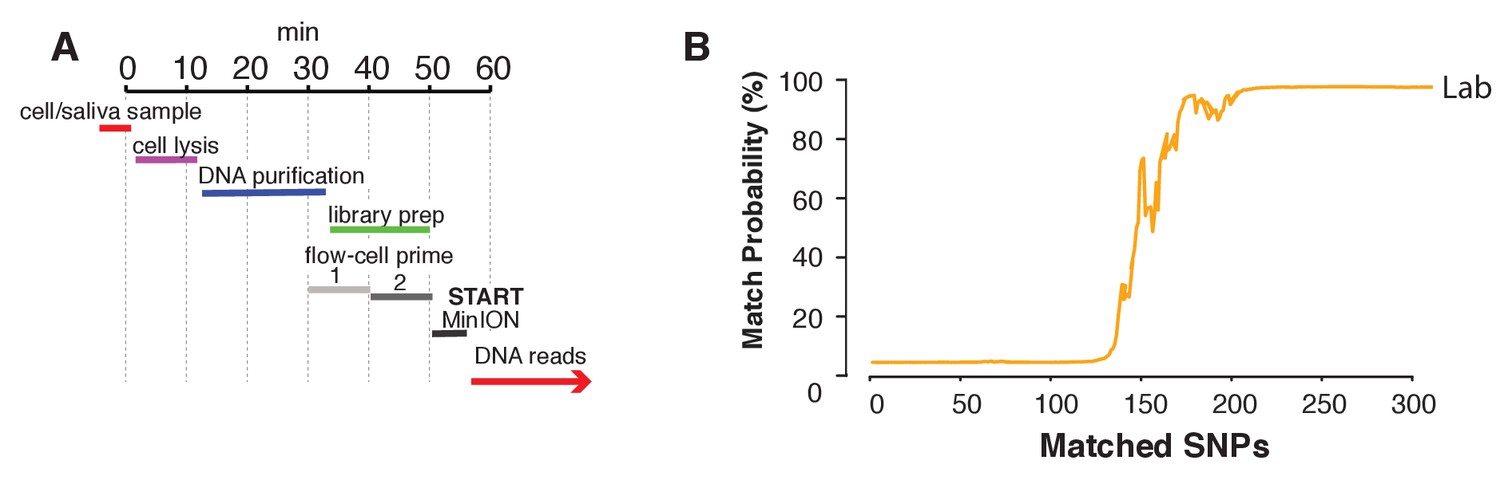
Rapid library preparation.
(A) Schematic of the steps from sample to MinION sketch. The current method requires ~55 min until the MinION starts to generate reads. (B) The match probability is inferred by comparing a MinION sketch generated by transposase-mediated adaptor ligation (the rapid kit) to its reference file as a function of the number of SNPs analyzed. The prior probability for a match was set to 10−5. The rapid library protocol was tested in the lab. The MinION sketch was generated from sample SZ001. The library was prepared in 55 min in the laboratory. After analyzing 239 informative SNPs the posterior match probability exceeded 99.9%.
Figure 6—video 1
The movie depicts the rapid, on-site library preparation protocol using the Bento Lab (www.bento.bio) for DNA extraction and library preparation, prior to starting DNA sequencing as described in Figure 6.
https://doi.org/10.7554/eLife.27798.013Tables
Table 1
List of databases consulted and restrictions to access.
https://doi.org/10.7554/eLife.27798.006| Databases: | Restrictions to access | Dataset URL: |
|---|---|---|
| Opensnp.org | No | https://opensnp.org/ |
| HapMap* | No. The HapMap dataset has been discontinued (https://www.ncbi.nlm.nih.gov/variation/news/NCBI_retiring_HapMap/) and the archived HapMap data is available via FTP from ftp://ftp.ncbi.nlm.nih.gov/hapmap/. The relevant files used for this study have been downloaded from the latter in 2015. | http://www.completegenomics.com/documents/PublicGenomes.pdf and ftp://ftp.ncbi.nlm.nih.gov/hapmap/ |
| DNA.land | Yes. The 29,554 genomes provided by DNA.land are not available for distribution to ensure genomic privacy of the individuals who donated their genomes to DNA.land | https://dna.land/ |
| CCLE† | Yes. Public access is available by registration. The data made available on the Encyclopedia is for internal research purposes, as specified in CCLE Terms of Access (https://portals.broadinstitute.org/ccle/about). The SNP and Expression data from the Cancer Cell Line Encyclopedia (CCLE) is available on GEO under accession number GSE36139. | https://portals.broadinstitute.org/ccle/ and https://www.ncbi.nlm.nih.gov/geo/query/acc.cgi?acc=GSE36139 |
Additional files
-
Supplementary file 1
Supplementary Tables.
Run statistics for the MinION sketch experiments.
- https://doi.org/10.7554/eLife.27798.014
-
Transparent reporting form
- https://doi.org/10.7554/eLife.27798.015
Download links
A two-part list of links to download the article, or parts of the article, in various formats.
Downloads (link to download the article as PDF)
Open citations (links to open the citations from this article in various online reference manager services)
Cite this article (links to download the citations from this article in formats compatible with various reference manager tools)
Rapid re-identification of human samples using portable DNA sequencing
eLife 6:e27798.
https://doi.org/10.7554/eLife.27798


