Identification and dynamics of the human ZDHHC16-ZDHHC6 palmitoylation cascade
- Ecole Polytechnique Fédérale de Lausanne, Switzerland
Figures
Figure 1 with 1 supplement
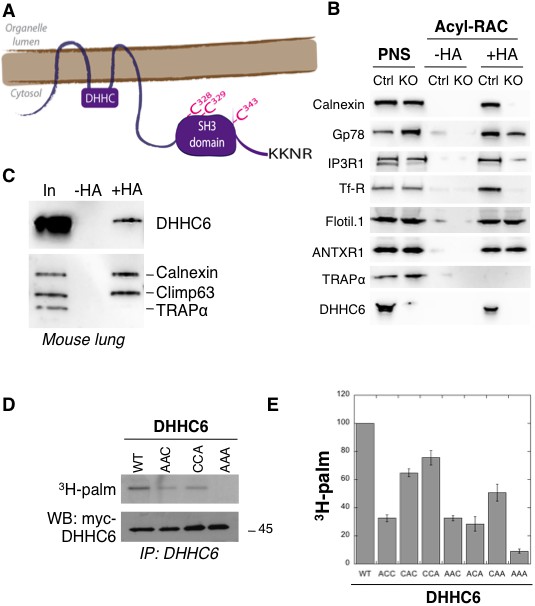
ZDHHC6 can undergo palmitoylation on three cysteines of its SH3 domain.
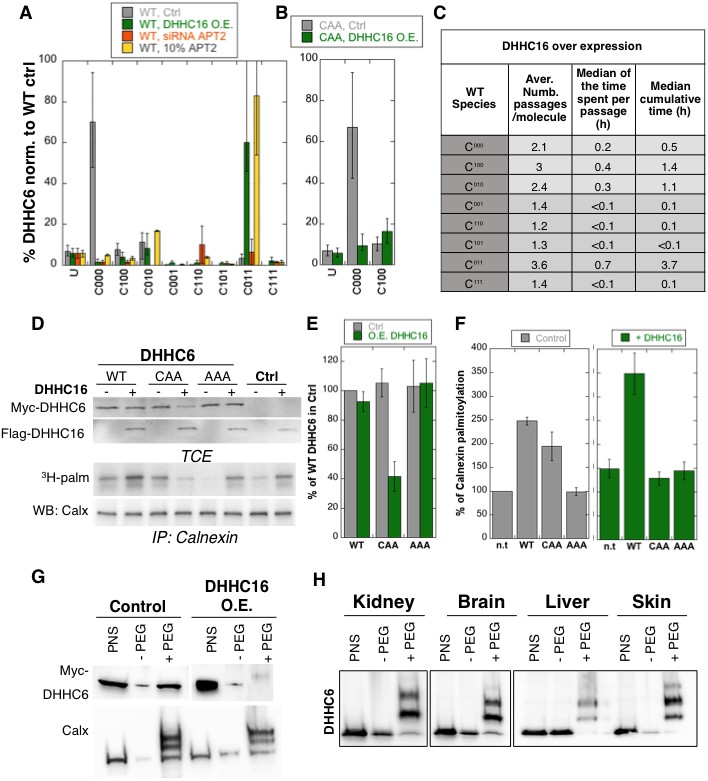
(A) Schematic representation of ZDHHC6 enzyme. The potential ER retention motif is KKNR. (B) Analysis of protein acylation in control HAP cells (Ctrl) versus ZDHHC6 KO HAP (KO). HAP cell membranes were recovered by centrifugation and incubated with MMTS and then with hydroxylamine (+HA) or with Tris (-HA) together with free thiol group binding beads. Eluted fractions were analysed by immunoblotting with the indicated antibodies. PNS represents 1/10 of the input fraction. (C) ZDHHC6 acylation in mouse tissues. 400 µg total proteins extracted from mouse lung were incubated with MMTS and then with hydroxylamine (+HA) or with Tris (-HA) together with free thiol group binding beads. Eluted fractions were analysed by immunoblotting with the indicated antibodies. ‘In’ represents 1/10 of the input fraction. Calnexin and the ER shaping protein CLIMP-63 (Lakkaraju et al., 2012; Schweizer et al., 1993) were used as positive controls and the cysteine-less protein Trapα as negative control. (D) Palmitoylation of ZDHHC6 cysteine mutants. HeLa cells were transfected with plasmids encoding WT or the indicated Myc-tagged ZDHHC6 mutant constructs for 24 hr. Cells were then metabolically labelled for 2 hr at 37°C with 3H-palmitic acid. Proteins were extracted, immunoprecipitated with Myc antibodies, subjected to SDS-PAGE and analysed by autoradiography (3H-palm), quantified using the Typhoon Imager or by immunoblotting with the indicated antibodies. (E) Quantification of 3H-palmitic acid incorporation into ZDHHC6. Quantified values were normalized to protein expression level. The calculated value of 3H-palmitic acid incorporation into WT ZDHHC6 was set to 100% and all mutants were expressed relative to this (n = 4, error bars represent standard deviation).
Figure 1—figure supplement 1

Alignment of DHHC6 sequences from different species.
Identical amino acids are highlighted by dark blue. Palmitoylated cysteines are highlighted in red boxes. SH3-2 like domain and DHHC domains are underlined in red.
Figure 2 with 3 supplements
ZDHHC6 is palmitoylated by ZDHHC16 and depalmitoylated by APT2.
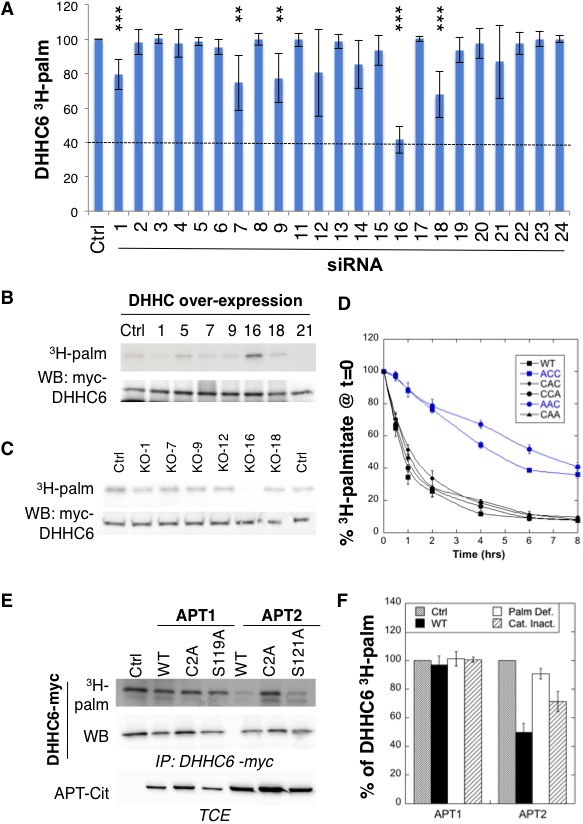
(A) Identification of the ZDHHC6 palmitoyltransferase by siRNA screening of DHHC enzymes. HeLa cells were transfected with siRNAs against the indicated ZDHHC enzyme for 72 hr and with the myc-tagged WT ZDHHC6 expressing construct for the last 24 hr. Cells were then metabolically labelled 2 hr at 37°C with 3H-palmitic acid. Proteins were extracted, immunoprecipitated with myc antibodies and subjected to SDS-PAGE and analysed by autoradiography, quantified using the Typhoon Imager or by immunoblotting with myc antibodies. 3H-palmitic acid incorporation into ZDHHC6 was quantified and normalized to protein expression levels. The calculated value of 3H-palmitic acid incorporation into ZDHHC6 was set to 100% for an irrelevant siRNA (Ctrl) and all siRNA were expressed relative to this (n = 6, error bars represent standard deviation). (B) Identification of the ZDHHC6 palmitoyltransferase by DHHC over-expression. HeLa cells were transfected with indicated the ZDHHC constructs and with myc-tagged WT ZDHHC6 construct for 24 hr. Cells were then metabolically labelled 2 hr at 37°C with 3H-palmitic acid. Proteins were extracted, immunoprecipitated with myc antibodies and subjected to SDS-PAGE and analysed by autoradiography (3H-palm) or by immunoblotting with myc antibodies. (C) Analysis of ZDHHC6 acylation in control HAP cells (Ctrl) versus HAP cells KO for DHHC 1, 7, 9, 12, 16, 18 (KO-X). Cells were transfected with the myc-tagged WT ZDHHC6 construct for 24 hr, then metabolically labelled 2 hr at 37°C with 3H-palmitic acid. Proteins were extracted, immunoprecipitated with myc antibodies and subjected to SDS-PAGE and analysed by autoradiography (3H-palm) or by immunoblotting with myc antibodies. (D) Palmitoylation decay of WT or mutant ZDHHC6. HeLa cells were transfected with plasmids encoding WT or the indicated mutant Myc-tagged ZDHHC6 constructs for 24 hr. Cells were then metabolically labelled 2 hr at 37°C with 3H-palmitic acid, washed and incubated with complete medium for different hours. Proteins were extracted, immunoprecipitated with myc antibodies and subjected to SDS-PAGE and analysed by autoradiography, quantified using the Typhoon Imager or by immunoblotting with anti-myc antibodies. 3H-palmitic acid incorporation was quantified for each time point, normalized to protein expression level. 3H-palmitic acid incorporation was set to 100% at t = 0 after the 2 hr pulse and all different times of chase were expressed relative to this (n = 3, error bars represent standard deviation). (E) ZDHHC6 palmitoylation upon APT overexpression. HeLa cells were transfected with plasmids encoding myc-tagged WT ZDHHC6 and the indicated mutant citrine-tagged APT1 or APT2 constructs for 24 hr. APT2 was always expressed at a higher level that APT1. Cells were then metabolically labelled 2 hr at 37°C with 3H-palmitic acid. Proteins were extracted, immunoprecipitated with myc antibodies and subjected to SDS-PAGE and analysed by autoradiography (3H-palm), quantified using the Typhoon Imager or by immunoblotting with anti-myc antibodies. (F) Quantification of 3H-palmitic acid incorporation into ZDHHC6. Quantified values were normalized to protein expression level. 3H-palmitic acid incorporation was set to 100% for control cells (Ctrl) and values obtained for APT overexpressing cells were expressed relative to this (n = 6, error bars represent standard deviation).
Figure 2—figure supplement 1
ZDHHC16 mediates ZDHHC6 palmitoylation.
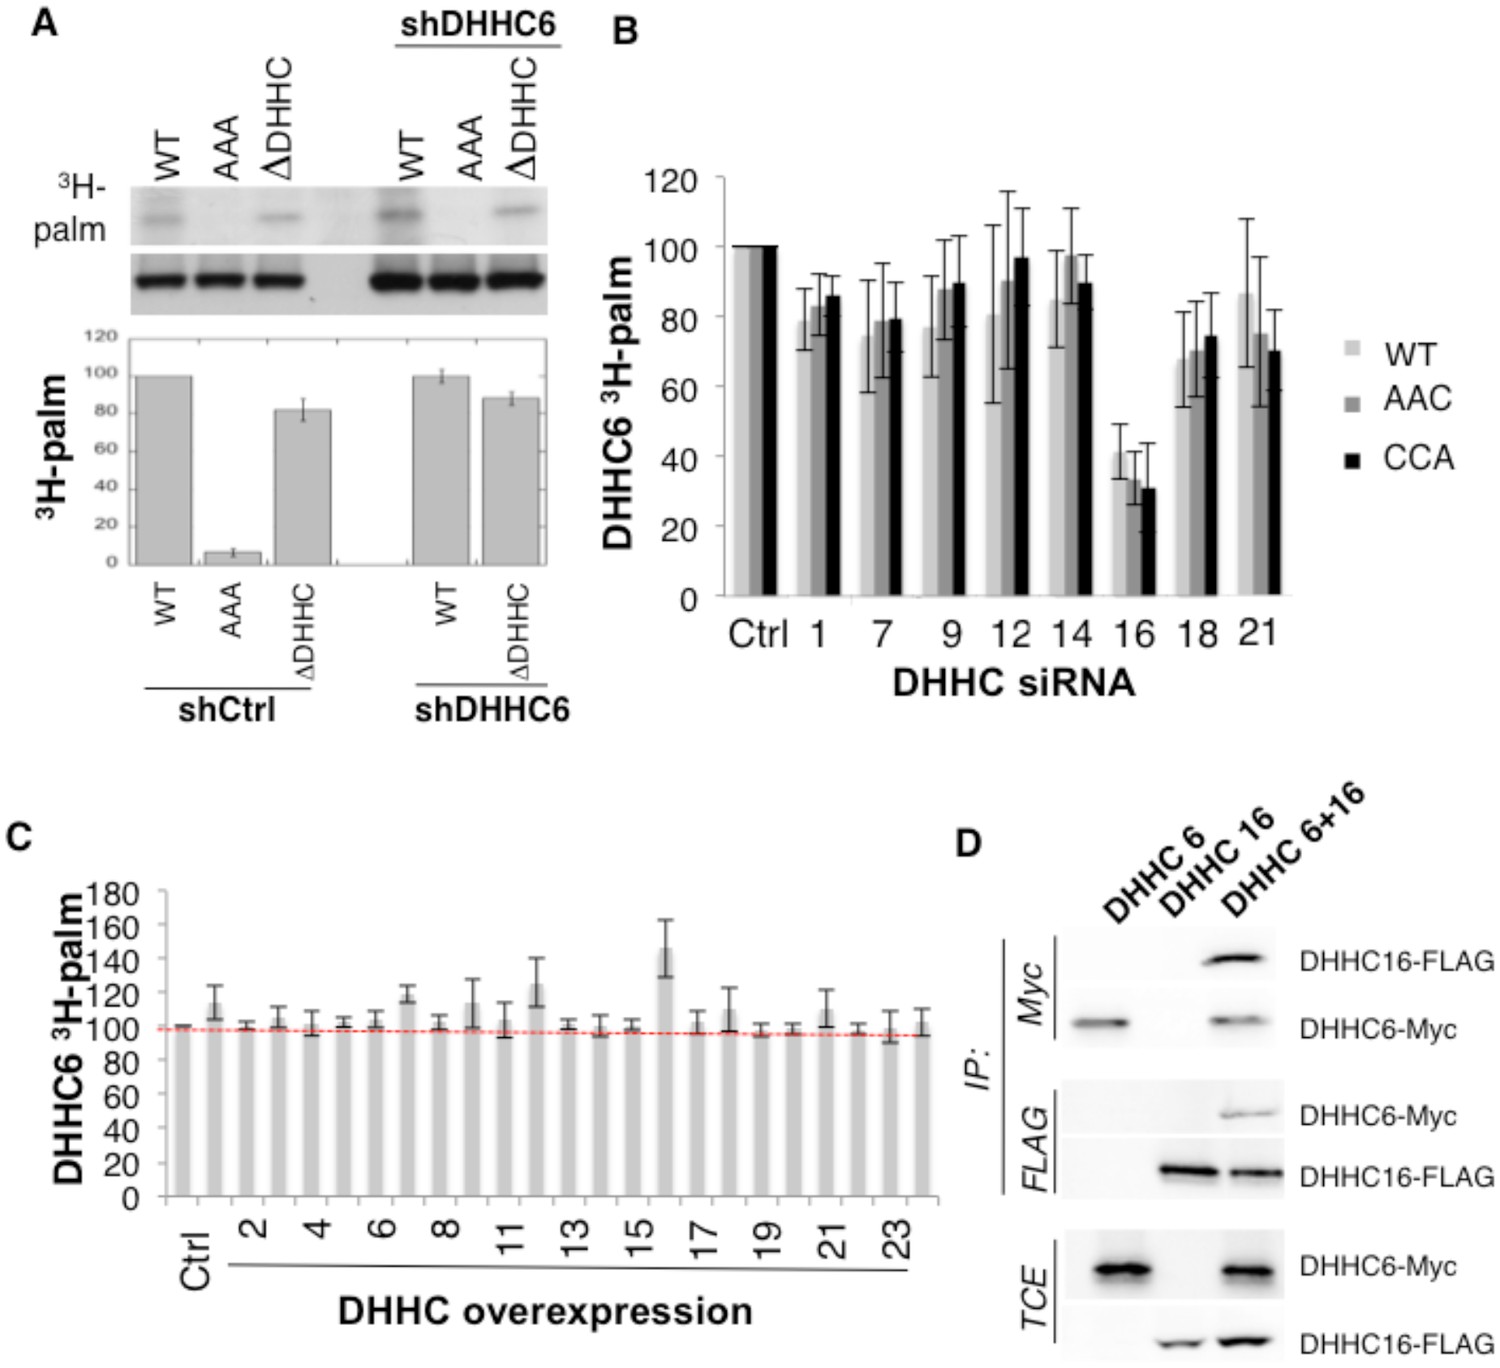
(A) DHHC6 is not autopalmitoylated. Hela cells silenced with control lentiviruses or with shDHHC6 lentiviruses were transfected with plasmids encoding WT myc-DHHC6 or mutant myc-DHHC6. Cells were then metabolically labeled 2 hr at 37°C with 3H-palmitic acid. Proteins were extracted and immunoprecipitated with anti-myc antibodies, subjected to SDS-PAGE and analyzed by autoradiography (3H-palm), quantified using the Typhoon Imager or by immunoblotting with anti-myc antibodies. 3H-palmitic acid incorporation into DHHC6 values were calculated and were set to 100% for WT DHHC6 constructs and all DHHC6 mutants were expressed relative to this. N = 4. (B) All DHHC6 cysteine are palmitoylated by DHHC16. Hela cells were transfected with siRNA silencing indicated DHHC for 72 hr and with WT and cysteine mutants myc-tagged DHHC6 construct for the last 24 hr. Cells were then metabolically labeled 2 hr at 37°C with 3H-palmitic acid. Proteins were extracted, immunoprecipitated with myc antibodies and subjected to SDS-PAGE and analyzed by autoradiography, quantified using the Typhoon Imager or by immunoblotting with myc antibodies. 3H-palmitic acid incorporation into WT and mutants DHHC6 constructs were quantified and normalized to protein expression level. The calculated value of 3H-palmitic acid incorporation into WT or mutants DHHC6 was set to 100% for a non relevant siRNA (Ctrl) and all siRNA were expressed relative to this. N = 3. (C) Palmitoylation of WT DHHC6 after human DHHC overexpression. Hela cells were transfected with indicated DHHC constructs for 24 hr with WT myc-tagged DHHC6 construct. Cells were then metabolically labeled 2 hr at 37°C with 3H-palmitic acid. Proteins were extracted, immunoprecipitated with myc antibodies and subjected to SDS-PAGE and analyzed by autoradiography, quantified using the Typhoon Imager or by immunoblotting with myc antibodies. 3H-palmitic acid incorporation into WT DHHC6 constructs were quantified and normalized to protein expression level. The calculated value of 3H-palmitic acid incorporation into WT DHHC6 was set to 100% for a non relevant plasmid (Ctrl) and all DHHC were expressed relative to this. N = 5. (D) Co-immunoprecipitation of DHHC6 with DHHC16. Hela cells were transfected with plasmids encoding WT myc-DHHC6 and flag-tagged DHHC16 constructs for 24 hr. Proteins were extracted, a total cell extract was analyzed (TCE) and proteins were immunoprecipitated with myc or flag antibodies and subjected to SDS-PAGE, then analyzed by immunoblotting with anti-myc or anti-flag antibodies.
Figure 2—figure supplement 2
ZDHHC16 localizes to the early secretory pathway and is not palmitoylated.
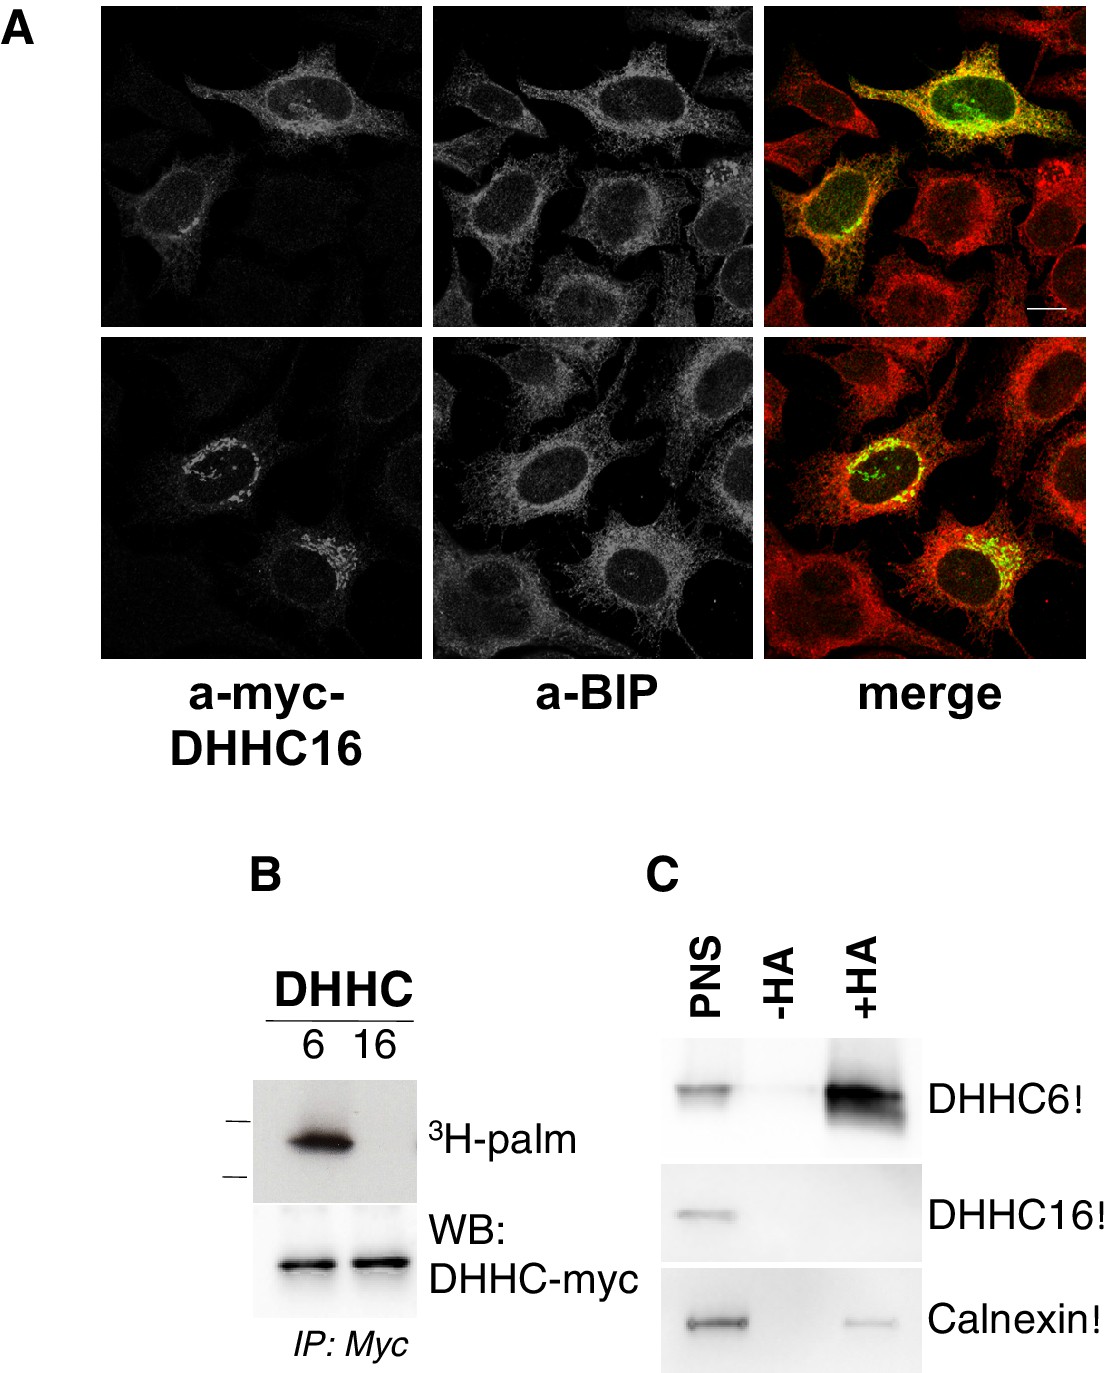
(A) Immunofluorescence staining of HeLa cells transfected with WT myc-DHHC16 and imaged at high (top lane) or lower expression levels (bottom lane) (bar = 10 µm). (B) DHHC6 is palmitoylated but not DHHC16. Hela cells were transfected with WT myc-tagged DHHC6 or myc-tagged DHHC16 construct for 24 hr. Cells were then metabolically labeled 2 hr at 37°C with 3H-palmitic acid. Proteins were extracted, immunoprecipitated with myc antibodies and subjected to SDS-PAGE and analyzed by autoradiography, quantified using the Typhoon Imager or by immunoblotting with myc or flag antibodies. (C) Analysis of protein acylation in Hela cells (Ctrl). Hela were transfected 24 hr with WT myc-DHHC6 or WT flag-DHHC16 constructs. Cell membranes were recovered by centrifugation and incubated with MMTS and then with hydroxylamine (+HA) or with TRIS (-HA) together with free thiol group binding beads. Eluted fractions were analyzed by immunoblotting with the indicated antibodies. The input fraction (PNS) was loaded as 1/10 this amount.
Figure 2—figure supplement 3
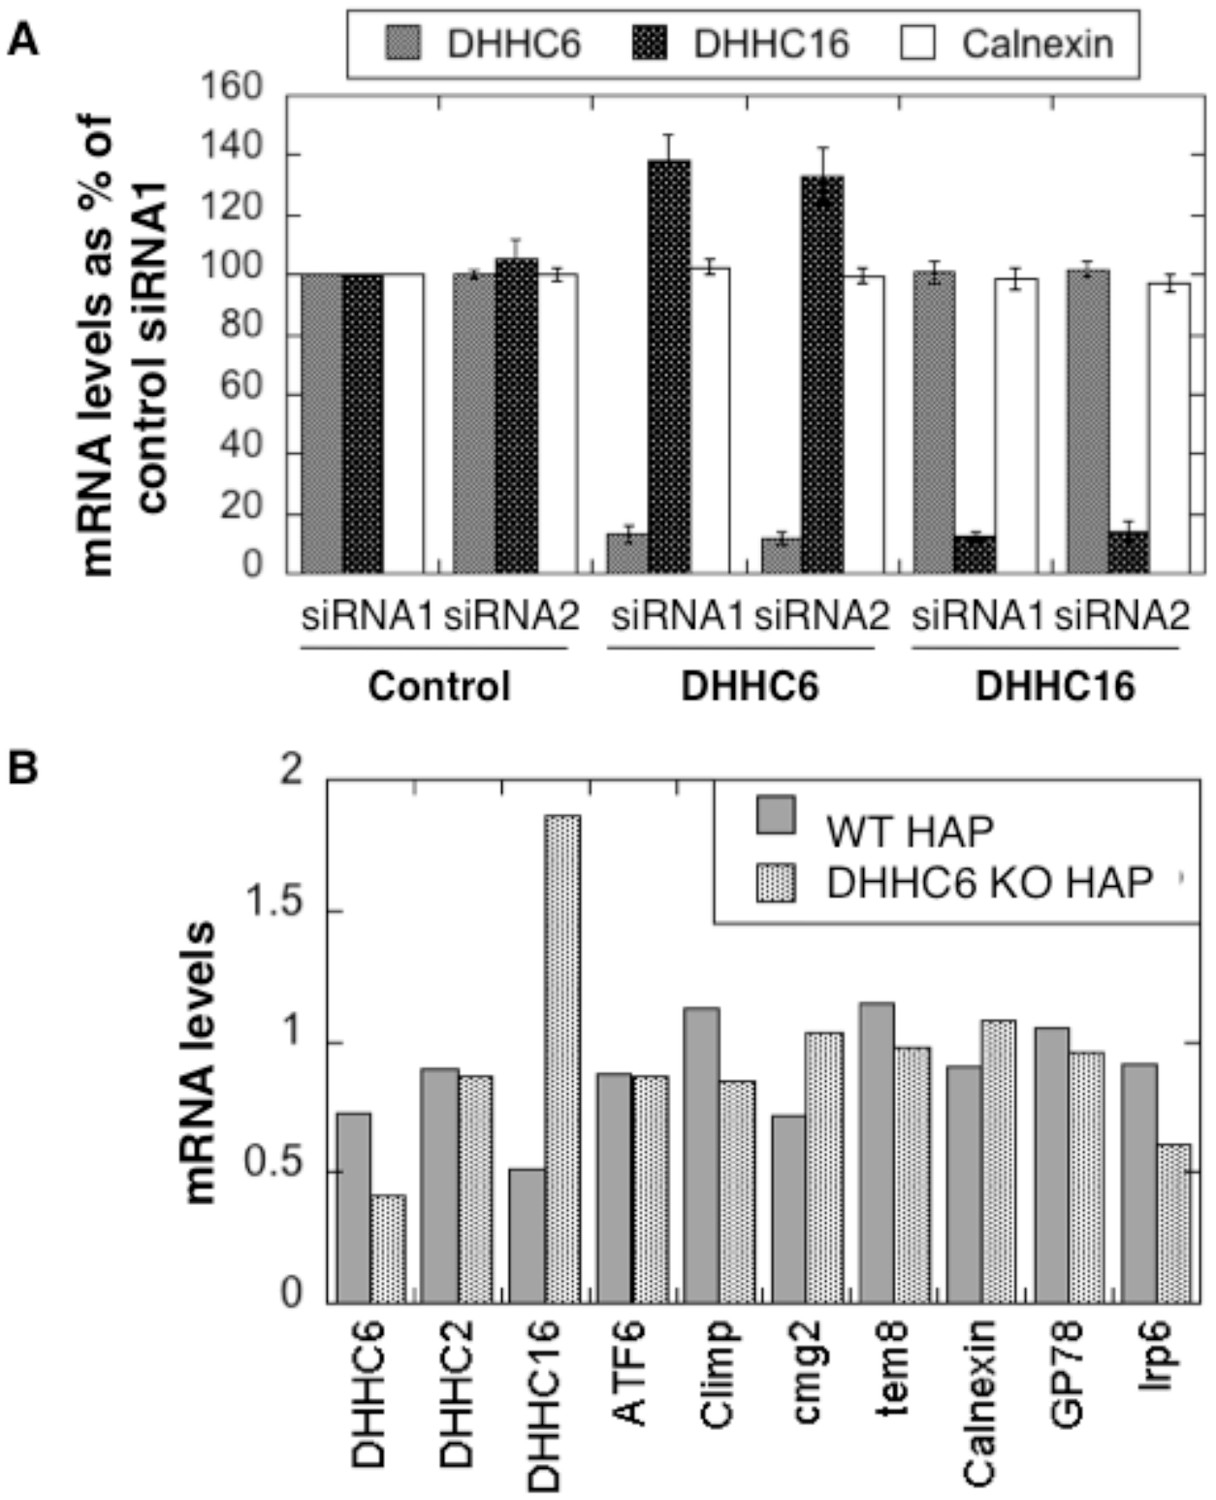
Expression levels of ZDHHC6 and 16 and their influence on one another.
(A) Silencing of DHHC6 and DHHC16 is efficient. HeLa cells were transfected for 72 hr with either two control siRNA or different DHHC siRNA. DHHC6, DHHC16, Calnexin RNA levels were analyzed by quantitative RT-PCR. The histogram shows that silencing was efficient for all DHHC enzymes (errors bars show standard deviations, n = 4). (B) DHHC16 RNA is increased in DHHC6 KO cells. Annotated RNA levels were analyzed by quantitative RT-PCR in HAP1 cells control or KO for DHHC6. Climp represents CLimp63/CKAP4.
Figure 3 with 1 supplement
Palmitoylation on Cys-328 targets ZDHHC6 to ERAD.
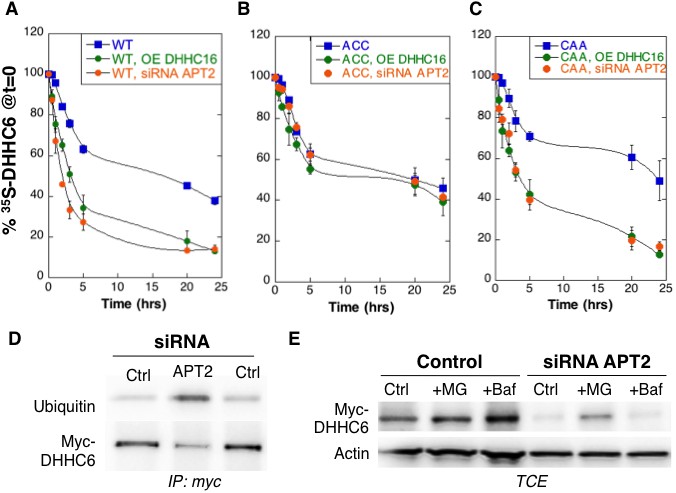
(A–C) Degradation kinetics of ZDHHC6. HeLa cells were transfected with plasmids encoding myc-tagged WT ZDHHC6 or cysteine mutants with or without FLAG-tagged WT ZDHHC16 for 24 hr after 48 hr transfection with siRNA LYPLA2 (gene encoding APT2) or with control siRNA. HeLa cells were incubated for 20 min with 35S-Met/Cys at 37°C, washed and further incubated for different times at 37°C in complete medium. ZDHHC6 was immunoprecipitated and subjected to SDS-PAGE and analysed by autoradiography, quantified using the Typhoon Imager, and western blotting with anti-myc antibodies. 35S-Met/Cys incorporation was quantified for each time point, normalized to protein expression levels. 35S-Met/Cys incorporation was set to 100% for t = 0 after the 20 min pulse and all different times of chase were expressed relative to this (n = 3, error bars represent standard deviation). (D,E) ZDHHC6 ubiquitination and proteasomal degradation. HeLa cells were transfected with plasmids encoding myc-tagged WT ZDHHC6 constructs for 24 hr after 48 hr transfection with control (Ctrl) or LYPLA2 (gene encoding APT2) siRNA. Proteins were extracted; ZDHHC6 was immunoprecipitated, subjected to SDS-PAGE and then analysed by immunoblotting with anti-ubiquitin or anti-myc antibodies (D). (E) Cells were treated 4 hr with 10 µM MG132 or with 100 nM Bafilomycin A before proteins were extracted; 40 µg of total extract were subjected to SDS-PAGE and then analysed by immunoblotting against actin, used as equal loading control, or myc.
Figure 3—figure supplement 1
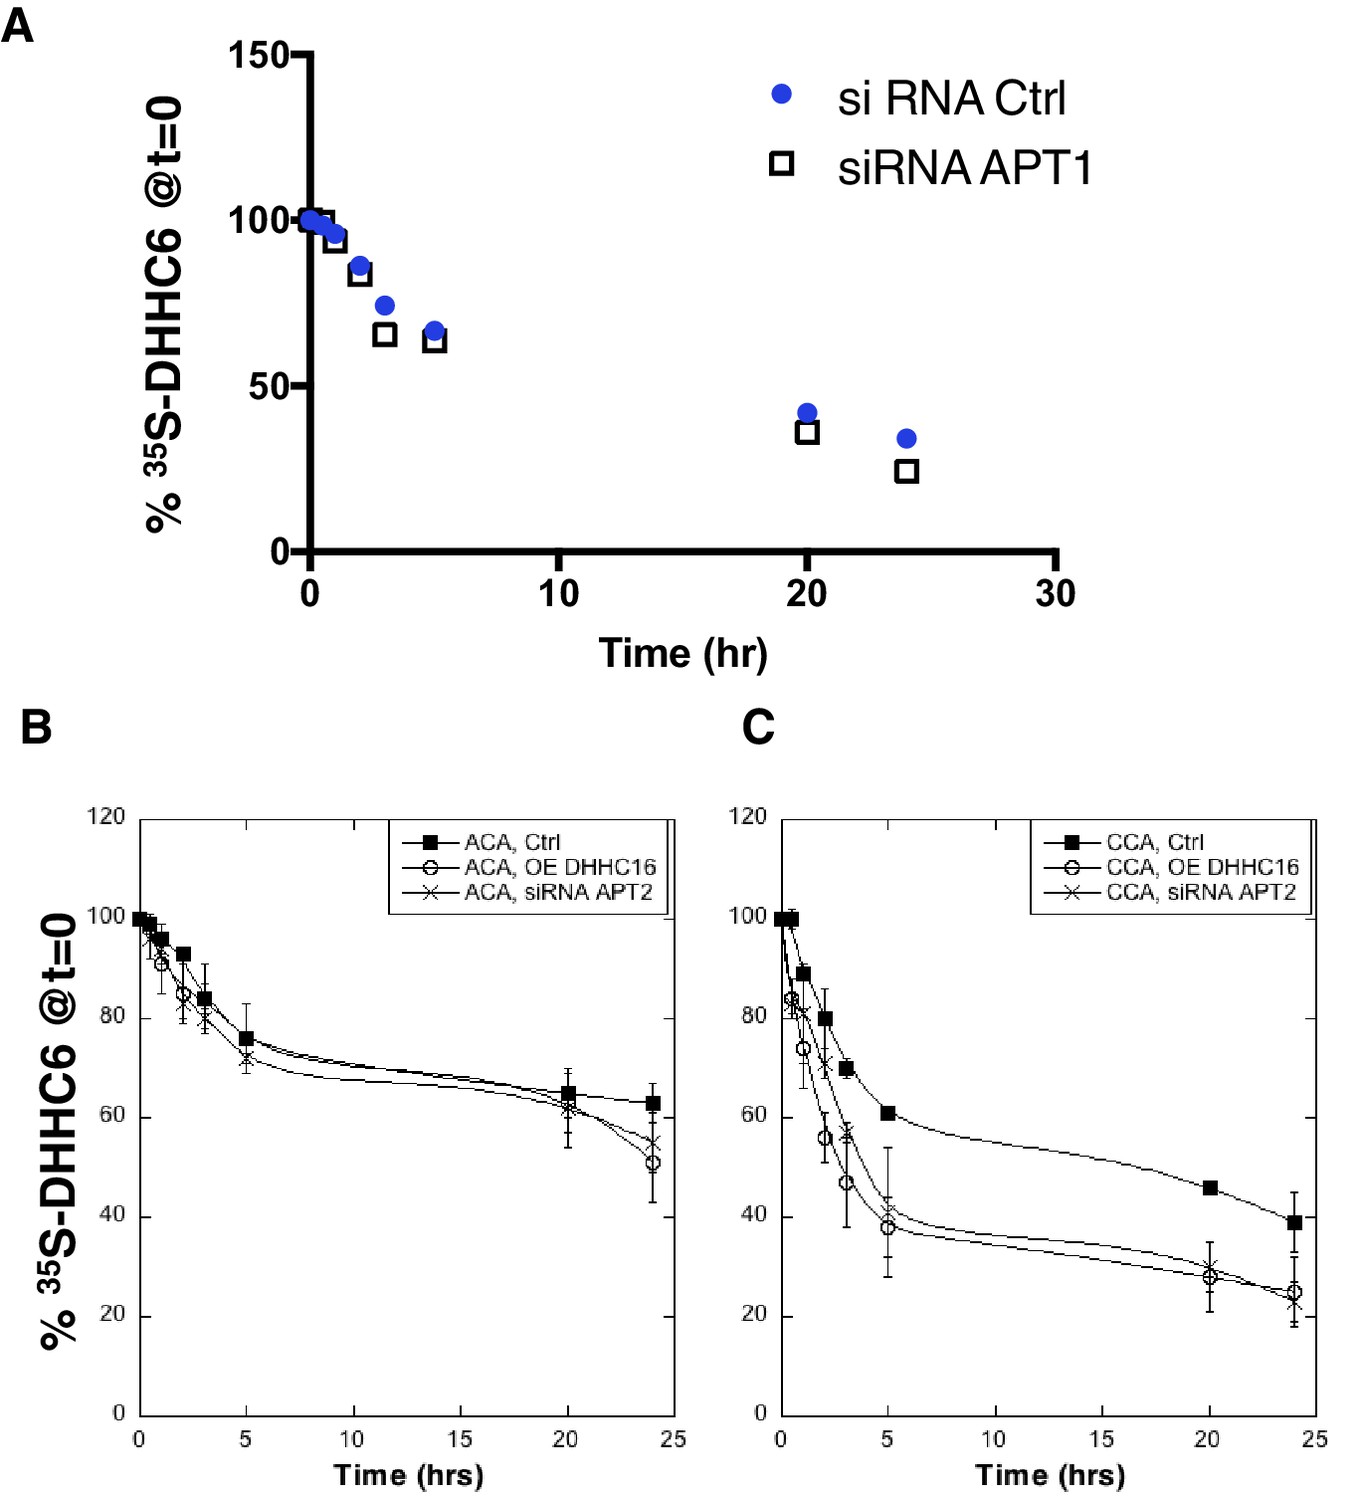
Effect of palmitoylation on ZDHHC& decay.
(A) Degradation kinetics of DHHC6. HeLa cells were transfected with plasmids encoding myc-tagged WT DHHC6 for 24 hr after 48 hr transfection with siRNA APT1 or with control siRNA. HeLa cells were incubated for 20 min with 35S-Met/Cys at 37°C, washed and further incubated for different times at 37°C in complete medium. DHHC6 was immunoprecipitated and subjected to SDS-PAGE and analysed by autoradiography. 35S-Met/Cys incorporation was quantified for each time point, normalized to protein expression levels. 35S-Met/Cys incorporation was set to 100% for t = 0 after the 20 min pulse and all different times of chase were expressed relative to this (n = 1). (B,C) Degradation kinetics of DHHC6. Hela cells were transfected with plasmids encoding cysteine mutants myc-DHHC6 constructs with or without WT flag-DHHC16 for 24 hr after 48 hr transfection with siRNA APT2 or with control siRNA. Hela cells were incubated 20 min pulse with 35S-methionin/cysteine at 37°C, washed and further incubated for different times at 37°C in complete medium. DHHC6 were immunoprecipitated and subjected to SDS-PAGE and analyzed by autoradiography, quantified using the Typhoon Imager, and western blotting with anti-myc antibodies. 35S-methionin/cysteine incorporation into different DHHC6 constructs were quantified for each times, normalized to protein expression level. The calculated value of 35S-methionin/cysteine incorporation into DHHC6 was set to 100% for t = 0 after the 20 min pulse and all different times of chase with complete medium were expressed relative to this. N = 3.
Figure 4 with 1 supplement
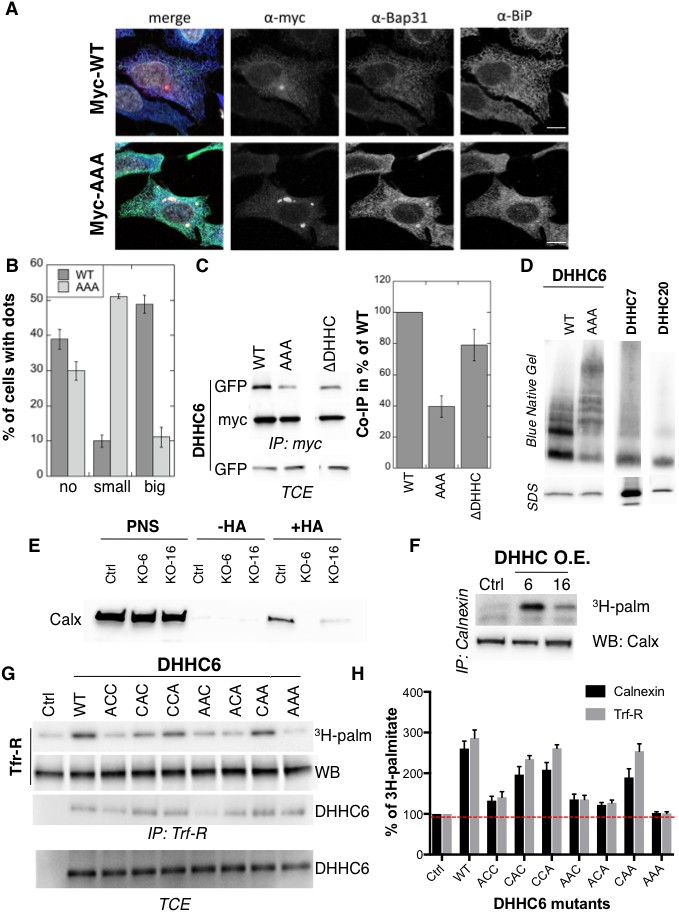
Palmitoylation affects assembly, localisation and function of ZDHHC6.
(A,B) Immunofluorescence staining of HeLa cells transfected with myc-ZDHHC6 WT or AAA (bar = 10 µm). The presence of dots (small or big) was reported for each cell and quantified (data from three independent experiments, dots in 30 cells per condition, per experiment were counted, errors represent standard deviations). (C) Co-immunoprecipitation of ZDHHC6 variants. HeLa cells were transfected with plasmids encoding WT myc-ZDHHC6 and the indicated GFP-tagged mutant for 24 hr. Proteins were extracted, a total cell extract was analysed (TCE) and proteins were immunoprecipitated with myc antibodies and subjected to SDS-PAGE, then analysed by immunoblotting with anti-myc or anti-GFP antibodies. Quantification was performed by densitometry. The calculated value of co-immunoprecipitation with WT ZDHHC6 was set to 100%, all ZDHHC6 mutants were expressed relative to this (n = 4, errors represent standard deviations). (D) ZDHHC6 complexes. HeLa cells were transfected with plasmids encoding myc-ZDHHC6 WT or mutant, or myc-tagged DHHC7 or DHHC20 for 24 hr. Proteins were extracted, 40 µg of a TCE was analysed by SDS-PAGE or on blue native gels then analysed by immunoblotting with anti-myc antibodies. (E) Analysis of endogenous calnexin acylation in control HAP cells (Ctrl) versus HAP cells KO for ZDHHC6 (KO-6) or for ZDHHC16 (KO-16). HAP cell membranes were recovered by centrifugation and incubated with MMTS and then with hydroxylamine (+HA) or with Tris (−HA) together with free thiol group binding beads. Eluted fractions were analysed by immunoblotting with anti-calnexin antibodies. PNS represents 1/10 of the input fraction. (F) Analysis of endogenous calnexin palmitoylation in HeLa cells overexpressing ZDHHC6 or ZDHHC16. HeLa cells were transfected with plasmids encoding WT myc-ZDHHC6 or WT myc-ZDHHC16 constructs for 24 hr. Cells were then metabolically labelled 2 hr at 37°C with 3H-palmitic acid. Proteins were extracted and immunoprecipitated with anti-calnexin antibodies, subjected to SDS-PAGE and analysed by autoradiography (3H-palm) or by immunoblotting with anti-calnexin antibodies. (G,H) Analysis of endogenous calnexin and Transferin receptor (Trf-R) palmitoylation in HeLa cells overexpressing ZDHHC6 mutants. HeLa cells were transfected with control plasmid (Ctrl) or plasmids encoding WT or mutants myc-ZDHHC6 for 24 hr. Cells were then metabolically labelled 2 hr at 37°C with 3H-palmitic acid. Proteins were extracted and immunoprecipitated with anti-calnexin or anti-Trf-R antibodies, subjected to SDS-PAGE and analysed by autoradiography (3H-palm), quantified using the Typhoon Imager. A representative experiment is shown for the Trf-R (G). 3H-palmitic acid incorporation into calnexin or Trf-R was set to 100% for the control plasmid and all ZDHHC6 mutants were expressed relative to this (n = 4, errors represent standard deviations).
Figure 4—figure supplement 1
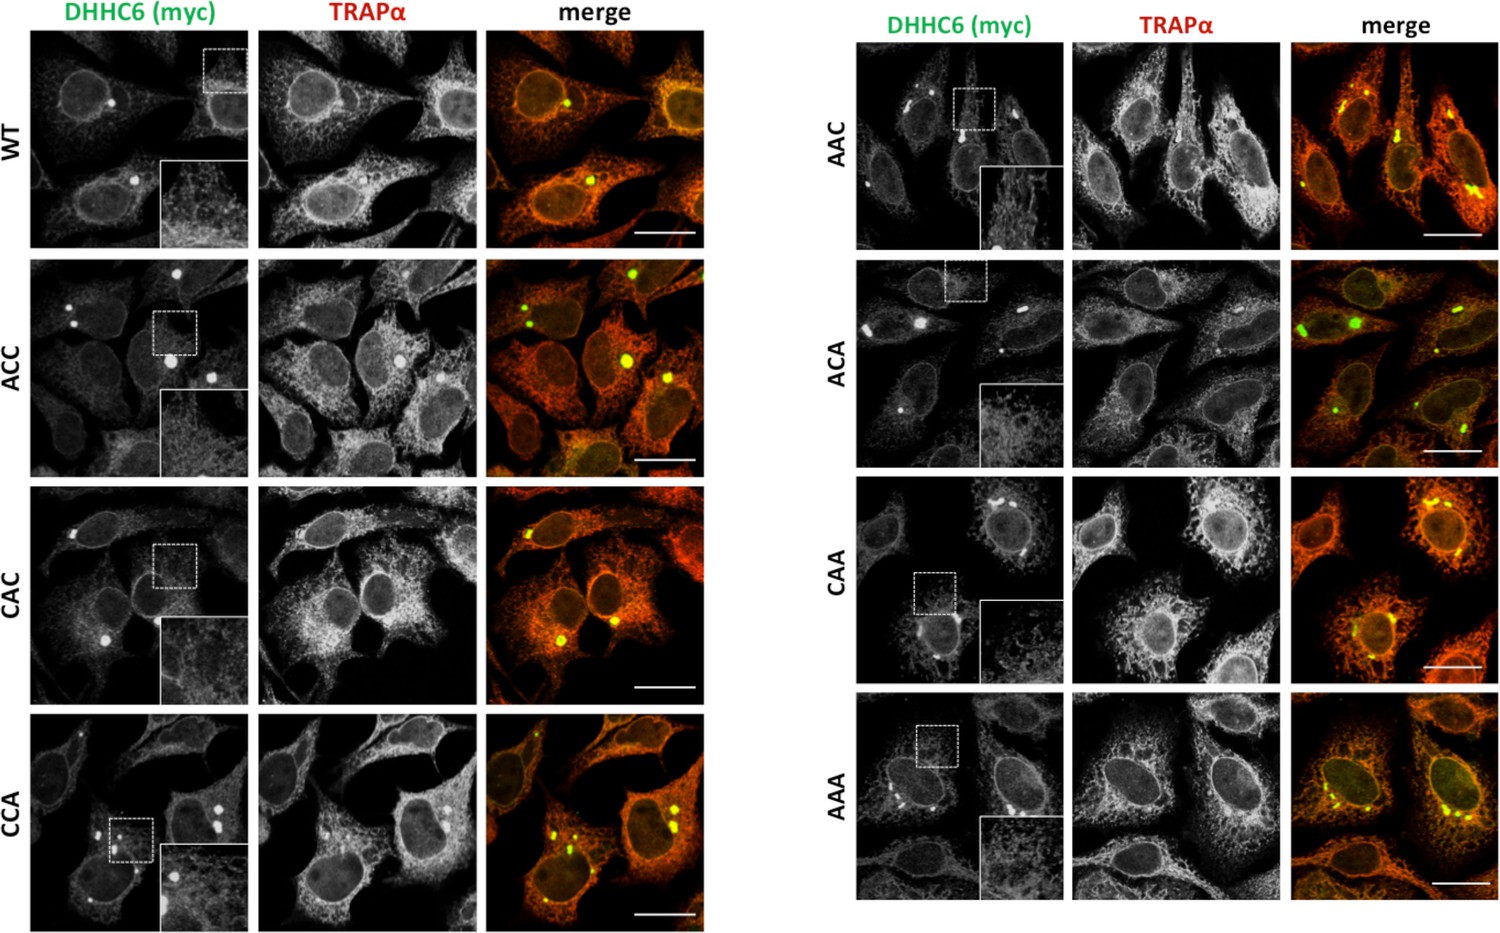
Immunofluorescence staining of HeLa cells transfected with myc-DHHC6 WT or cysteine mutants.
https://doi.org/10.7554/eLife.27826.011
Figure 5 with 3 supplements
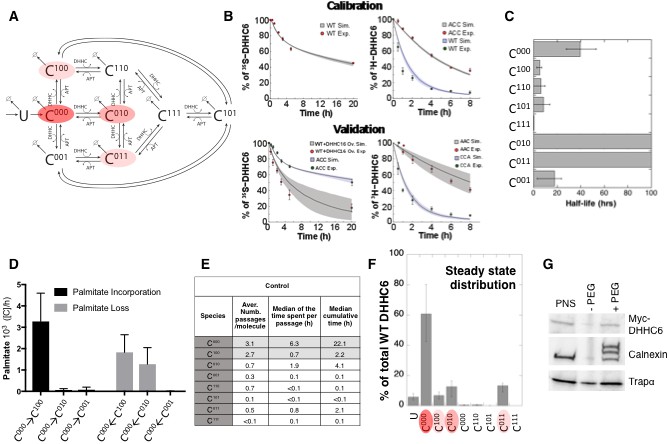
Modelling and analysis of ZDHHC6 palmitoylation.
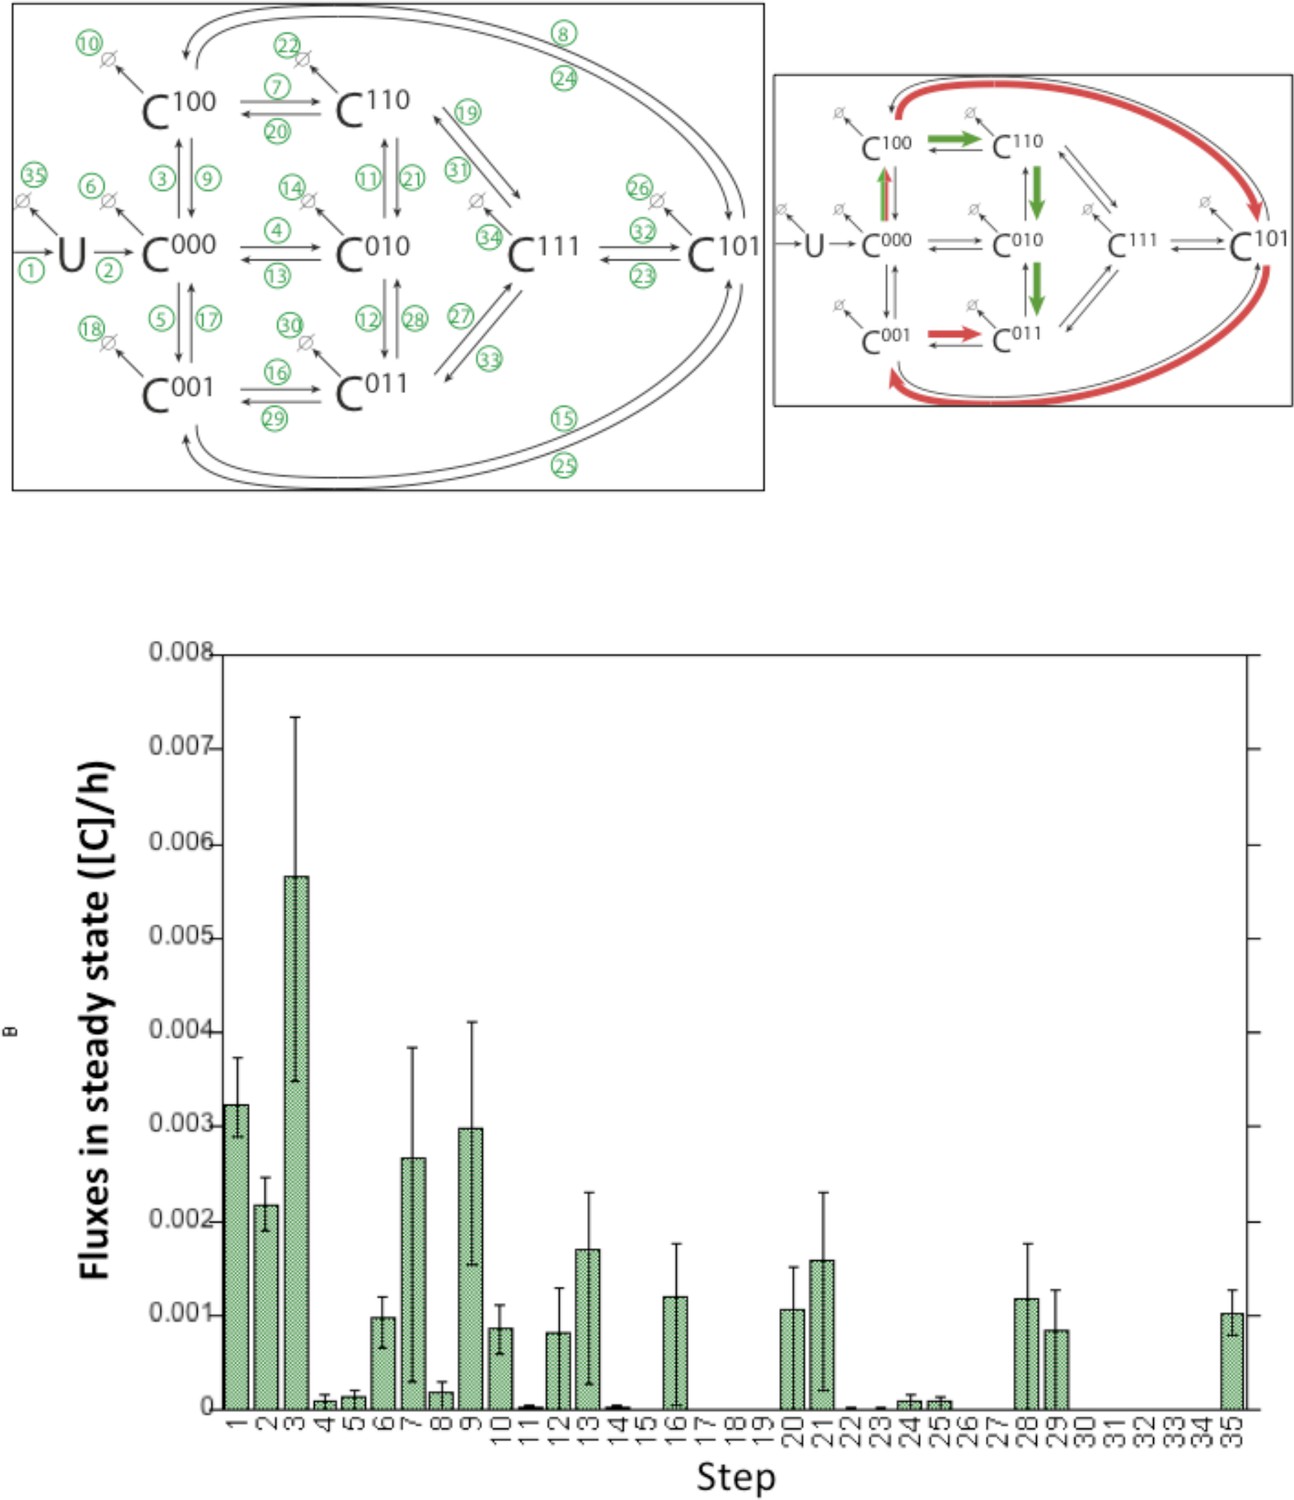
(A) Network topology of the ZDHHC6 palmitoylation model. First we have a phase of synthesis of the unfolded peptide (U). The protein goes through a process of folding and membrane embedding, ending in the fully folded form (C000). The three sites can then be palmitoylated by ZDHHC16, the first palmitoylation can occur on each site, C100 C010 and C001 denote palmitoylation on the first, second or third site respectively. ZDHHC6 can then undergo another palmitoylation step acquiring two palmitates; C110, C101 and C011 denote the double palmitoylated enzyme. From each of the three double palmitoylated states, ZDHHC6 can be modified one last time becoming fully palmitoylated (C111). We consider that ZDHHC6 degradation can happen in any state. Highlighted in red are the most abundant species in steady state. (B) Part of the calibration and validation sets used for parameter estimation. In the top graphs we show three curves that were used during parameter estimation with genetic algorithm to evaluate the goodness of fit of the parameters generated. Other curves used for the validation are shown in Figure 5—figure supplement 1. The four curves in the bottom graphs are part of the data that were used for validating the predictions on experiments that were not used for parameter calibration. Circles represent experimental data while the solid lines are the output of the model after optimization. Since we have 152 different sets of optimal parameters, the shadows behind the lines represent the first and third quartile of the 152 model outputs. All other curves used for parameter estimation can be found in Figure 5—figure supplement 2. (C) Half-life of the different ZDHHC6 palmitoylation states estimated from the decay rate constants of the model after optimization. The half-life was calculated as: ln(2)/kdi. Where kdi is the decay rate constant of the i-th palmitoylation state. These are not experimentally determined apparent turn over rates. (D) Palmitoylation and depalmitoylation fluxes for the six steps of single palmitoylation/depalmitoylation in steady state, which represent the fluxes of palmitate incorporation and loss on the first, second and third site during the first palmitoylation event. Fluxes in steady state for all reactions are shown in Figure 5—figure supplement 3. (E) Single molecule tracking with stochastic simulations. The table shows the average number of passage per molecule for each state of the model, along with the median and the cumulative median of the time spent in each state. These data were obtained from the analysis of 10’000 stochastic simulations. (F) Prediction of the steady state distribution of ZDHHC6 WT palmitoylation species. (G) Stoichiometry of ZDHHC6 palmitoylation in HeLa cells. HeLa cells were transfected with plasmids encoding WT myc-ZDHHC6 constructs for 24 hr. Protein lysates were processed for the APEGS assay. PEG-5k was used to label transfected myc-ZDHHC6 and endogenous protein (PEG+), PEG- lanes indicate the negative controls. The samples were analysed by western blotting with anti-myc, anti-calnexin, anti-TRAP alpha antibodies.
Figure 5—figure supplement 1
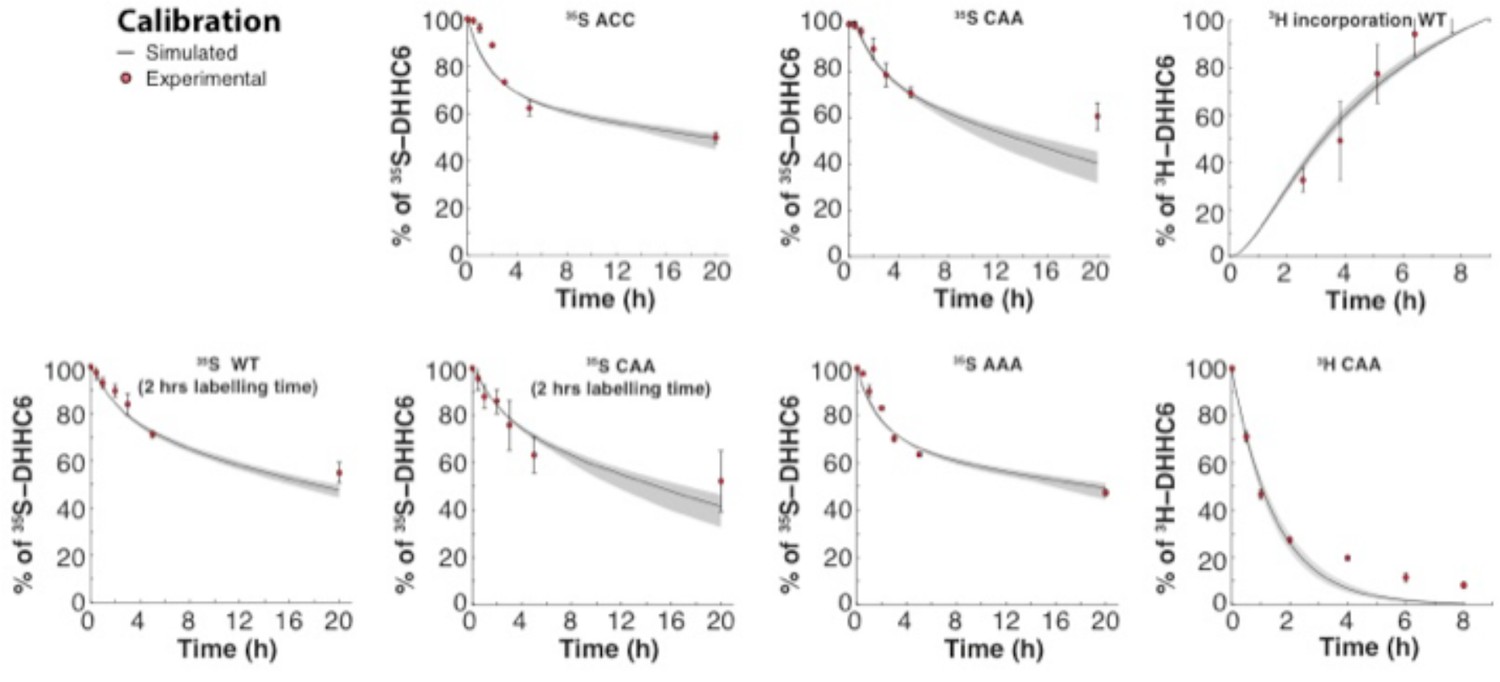
Calibration of the ZDHHC6 palmitoylation model.
Calibration data Results of the GA optimization are plotted on top of the experimental data used as objectives.
Figure 5—figure supplement 2
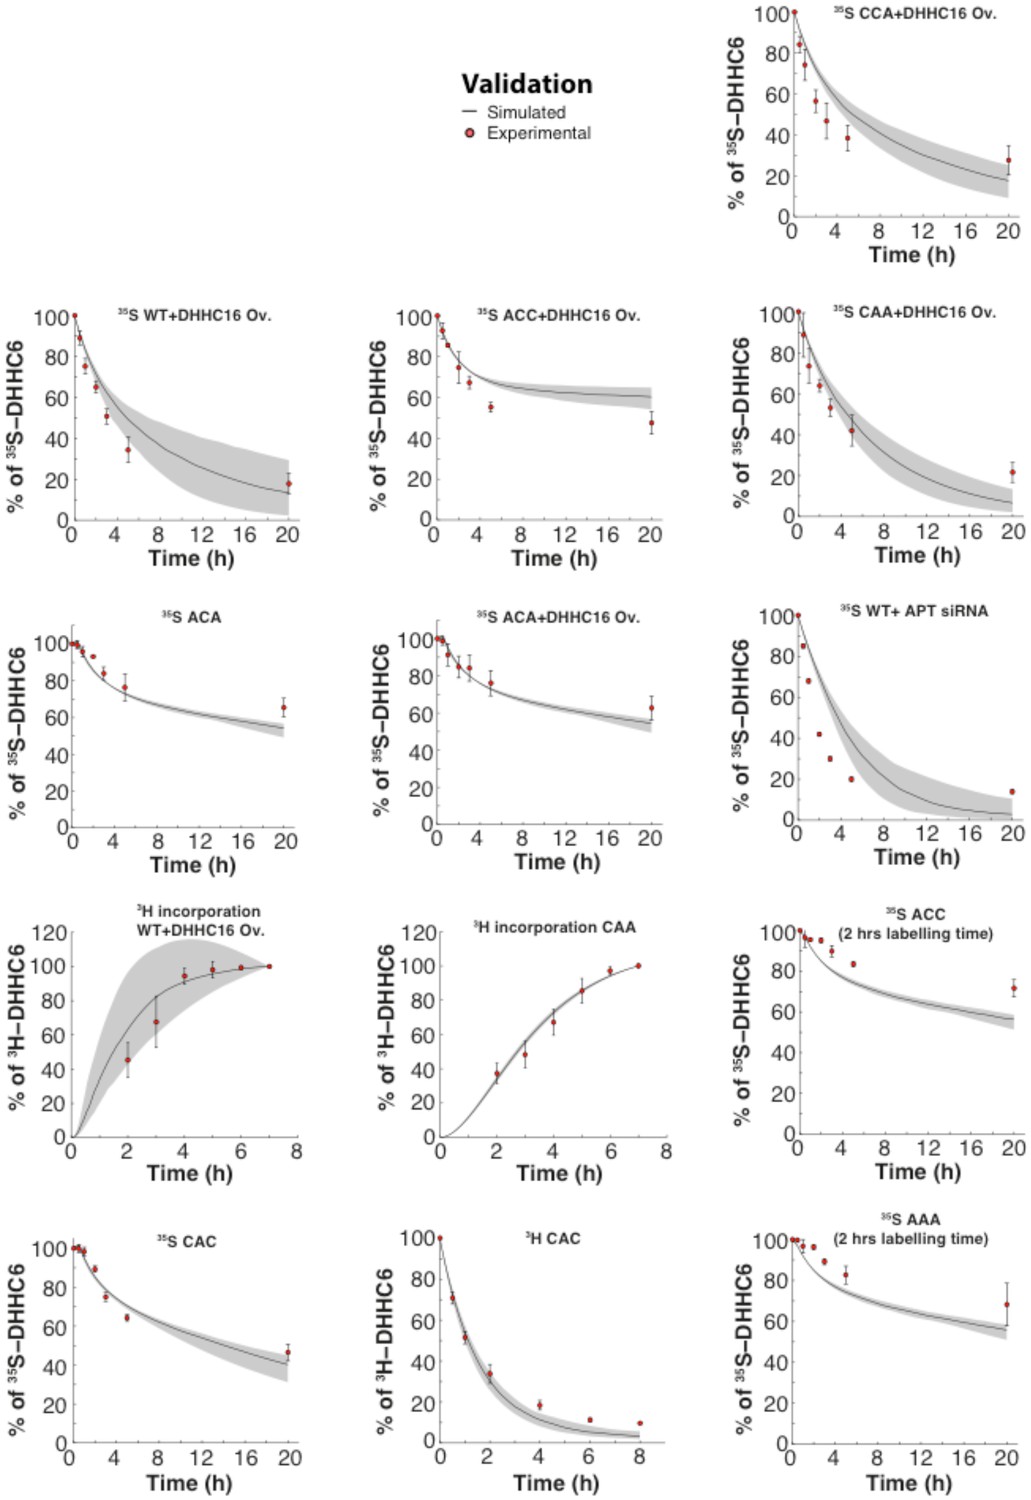
Validation.
Results of the GA optimization are plotted on top of the experimental data used as validation.
Figure 5—figure supplement 3
Model fluxes in steady state.
The histogram shows the fluxes of the DHHC6 model in steady state under control condition. Lower Panel: Time required by DHHC6 to get palmitoylated for the first time after synthesis in control condition and DHHC6 Overexpression or APT2 silencing conditions. Histograms where obtained by single molecule tracking during stochastic simulations, measuring the time required to get palmitoylated on one of the three available sites.
Figure 6
Importance of multiple palmitoylation sites.
(A) Single molecule tracking with stochastic simulations upon ZDHHC16 overexpression. The table shows the average number of passage per molecule in each state of the model, along with the median and the cumulative median of the time spent in each state. As for control experiments this numbers were obtained by averaging the results of 10’000 independent stochastic simulations. (B) Steady state ZDHHC6 WT species distribution under different conditions (control, ZDHHC16 Overexpression, LYPLA2 (gene encoding APT2) silencing and APT2 at 10% level of expression with respect to WT condition). All the data are scaled with respect to the total abundance of ZDHHC6 WT under control condition. (C) Steady state distribution of the ZDHHC6 CAA mutant under control condition or ZDHHC16 overexpression. All the data are scaled with respect to the total abundance of ZDHHC6 WT in normal condition. (D) Calnexin palmitoylation upon ZDHHC6 and ZDHHC16 overexpressed. HeLa cells were transfected with control plasmid (Ctrl) or plasmids encoding WT or mutants myc-ZDHHC6 in the presence or not of FLAG-ZDHHC16 for 24 hr. Cells were then metabolically labelled 2 hr at 37°C with 3H-palmitic acid. Proteins were extracted, TCE isolated, and immunoprecipitated with anti-calnexin antibodies, subjected to SDS-PAGE and analysed by autoradiography (3H-palm), quantified using the Typhoon Imager or by immunoblotting with anti-calnexin, anti-myc or anti-flag antibodies. (E) Quantification of ZDHHC6 levels in total cell extracts with or without ZDHHC16 overexpression. The calculated value for WT ZDHHC6 under control condition was set to 100%. All ZDHHC6 mutants with or without ZDHHC16 were expressed relative to this (n = 3, errors represent standard deviations). (F) Quantification of 3H-palmitic acid incorporation into endogenous calnexin with ZDHHC6 in the absence or presence of ZDHHC16. The calculated value of 3H-palmitic acid incorporation into calnexin was set to 100% for control plasmid (Ctrl) and all ZDHHC6 mutants were expressed relative to this, n = 3. (G) Stoichiometry of ZDHHC6 palmitoylation in HeLa cells with ZDHHC16 overexpressed. HeLa cells were transfected with plasmids encoding WT myc-ZDHHC6 with Flag-ZDHHC16 constructs for 24 hr. Protein lysates were processed for the APEGS assay. PEG-5k were used for labelling of transfected myc-ZDHHC6 (PEG+), PEG- lanes indicate the negative controls. The samples were analysed by western blotting with anti-myc. (H) Adult mouse tissues were processed for the APEGS assay. PEG-5k were used for labelling of endogenous ZDHHC6 (PEG+), PEG- lanes indicate the negative controls. The samples were analysed by western blotting with rabbit anti-ZDHHC6.
Additional files
-
Source data 1
Source data for all figures.
- https://doi.org/10.7554/eLife.27826.017
-
Supplementary file 1
(A) Model reactions. The model of DHHC6 palmitoylation contains 35 different reactions, describing synthesis, folding, degradation, and the enzymatic reactions of DHHC6 palmitoylation/depalmitoylation. In the following table we describe in detail how the rates for those reactions are calculated. (B) Mass balance equations. The following table describes the mass balance for each of the species of DHHC6 model. The rates of the mass balance of each state are described in detail in A. (C) Model parameters. The output of GA is a set of optimal solutions, where a solution is a complete set of parameter needed to perform model simulations. From this set we extracted a sub-set of 152 solutions that obtained a GA score better than a set threshold for each objective. During the analysis the model was simulated for each set of parameters of the sub-set. We then reported in this paper the mean of the outputs along with the first and third quartile of their distribution.
- https://doi.org/10.7554/eLife.27826.018
-
Supplementary file 2
(A) Half-life of DHHC6 in different palmitoylation states. The half-life was estimated from the decay rate constant obtained through parameter estimation. The half-life is calculate as: ln(2)/kd. (B) Total amount of protein in steady state relative to WT for WT and CAA mutant in different conditions. The table shows the total protein in steady state in the model relative to the abundance of DHHC6 observed in steady state in WT conditions. Simulations are performed for WT and CAA mutant under control conditions, after overexpression of DHHC16 and after silencing of APT2.
- https://doi.org/10.7554/eLife.27826.019
-
Supplementary file 3
(A) Parameters used for stochastic simulations. The following parameters were obtained through the conversion of the deterministic parameters estimated by the GA (see Dallavilla et al., 2016). (B) Stoichiometric matrix used for stochastic simulations. In the following table we define the stoichiometry and the directionality of the reactions of the model. Each reaction has a directionality that define which are the reagents and which are the products. In this table each line represents a model reaction, while in the columns we find all the states of the model. For each reaction the states of the model that take part to the reaction as reagents are marked with −1, while the states that participate as products are marked with 1. The matrix that is formed in this way allow to attribute the correct directionality to model reactions during the calculation of the mass balance for each state of the model. (C) Propensity function used for stochastic simulations. In the first column of the table, each line describes a reaction of the model. To each reaction is associated a rate, in the second column, that describes the probability of that reaction to happen at each time step of the stochastic simulation.
- https://doi.org/10.7554/eLife.27826.020
-
Supplementary file 4
Results of stochastic simulation when APT2 is silenced.
The table shows the average number of passages of a DHHC6 molecule in the different palmitoylation states when APT2 is silenced. The time spent in each state is also reported.
- https://doi.org/10.7554/eLife.27826.021
-
Transparent reporting form
- https://doi.org/10.7554/eLife.27826.022
Download links
A two-part list of links to download the article, or parts of the article, in various formats.
Downloads (link to download the article as PDF)
Open citations (links to open the citations from this article in various online reference manager services)
Cite this article (links to download the citations from this article in formats compatible with various reference manager tools)
Identification and dynamics of the human ZDHHC16-ZDHHC6 palmitoylation cascade
eLife 6:e27826.
https://doi.org/10.7554/eLife.27826


