Intermittent Ca2+ signals mediated by Orai1 regulate basal T cell motility
- University of California, Irvine, United States
Figures
Figure 1 with 1 supplement
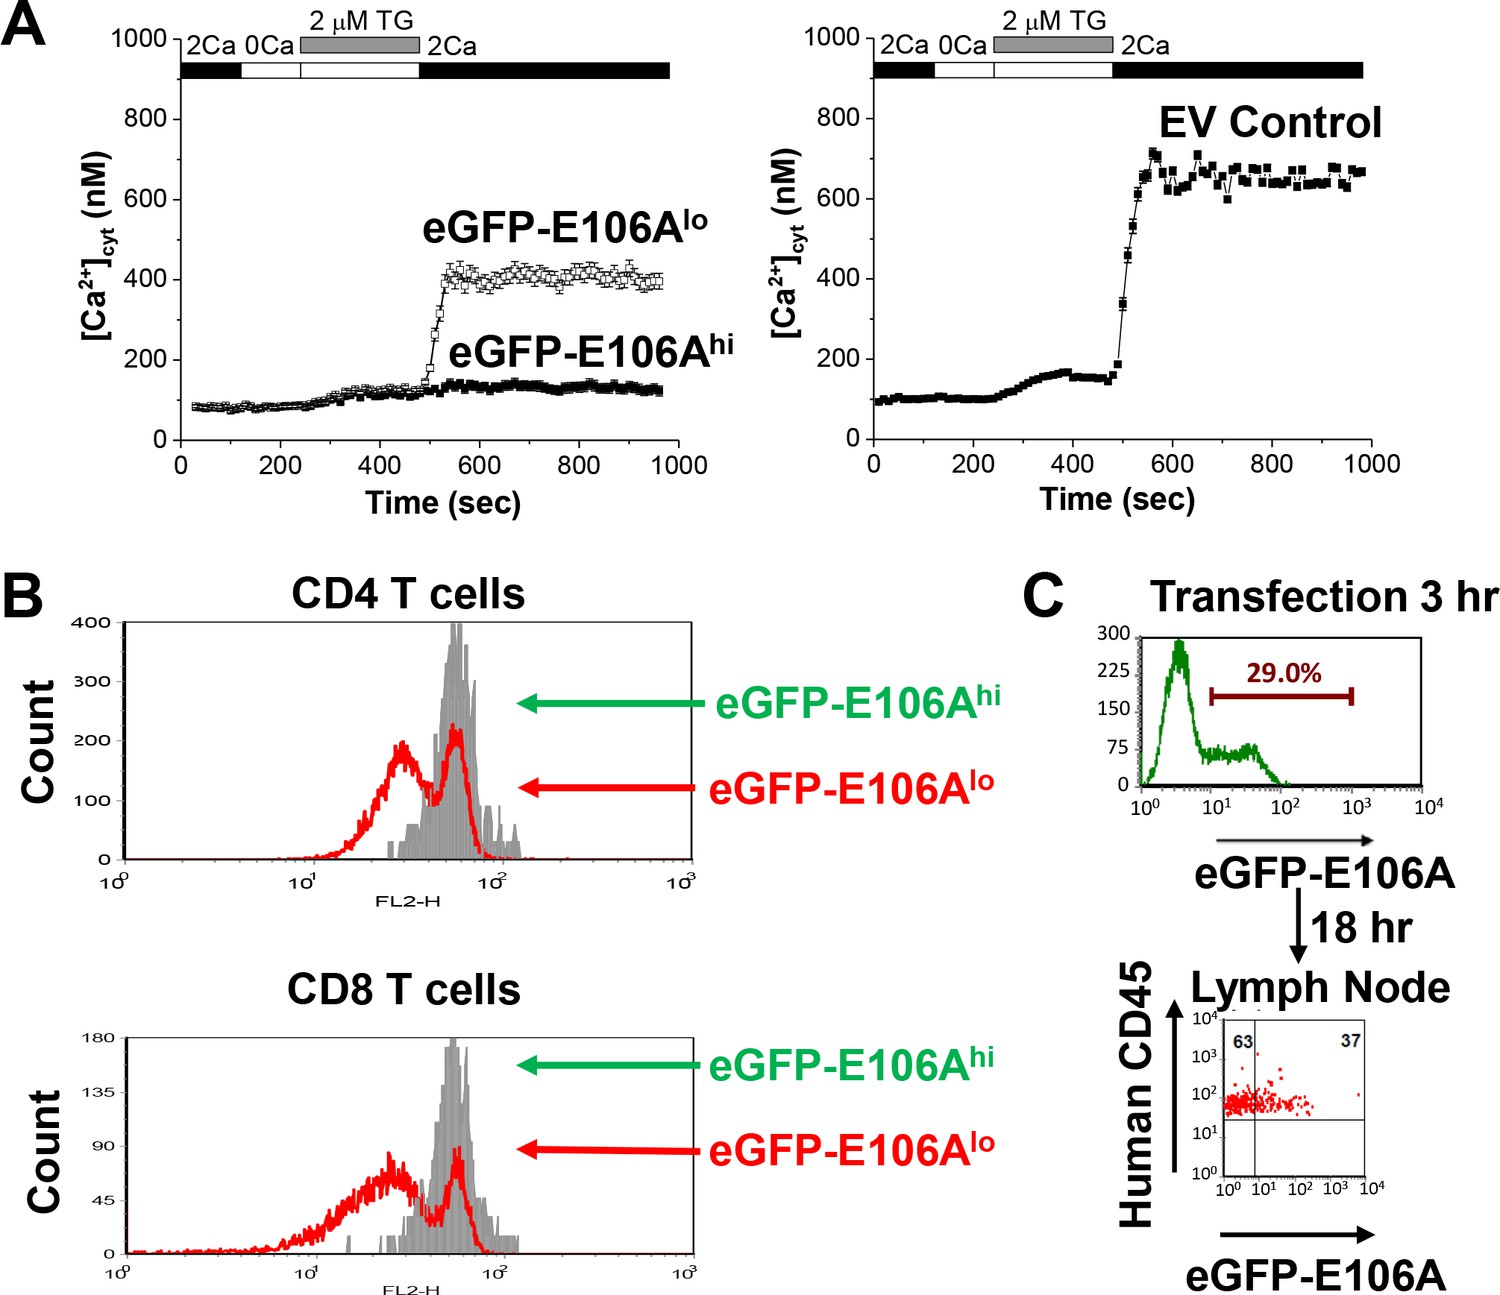
Effects of expressing Orai1-E106A on human T cells.
(A) Averaged thapsigargin-induced Ca2+ entry, measured by fura-2, in activated human CD4+ T cells transfected with eGFP-Orai1-E106A (left) or empty vector control (EV, right, n = 133 cells); eGFP-E106A transfected cells were grouped into two populations, either eGFP-E106Ahi with high eGFP fluorescence (solid squares, n = 43 cells) or eGFP-E106Alo with no detectable eGFP fluorescence (empty squares, n = 115 cells); bars represent SEM. (B) Primary human CD4+ and CD8+ T cells were transfected with eGFP-E106A, then uniformly labeled with the fluorescent cell tracker dye CMTMR and co-cultured with SEB-pulsed primary human dendritic cells from the same donor; proliferation was assessed after 72 hr by CMTMR dilution as measured by flow cytometry. (C) Human CD3+ T cells were transfected with eGFP-E106A and expression level was measured 3 hr post-transfection before adoptive transfer into reconstituted NOD.SCI.β2 mice; cells were recovered from lymph nodes 18 hr later and eGFP fluorescence was used to measure homing to lymph nodes.
Figure 1—figure supplement 1
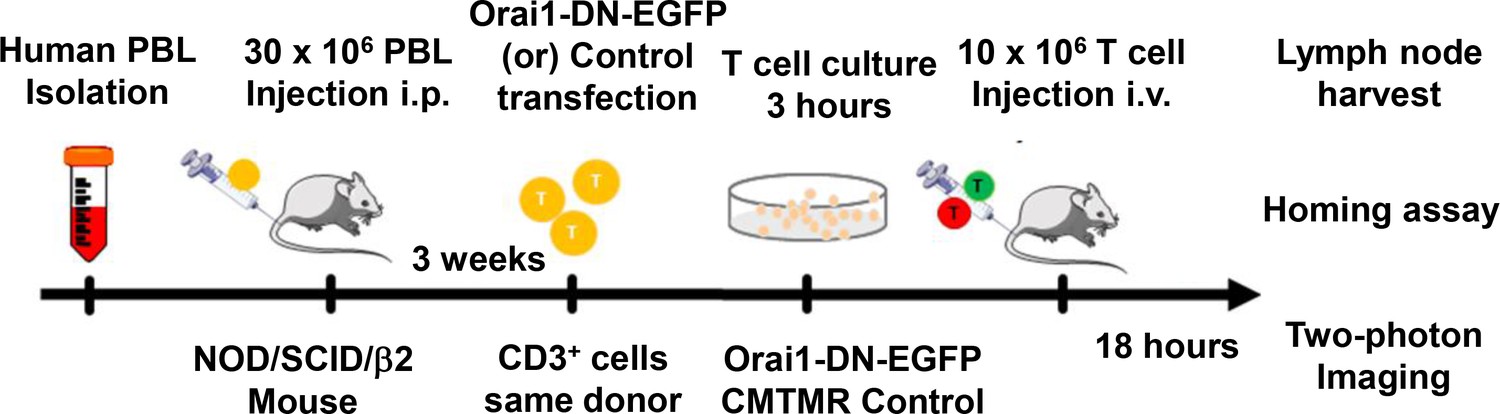
Protocol for homing and two-photon imaging of transfected human CD3+ T cells in reconstituted NOD.SCID.β 2 mouse lymph node.
https://doi.org/10.7554/eLife.27827.004
Figure 2
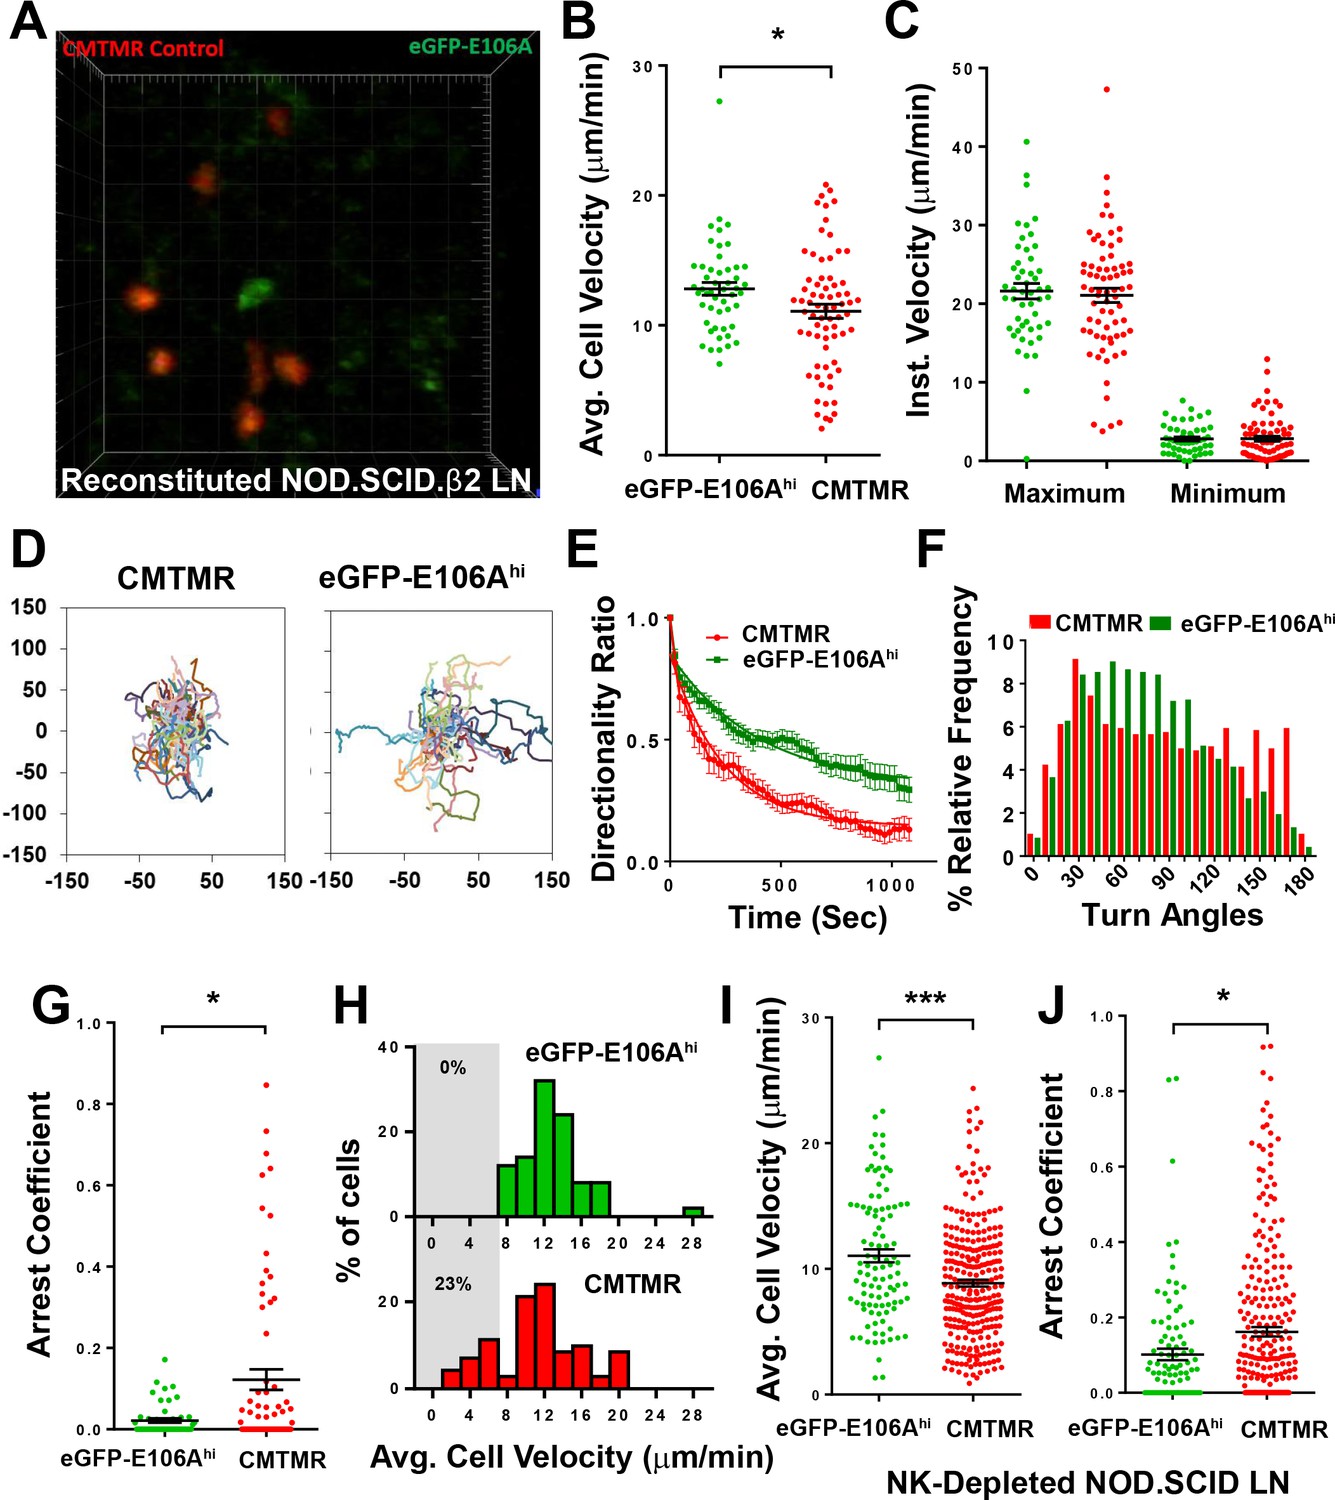
Orai1 block increases human T cell motility within reconstituted NOD.SCID.β2 lymph nodes.
(A) Two-photon microscopy of migrating human T cells, showing eGFP-E106A transfected cells in green and CMTMR-labeled mock transfected cells in red, within intact mouse lymph node 18 hr after adoptive co-transfer of 5 × 10⁶ of each cell type. (B) Average cell velocities of eGFP-E106Ahi (n = 50) versus CMTMR-labeled control (n = 71) T cells; bars represent mean ± SEM, data from independent experiments using four different donors (12.8 ± 0.5 µm/min vs. 11.1 ± 0.5 µm/min for E106Ahi vs CMTMR cells, p=0.0268). (C) Maximum and minimum cellular instantaneous velocities of eGFP-E106Ahi (green) versus CMTMR-labeled (red) control T cells. (Hodges-Lehmann median difference of −0.21 µm/min, −2.82 to 2.16 µm/min 95% confidence interval for maximum velocity and −0.36 µm/min, −1.02 to 0.36 µm/min 95% confidence interval for minimum velocity) (D) Superimposed tracks with their origins normalized to the starting point. Cells were tracked for more than 20 min. n = 111 (CMTMR), n = 58 (eGFP-E106Ahi) (E) Directionality ratio (displacement/distance) over elapsed time. For Orai1-blocked cells in green, tau = 397 s; vs CMTMR controls in red, tau = 238 s, n = 49 time points. (F) Histogram of turn angles in eGFP-E106Ahi (green) and CMTMR controls (red). Mean ± SEM, 74.5 ± 1.0 degrees for Orai1 blocked cells vs 86.5 ± 1.5 degrees for CMTMR controls, p=0.0001, two-tailed T test. (G) Arrest coefficients of eGFP-E106Ahi compared with CMTMR-labeled control T cells, defined as fraction of time with instantaneous velocity <2 µm/min. (For Orai1-blocked cells in green, 0.02 ± 0.01; vs. CMTMR controls in red, 0.12 ± 0.03, p=0.0406) (H) Frequency distribution of average cell velocities for eGFP-E106Ahi (top) and CMTMR-labeled control T cells (bottom), cells with average velocity <7 µm/min are highlighted in gray; tick marks denote the center of every other bin. (I,J) Average cell velocities (I) and arrest coefficients (J) of eGFP-E106Ahi (green, n = 102) vs CMTMR-labeled control (red, n = 278) human T cells in NK-cell-depleted immunodeficient mouse lymph nodes. Average cell velocities: 11.0 ± 0.5 µm/min vs. 8.8 ± 0.3 µm/min, p=0.0004; Arrest coefficients: 0.10 ± 0.02 vs. 0.16 ± 0.01, p=0.0516 for E106Ahi vs CMTMT cells; bars represent mean ± SEM, data from independent experiments using eight different donors, ***p<0.005.
Figure 3

Orai1 block reduces frequency of pausing during human T cell motility in vitro.
(A,B) Confocal microscopy of eGFP-E106A transfected human CD4+ T cells in microfabricated channels 7 µm high by 8 µm wide, showing two individual eGFP-E106Ahi T cells (A) and two eGFP-E106Alo T cells (B), each circled in red in the first frame; individual images taken 1 min apart, scale bar = 10 µm. (C) Comparison of average cell velocities of eGFP-E106A transfected T cells (eGFP-E106Ahi cells in green, n = 102; eGFP-E106Alo cells in gray, n = 131; 14.2 ± 0.6 µm/min vs. 10.9 ± 0.5 µm/min, p<0.0001 for E106Ahi vs E106Alo cells) and eGFP-Orai1 transfected control T cells (eGFP-Orai1hi cells in green, n = 43; eGFP-Orai1lo cells in gray, n = 76; 10.7 ± 0.8 µm/min vs. 10.5 ± 0.8 µm/min for Orai1hi vs Orai1lo cells; Hodges-Lehmann median difference of −0.84 µm/min, −2.96 to 1.28 µm/min 95% CI); bars represent mean ± SEM, data from independent experiments using five different donors. (D) Frequency distribution of average cell velocities of eGFP-E106Ahi (top) and eGFP-E106Alo (bottom) human T cells, cells with average velocity <7 µm/min are highlighted in gray; tick marks denote the center of every other bin. (E) Arrest coefficients of eGFP-E106Ahi vs eGFP-E106Alo human T cells, defined as fraction of time each individual cell had an instantaneous velocity <2 µm/min (0.05 ± 0.01 vs. 0.08 ± 0.01 for E106Ahi vs E106Alo cells, p=0.0015). (F) Variance in velocity of eGFP-E106Ahi vs eGFP-E106Alo human T cells, coefficient of variation is calculated by standard deviation divided by the mean of instantaneous velocity for each individual cell (39.5 ± 1.9% vs. 45.1 ± 1.6% for E106Ahi vs E106Alo cells, p=0.0138). (G) Duration of pauses for eGFP-E106Ahi vs eGFP-E106Alo human T cells (Hodges-Lehmann median difference of 0 s, −8.43 to 4.71 s 95% CI for E106Ahi vs E106Alo cells); bars represent mean ± SEM, *p<0.05, **p<0.01, ***p<0.005, ****p<0.001.
Figure 4
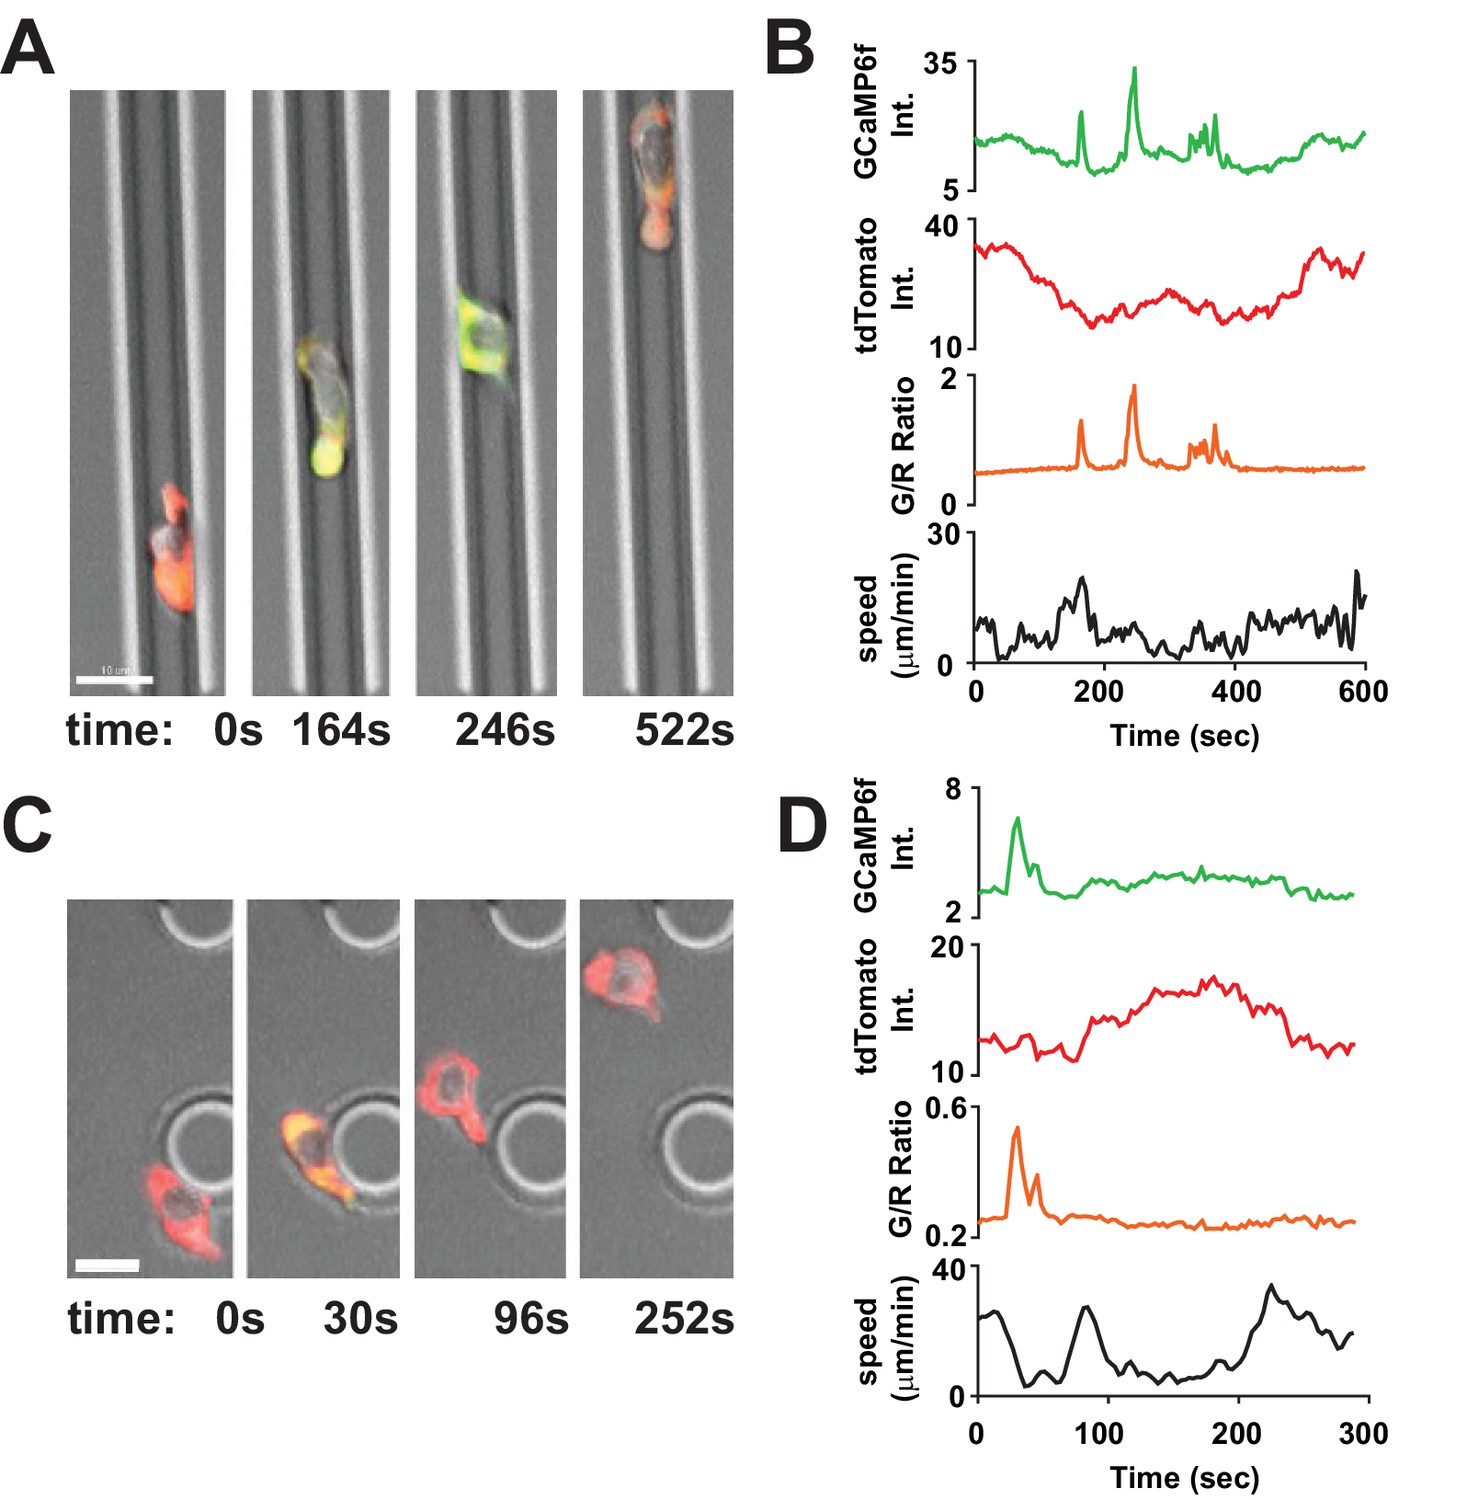
Tracking Ca2+signals in human T cells in vitro with Salsa6f.
(A,C) Confocal microscopy of Salsa6f transfected human CD4+ T cells in ICAM-1 coated microchannels 7 µm high by 8 µm wide (A, Video 1) and open space (C, Video 2), showing merged red (tdTomato), green (GCaMP6f), and DIC channels; circular structures shown in (C) are support pillars part of the PDMS chamber; scale bar = 10 µm, time = s. (B,D) Total intensity tracings of GCaMP6f (green) and tdTomato (red) fluorescence, G/R ratio (orange), and speed (black), for corresponding T cells shown in (A) and (C); data representative of independent experiments from three different donors.
Figure 5 with 1 supplement
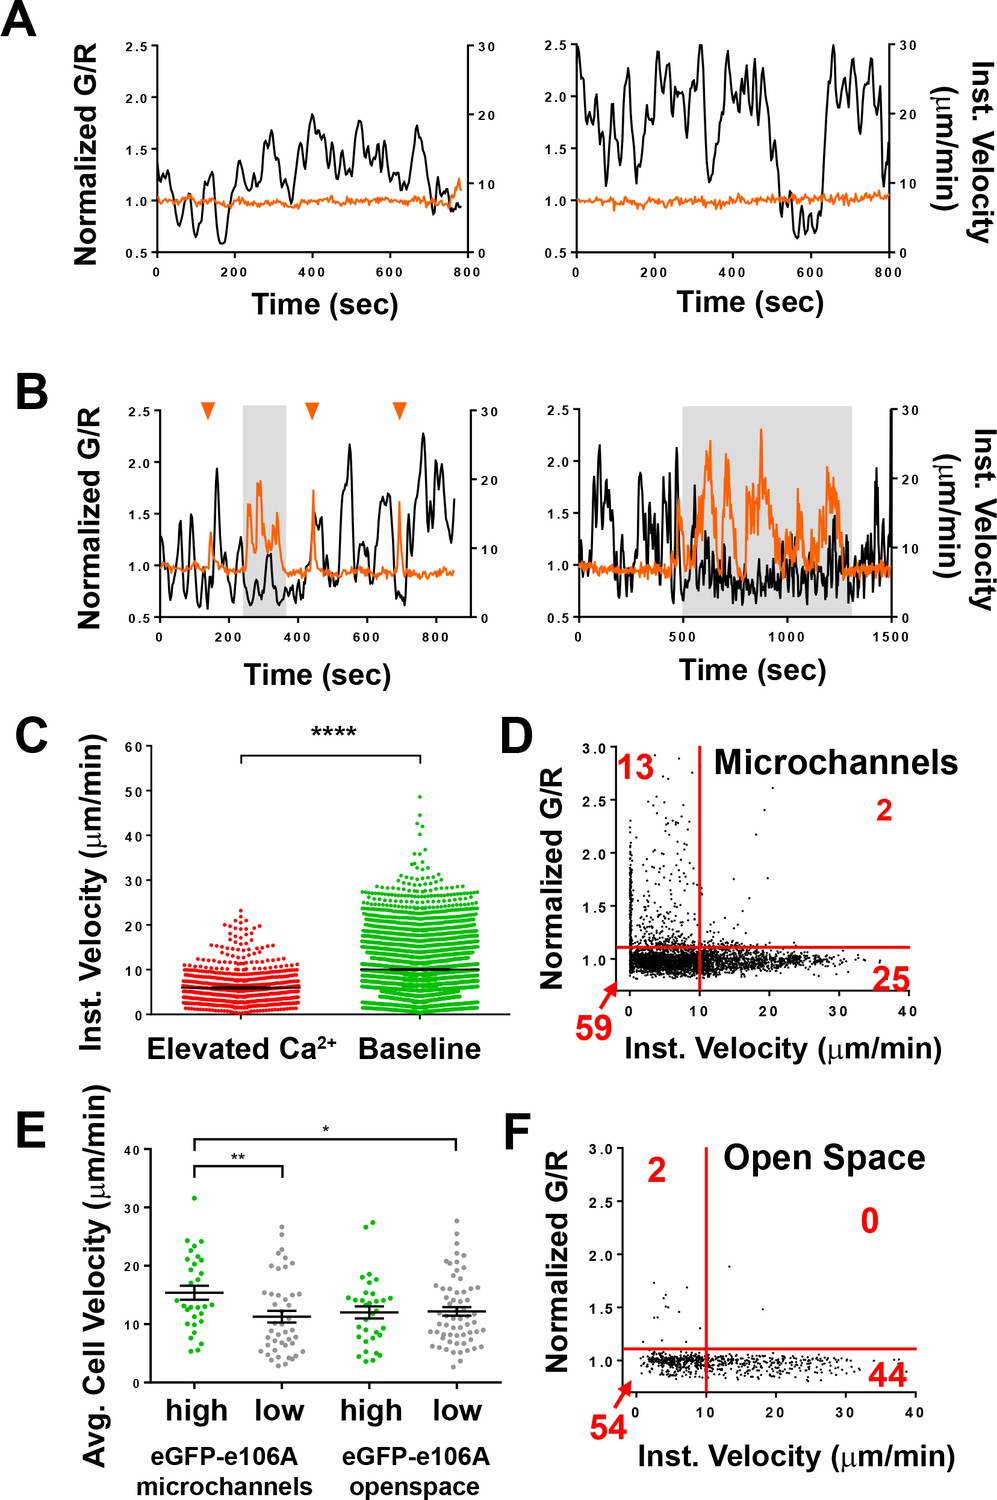
Spontaneous Ca2+signals during human T cell motility in vitro are correlated with reduced velocity.
(A,B) Sample tracks from Salsa6f-transfected human T cells in microchannels, with intracellular Ca2+ levels as G/R ratios for each time point, normalized to zero-time (orange), overlaid with instantaneous cell velocity (black), cells in (A) have stable Ca2+ levels, cells in (B) show brief Ca2+ transients (arrowheads) or sustained Ca2+ signaling (gray highlights). (C) Instantaneous velocity of Salsa6f-transfected human T cells in microchannels during elevated cytosolic Ca2+ levels (red) and during basal Ca2+ levels (green); n = 22 cells, data from independent experiments using three different donors; ****p<0.001. (D) Scatter plot of Salsa transfected human T cells in microchannels, instantaneous cell velocity versus normalized G/R ratio for each individual time point analyzed; red numbers in each quadrant show percent of time points, split by 1.10 normalized G/R ratio and 10 µm/min; n = 4081 points. (E) Mean track velocity of eGFP-E106A-transfected human T cells, comparing eGFP-E106Ahi (green) and eGFP-E106Alo T cells (gray) in confined microchannels vs open space; n = 30, 44, 33, and 62 cells, respectively (15.4 ± 1.2 µm/min vs. 11.3 ± 1.0 µm/min for E106Ahi vs E106Alo cells in microchannels; p=0.0099 and 12.0 ± 1.0 µm/min vs. 12.2 ± 0.7 µm/min for E106Ahi vs E106Alo cells in open space; Hodges-Lehmann median difference of 0.15 µm/min, −2.46 to 2.40 µm/min 95% CI). Bars represent mean ± SEM, data from independent experiments using two different donors, *p<0.05, **p<0.01. (F) Scatter plot of Salsa transfected human T cells in open space, instantaneous cell velocity versus GCaMP6f/tdTomato R/R0 for each individual time point analyzed; red numbers in each quadrant show percent of cells, split by 1.10 normalized G/R ratio and 10 µm/min; n = 723 points.
Figure 5—figure supplement 1
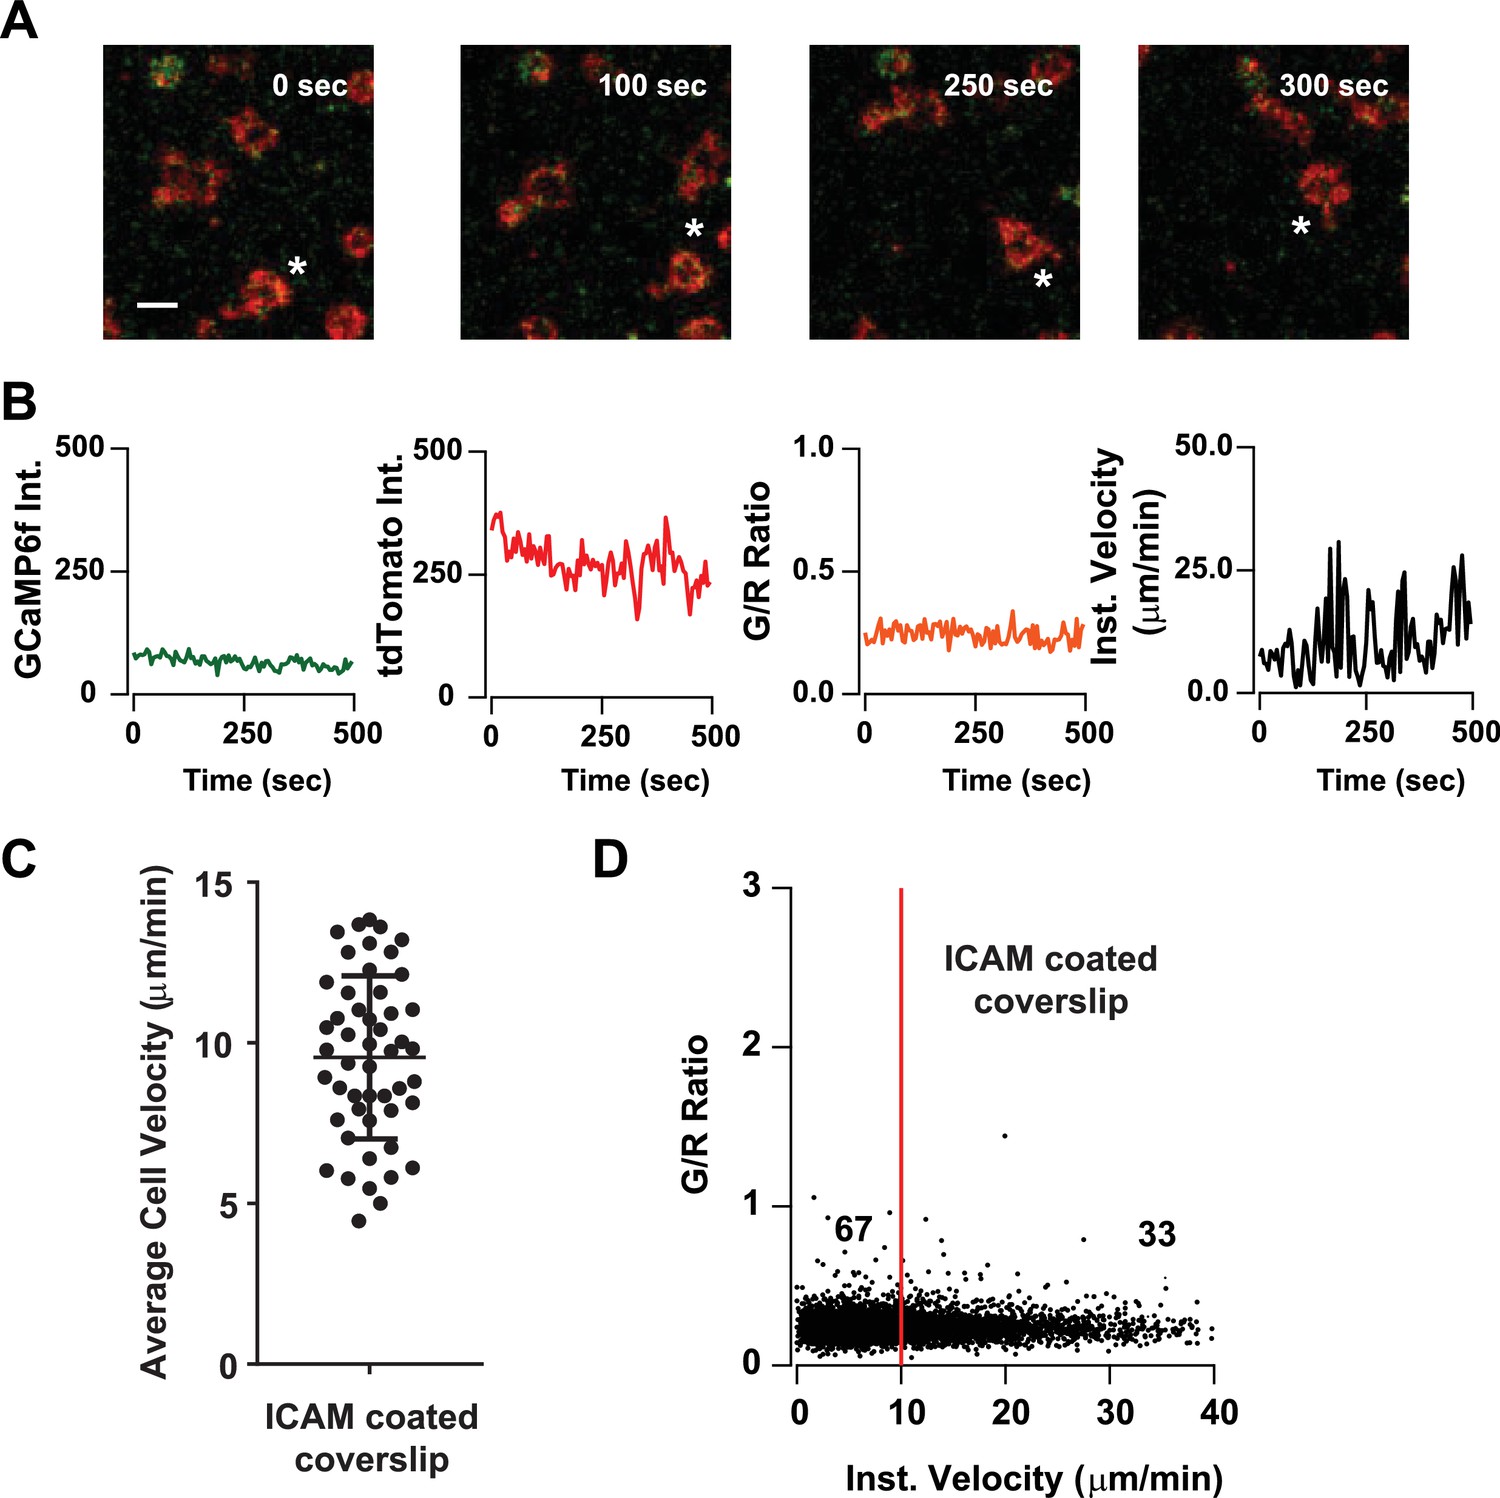
Tracking cell motility and Ca2+signals in Cd4-Salsa6f T cells on ICAM coated coverslips.
(A) Confocal microscopy of Cd4-Salsa6f (Het) Th1 cells on open-field ICAM-1-coated coverslips showing merged red (tdTomato) and green (GCaMP6f) channels at three different time points. Scale bar 10 μm. * indicates movement of one cell. (B) Recordings of GCaMP6f (green), tdTomato (red) fluorescence, G/R ratio (orange), and speed (black), for corresponding T cell shown in (A). (C) Average cell velocities of Cd4-Salsa6f Th1 cells on 5 μg/ml ICAM-1-coated coverslips (n = 52 cells, two independent experiments). (D) Scatter plot showing instantaneous cell velocity versus GCaMP6f/tdTomato (G/R) ratio for each individual time point analyzed; numbers show percent of time points, split by 10 µm/min, as in Figure 8D,F; n = 5289 points.
Figure 6
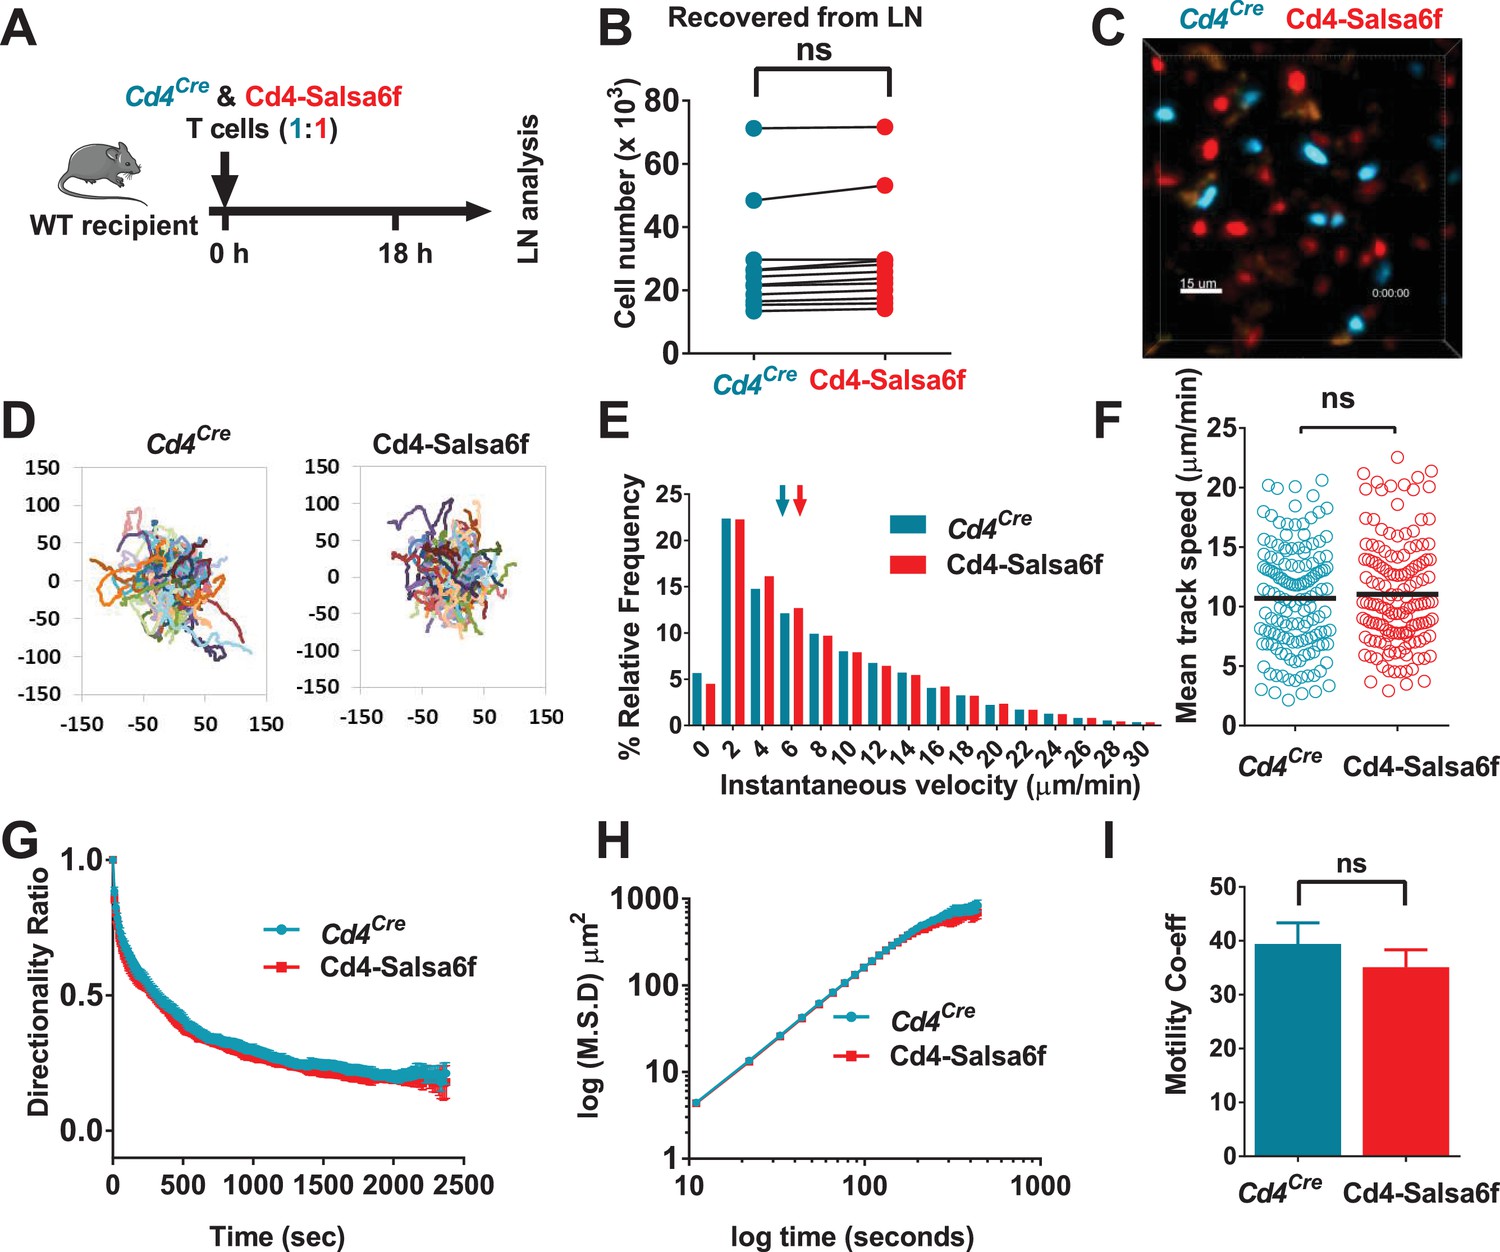
Motility of Salsa6f T cells in lymph node following adoptive transfer.
Cd4Cre and Cd4-Salsa6f (Hom) cells are shown in teal and in red, respectively. (A) Experimental design to characterize homing and motility of Cd4-Salsa6f cells. CTV-labeled Cd4Cre cells and CTY-labeled Cd4-Salsa6f cells (1:1) were adoptively transferred into wildtype mice, 18 hr prior to LN harvesting. (B) Paired numbers of CTV+ and CTY+ cells recovered from lymph nodes (p=0.65, Mann Whitney test). (C) Representative median filtered, maximum intensity projection image showing simultaneously imaged Cd4Cre and Cd4-Salsa6f cells the lymph node, scale bar = 30 µm. See Video 3. (D) Superimposed tracks with their origins normalized to the starting point. Cells were tracked for more than 20 min. n = 140. (E) Frequency distribution of instantaneous velocities; arrows indicate median, tick marks at the center of every other bin (n > 14,800, three independent experiments). (F) Scatter plot showing mean track speed, black bars indicate overall mean values (11.1 ± 0.4 and 10.7 ± 0.4 µm/min, for Cd4Cre and Cd4-Salsa6f cells respectively, p=0.69; n = 140). (G) Directionality ratio (displacement/distance) over elapsed time (tau = 461 s for Cd4Cre in teal; tau = 474 s for Cd4-Salsa6f in red. n = 217 time points). (H) MSD vs time, plotted on a log-log scale. (I) Measured motility coefficient from 140 tracks (35.1 ± 3.2 vs 39.4 ± 3.9 µm2/min for Cd4Cre and Cd4-Salsa6f cells, p=0.65).
Figure 7

Suppression of motility during spontaneous Ca2+transients.
(A) Median filtered, maximum intensity projection showing cytosolic labeling (exclusion of Salsa6f from the nucleus) in adoptively transferred Cd4-Salsa6f (Hom) cells (red) in the lymph node of wild-type recipients. Autofluorescent structures appear as yellow bodies. Scale bar = 20 µm. See Video 4. (B) Scatterplot of instantaneous 3D velocity vs ratio of GCaMP6f (green) to tdTomato (red) fluorescence intensity (r = −0.24, Spearman's rank correlation, p<0.0001, n = 4490 pairs). (C) Image sequence showing a migrating T cell and calcium transient from (A). Top row: TdTomato signal is shown in grayscale, overlaid with GCaMP6f signals in green. Scale bar = 10 µm. (Video 5). Center row: Heat map of Green/Red ratios matched to corresponding images in the top row. Arrows indicate local Ca2+ transient. Bottom row: inverted bar graph showing corresponding instantaneous 3D velocities. Asterisk marks a pause in cell motility. (D) Representative track from Cd4-Salsa6f (Hom) T cells in lymph nodes, showing intracellular Ca2+ levels measured by G/R ratio (orange) on left Y-axis and instantaneous 3D velocity (gray) on right Y-axis. (E) Averaged time course of the instantaneous 3D velocity (gray trace, right Y-axis) aligned by the corresponding rise in Salsa6f G/R ratio (orange, left Y-axis). The velocity minimum at time = 5 s-is significantly lower than a baseline from −30 to −10 s (p<0.0001 two-tailed T-test, n = 39 cells).
Figure 8
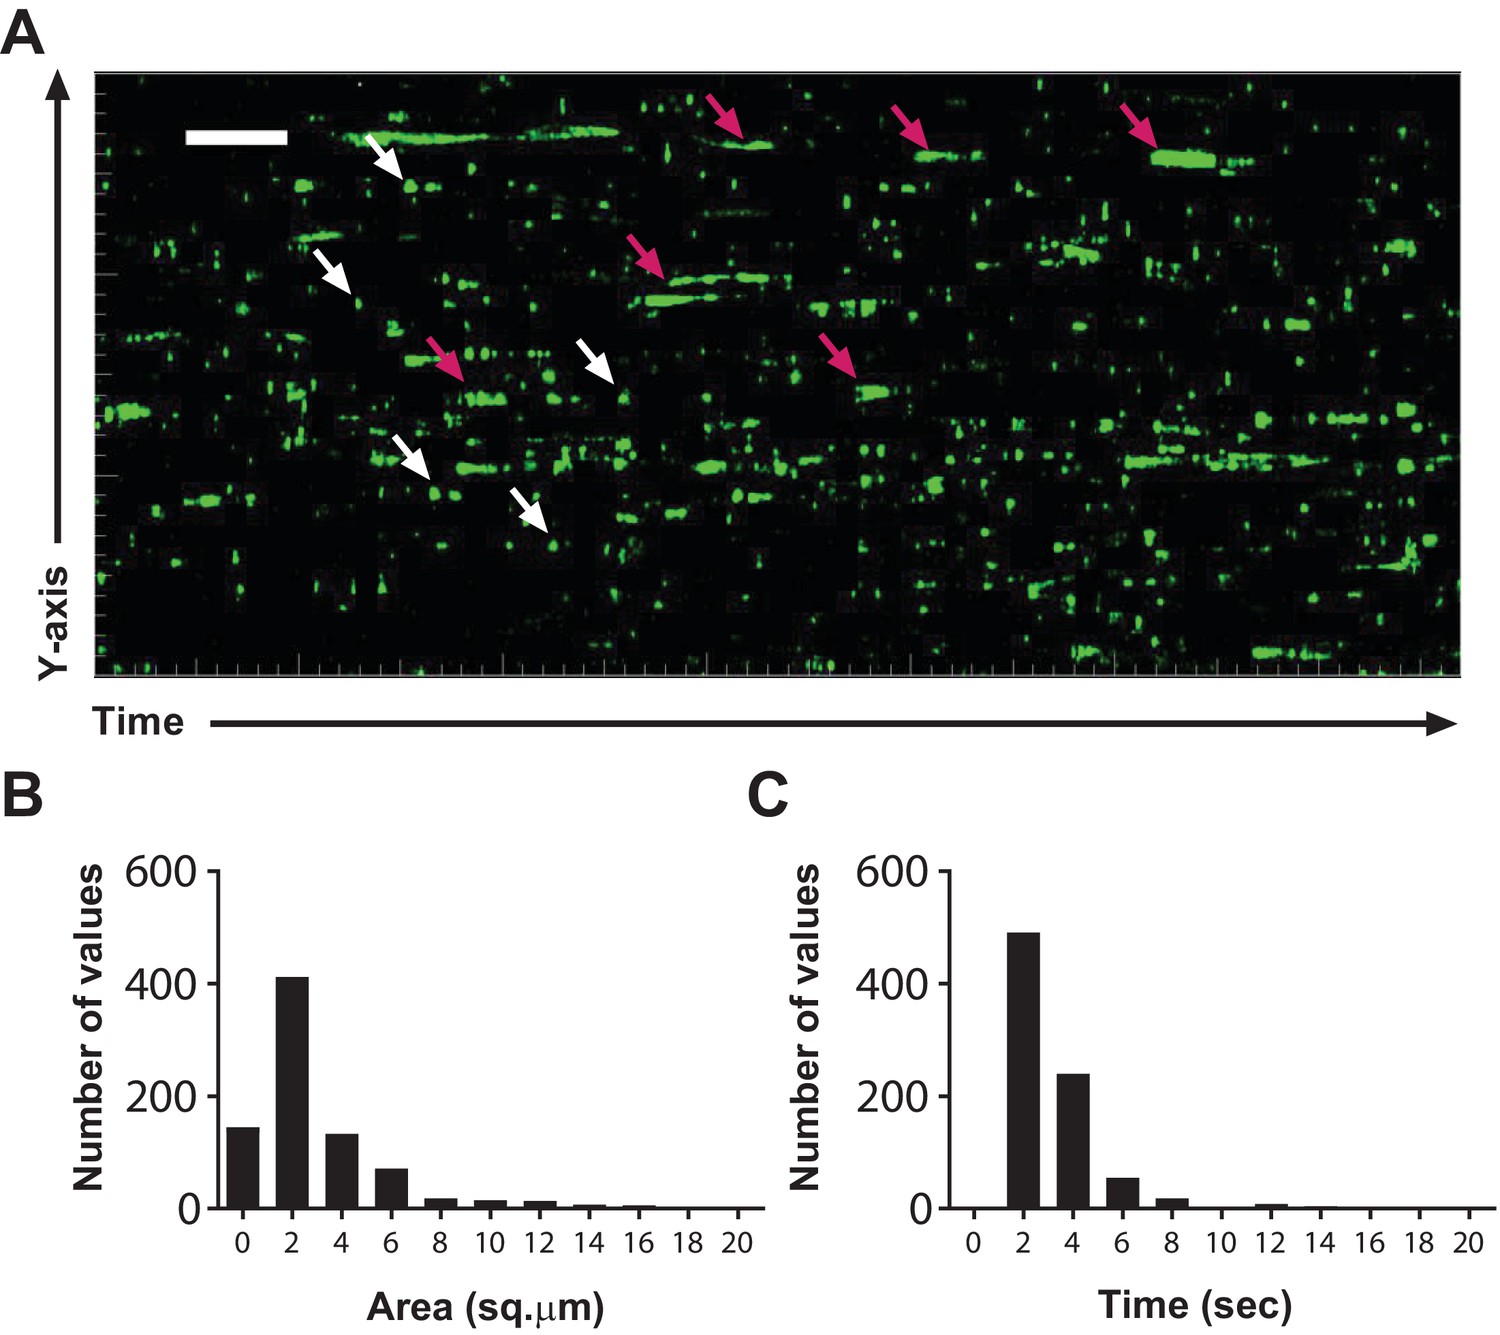
T cell Ca2+transients in the steady-state lymph node.
(A) Calcium history map of steady-state lymph node. Maximum intensity YT projection of 1200 processed green channel time points showing localized sparkles (white arrows) and cell-wide global Ca2+ transients (magenta arrows). Scale bar = 50 µm along Y axis, 50 s along T axis. See Video 6. (B) Frequency distribution of the area of local Ca2+ signals. (C) Frequency distribution of the duration of local Ca2+ signals.
Figure 9
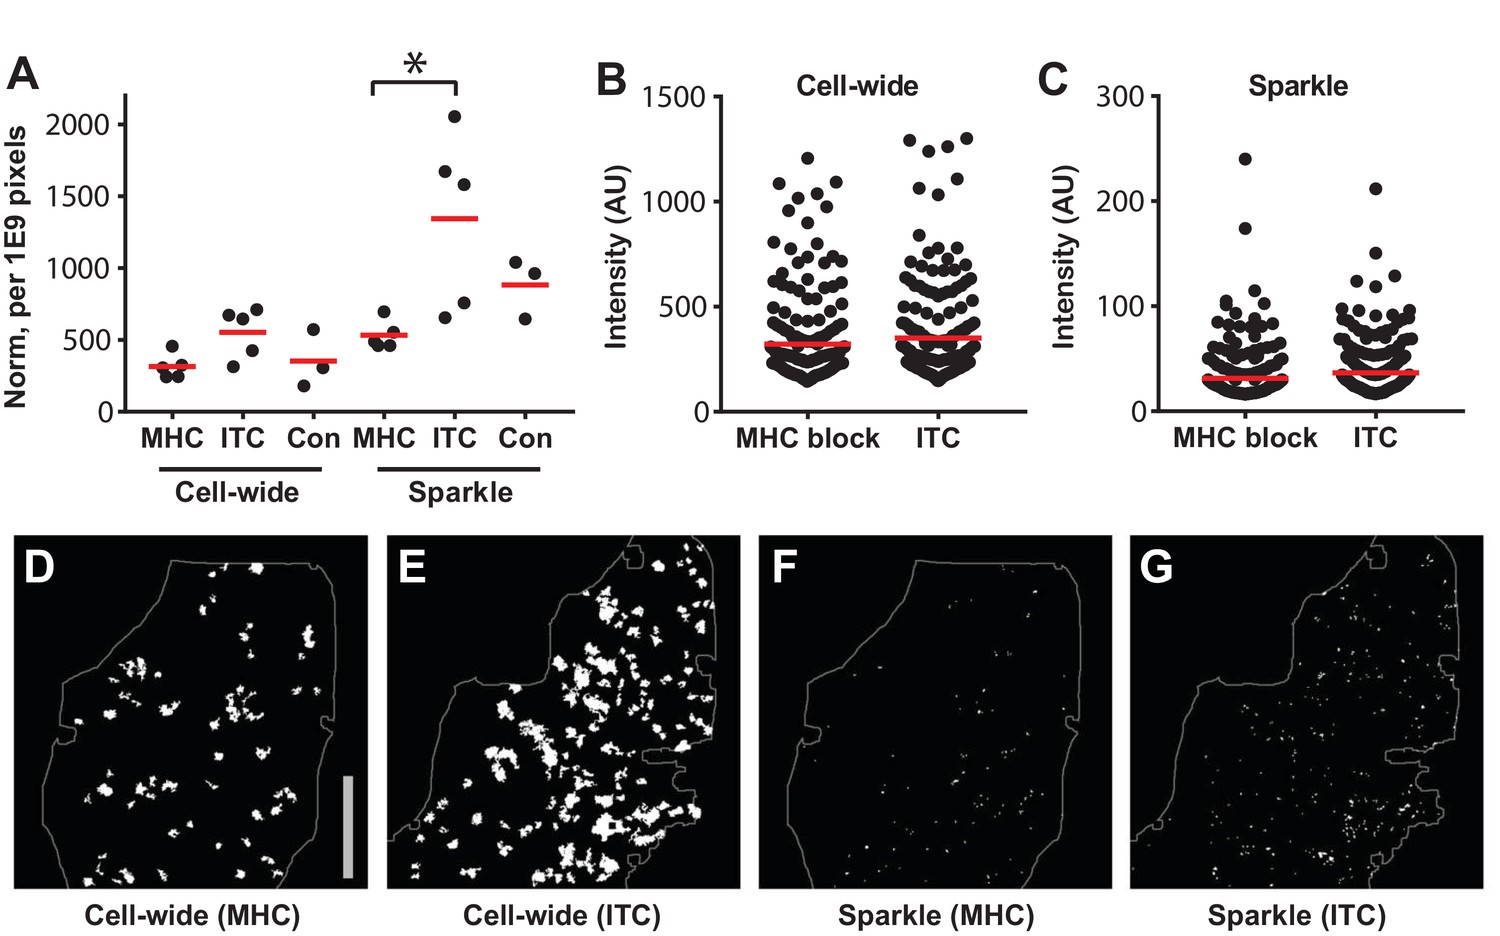
MHC block and Ca2+transients in steady state lymph nodes.
(A) The frequency of cell-wide and local (sparkles) Ca2+ transients in CD-Salsa6f (Hom) lymph nodes 48 hr after injection of MHC class I and II blocking antibodies (MHC), isotype control antibody (ITC), or no antibody (Con). Red bars indicate mean values. For MHC-blocked compared to ITC, the relative event frequencies were: for cell-wide, 314 ± 38 vs 553 ± 77, mean ± SEM, p=0.06; for sparkles, 532 ± 44 vs 1343 ± 272, mean ± SEM, p=0.02, Mann-Whitney test. (B,C) Integrated green channel intensities of Ca2+ transients normalized to SD of green channel for cell-wide events (B) and for sparkles (C). Red bars indicate mean values. For MHC-blocked vs ITC, the relative amplitudes were: for cell-wide (B), 321 ± 14 vs 350 ± 15, mean ± SEM; for sparkles (C), 32 ± 2 vs 37 ± 2, mean ± SEM. (D–G) Representative thresholded images showing cell-wide and local Ca2+ transients, 48 hr after treatment with anti MHC I and II or ITC antibody. The area of the imaging field analyzed is indicated. Scale bar = 100 μm.
Videos
Video 1
Salsa6f-transfected human T cell in confined microchannel.
Merged red (tdTomato), green (GCaMP6f), and DIC channels; scale bar = 10 µm, time shown in hr:min:s. This video corresponds to Figure 4A.
Video 2
Salsa6f transfected human T cells in open microchamber, with merged red (tdTomato), green (GCaMP6f), and DIC channels, circular structures are support pillars part of the PDMS microchamber; scale bar = 10 µm, time shown in hr:min:s.
This video corresponds to Figure 4C.
Video 3
Motility of Cd4-Salsa6f T cells in lymph node following adoptive transfer.
Cd4Cre and Cd4-Salsa6f cells and their trails are shown in teal and in red, respectively. Autofluorescent bodies appear as faint stationary yellow structures. Images were acquired at ~11 s interval. Playback speed = 50 frames per second; time shown in hr:min:sec. Video corresponds to Figure 6C.
Video 4
Calcium signals in adoptively transferred Cd4-Salsa6f T cells.
Red signal from tdTomato expression in cytosol facilitates identification and tracking of cells; green GCaMP6f signal detects elevation of Ca2+. Autofluorescent structures appear as stationary yellow bodies. Movie is paused at frame 323, zoomed in to emphasize two examples of Ca2+ transients and an autofluorescent body. Images were acquired at 5 s interval. Major tick marks at 20 µm. Playback speed = 50 frames/s, time shown in hr:min:s. Video corresponds to Figure 7A.
Video 5
A brief Ca2+signal filling the back of a moving adoptively transferred Salsa6f (Hom) T cell.
Left: composite of red tdTomato fluorescence pseudocolored grayscale with green GCaMP6f fluorescence. Right: Corresponding Green/Red ratios, masked to red channel as in Figure 7C. Images acquired at 1 frame every 5 s and 0.5 microns/pixel. Playback speed = 3 frames per second. 0.5 μm/pixel. Video corresponds to Figure 7C.
Video 6
Calcium transients in steady state lymph nodes.
Cd4-Salsa6f (Hom) lymph node imaged at 0.5 s interval, processed to visualize Ca2+ transients (sparkles and cell-wide) in green. Red channel is turned off after beginning to facilitate viewing of Ca2+ transients. Autofluorescent structures appear as stationary green bodies. Playback speed = 100 frames/s. time shown in hr:min:s. Video corresponds to Figure 8A
Tables
Key resources table
| Reagent type (species) or resource | Designation | Source or reference | Identifiers | Additional information |
|---|---|---|---|---|
| recombinant DNA reagent | Salsa6f | Dong et al (doi: 10.7554/eLife. 32417) | ||
| strain, strain background (mouse) | Cd4-Salsa6f (Het), Cd4-Salsa6f (Hom) | Dong et al (doi: 10.7554/eLife. 32417) | ||
| strain, strain background (mouse) | NOD.Cg-PrkdcscidB2mtm1Unc/J (NOD.SCID.β2) | Jackson #002570 | ||
| strain, strain background (mouse) | NOD.CB17-Prkdcscid/J (NOD.SCID) | Jackson #001303 | ||
| strain, strain background (mouse) | Cd4Cre | Jackson #017336 | ||
| strain, strain background (mouse) | C57BL/6J | Jackson #000664 | ||
| transfected construct (synthetic) | eGFP-Orai1-E106A, eGFP-Orai1 | 23455504 | ||
| biological sample (human) | Primary T cells from healthy human subjects | UCI | IRB approved | |
| antibody | anti-MHC II (Clone Y3P), anti-MHC I (Clone AF6-88.5.5.3), IgG2a Isotype control (Clone: C1.18.4) | BioXCell | ||
| antibody | anti-NK cell antibody | Wako Chemicals | ||
| antibody | αCD3 and αCD28 | Tonbo Biosciences | ||
| peptide, recombinant protein | recombinant human ICAM | R&D Systems | ||
| peptide, recombinant protein | recombinant human IL-2 | BioLegend | ||
| commercial assay or kit | EasySep human T Cell Isolation Kit | Stemcell Technologies | ||
| commercial assay or kit | EasySep mouse T Cell Isolation Kit | Stemcell Technologies | ||
| commercial assay or kit | Nucleofection kit | Lonza | ||
| commercial assay or kit | Sylgard Elastomer 184 kit | Dow Corning | ||
| chemical compound, drug | Cell tracker CMTMR, CellTrace Yellow or CellTrace Violet | Life Technologies | ||
| software, algorithm | Imaris | Bitplane |
Additional files
-
Transparent reporting form
- https://doi.org/10.7554/eLife.27827.020
Download links
A two-part list of links to download the article, or parts of the article, in various formats.
Downloads (link to download the article as PDF)
Open citations (links to open the citations from this article in various online reference manager services)
Cite this article (links to download the citations from this article in formats compatible with various reference manager tools)
Intermittent Ca2+ signals mediated by Orai1 regulate basal T cell motility
eLife 6:e27827.
https://doi.org/10.7554/eLife.27827


