Using mobile phones as acoustic sensors for high-throughput mosquito surveillance
- Stanford University, United States
Figures
Figure 1 with 2 supplements

Mobile phone users can collect acoustic data from mosquitoes characterized by the base frequency and harmonics.
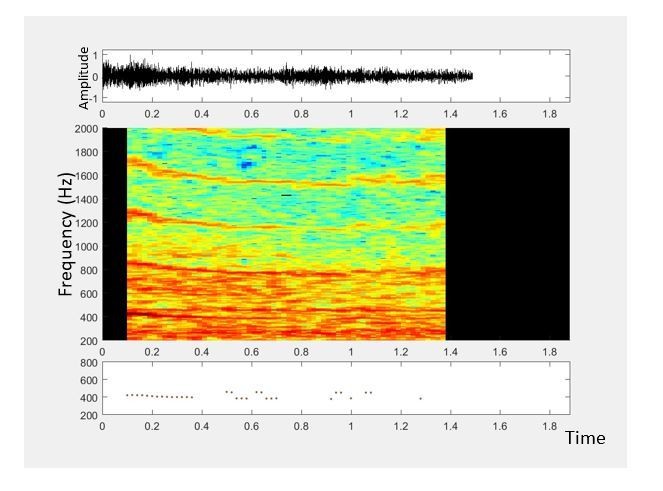
(A) Illustration showing the collection of mosquito acoustic data by mobile phone users in different locations. (B) Techniques to acquire wingbeat sounds from mosquitoes using mobile phones include lab methods like (i) collecting them in cages, and field methods like (ii) following mosquitoes in free-flight, or (iii) capturing them in cups, bottles or inflated bags. (C) Spectrogram for a flight trace acquired from an individual female Anopheles gambiae mosquito using a 2006 model Samsung SGH T-209 flip phone. The wingbeat frequency at every instant is computationally identified and marked with a black line. (Top) The time-averaged spectrum of this flight trace shows the distribution of acoustic power among the base frequency and multiple harmonics. (D) The variations in wingbeat frequency of the mosquito during this flight trace are represented by a probability distribution of the frequency identified in each window of the spectrogram. (Top) Raw wingbeat frequency data are represented as a violin plot with an overlaid box plot marking the inter-quartile range, black circle representing mean frequency, gray vertical bar for median frequency, and whiskers indicating 5th and 95th quantiles.
Figure 1—figure supplement 1
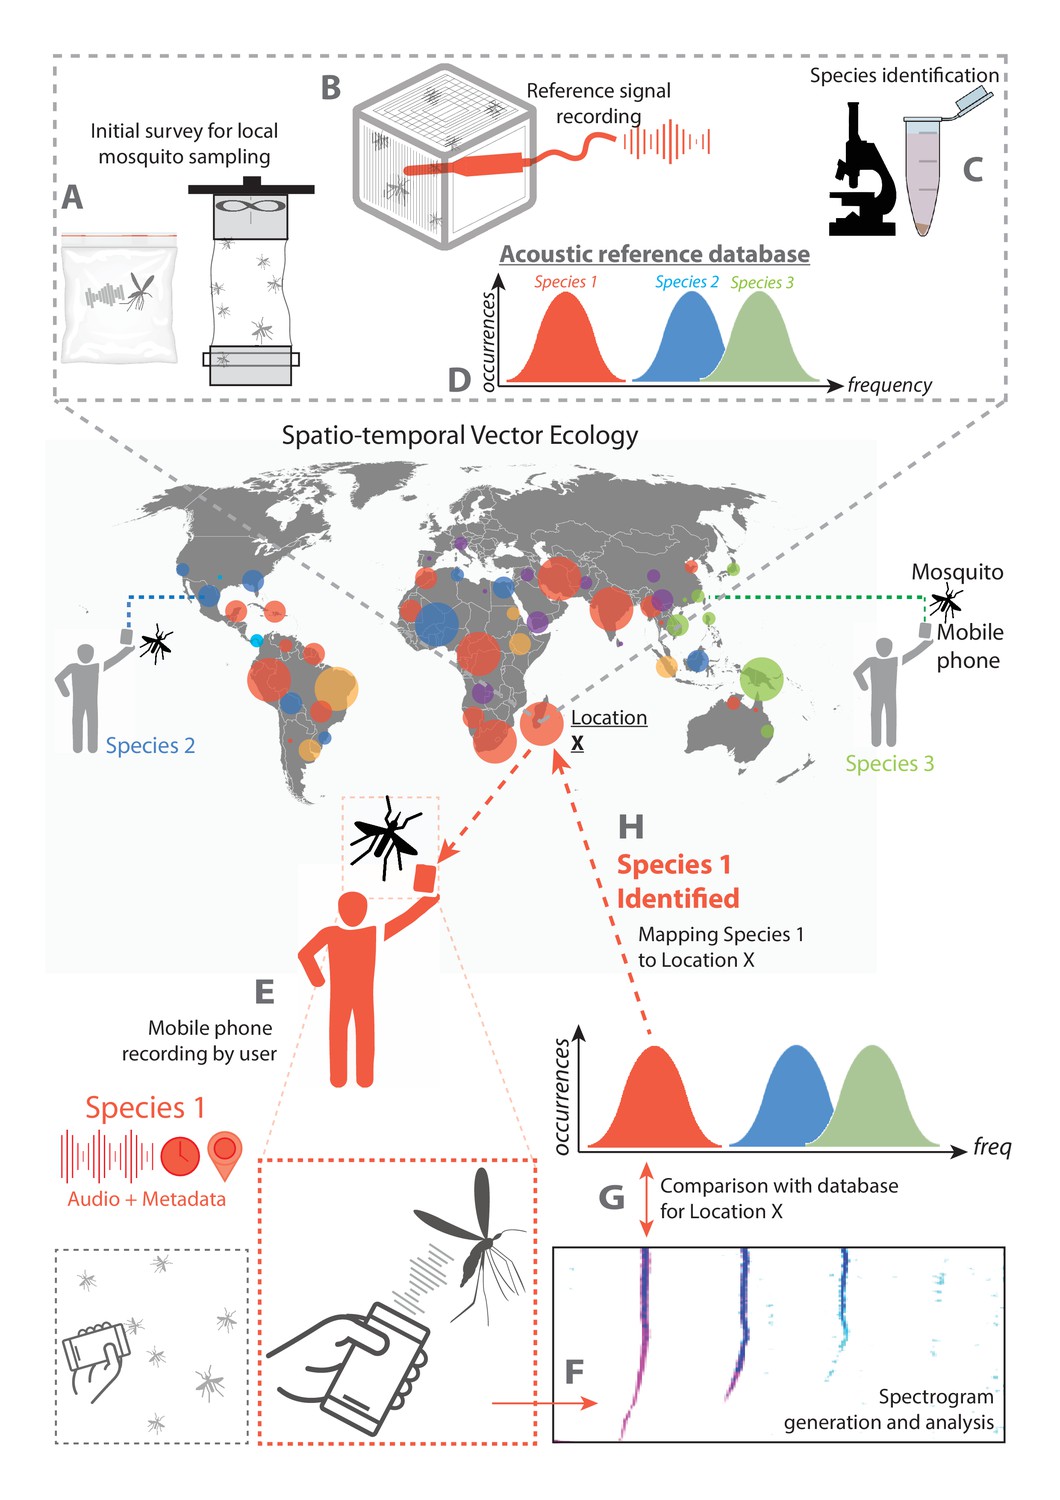
Schematic of proposed surveillance system using crowdsourced acoustic data from mobile phones.
System architecture showing the collection of data by individual mobile phone users, processing to identify species of interest, and compilation into a map of mosquito activity. The diagram is depicted centering around data collection at a field site designated Location X. A-D occur prior to mobile phone based data collection, and represent steps required to enable acoustic mosquito surveillance at the field location. (A) The mosquito population in the field at Location X is sampled, either by users in Ziploc bags or by using methods such as trapping, and live specimens characteristic to the location are collected. (B) Wingbeat sounds of these field-collected mosquitoes are recorded, with an acoustic dataset associated with each individual specimen. (C) Specimens are identified to the genus (and preferably species) level by a method such as morphological ID through optical microscopy, or molecular ID through PCR. (D) Acoustic data are processed and associated with specimen IDs to yield frequency distributions characteristic of the prevalent species in that field location, forming a reference database of mosquito sounds specific to Location X. E-H represent the proposed method for mobile phone based acoustic surveillance at the field location, assuming that the reference database of mosquito sound is already in place. (E) Mosquitoes are recorded in the field by a user with a mobile phone, and the audio file together with metadata is compiled into a database for processing. (F) The acoustic signals are processed to extract the frequencies present in the recorded mosquito sound. (G) The computed acoustic spectrum and metadata obtained from the mobile phone are compared to the reference database for that location, and the most likely species corresponding to the computed frequency is identified. (H) The identified species from this observation, together with the time and location metadata, are mapped back to the field Location X. This closes the loop for mobile phone based acoustic surveillance, from user recorded data to information on spatio-temporal mosquito activity.
Figure 1—figure supplement 2

Brochure.
(A) Graphical brochure/poster showing techniques for recording acoustic data from mosquitoes, to train users from the general public.
Figure 2 with 1 supplement
Mobile phones sensitively acquire high fidelity acoustic data from mosquitoes with comparable performance across models.
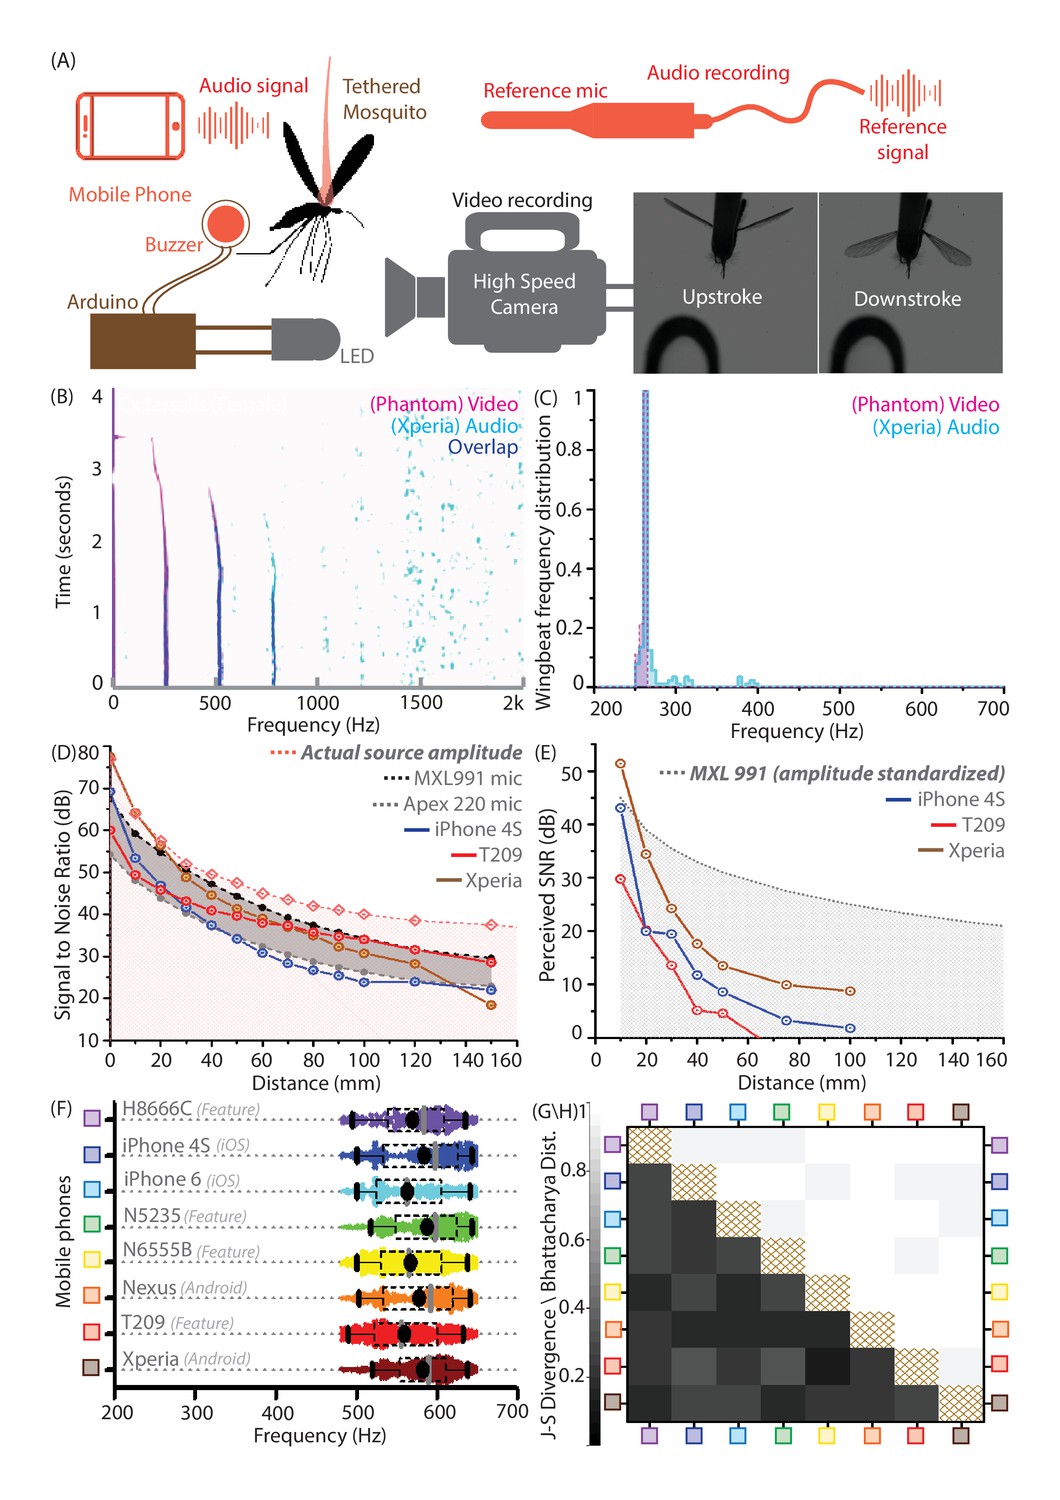
(A) Schematic of experimental setup for recording a tethered mosquito using synchronized mobile phone audio and high speed video. Synchronization between audio and video is achieved on the order of microseconds, using a piezoelectric buzzer connected in parallel with an LED, and controlled with a microprocessor to produce the same temporal sequence of sound and light. (B) Overlaid spectrograms for female Culex tarsalis mosquitoes obtained independently using high speed video (magenta) and mobile phone audio (cyan), aligned to within 2 ms and showing a spectral overlap (blue) within 2 Hz across all time instances. The mobile phone data is noisy but faithfully reproduces the wingbeat frequency peak of 264 Hz and the first two overtones. (C), Wingbeat frequency distributions from video and audio (165 time instances each) have high overlaps, as measured by a Bhattacharya Coefficient (BC) of 0.95. (D) Signal-to-noise ratio (SNR) estimates over distance from a standardized sound source show that mobile phone microphone performance within a 100 mm radius is superior or comparable to high performance studio microphones. The pink line represents the actual source amplitude, with the pink-shaded region below indicating the region less than the actual amplitude, in which all acoustic measurements should lie. The gray-shaded band represents the range of sensitivities between the limits set by the two studio microphones used as reference standards. The SNR curves for all three phones lie mostly within this band, indicating that they perform in a range between the two reference microphones. (E) SNR over distance for the wingbeat sound produced by a tethered female Cx. tarsalis mosquito (normalized for a source amplitude of 45 dB), providing working limits where phones can detect the audio signal - 50 mm for the low end T-209 feature phone and 100 mm for the iPhone 4S and Xperia Z3 Compact smartphones. The gray-dotted line represents the actual amplitude of the mosquito sound in dB, as measured by the MXL991 reference microphone. The gray-shaded region below indicates the region less than the actual amplitude, in which all acoustic measurements are expected to lie. (F) Variation of the wingbeat frequency distribution sampled by 8 different phones is low compared to the natural variation within a population of lab-reared Anopheles stephensi females. Raw data are shown with overlaid box plots marking the inter-quartile range, black circles for mean frequency, gray vertical bars for median frequency, and whiskers indicating 5th and 95th quantiles. (G,H) The Jensen-Shannon divergence metric for base frequency distributions (G, lower left triangle) shows low disparity, ranging between 0.144 and 0.3, against a minimum of for identical distributions. Likewise, the Bhattacharya distance (H, upper right triangle) shows high overlap, with values between 0.935 and 0.986, against a maximum of 1 for identical distributions. The brown-hatched areas along the diagonal represent blank cells, as distances are not shown for any distribution with respect to itself.
Figure 2—figure supplement 1
Synchronized recordings of tethered mosquitoes using studio and mobile phone microphones show exact correspondence at distances below 50 mm.
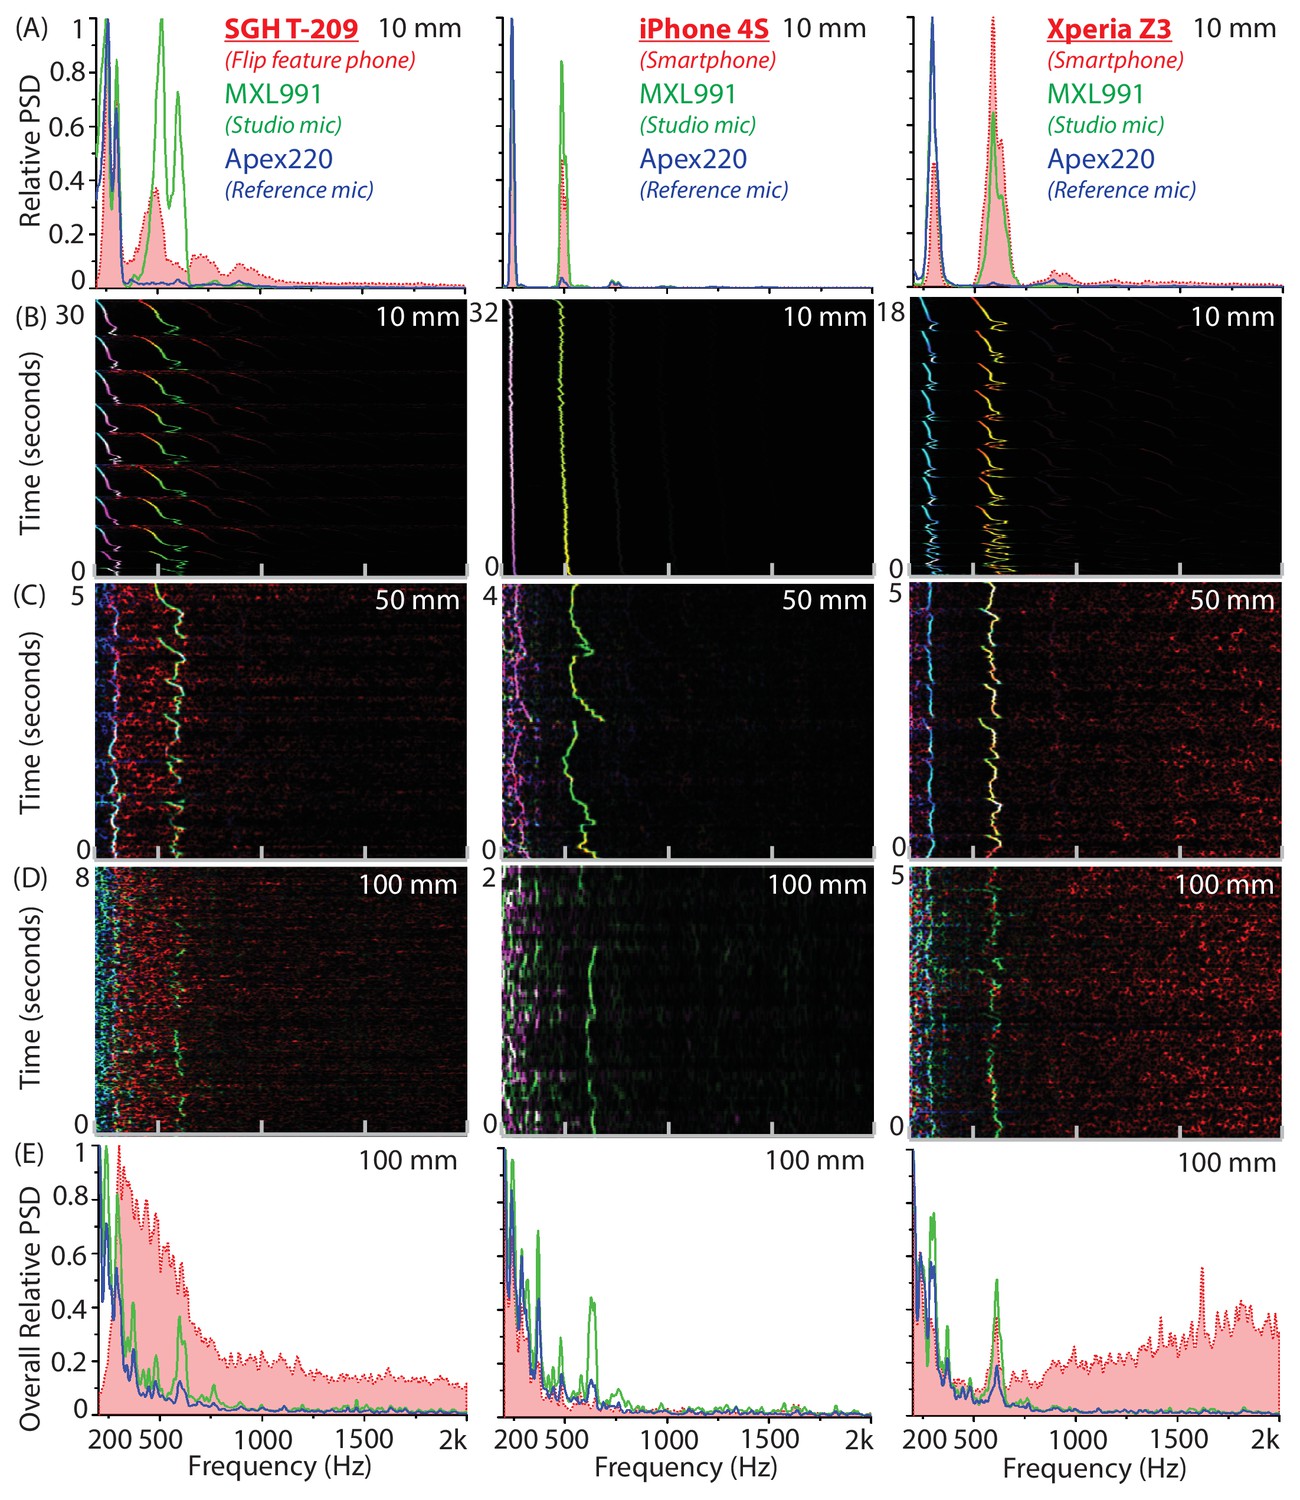
(A-E) Comparison of power spectral density for synchronized simultaneous recordings of individual Culex tarsalis female mosquitoes using the MXL 991 studio microphone, the Apex 220 reference microphone and a mobile phone, taken at varying distances. The left column corresponds to the SGH T-209 feature phone, the middle column to the iPhone 4S iOS smartphone, and the right column to the Xperia Z3 Compact Android smartphone. (A) Superimposed averaged spectra show that all phones acquire wingbeat sound at a high signal-to-noise ratio at 10 mm away from the mosquito. (B,C,D) Overlaid spectrograms synchronized to within 20 ms in time show a near-perfect spectral match of within 5 Hz at each time interval, for the mobile phone microphone (red channel), MXL 991 (green channel) and the Apex 200 (blue channel), shown together as RGB images with intensity of colour corresponding to variations in power spectral density. Mobile phones strongly acquire mosquito sounds at 10 mm or even 50 mm, but their sensitivity drops sharply at distances of 100 mm. (E) Superimposed averaged spectra show that only the Xperia Z3 continues to acquire wingbeat sound at 100 mm away from the mosquito, albeit at low signal-to-noise ratio. The T209 feature phone picks up low-frequency noise between 300 and 600 Hz that overwhelms the mosquito frequencies, the iPhone 4S has low-noise acquisition throughout, and the Xperia Z3 picks up high-frequency noise above 1 kHz that leaves the mosquito frequency band relatively unaffected.
Figure 3 with 2 supplements

Mosquitoes of different species are distinguishable based on wingbeat frequency distributions and metadata.
(A) Distribution of wingbeat frequencies for female mosquitoes of 20 vector species, for recordings obtained with the 2006 model SGH T-209 low-end feature phone (except Culex pipiens, Culex quinquefasciatus, and Culiseta incidens, recorded using iPhone models; and Aedes sierrensis, recorded with various phones). (B) (lower left triangle), Jensen-Shannon divergence metric for base frequency distributions. Distributions are spaced apart with high J-S divergence in most cases, with only four pairwise combinations having J-S divergence around 0.35 - the maximum divergence for the same species across different phones. (C) (upper right triangle), Qualitative classifiation of species pairs according to the possibility of distinguishing them using mobile phones — (i) no frequency overlaps, hence distinguishable by acoustics alone, (ii) overlapping frequency distributions, but not geographically co-occurring hence distinguishable using location, (iii)overlapping frequency distributions but distinguishable using time stamps, (iv) partially overlapping frequency distributions but no location-time distinctions, hence distinguishable but not in all cases, (v) indistingishable due to highly overlapping frequency distributions with co-occurrence in space and time. The brown-hatched areas along the diagonal represent blank cells, as distances are not shown for any distribution with respect to itself. (D) Confusion matrix for classification of acoustic data bootstrapped from the reference frequency datasets for twenty species, using the Maximum Likelihood Estimation (MLE) algorithm. Each column corresponds to a particular species, from which acoustic data is drawn for classification. The twenty entries in each column represent the fractions in which recordings from the species corresponding to that column are classified among all twenty species in our database. This classification is done for data taken from the reference distributions, and is compared against the same reference dataset, based exclusively on wingbeat frequency. Classification errors occur when a given species frequency distribution has overlaps with other species, and the confusion matrix reflects the inherent uniqueness or overlap between frequency distributions in our database. Colour scale showing fraction of recordings classified is the same for both D and E. (E) Confusion matrix for classification of test audio recordings, using the MLE algorithm. Test data were collected for 17 species, using different phones (some or all among Google Nexus One, Sony Xperia Z3 Compact, iPhone 4S) which were not used to construct the reference distributions (recorded using the SGH T-209). Each column corresponds to a particular test species, from which acoustic data are drawn for classification. The twenty entries in each column represent the fractions in which recordings from the test species corresponding to that column are classified among all twenty species in our database. Classification is based on both wingbeat frequency and a location filter, simulating the classification of randomly recorded mosquitoes of different species by users in field conditions. The resulting classification accuracies are significantly higher in this case, when compared to classification accuracies which do not consider location (Figure 3—figure supplement 1D). Blank areas along three columns represent species for which test data from a different phone were not available. (F,G) Variations in base-frequency distribution (F) for field-recorded sounds corresponding to wild female Ae. sierrensis mosquitoes having a wide (about two-fold) variation in body size and wing area (G), showing small differences between individuals compared to the variation within each flight trace. The gray distribution at the top represents the species wingbeat frequency distribution for Ae. sierrensis, with the gray-shaded vertical band marking the range from 5th to 95th percentile of frequency for the species. All individual recordings lie completely within this range.
Figure 3—figure supplement 1
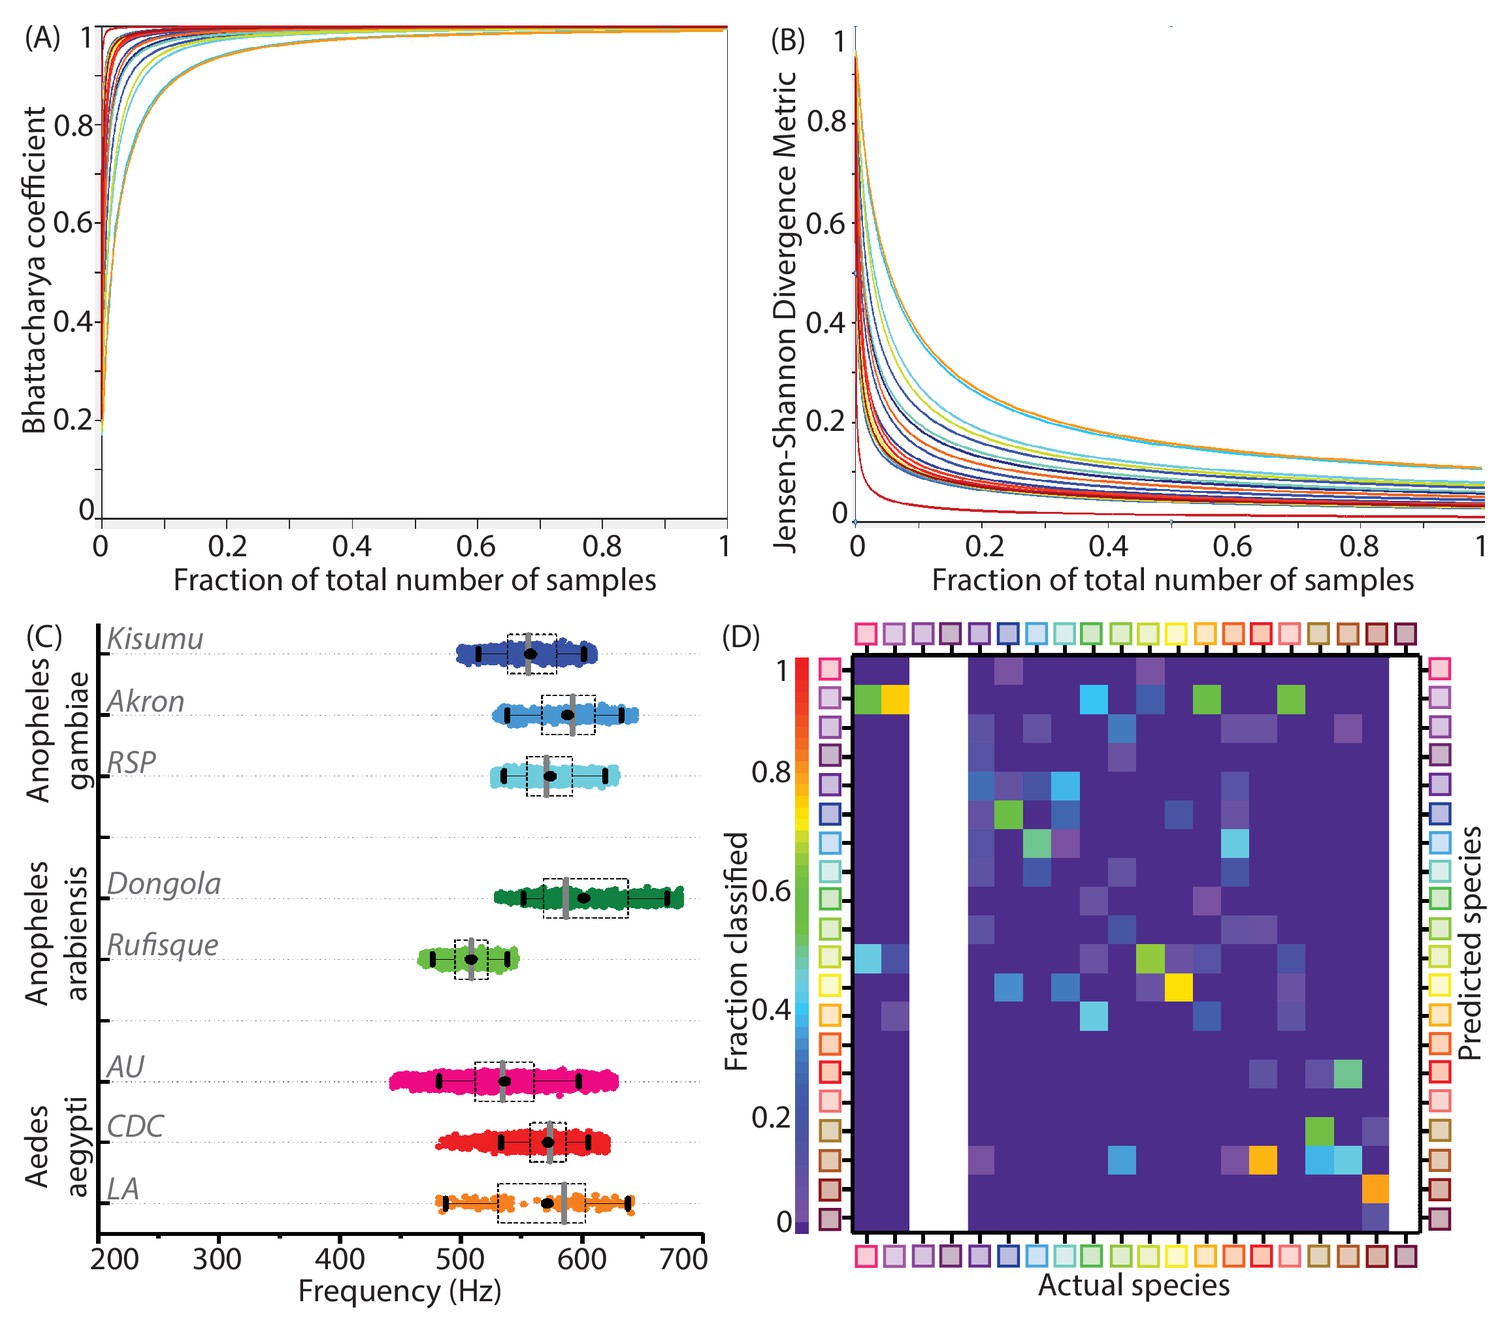
Statistical parameters for adequate sampling, inter-colony variations and test data classification accuracies for wingbeat frequency distributions.
(A,B) Convergence of statistical metrics for randomly sampled subsets of increasing size bootstrapped from species wingbeat frequency distributions for 20 species, to values expected for subsets having identical statistical parameters as the parent distribution. Colours correspond to each species. The Bhattacharya coefficient (BC) (A) approaches indicating perfect overlap of point mass functions for subsets and parent distributions, while the Jensen-Shannon Divergence metric (JSD) (B) approaches indicating that both subset and parent distributions contain the same information. These metrics change rapidly for subsets having few sample points, but quickly converge to their expected values within a small fraction of the total number of samples comprising each species frequency distribution. (C) Distributions of wingbeat frequency for different populations of the same species. Anopheles gambiae and Aedes aegypti have highly overlapping distributions for different colonies, whereas Anopheles arabiensis shows significant difference in wingbeat frequency between two variants. (D) Confusion matrix for classification of audio recordings using the Maximum Likelihood estimation algorithm, for test data from various phones, as compared to the reference datasets for species recorded using the SGH T-209 phone. Each column shows the probability of correct or erroneous classification of a given species with respect to all others, based solely on wingbeat frequency. The resulting classification accuracies are comparatively lower than those which factor in location metadata (Figure 3E). Blank areas along three columns represent species for which test data from a different phone was not available.
Figure 3—figure supplement 2
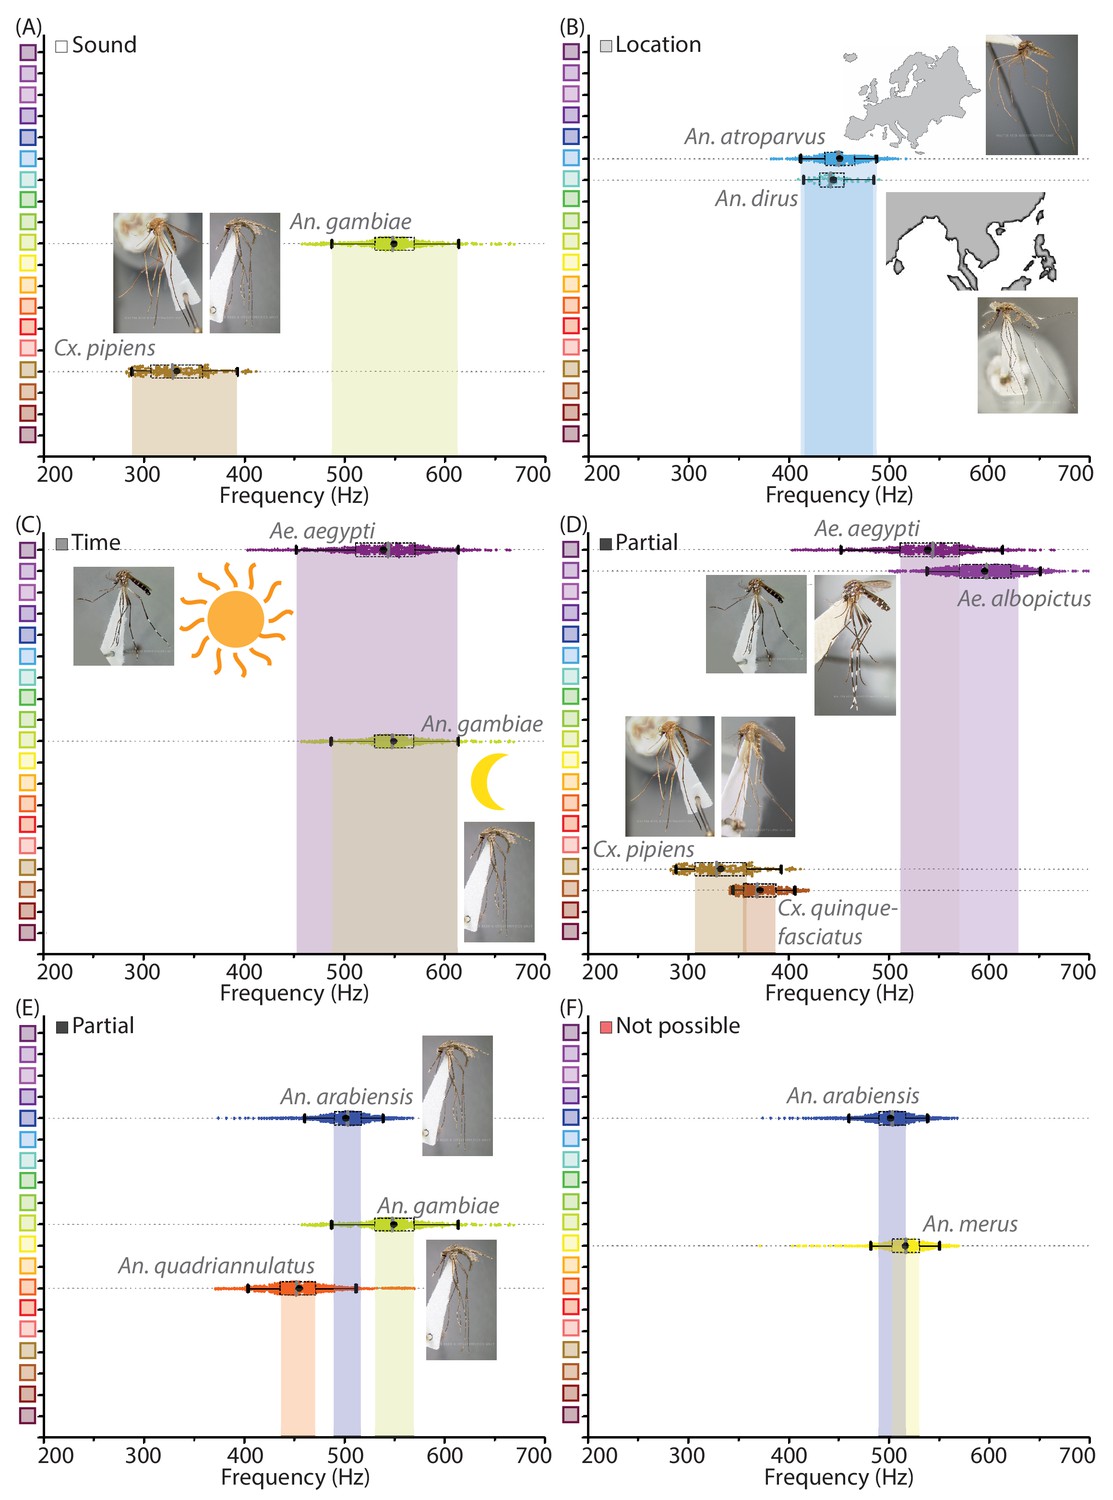
Mosquito species can be distinguished with mobile phone acoustics and metadata.
(A-F) Illustrative examples for distinguishing between medically relevant mosquito species using acoustics and metadata. All inset images of mosquito specimens are taken from Walter Reed Biosystematics Unit mosquito ID databases. (A) Distinction by acoustic data alone - Cx. pipiens and An. gambiae, which co-occur in many regions, can easily be distinguished by sound alone. (B) Distinction by location metadata - An. atroparvus and An. dirus have overlapping acoustic spectra, but recordings are easily distinguished from each other by metadata pertaining to their distinct spatial distributions in Europe and South-East Asia respectively. (C) Possible partial distinction by time metadata - Ae. aegypti and An. gambiae can occur together in many locations and have overlapping wingbeat frequency distributions, but may possibly be distinguished in some instances by time of recording, based on their differential preferences for diurnal and crepuscular biting. (D) Partial distinction by acoustic data - Ae. aegypti and Ae. albopictus have similar appearances, geographical distributions and biting habits in many areas. Although the wingbeat frequency distributions are not completely distinct, interquartile ranges do not overlap and a significant fraction of recordings can still be classified correctly as one or the other, making acoustic identification faster and easier than microscopy. Similarly in the case of Cx. pipiens and Cx. quinquefasciatus, which have partially distinguishable frequency spectra despite being otherwise indistinguishable except using PCR. (E) Partial distinction by acoustic data - An. arabiensis, An. gambiae, and An. quadriannulatus, which are members of a species complex that are identical in appearance and often overlapping in habitat, have non-overlapping interquartile ranges for wingbeat frequency distributions implying that the majority of acoustic samples can be classified correctly as one among the three. (F) An. arabiensis is indistinguishable based on mobile phone acoustic data from An. merus, another members of the An. gambiae s.l. species complex, exposing a relatively rare limitation of species identification using mobile phone acoustic surveillance.
Figure 4 with 2 supplements
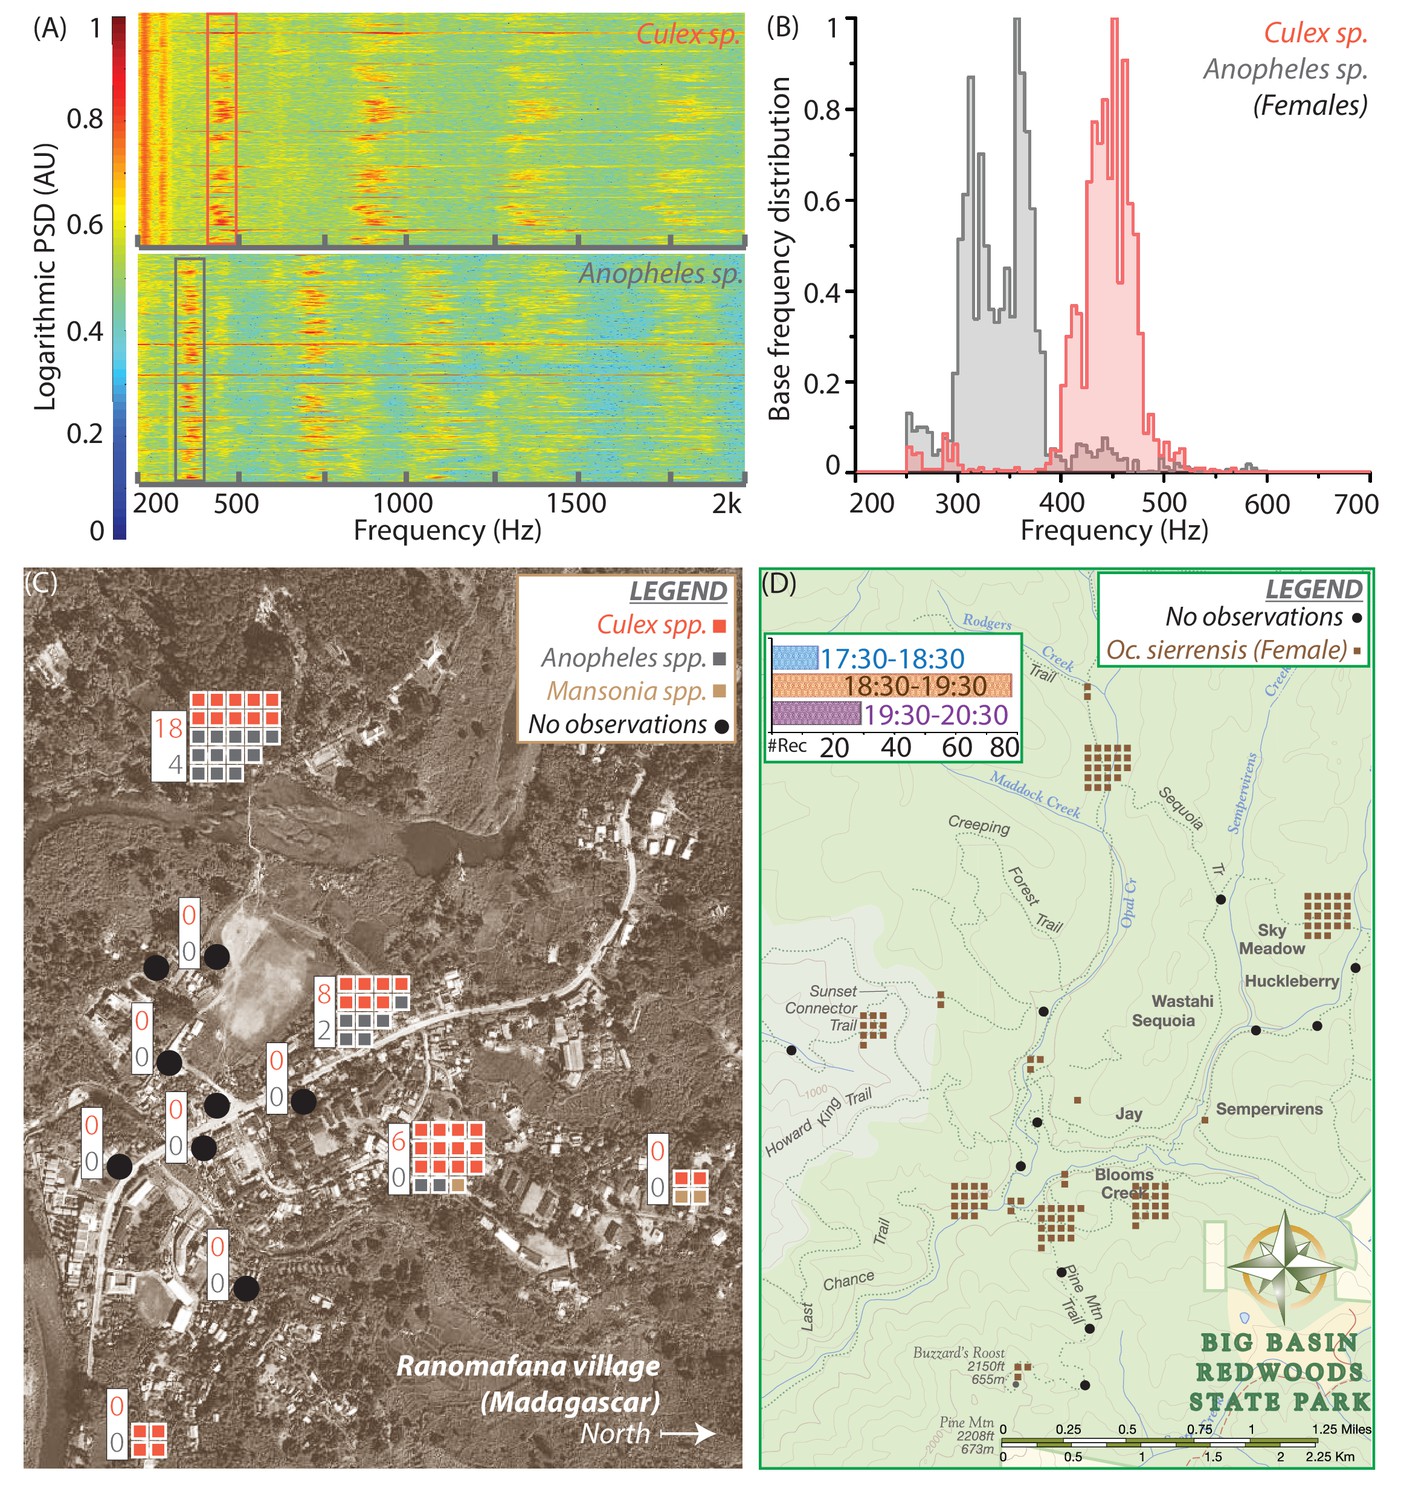
Spatio-temporal activity of mosquitoes in the field can be mapped using acoustic data collected by mobile phone users.
(A) Sample spectrograms from female Culex spp. (top) and Anopheles spp. (bottom) mosquitoes captured in the field at Ranomafana in Madagascar. (B) Frequency distributions for field-caught Culex spp. and Anopheles spp. mosquitoes in Ranomafana, forming a reference for identification of recordings from either species at this field site. Acoustic data were collected for 3 minutes each, from 50 individual Culex and 10 individual Anopheles mosquitoes. (C) Map of Ranomafana village showing distribution of female Culex spp., Anopheles spp., and Mansonia spp. mosquitoes, from mobile phone data recorded by 10 volunteers over the approximately 1 km X 2 km area. Each square represents one recording, and black circles indicate locations where volunteers reported encountering no mosquitoes. The numbers in the white boxes show the number of Culex (pink) and Anopheles (gray) mosquitoes captured in CDC light traps over the same time period at those locations. The map shows a spatial gradient from riverbank to hillside in the relative proportion of Anopheles spp. and Culex spp. mosquitoes. Further, mosquito hotspots are interspersed with points having a reported lack of mosquitoes, highlighting the potential importance of factors such as the distribution of water and livestock. (D) Spatio-temporal activity map for female Ae. sierrensis mosquitoes in the Big Basin Park field site, using data collected by 15 hikers recording mosquitoes with their personal mobile phones, over a 3-hour period in an approximately 4.5 km X 5.5 km area. Each brown square represents one Ae. sierrensis female recording, and black dots represent sites where hikers reported encountering no mosquitoes at all. (Inset top left) Temporal distribution of the overall mosquito activity data depicted in (D) based on recording timestamps, showing the rise and fall in the number of recordings made, a proxy for mosquito activity, in each hour of the field study.
Figure 4—figure supplement 1
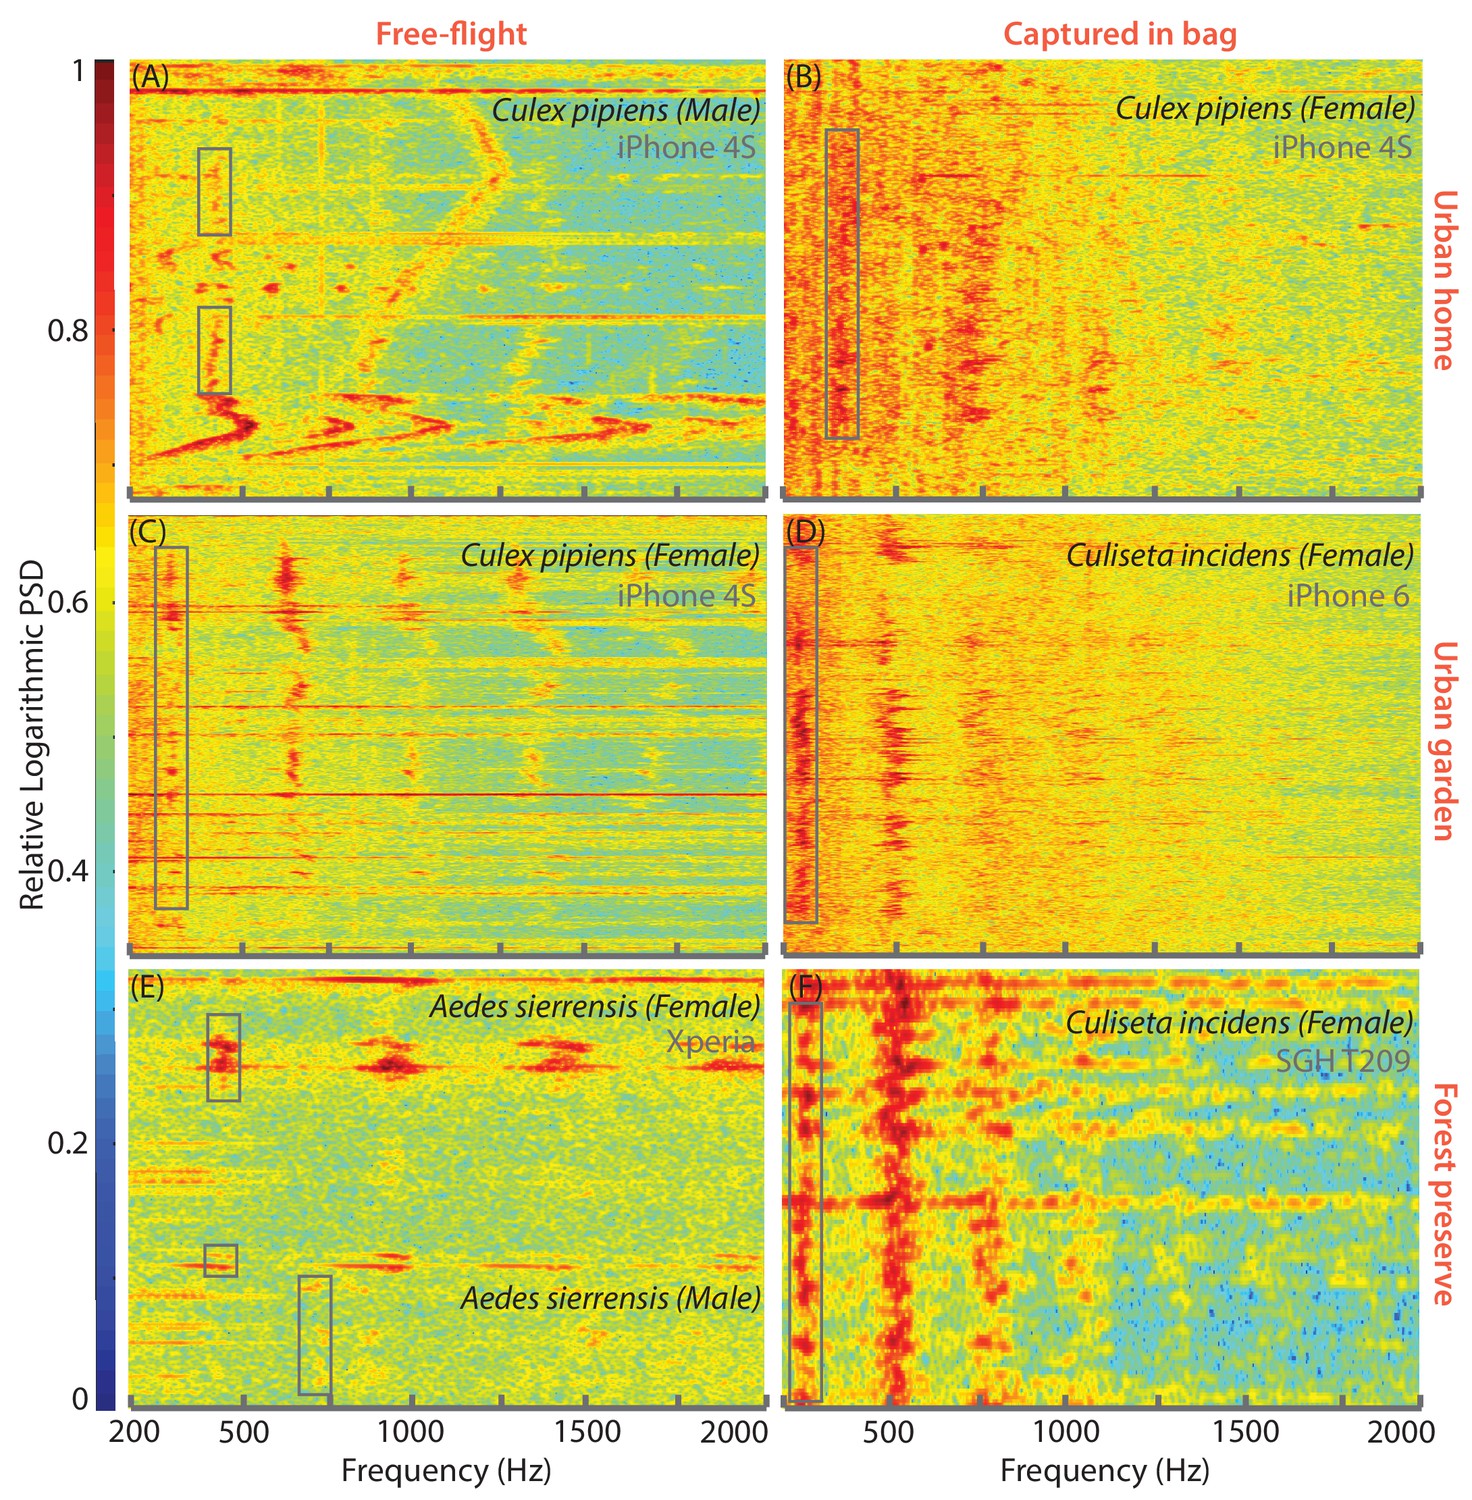
Mobile phones are capable of acquiring mosquito sounds in a variety of field environments.
(A-F) Raw spectrograms of acoustic data acquired by various mobile phone users in different field conditions, with base frequencies of mosquito sounds highlighted by a box. The signals include sources of noise such as human speech, fire truck sirens, and birdsong, and were acquired in both urban (A-D) and forested (E,F) environments, including indoor (A,B) and outdoor (C-F) settings. Mosquitoes recorded were wither followed in free-flight (A,C,E or captured in a plastic ziploc bag prior to recording (B,D,F). All spectrograms show raw spectra without background correction or noise removal, and show the spectra from extraneous acoustic sources (speech, sirens) to distinguish the characteristics of mosquito spectra from other sounds. Spectrograms A-F correspond to sounds in Supplementary file 2–7.
Figure 4—figure supplement 2

Individual flight traces for wild mosquitoes show highly similar mean frequencies with small but intrinsic variances.
(A) Distribution of wingbeat frequencies for 74 representative recordings of wild female Aedes sierrensis mosquitoes from Big Basin Redwoods State Park, CA, USA. The bottom distribution shows the overall species wingbeat frequency distribution for Ae. sierrensis aggregated from all recordings, with the colour of each data point corresponding to its contributing flight trace. The even distribution of the colours across frequency for the overall species distribution indicates that most individual flight traces have similar frequency distributions, means and variances. (B) Plot of mean frequencies of individual flight traces against their corresponding standard deviation as a percentage of the mean. The gray line indicates cumulative fraction of recordings, showing that 85% of recordings have mean frequencies clustered between 350 and 450 Hz, with the vast majority having frequency spreads of less than 5% of the mean. (C) Plot of duration of flight traces against the relative standard deviation, coloured by the value of mean frequency, shows no correlation or clustering between these characteristics. However, there appears to be a minimum spread of about 2% of the mean for most flight traces, irrespective of duration or mean frequency, which appears to correspond to inherent natural frequency variations within flight traces. (D) Variation of classification accuracy for flight traces with relative standard deviation and mean frequency of the trace. For D and E, the colours represent the probabilities of classifying the trace as Ae. sierrensis using the MLE algorithm. Larger dots indicate those that were correctly classified, while small dots represent traces that were incorrectly classified as one of the other local species - Cx. pipiens, Cx. quinquefasciatus, Cx. tarsalis or Cu. incidens. In D, the grey-dashed line represents the boundary between traces that were correctly and wrongly classified. Classification accuracy is observed to be solely a function of mean frequency of the trace, corresponding to the overlaps of wingbeat frequency distributions. (E) Variation of classification accuracy for flight traces with relative standard deviation and duration of the trace. There is no relationship observed between correct classification and the recording duration or frequency spread of the trace.
Author response image 1

Author response image 2
Videos
Video 1
Demonstration of how to identify the primary microphone of a mobile phone and record sound from a mosquito confined in a cup.
https://doi.org/10.7554/eLife.27854.006
Video 2
Demonstration of how to record sound from a mosquito confined in a bottle, using a mobile phone.
https://doi.org/10.7554/eLife.27854.007
Video 3
Demonstration of how to record sound from a mosquito in free flight, at the moment of take-off, using a mobile phone.
https://doi.org/10.7554/eLife.27854.008
Video 4
Video showing variation of amplitude with time, spectrogram, and automatically identified wingbeat frequency at eachtime window, synchronized with the Anopheles gambiae female mosquito recording corresponding to Supplementary file 1.
https://doi.org/10.7554/eLife.27854.011
Video 5
High-speed video recording from a lab reared female Culex tarsalis mosquito, tethered by the scutum to a pipette tip using a bead of wax.
The calibration LED visible at the bottom left is used to automatically synchronize time points in the video with corresponding beeps from a piezoelectric buzzer in the audio. Recording was done on a Phantom v1610 high-speed camera sampling at 10 kHz, with playback slowed down 100 times.
Video 6
High speed video recording from a lab-reared Culex tarsalis mosquito in free-flight, contained within a clear acrylic cage.
Recording was done on a Phantom VEO high-speed camera sampling at 10 kHz, with playback slowed down 100 times.
Additional files
-
Supplementary file 1
Sample acoustic recording from a lab-reared 5-day-old female Anopheles gambiae mosquito in a cage at the CDC insectary, Atlanta, GA, USA.
Recording was done by one of the authors, using a 2006-model Samsung SGH T-209 clamshell phone sampling at kHz.
- https://doi.org/10.7554/eLife.27854.020
-
Supplementary file 2
Acoustic recording from wild male Culex pipiens mosquito in a living room in Menlo Park, CA, USA.
Recording was done by one of the authors using a 2010-model iPhone 4, sampling at 48 kHz.
- https://doi.org/10.7554/eLife.27854.021
-
Supplementary file 3
Acoustic recording from wild female Culex pipiens mosquito in a bathroom in Redwood City, CA, USA.
Recording was done by a volunteer using a 2014-model Samsung Galaxy A3, sampling at 44.1 kHz.
- https://doi.org/10.7554/eLife.27854.022
-
Supplementary file 4
Acoustic recording from wild female Culex pipiens mosquito in a garden in Menlo Park, CA, USA.
Recording was done by one of the authors using a 2010-model iPhone 4, sampling at 48 kHz.
- https://doi.org/10.7554/eLife.27854.023
-
Supplementary file 5
Acoustic recording from wild female Culiseta incidens mosquito in a garden in San Francisco, CA, USA.
Recording was done by one of the authors using a 2015-model iPhone 6S sampling at 48 kHz.
- https://doi.org/10.7554/eLife.27854.024
-
Supplementary file 6
Acoustic recording from wild female Aedes sierrensis mosquito at Big Basin Redwoods State Park, CA, USA.
Recording was done by a volunteer using a 2015-model Sony Xperia Z3 compact, sampling at 44.1 kHz.
- https://doi.org/10.7554/eLife.27854.025
-
Supplementary file 7
Acoustic recording from wild female Culiseta incidens mosquito near a highway at Jasper Ridge Biological Preserve, CA, USA.
Recording was done by one of the authors using a 2006-model Samsung SGH T-209 clamshell phone sampling at 8 kHz.
- https://doi.org/10.7554/eLife.27854.026
-
Transparent reporting form
- https://doi.org/10.7554/eLife.27854.027
-
Supplementary file 8
Acoustic recording from wild female Anopheles spp. mosquito near an outdoor pig pen in Ranomafana, Madagascar.
Recording was done by a volunteer using a locally available non-smart phone sampling at 44.1 kHz.
- https://doi.org/10.7554/eLife.27854.028
-
Supplementary file 9
Acoustic recording from wild female Culex spp. mosquito inside a local residence in Ranomafana, Madagascar.
Recording was done by a volunteer using a locally available non-smart phone sampling at 44.1 kHz.
- https://doi.org/10.7554/eLife.27854.029
-
Supplementary file 10
Acoustic recording from wild female Aedes sierrensis mosquito at Big Basin Redwoods State Park, CA, USA.
Recording was done by a volunteer using a 2015-model HTC-One M8 phone sampling at 44.1 kHz.
- https://doi.org/10.7554/eLife.27854.030
Download links
A two-part list of links to download the article, or parts of the article, in various formats.
Downloads (link to download the article as PDF)
Open citations (links to open the citations from this article in various online reference manager services)
Cite this article (links to download the citations from this article in formats compatible with various reference manager tools)
Using mobile phones as acoustic sensors for high-throughput mosquito surveillance
eLife 6:e27854.
https://doi.org/10.7554/eLife.27854


