Cell differentiation defines acute and chronic infection cell types in Staphylococcus aureus
- University of Würzburg, Germany
- Newcastle University, United Kingdom
- Technical University of Munich, Germany
- University Hospital Würzburg, Germany
- National Center for Biotechnology, Spain
Abstract
A central question to biology is how pathogenic bacteria initiate acute or chronic infections. Here we describe a genetic program for cell-fate decision in the opportunistic human pathogen Staphylococcus aureus, which generates the phenotypic bifurcation of the cells into two genetically identical but different cell types during the course of an infection. Whereas one cell type promotes the formation of biofilms that contribute to chronic infections, the second type is planktonic and produces the toxins that contribute to acute bacteremia. We identified a bimodal switch in the agr quorum sensing system that antagonistically regulates the differentiation of these two physiologically distinct cell types. We found that extracellular signals affect the behavior of the agr bimodal switch and modify the size of the specialized subpopulations in specific colonization niches. For instance, magnesium-enriched colonization niches causes magnesium binding to S. aureusteichoic acids and increases bacterial cell wall rigidity. This signal triggers a genetic program that ultimately downregulates the agr bimodal switch. Colonization niches with different magnesium concentrations influence the bimodal system activity, which defines a distinct ratio between these subpopulations; this in turn leads to distinct infection outcomes in vitro and in an in vivo murine infection model. Cell differentiation generates physiological heterogeneity in clonal bacterial infections and helps to determine the distinct infection types.
https://doi.org/10.7554/eLife.28023.001eLife digest
While in hospital, patients can be unwittingly exposed to bacteria that can cause disease. These hospital-associated bacteria can lead to potentially life-threatening infections that may also complicate the treatment of the patients’ existing medical conditions. Staphylococcus aureus is one such bacterium, and it can cause several types of infection including pneumonia, blood infections and long-term infections of prosthetic devices.
It is thought that S. aureus is able to cause so many different types of infection because it is capable of colonizing distinct tissues and organs in various parts of the body. Understanding the biological processes that drive the different infections is crucial to improving how these infections are treated.
S. aureus lives either as an independent, free-swimming cell or as part of a community known as a biofilm. These different lifestyles dictate the type of infection the bacterium can cause, with free-swimming cells producing toxins that contribute to intense, usually short-lived, infections and biofilms promoting longer-term infections that are difficult to eradicate. However, it is not clear how a population of S. aureus cells chooses to adopt a particular lifestyle and whether there are any environmental signals that influence this decision.
Here, Garcia-Betancur et al. found that S. aureus populations contain small groups of cells that have already specialized into a particular lifestyle. These groups of cells collectively influence the choice made by other cells in the population. While both lifestyles will be represented in the population, environmental factors influence the numbers of cells that initially adopt each type of lifestyle, which ultimately affects the choice made by the rest of the population. For example, if the bacteria colonize a tissue or organ that contains high levels of magnesium ions, the population is more likely to form biofilms.
In the future, the findings of Garcia-Betancur et al. may help us to predict how an infection may develop in a particular patient, which may help to diagnose the infection more quickly and allow it to be treated more effectively.
https://doi.org/10.7554/eLife.28023.002Introduction
Nosocomial pathogens often cause a broad range of diseases using diverse virulence factors, such as production of tissue-damaging toxins or production of adhesins during biofilm formation (Bush et al., 2011). Staphylococcus aureus is one such pathogen that is able to cause different types of life-threatening infections in hospital settings, from acute bacteremia to endocarditis, pneumonia and chronic biofilm-associated infections in prosthetic devices (Otto, 2012). The underlying cellular processes that enable S. aureus to provoke these disparate types of infections is likely driven by host-microbe interactions (Casadevall et al., 2011), in which specific, yet-to-be-described extracellular signals play a role to generate distinct, locally defined types of infections (Veening et al., 2008; López and Kolter, 2010). Determining the cellular processes and the nature of the extracellular signals that define the different infection outcomes is crucial for understanding how difficult-to-treat bacterial infections develop and for improving strategies to overcome antimicrobial resistance.
In S. aureus, infection outcome is controlled by the agr quorum sensing program, which is autoactivated in response to the self-produced extracellular signal AIP (autoinducing peptide) (Recsei et al., 1986). AIP binds to the AgrC histidine kinase membrane receptor and activates its cognate regulator AgrA via phosphorylation (Figure 1A). AgrA~P induces changes in cellular gene expression that results in rapid bacterial dispersion in the host and acute bacteremia (Thoendel et al., 2011). Dispersion of S. aureus requires upregulation of surfactant phenol-soluble modulins (psmα and psmβ), which are amphipathic small peptides that contribute to bacteria detachment (Li et al., 2009a; Peschel and Otto, 2013) and destabilize cell membranes, rendering them cytotoxic to host cells. Modulins are usually expressed during acute infections, as well as hemolytic toxins (hla, hlb, hlg) that facilitate tissue disruption during septicemia (Recsei et al., 1986). In contrast, agr activation indirectly downregulates the icaADBC operon genes needed to synthesize the extracellular polysaccharide matrix that protects cells within a biofilm (PNAG or PIA), as well as several adhesion proteins (SpA and other MSCRAMM proteins) responsible for cell aggregation/attachment during biofilm formation (Recsei et al., 1986; Boles and Horswill, 2008; Peng et al., 1988). Biofilms, which are associated with untreatable chronic infections, protect bacteria from antibiotics and host defenses (Lewis, 2008; Lopez et al., 2010; Nadell et al., 2009; Parsek and Singh, 2003). The S. aureus agr quorum sensing system antagonistically regulates the activation of planktonic and biofilm-associated lifestyles (Recsei et al., 1986; Boles and Horswill, 2008; Peng et al., 1988), which contribute to the development of acute and chronic infection outcomes, respectively. A large number of positive and negative regulators controls agr expression. Among those, the agr system is inhibited by the σB sigma factor (Bischoff et al., 2001). Activation of σB occurs during early stationary phase (Senn et al., 2005) in response to distinct types of cellular stresses (Geiger et al., 2014; Geiger and Wolz, 2014; Kästle et al., 2015). σB triggers a general stress response that affects expression of a number of virulence and stress-response genes and indirectly represses agr (Thoendel et al., 2011). Thus, σB antagonizes the influence of the agr system on virulence factor expression (Senn et al., 2005; Pané-Farré et al., 2006) and biofilm formation (Bischoff et al., 2001; Kullik et al., 1998).
Figure 1 with 1 supplement see all
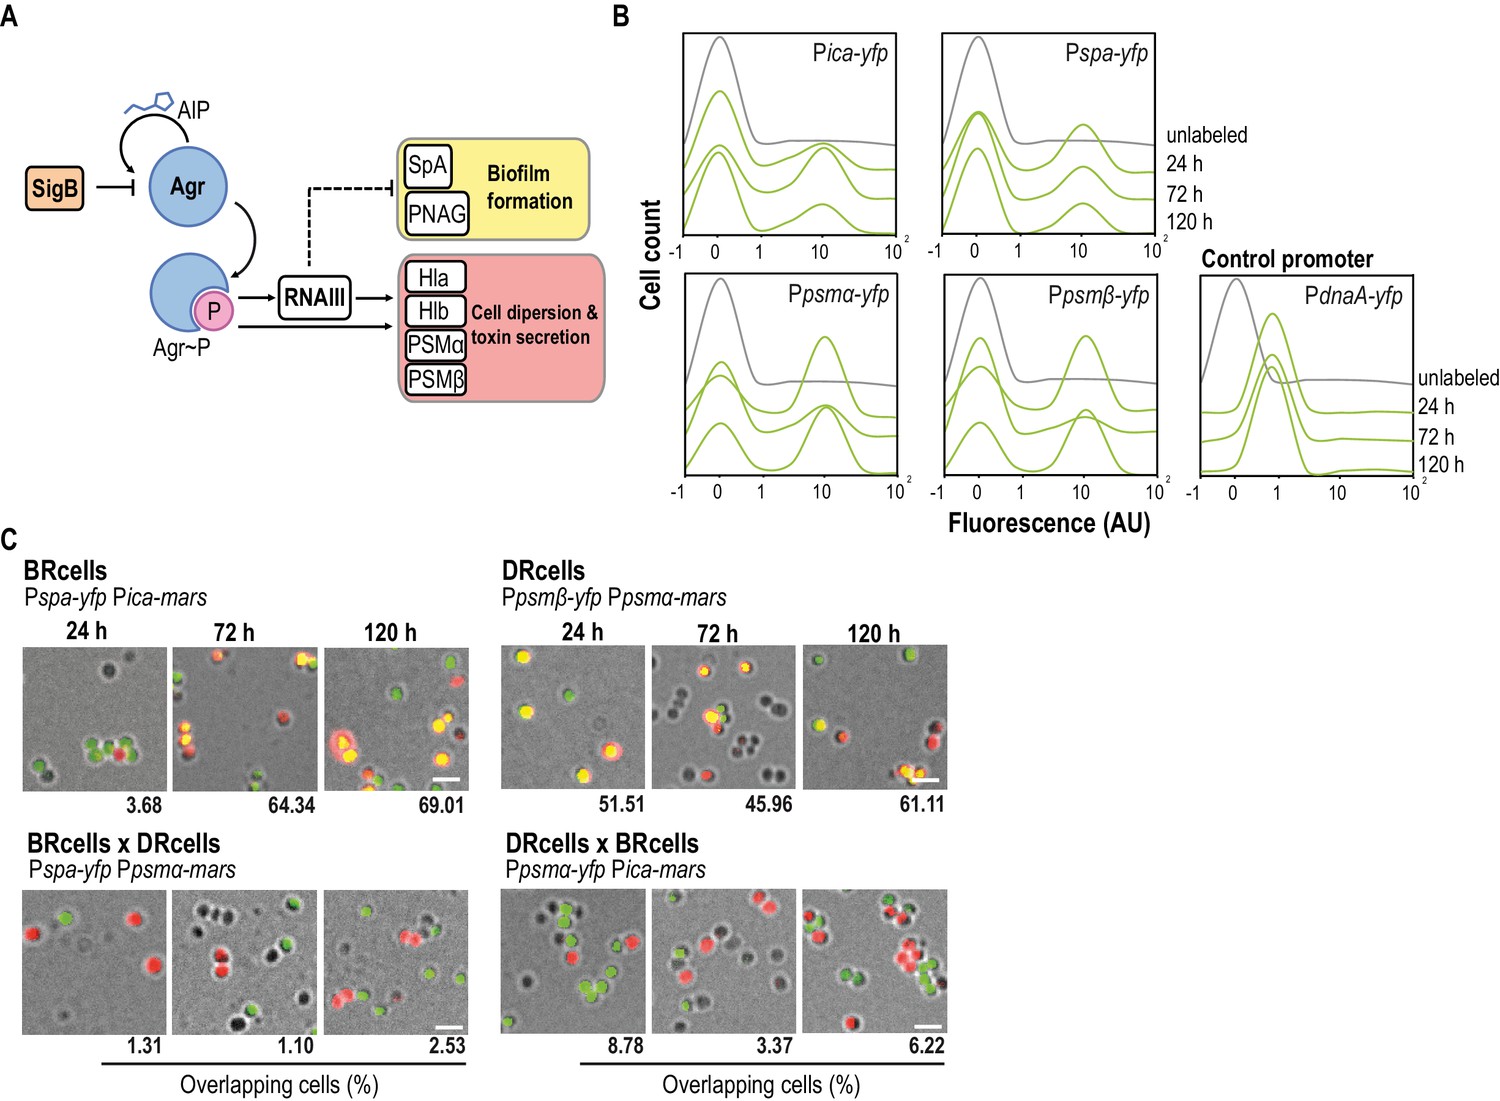
Staphylococcus aureus aggregates contain specialized cell types.
(A) Scheme of the agr signaling cascade in S. aureus. AIP binds to the AgrC histidine kinase membrane receptor and activates its cognate regulator AgrA via phosphorylation (AgrA~P). AgrA~P upregulates toxin-coding genes that are also responsible for cell dispersion (hla, hlb, psmα and psmβ) and it downregulates genes involved in biofilm formation (ica and spa). (B) Quantitative analysis of fluorescence microscopy images of agr-related promoters. The control promoter is the agr-independent dnaA, which has a monomodal expression pattern. We counted 700 random cells from each of three independent microscopic fields from independent experiments (2100 cells total for each strain). (C) Fluorescence microscopy images of double-labeled cells at various times during aggregate formation (24, 72 and 120 hr). Percentages of cells quantified in the fields with positive overlapping signal. Cells were counted as in (A). A signal is considered to overlap when signals are detected in a 3:1-1:3 range, the range in which green and red signals merge to yellow. Top row, double-labeled strains with Pica-yfp, Pspa-yfp (BRcells) and Ppsmα-yfp, Ppsmβ-yfp (DRcells) promoters. Bottom row, double-labeled strains with antagonistic promoters. Bar = 2 μm.
This understanding of agr-mediated antagonistic regulation of chronic and acute S. aureus infection outcomes was built on comparative analyses of clinical isolates and characterization of infection related mutants. Through this approach, agr-defective isolates are frequently identified from chronic infections as these mutants usually show reduced hemolytic activity and develop robust biofilms (Fischer et al., 2014; Goerke and Wolz, 2010; Grundmeier et al., 2010; Hirschhausen et al., 2013; Savage et al., 2013). In addition, agr dysfunction is frequently correlated with chronic persistent S. aureus infections (Fowler et al., 2004) such as small colony variants (SCV). SCV have exceptionally low agr expression levels (Kahl et al., 2016) and high expression of biofilm-related genes (Tuchscherr et al., 2010). High σB expression is important for SCV phenotype acquisition (Mitchell et al., 2013), because sigB mutants do not generate SCV (Tuchscherr and Löffler, 2016; Tuchscherr et al., 2015). However, whether the capacity of nosocomial pathogens, such as S. aureus, to cause distinct types of infections is restricted to the emergence of genetic variants is still unclear. Staphylococcus aureus cells are exposed to a variety of local environmental signals during the course of an infection that can influence bacterial gene expression and thus, their infective potential in a given infection niche. These signals include, but are not limited to, changes in nutrient availability, temperature, pH, osmolarity or, oxygen concentration. Staphylococcus aureus might be able to respond collectively to these extracellular cues to adapt its behavior in a fluctuating environment (Münzenmayer et al., 2016), allowing staphylococcal communities to generate distinct, locally defined infection types without modification of the bacterial genome (Veening et al., 2008; López and Kolter, 2010).
It has been hypothesized that changes in bacterial virulence potential are a response to local concentrations of tissue-specific signals, which have an important role in determining infection outcome (Cheung et al., 2004). Yet how bacteria prepare for such unpredictable environmental changes is a question that remains unanswered. A fundamental feature of microbial cells is their ability to adapt to diverse environmental conditions by differentiating into specialized cell types (Arnoldini et al., 2014; López et al., 2009; Veening et al., 2005). In most cases, the extracellular cues are responsible for defining coexisting cell fates in bacterial populations. Cell fates are genetically identical and phenotypically distinct bacterial subpopulations that express heterogeneously different sets of genes and have distinct functions within the microbial community (George et al., 2015). A classical example of this is the bacterial response to antibiotics. Antibiotics kill most S. aureus cells, but it is frequent to observe a small subpopulation of genetically identical but antibiotic-persister cells that can cause recurrent infections in a post-antibiotic period (Bigger, 1944; Lewis and cells, 2007).
The relative simplicity of agr-mediated antagonistic regulation of planktonic and biofilm-associated lifestyles provides a natural model to analyze how S. aureus cells collectively establish acute or chronic infection lifestyles and to identify extracellular factors that influence activation of the cellular program that leads to prevalence of one infection program over the other. Here, we report a bimodal behavior in the agr quorum sensing system that antagonistically regulates the differentiation of two genetically identical but physiologically distinct specialized cell types in S. aureus communities. One cell type contributes to the formation of biofilms responsible for chronic infections, whereas a second was constituted by dispersed cells that produced the toxins that contribute to an acute bacteremia. These subpopulations were present in S. aureus communities at different ratios depending on growth conditions, which contributed to determining the outcome of infection. We found that colonization niches with higher Mg2+ concentrations, which is inherent in tissues colonized preferentially by S. aureus (Günther, 2011; Jahnen-Dechent and Ketteler, 2012), influenced the bimodal switch and increased the size of the subpopulation of cells specialized in biofilm formation, as Mg2+ binding to teichoic acids increases cell wall rigidity and triggered a σB stress-induced genetic cascade that downregulates agr. In a mouse model, bacterial cell differentiation occurred during in vivo infections and the Mg2+ concentration in infected organs influenced collective bacterial behavior in simultaneous progress to a biofilm-associated chronic infection or a disperse bacteremia. This study shows that cell differentiation in S. aureus helps to diversify the types of infections that arise simultaneously from an infection caused by a clonal population of bacteria.
Results
Staphylococcus aureus multicellular aggregates differentiate cell types
We explored the role of agr-mediated antagonistic regulation of planktonic and biofilm-associated lifestyles in S. aureus aggregates growing on Mg2+-enriched TSB medium (TSBMg), in which most S. aureus clinical isolates develop robust multicellular aggregates (Koch et al., 2014). To study biofilm gene expression, we introduced transcriptional fusions of biofilm-associated ica/spa genes. The ica operon is responsible for production of the exopolysaccharide polymeric matrix (PNAG or PIA) that lends consistency to the biofilm. The spa gene encodes a cell wall-anchored adhesion protein, adhesin that is responsible for S. aureus cell aggregation and attachment to surfaces during biofilm formation (Recsei et al., 1986; Boles and Horswill, 2008; Peng et al., 1988). To monitor planktonic gene expression, we generated transcriptional fusions of psmα and psmβ genes. These genes code for small peptides, the phenol-soluble modulins, whose expression depends directly on agr. Due to their surfactant properties, PSMα and PSMβ act as cytolytic toxins that contribute to bacterial dispersion and play an important role in acute staphylococcal infections (Li et al., 2009a; Peschel and Otto, 2013) (Figure 1A). These reporters were introduced into neutral loci in the S. aureus chromosome to ensure expression of a single reporter copy in each cell (Yepes et al., 2014); we monitored their expression at the single-cell level in S. aureus aggregates using quantitative analysis of fluorescence microscopy images (Figure 1B and Figure 1—figure supplement 1A–B). All reporters showed bimodal expression and indicated the bifurcation of two cell subpopulations in S. aureus aggregates, one with lower and another with higher fluorescence levels. This bimodal expression pattern differed from the unimodal expression of the housekeeping and agr-independent gene dnaA, used as control reporter (Figure 1B and Figure 1—figure supplement 1A). Cultures of different S. aureus isolates showed bimodal expression of these reporters (Figure 1B and Figure 1—figure supplement 1C), which suggests that cell differentiation is a general phenomenon in S. aureus.
Monitoring the temporal dynamics of the subpopulations that bifurcated during the development of the microbial aggregates from an initial inoculum in TSBMg revealed larger subpopulations of ica- and spa-expressing cells in early developmental stages (~72 hr; Figure 1B), compared to the size of these subpopulation at later growth stages (~120 hr). In contrast, the size of the subpopulations of psmα/β-expressing cells increased concomitantly with time, consistent with the reported antagonistic regulation of ica/spa and psmα/β by agr (Recsei et al., 1986; Boles and Horswill, 2008; Peng et al., 1988). We generated strains labeled with different pairwise combinations of these reporters, which were both introduced into neutral loci in the S. aureus chromosome; this allowed quantitative analysis of fluorescence microscopy images to examine simultaneous expression in S. aureus microbial communities (Figure 1C and Figure 1—figure supplement 1D). This approach indicated coexpression of ica with spa and of psmα with psmβ in two distinct cell subpopulations, showing the bifurcation of two distinct subpopulation of cells specialized in expressing ica, spa and other biofilm-related genes (BRcells) and cells expressing psmα/β dispersion-related genes (DRcells).
Differential AgrA~P affinity to P2 and P3 promoters generates the agr positive feedback loop that differentiates BRcells and DRcells
The differential expression of agr-related genes in the distinct cell types led us to analyze the molecular mechanism of agr-mediated cell differentiation. The agr system is autoactivated once the extracellular AIP concentration reaches a given threshold (10–14 μM) (MDowell et al., 2001) and is inhibited by σB induction (Bischoff et al., 2001). Following agr activation, AgrA~P directly upregulates psmα/β expression (Queck et al., 2008) and binds to the two adjacent divergent promoters P2 and P3, which trigger expression of RNAII and RNAIII transcripts, respectively (Koenig et al., 2004). RNAII upregulates the agrBDCA operon, which encodes the agr signal transduction cascade, including the AIP signal, the AgrC sensor kinase and its AgrA cognate regulator. Therefore, AgrA~P binding to the P2 promoter constitutes a positive feedback loop in which AgrA~P regulator induces expression of the agrBDCA operon, which encodes the entire agr signal transduction cascade (Thoendel et al., 2011; Queck et al., 2008). Bimodal gene expression in microbial populations is usually triggered by a positive feedback loop in which a gene product induces its own expression. We hypothesize that, once a certain AgrA~P threshold is reached in a cell, AgrA~P induces its own expression and these cells maintain high AgrA~P levels. Thus, AgrA~P and AgrA-controlled genes will thus be activated in that cell, including upregulation of RNAIII via activation of the P3 promoter. RNAIII positively regulates a pool of agr-dependent genes that encode the cytotoxic toxins and virulence factors responsible for acute infection (Koenig et al., 2004). Activation of the P3 promoter leads DRcells to specialize in dispersion and virulence. In contrast, cells that do not achieve the AgrA~P expression threshold needed to induce the positive feedback mechanism will not induce P3 promoter expression. In these cells, genes normally repressed by AgrA~P will be upregulated, including biofilm-related genes, which licenses cells to differentiate as biofilm-producing BRcell types.
To determine whether activation of the agr positive feedback loop is sufficient to generate bimodality in a bacterial population, we genetically engineered an orthogonal agr system in B. subtilis in which the agr positive feedback loop was isolated from its native complex regulatory network (Audretsch et al., 2013) and thus exempt from interference from additional staphylococcal regulatory inputs. In this orthogonal system, B. subtilis harbored Ppsmα-yfp or Ppsmβ-yfp reporters and expressed the membrane kinase AgrC and its cognate regulator AgrA under the control of the AgrA-inducible P2 promoter (Figure 2A). The orthogonal system does not express staphylococcal σB, and σB from B. subtilis did not interfere with the agr system, since we detected similar reporter expression in wild type (WT) and ΔsigB strains (Figure 2—figure supplement 1A), ensuring the absence of the agr inhibitory input signal. We used this orthogonal system to identify the minimal components necessary for bimodal expression of agr-related genes, using psmα/β expression as readout for agr activity (Figure 2B) (Zhang et al., 2015). Activation of the agr positive feedback loop in the orthogonal system requires addition of purified AIP (10 μM) to B. subtilis cultures (AIP contains a thiolactone ring thus it cannot be synthetically produced). AIP addition activates AgrC sensor kinase, which phosphorylates the AgrA regulator. The AgrA~P active form binds the P2 promoter to express high AgrA~P levels and activate the positive feedback loop; this resulted in bimodal expression of chromosomally integrated Ppsmα-yfp or Ppsmβ-yfp reporters, with a cell subpopulation in which reporter expression increased during a transition in which cells switched from off to on. In contrast, chromosomally integrated Pica-yfp and Pspa-yfp reporters, which are not controlled directly by the AgrA~P, did not activate in response to added AIP. In a similar manner, we did not detect fluorescence in control experiments with strains lacking the AgrC-AgrA system, or when no AIP was added (Figure 2B and Figure 2—figure supplement 1A), demonstrating that stochastic expression of these reporter genes does not account for bifurcation of the cell populations. These results indicate that the minimal agr genetic program harbored in the orthogonal system acts as an autonomous program for cell differentiation in bacterial populations.
Figure 2 with 1 supplement see all
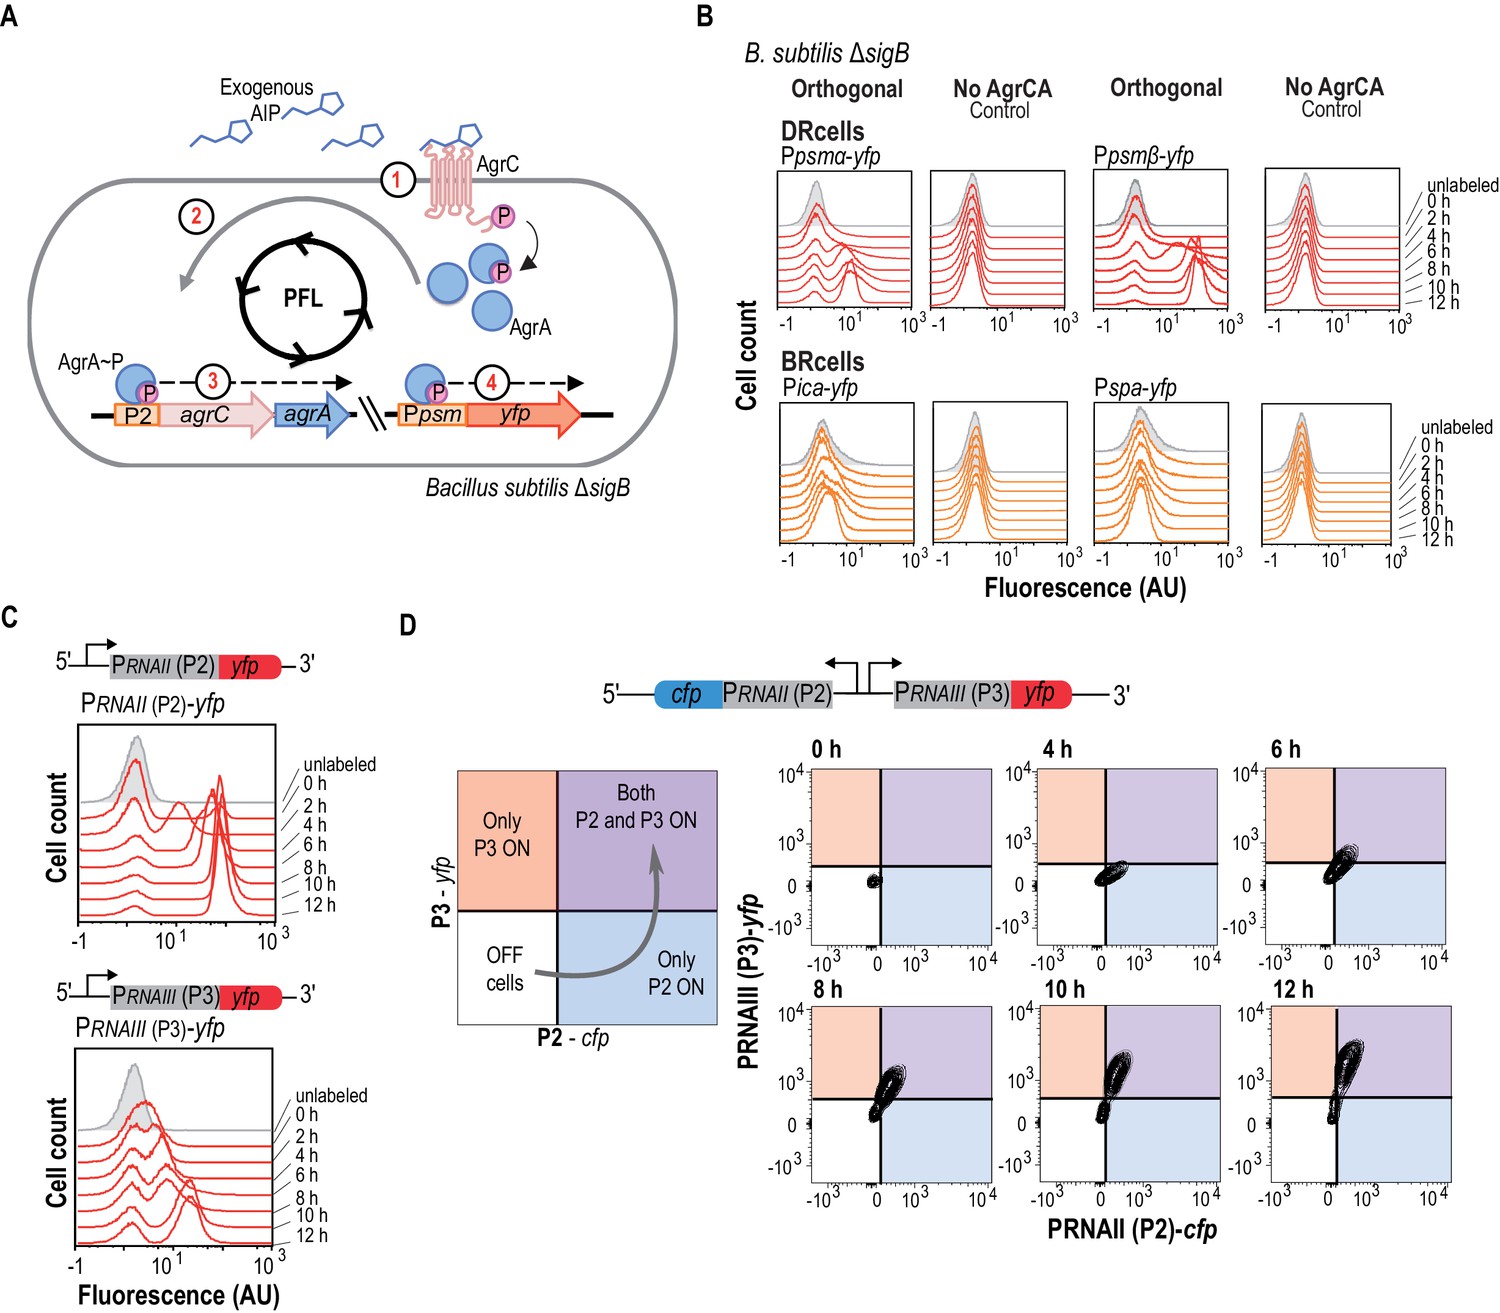
The agr QS system is an autonomous program for cell fate decision-making.
(A) Scheme showing the orthogonal system generated in Bacillus subtilis. In this system, the membrane kinase AgrC and its cognate regulator AgrA were expressed under the control of their own P2 promoter. This strain also harbors a Ppsmα-yfp or a Ppsmβ-yfp reporter, which allows monitoring agr activation. Addition of purified AIP to B. subtilis cultures as input signal activated the agr system and led to bimodal expression of chromosomally integrated Ppsmα- or Ppsmβ-yfp reporters. (B) Flow cytometry profiles of the orthogonal agr system in B. subtilis showing bimodal expression of the agr-dependent psmα/β reporters at different times after AIP induction. Control panels show no expression of these reporters without the AgrCA chimera. The ica/spa promoters were not activated, as they are not regulated directly by AgrA~P (Recsei et al., 1986; Boles and Horswill, 2008; Peng et al., 1988). Cultures were grown in liquid LB medium and incubated (37°C, 12 hr, 200 rpm agitation). (C) Flow cytometry showed bimodal expression of P2 (up) and P3 (down) promoters after AIP induction. Cultures were grown in liquid LB medium and incubated (37°C, 12 hr, 200 rpm agitation). (D) Flow cytometry monitoring simultaneous expression of PRNAII or P2 (y-axis) and PRNAIII or P3 (x-axis) in a population of P2-cfp P3-yfp double-labeled cells cultured with AIP (10 μM). Samples were collected at various times and represented in a 2D graph (x axis, CFP signal; y axis, YFP signal). Dual system at various times after AIP induction. Isolines in the graph represent cell populations. The subpopulation that initially expressed the P2-cfp reporter was the same as that which later expressed the P3-yfp reporter.
Identification of the molecular mechanism that leads agr to act as an autonomous program to define cell fate bifurcation in S. aureus required analysis of the agr-signaling cascade in the presence of AIP. We therefore generated two additional orthogonal systems to monitor P2 (PRNAII-yfp) and P3 (PRNAIII-yfp) activation independently (Figure 2C). In response to exogenous AIP (10 μM), these systems showed a transition period during which P2 and P3 cells switched on after which subpopulation sizes remained constant. The P2-expressing cell subpopulation differentiated earlier, however, and showed a more intense fluorescence signal in a larger cell subpopulation over time compared to the orthogonal system that differentiated P3-expressing cells. This result suggests that P2 promoter is more sensitive than P3 to agr activation, a characteristic feature of positive feedback loops in bimodal systems (Siebring et al., 2012). Based on these results, we hypothesized that the bimodal behavior of agr and thus, cell differentiation in S. aureus, relies on the differential affinity of AgrA~P for P2 and P3 promoters. P2 thus activates the feedback loop at lower AgrA~P concentrations and only in a subpopulation of cells. These cells contain high AgrA~P levels, which licenses them to trigger the less-sensitive P3 promoter and induce the agr regulon, leading the cells to specialize in dispersion and virulence and become DRcells. Cells that express P2 below the threshold cannot activate the agr feedback loop and are thus unable to induce P3 promoter expression. In this subpopulation, agr-repressed genes are upregulated, including genes involved in biofilm formation, which licenses them to differentiate as BRcells.
We tested this hypothesis by first analyzing the dynamics of the agr positive feedback loop using mathematical modeling coupled to computational simulations (Figure 2—figure supplement 1B–E) (Chong et al., 2014; Golding et al., 2005). The full network dynamics remained constant, since the orthogonal system was similar for all promoters tested. We optimized the promoter-specific rates; Kon (association) and Koff (dissociation) denote interaction with AgrA~P and Kt denotes reporter transcription (Figure 2—figure supplement 1B) (Goñi-Moreno et al., 2016). The correct combination of these promoter rates sufficed to explain bimodal fluorescence distribution. Although the simulations considered AgrA~P saturation, we consistently detected bimodal reporter expression, with on and off cell subpopulations always present. Simulations favored a model in which P2-activated positive feedback loop induces P3-driven bimodal expression in response to AIP concentration or autoactivation time (Figure 2—figure supplement 1C–E), suggesting that DRcells resulted from sequential P2 and P3 promoter activation.
We tested this model experimentally in a dual orthogonal system harboring P2 (PRNAII-cfp) and P3 (PRNAIII-yfp) reporters expressed as two adjacent transcriptional units transcribed in opposite directions, similar to the chromosomal organization in the S. aureus genome (Figure 2D and Figure 2—figure supplement 1F). We used flow cytometry analysis with simultaneous detection of CFP and YFP signals to determine quantitatively whether the P2-expressing subpopulation becomes P3-expressing cells over time after AIP addition (10 μM). At 4 hr post-AIP induction, we detected a cell subpopulation that expressed P2; a fraction of this subpopulation activated P3 at later times (6 hr). The subpopulation of P3-expressing cells increased over time until it expressed P2 and P3 promoters uniformly. Cells that expressed only the P3 promoter were not detected. This is consistent with our hypothesis that P2-mediated activation of the agr positive feedback loop is necessary to increase AgrA~P levels, which in turn induces expression of the less-sensitive P3 promoter in these cells. The molecular mechanism for bimodal gene expression thus relies on the differential AgrA~P affinity for P2 and P3 promoters. P2 is very sensitive and triggers the agr positive feedback loop, whereas P3 induces expression of virulence genes and is necessary for DRcell specialization. In the following section, we used this information to demonstrate that the self-regulatory activity of AgrA~P via binding to the P2 promoter is essential for triggering S. aureus cell differentiation while other additional cues that feed into the agr switch only modulate the activity of the system.
Increase in cell wall rigidity activates σB, repressing the agr positive feedback loop
Once the agr switch responsible for BRcell and DRcell differentiation is activated, distinct extracellular cues can arise from the niche to feed into the agr bimodal switch and modulate its activity. For instance, BRcell and DRcell subpopulations are detected at different ratios in TSB and TSBMg cultures. We hypothesized that variations in extracellular input signals would affect agr bimodal behavior and produce distinct outcomes in the bimodal system. This would define a distinct DRcell:BRcell ratio, which could have important clinical implications for the definition of infection outcomes. As the difference between TSB and TSBMg media resides in Mg2+ supplementation, we tested the effect of extracellular Mg2+ on the response of the agr-repressor σB, which is activated by environmental stresses. In TSBMg medium, qRT-PCR analysis showed increased expression of the σB-dependent stress gene asp23 (alkaline shock protein) (Gertz et al., 2000) (Figure 3A) and of staphyloxanthin, the pigment that gives S. aureus its typical yellow color and whose expression is regulated directly by σB (Gertz et al., 2000; Giachino et al., 2001) (Figure 3—figure supplement 1A). TSBMg medium also induced biofilm formation (Figure 3B). Biofilm formation likely occurred via agr inhibition because the ΔsigB strain did not form biofilm and the biofilm formation phenotype was partially recovered in a ΔsigBΔagr double mutant (Figure 3C). Thus, the Mg2+ signaling cascade acts on agr downregulation via σB activation to increase BRcell subpopulation size. This is consistent with the fact that biofilm-associated S. aureus colonization generally occurs in Mg2+-enriched niches such as bone and kidney, in which chronic staphylococcal infections often develop (Günther, 2011; Jahnen-Dechent and Ketteler, 2012; Elin, 2010). By contrast, tissues unintentionally depleted of Mg2+ are prone to acute staphylococcal infections, as Mg2+ sequestration from tissues due to tampon use was associated with an outbreak of staphylococcal toxic shock syndrome in women in the USA (Parsonnet et al., 1996; Schlievert, 1985).
Figure 3 with 1 supplement see all

Extracellular Mg2+increases cell wall rigidity in S. aureus.
(A) qRT-PCR assay to monitor σB activation using relative asp23 expression as readout (expression of this gene is dependent on σB activity) in TSB and TSBMg cultures of S. aureus strains of different genetic backgrounds. The ΔdltA mutant was used as control strain to show reduced asp23 expression in TSB and increased expression in TSBMg. (B) Biofilm formation quantification in S. aureus strain Newman wild type strain using the traditional microtiter assay (O'Toole and Kolter, 1998b) in liquid TSBMg and TSB. (C) Biofilm formation quantification in different S. aureus genetic backgrounds using the traditional microtiter assay (O'Toole and Kolter, 1998b) in liquid TSBMg and TSB. The ΔsigB strain did not form biofilm in TSBMg and the biofilm formation phenotype was partially recovered in a ΔsigBΔagr double mutant. (D) Atomic force microscopy quantification of S. aureus cell surface rigidity (in KPa). Mean surface rigidity was measured using force-indentation curves and Young’s modulus. Best fits were produced with a modified Hertz model, assuming conical punch probe geometry. The ΔdltA mutant serves as positive control, as described (Saar-Dover et al., 2012). In this mutant, D-alanine esterification of TA is absent (Perego et al., 1995). D-alanylation of TA introduces positively charged amines and prevents repulsive interactions between neighboring ribitol phosphates, which increases cell wall rigidity, similar to the effect of Mg2+ incorporation to the cell wall. Cell wall rigidity was therefore compromised in the Δdlt mutant when grown in TSB medium. (E, F) Quantification of biofilm formation in liquid TSBMg and TSB of S. aureus WT, low-tagB (E) and high-tagB strains (F). All experiments show the mean ±SD for three independent experiments (n = 3). Statistical significance was measured using unpaired Student's t-test for panel (A); for remaining panels, we used one-way ANOVA with Tukey's test for multiple comparisons. *p<0.05, **p<0.01, ***p<0.001; ns, no significant differences.
We were prompted to analyze the molecular mechanism whereby extracellular Mg2+ regulates the agr bimodal switch and increases the BRcell subpopulation. Biofilms occur in TSB supplemented with Mg2+ but not with other cations (Koch et al., 2014), which suggested that Mg2+ is a specific extracellular trigger for BRcell differentiation. Mg2+ has a function in stabilizing the Gram-positive bacterial cell wall, which is decorated with phosphate-rich teichoic acids (TA) that contribute to membrane integrity (Heptinstall et al., 1970). To alleviate electrostatic repulsive interactions between neighboring phosphates, TA preferentially bind Mg2+ cations, to form a consolidated network that strengthens cell envelope rigidity (Heckels et al., 1977; Lambert et al., 1975a; Swoboda et al., 2010). We therefore hypothesized that Mg2+ in TSBMg stabilizes S. aureus TA and increases cell wall rigidity, which cues σB activation. We tested this hypothesis using atomic force microscopy (AFM) to monitor S. aureus cell wall structural rigidity in vivo, comparing single cells grown in TSB and TSBMg media (Figure 3D) (Saar-Dover et al., 2012; Touhami et al., 2004). AFM detects forces acting between a sharp nanoscale cantilever and the bacterial cell wall; after pressure, the cantilever deflects and force can be quantified (Dufrêne, 2014; Formosa-Dague et al., 2016). We detected greater rigidity in cells grown in TSBMg medium than those grown in TSB medium. The ΔdltA mutant was used as control, since the DltA-E machinery is responsible for D-alanylation of TA, which introduces positively charged amines and thus prevents repulsive interactions between neighboring TA (Perego et al., 1995), similar to the effect of Mg2+ incorporation in the cell wall. AFM confirmed that the absence of positive charges reduces cell wall rigidity in the ΔdltA control in regular TSB, as reported (Saar-Dover et al., 2012). In Mg2+-enriched growth conditions, extracellular Mg2+ binding complemented the cell wall rigidity defect in this mutant, as TA-coordinated Mg2+ provided cell wall rigidity in the absence of the Dlt machinery. Our AFM measurements showed greater cell wall rigidity in Mg2+-enriched growth conditions in the ΔdltA mutant (Figure 3D), comparable to the wild type strain. These experiments indicate that extracellular Mg2+ is incorporated to cell wall TA to increase cell wall rigidity.
Staphylococcus aureus cell wall TA are essential for a response to extracellular Mg2+, which increases BRcell subpopulation size and thus induces biofilm formation in TSBMg. In these conditions, cells treated with sublethal doses of tunicamycin, which inhibits TarO and thus teichoic acid synthesis at low concentrations (Swoboda et al., 2010; Campbell et al., 2011; Nunomura et al., 2010; Swoboda et al., 2009), did not respond to Mg2+ and biofilm formation was inhibited (Figure 3—figure supplement 1B). Based on these findings, we genetically engineered S. aureus strains that down- and upregulate genes related to TA biosynthesis, such as tagB (Figure 3—figure supplement 1), verified tagB down- and upregulation in these strains by qRT-PCR (Figure 3—figure supplement 1C), confirmed that these strains show no significant defects in growth or peptidoglycan synthesis (Figure 3—figure supplement 1D,E) and tested their ability to form biofilms in TSBMg (Figure 3—figure supplement 1F). Strains with reduced tagB expression did not respond to Mg2+ and thus did not develop biofilms (low-tagB strain) (Figure 3E). In contrast, strains with upregulated tagB became hypersensitive to extracellular Mg2+ and produced more robust biofilms (high-tagB) even with Mg2+ traces that are present in regular TSB medium (Figure 3F). We next tested whether the TA-mediated increase in cell wall rigidity downregulates agr bimodal behavior via σB activation. To study this, we used qRT-PCR analysis to quantify the relative expression of the σB target-gene asp23 and staphyloxanthin quantification to determine σB activation in low- and high-tagB strains (Figure 3A and Figure 3—figure supplement 1G). The low-tagB strain responded more weakly to extracellular Mg2+ than the high-tagB strain, with limited σB activation in both TSB and TSBMg conditions. In contrast, the high-tagB strain was hypersensitive to extracellular Mg2+, with higher σB activation than the other strains in TSB.
These results are consistent with our hypothesis that extracellular Mg2+ stabilizes TA, increases cell wall rigidity and triggers the σB inhibitory signal responsible for downregulating the agr bimodal switch. Once the agr switch is activated, variations in the concentration of these types of input signals affect switch activity and modulate the size of the two subpopulations. For instance, Mg2+ in the colonization niche acts as a downregulatory signal, as it induces σB; activation of the agr switch becomes more difficult in these conditions and DRcell subpopulation size is reduced (Figure 4A). However, since this cue neither generates nor abolishes the agr positive feedback loop, but only modulates its activity, its effect would be restricted to varying the BRcell:DRcell ratio.
Figure 4
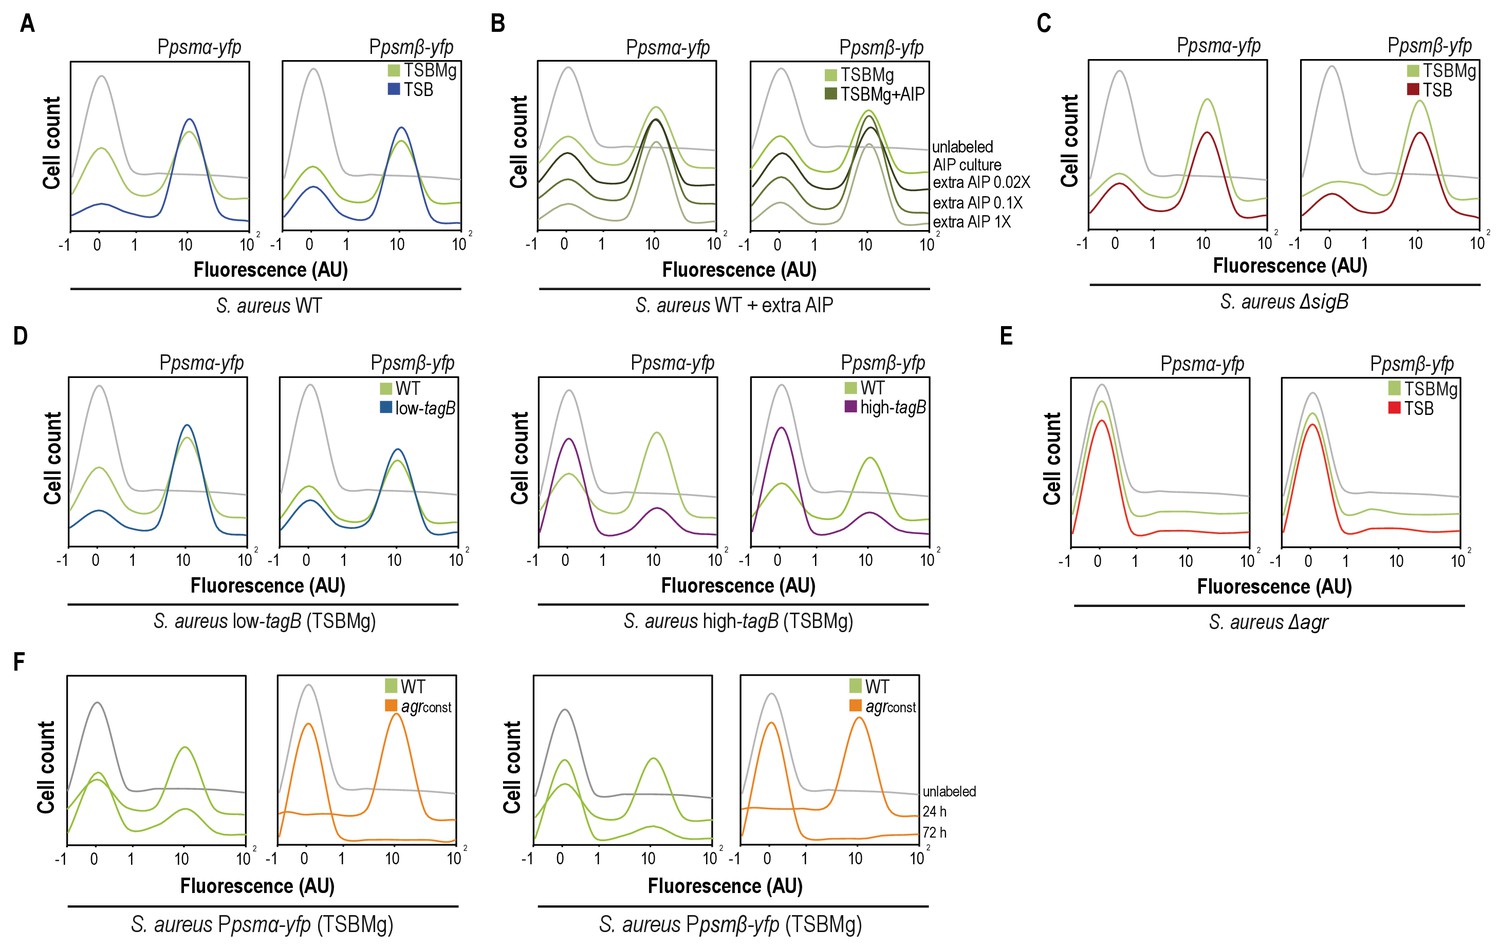
AIP and Mg2+modulate the BRcell:DRcell ratio in S. aureus communities.
(A) Quantitative analysis of fluorescence microscopy images of agr-related promoters (Ppsmα and Ppsmβ) in TSBMg and TSB. We counted ~700 random cells from each of three independent microscopic fields from independent experiments (~2100 cells total for each strain). In the absence of extracellular Mg2+, the proportion of DRcells increases in the staphylococcal community, in accordance with the role of Mg2+ in repression of agr via σB. (B) Quantitative analyses of fluorescence microscopy images (n = 2100) of agr-related promoters in TSBMg with different concentrations of exogenous AIP1 (0.02x to 1x). Increasing AIP1 concentrations above threshold upregulates the agr bimodal switch and increases DRcell subpopulation size, although both on and off subpopulations are always detected (‘AIP culture’=no exogenous AIP, equivalent to the 10 μM threshold concentration). (C) Quantitative analyses of fluorescence microscopy images (n = 2100) of agr-related promoters of S. aureusΔsigB mutant in TSBMg and TSB. The ΔsigB mutant shows upregulation of the agr bimodal switch and differentiates a larger DRcell subpopulation. (D) Quantitative analysis of fluorescence microscopy images (n = 2100) of agr-related promoters in TSBMg and TSB, using engineered S. aureus strains that produce different TA levels (low-tagB and high-tagB). The differential sensitivity of these strains to extracellular Mg2+ alters the proportion of DRcells within S. aureus aggregates. (E) Quantitative analyses of fluorescence microscopy images (n = 2100) of agr-related promoters of S. aureusΔagr mutant in TSBMg and TSB. The Δagr mutant lacks the bimodal switch that triggers cell differentiation. (F) Quantitative analysis of fluorescence microscopy images (n = 2100) of agr-related promoters in TSBMg, of S. aureus WT and a strain engineered to express the agrBDCA operon under the control of a constitutive promoter (agrconst); this disrupted the positive feedback loop, as the promoter that activates agr expression is no longer self-inducible. In the absence of a functional agr positive feedback loop, cell differentiation was not detected and Ppsmα and Ppsmβ reporter expression was homogeneous throughout the bacterial population.
To substantiate this concept, we used quantitative analysis of fluorescence microscopy images and flow cytometry to monitor S. aureus cell differentiation in the presence of extracellular cues that influence the bimodal switch behavior (AIP excess and σB activation). Purified AIP was added to Ppsmα-yfp or Ppsmβ-yfp reporter strain cultures at various concentrations above threshold concentration of ~10 μM usually found in cultures, which caused differentiation of a DRcell subpopulation that increased in parallel with AIP concentration but cell heterogeneity nonetheless remained detectable in cultures (Figure 4B). When we analyzed downregulation of the bimodal switch, WT cultures in Mg2+-enriched growth conditions had a smaller DRcell subpopulation (Figure 4A), whereas the ΔsigB mutant in TSB and TSBMg media differentiated a larger DRcell subpopulation than the WT strain (Figure 4C). Nevertheless, in both cases BRcell and DRcell differentiation was detected in the ΔsigB mutant. Similarly, the low- and high-tagB strains, which are hypo- and hypersensitive to extracellular Mg2+, showed larger and smaller DRcell subpopulations, respectively, in TSBMg (Figure 4D) although both subpopulations were detected.
According to the information we obtained using the agr orthogonal system and to confirm that the only means by which to lead the system into unimodal gene expression is by disrupting the agr positive feedback loop, we monitored DRcell differentiation in the Δagr strain. In this strain, expression of Ppsmα-yfp or Ppsmβ-yfp labeled reporters was not detected thus cell differentiation was inhibited in both TSB and TSBMg media (Figure 4E). Results from our orthogonal system pointed that the feedback loop activation mechanism relies on AgrA~P binding to the P2 promoter to turn on positive self-regulation of the agr operon, thus we monitored cell differentiation in a S. aureus strain in which P2 was replaced with a constitutive promoter (Figure 4F). This strain does not have an active positive feedback loop, as the promoter that activates agr expression is no longer self-inducible. We monitored DRcell differentiation using Ppsmα-yfp or Ppsmβ-yfp reporter strains. In the absence of a functional agr feedback loop, we detected no cell differentiation and reporter expression was homogenous throughout the bacterial population. These results show that the agr positive feedback loop must be active to trigger cell differentiation, and that its activity is regulated by additional input cues that change the ratio of the specialized subpopulations.
BRcells and DRcells organize spatially and are physiologically distinct cell types
Given that local Mg2+ and AIP concentrations modulate agr switch activity, we explored spatial organization of cell types during colony development, as reported for other bacteria (Yarwood et al., 2007). We developed a mathematical model that considers these factors in the context of nutrient availability and bacterial growth, and delineates growth of multicellular aggregates as a non-linear reaction-diffusion equation system (Figure 5A and Figure 5—figure supplement 1A) (Hense et al., 2012). Based on the morphological traits of the multicellular aggregates in different genetic backgrounds (Figure 5—figure supplement 1B–G), the model predicted that as an aggregate grows and expands, nutrients become limited in the older, central biofilm region, which has higher AIP levels and slow-dividing cells, which increases representation of the DRcell subpopulation. We sectioned mature aggregates into concentric, morphologically distinct regions and analyzed DRcell and BRcell subpopulation size by flow cytometry (Figure 5B and Figure 5—figure supplement 2A). In accordance with the mathematical predictions, the most peripheral region had a larger proportion of BRcells and a smaller proportion of DRcells. DRcells were enriched in the aggregate center. We combined cryosectioning and confocal microscopy to determine subpopulation size and location within the inner zones of thick biofilms (Figure 5C and Figure 5—figure supplement 2B). BRcells were highly represented in regions near the aggregate outer edge, where nutrient concentration is high (Cramton et al., 2001), whereas DRcell representation was more prominent in the biofilm inner region, further from the nutrient source. These experiments showed enrichment of BRcells in newer and of DRcells in older biofilm regions, suggesting that the staphylococcal cells respond differently to local input signal concentrations, and differentiate distinct DRcell:BRcell ratios in different biofilm regions.
Figure 5 with 2 supplements see all
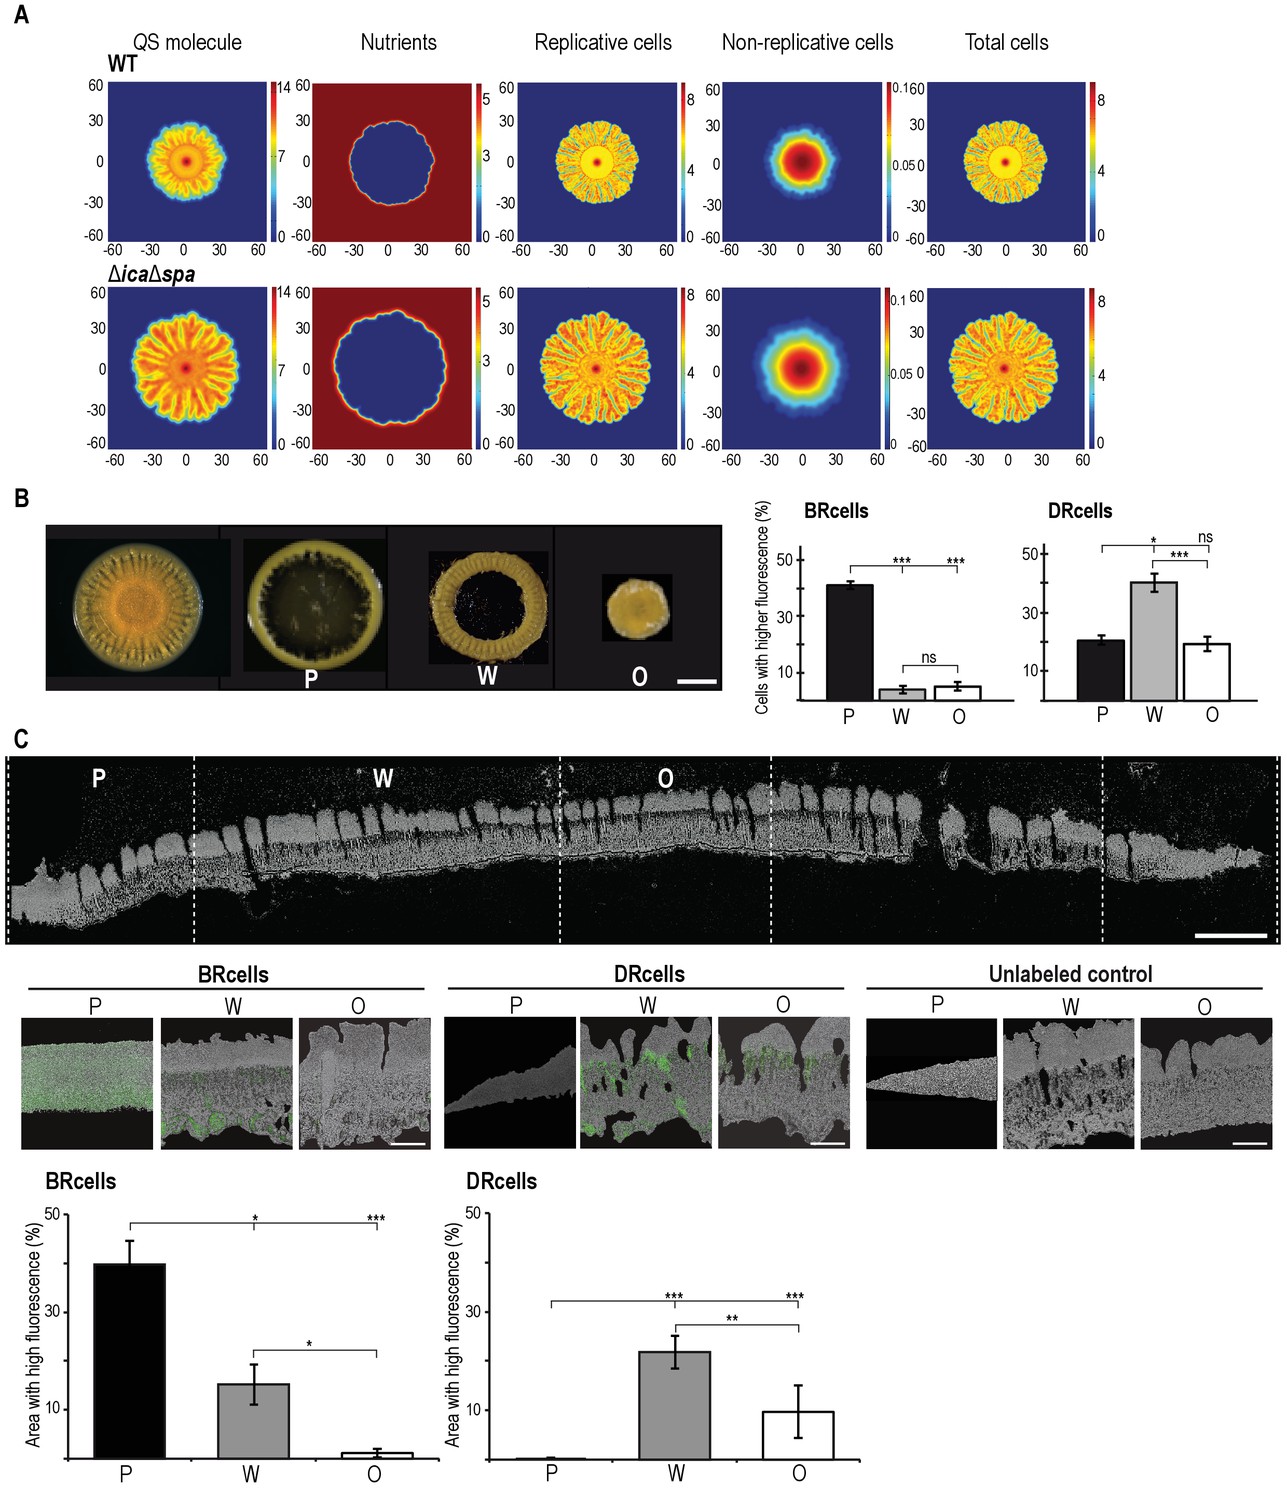
Collective behavior of BRcells and DRcells in vitro.
(A) Mathematical modeling of WT and a matrix-deficient mutant (ΔicaΔspa) S. aureus growth in multicellular aggregates. Local concentrations of factors that affect AIP activity are represented on a color scale. (B) Left, dissection of a 5 day multicellular aggregate into three distinct, concentric morphological regions, a peripheral region (P), a surrounding wrinkled area (W) and a central older region or origin (O); each one can be separated from the aggregate and processed independently. Bar = 5 mm. Right, quantitative analysis of flow cytometry data for BRcells and DRcells in concentric regions of a mature aggregate (n = 50,000). (C) Top, longitudinal-transverse cryosection of a mature S. aureus aggregate. Bar = 500 μm. Center, spatial distribution of BRcells and DRcells within the aggregate. Bar = 100 μm. Bottom, quantitative estimate of BRcells (ica and spa reporters) and DRcells (Ppsmα and Ppsmβreporters) fluorescent area over the total thin section aggregate area in representative images (see Material and methods for quantification details). Statistical significance was measured using one-way ANOVA and Tukey's test for multiple comparisons. *p<0.05, **p<0.01, ***p<0.001; ns, no significant differences. Data shown as mean ±SD of three independent experiments (n = 3).
To study the potential physiological specialization of BRcell and DRcell types beyond the differential expression of agr-regulated reporters, we determined their transcriptional profiles using Illumina RNA-sequencing after enrichment by fluorescence-activated cell sorting (Figure 6 and Figure 6—figure supplement 1). We grew separate mature aggregates of the strains labeled with the Ppsmα-yfp and Pica-yfp reporter fusions to identify the DRcell and BRcell subpopulations, respectively. Fluorescent cells from mature aggregates were sorted from the rest of the cell population; both fluorescent cells (enriched) and whole cell community (non-enriched) were collected simultaneously in separate samples. Genome-wide analysis showed similar genetic landscapes for DRcell and BRcell subpopulations, indicating that cell differentiation is not the result of accumulated mutations (Figure 6—source data 1). RNA was purified from each sample prior to Illumina Hi-seq RNA sequencing. The total number of reads allowed mapping of ~96% to the S. aureus genome (Figure 6—figure supplement 2A–B). Comparison of the normalized gene expression profiles (Figure 6A, Figure 6—figure supplement 2C and Figure 6—source datas 2–4) and qRT-PCR validation (Figure 6—figure supplement 2D–E) showed marked differences between the enriched subpopulation and its non-enriched counterpart, which suggested that a specific physiological state could be attributed to each particular cell type.
Figure 6 with 2 supplements see all
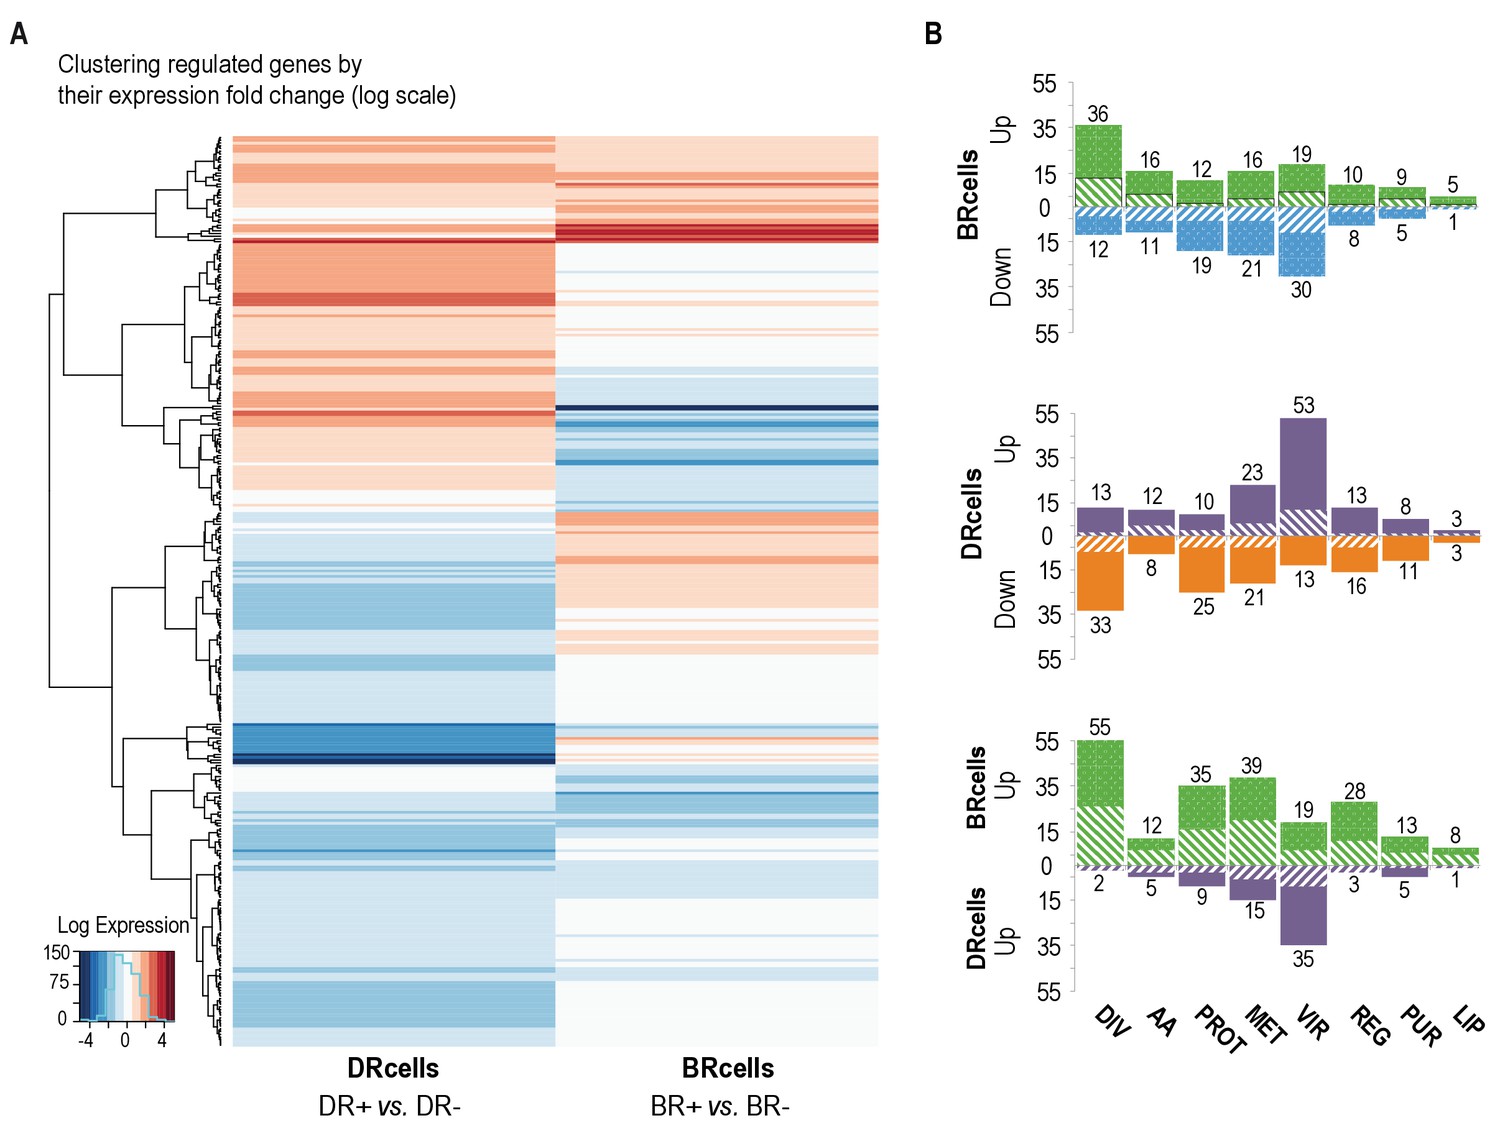
BRcell and DRcell subpopulations have different gene expression profiles.
(A) Unsupervised hierarchical clustering of commonly expressed genes differentially regulated in at least one of the libraries shows a specific, divergent expression profile for BRcells and DRcells. Color scales represent log2 fold-changes for differential expression. Clustering was carried out on the regulated genes (minimum fold-change 2) with Ward hierarchical biclustering using the heatmap.2 command in the ggplots package of the R programming language on Euclidean distances. This approach successfully grouped the common genes, which are upregulated (orange) in both sets of libraries, and far from the cluster of downregulated genes (blue). The third set of genes was identified based on this clustering (in the center of the heatmap), which showed library-specific phenotypes (upregulated in one library and downregulated in the other. (B) Classification of the differentially expressed genes using TIGRfam, SEED and Gene Ontology (GO) functional categories, followed by manual curation. For each category, solid and dashed columns represent the number of regulated genes from DESeq analysis using the raw read threshold of >8 and >25, respectively. DIV, DNA replication, cell envelope and cell division; AA, amino acid synthesis; PROT, protein synthesis and processing; MET, energy and intermediary metabolism; VIR, virulence, binding and transport; REG, regulation, transcription and signal transduction; PUR, purines, pyrimidines, nucleotides and nucleosides; LIP, lipid metabolism.
-
Figure 6—source data 1
Genome-wide analysis of DRcell and BRcell sorted subpopulations.
Library specific variations are 0, showing that no statistically significant genetic differences were found between BRcells and DRcells genomes.
- https://doi.org/10.7554/eLife.28023.016
-
Figure 6—source data 2
Gene quantification and differential expression analysis of BRcells and DRcells.
This data table contains the table for gene-wise quantification calculated for different cDNA libraries used in this study. DESeq analysis data for library comparisons.
- https://doi.org/10.7554/eLife.28023.017
-
Figure 6—source data 3
Functional classification of annotated genes.
Gene Ontology classification of annotated genes that showed significant log2fold change value for differential expression generated by DESeq analysis. Aureowiki functional classification of the annotated genes that showed significant log2fold change value for differential expression generated by DESeq comparison analysis.
- https://doi.org/10.7554/eLife.28023.018
-
Figure 6—source data 4
Hypergeometric analysis for library comparison comprising the log2fold values for differentially expressed genes that were shown to be expressed by DESeq analysis comparison of DRcells+ against BRcells+ sample sets.
Hypergeometric analysis probability and hypergeometric analysis heatmap comparison.
- https://doi.org/10.7554/eLife.28023.019
BRcells had a large number of upregulated genes, including sigB sigma factor, and of many biofilm-related genes as well as genes related to peptidoglycan turnover, cell division and DNA replication. In addition, 49 tRNAs were upregulated, which indicates the higher metabolic activity of BRcells and their physiological predisposition to proliferation (Figure 6B and Figure 6—figure supplement 2D). DRcells showed a smaller number of upregulated genes, which we attributed to lower gene expression activity potentially due to the lower physiological activity of this cell type. Among the few upregulated genes detected, we found a notable number related to toxin secretion and host invasion, such as the type-VII secretion system (Burts et al., 2005), as well as genes related to protecting bacterial cells from the immune system, such as the hssRS-htrAB hemin detoxification system (Stauff et al., 2007). We also detected upregulation of multi-drug efflux pumps that confer resistance to diverse antimicrobials, and of regulators such as graR and arsR, which positively control gene-related cell-wall antibiotic resistance and metal ion stress (Figure 6B and Figure 6—figure supplement 2E). In contrast, the expression of selected housekeeping genes in aggregates growing in TSBMg and TSB showed no differences (Figure 6—figure supplement 2F), suggesting that extracellular Mg2+ specifically influences the agr bimodal switch pathway rather than causing a global deregulation of gene expression. These results suggest that the DRcell subpopulation has lower metabolic activity than BRcell and is predisposed to resist different types of antimicrobials.
BR and DR cell fates arise during in vivo infections
An important question arises from the physiological differences detected between BRcells and DRcells in vitro, concerning the role and impact of these cell types during progression of S. aureus infections. We found that extracellular Mg2+ is an input signal that regulates agr activity and modulates the sizes of specialized cell subpopulations in vitro, and hypothesized that a similar correlation could be found in vivo, that is, that different tissue Mg2+ concentrations would lead to distinct subpopulation ratios and distinct infection outcomes. To address this question, we developed an infection model (Koch et al., 2014) in which mice were intravenously infected with 107colony forming units (CFU) of cells labeled with Pica-yfp (BRcells) or Ppsmα-yfp (DRcells) reporters. Infections were allowed to progress for four days, after which mice were sacrificed and the infected organs collected (Figure 7 and Figure 7—figure supplement 1).
Figure 7 with 3 supplements see all
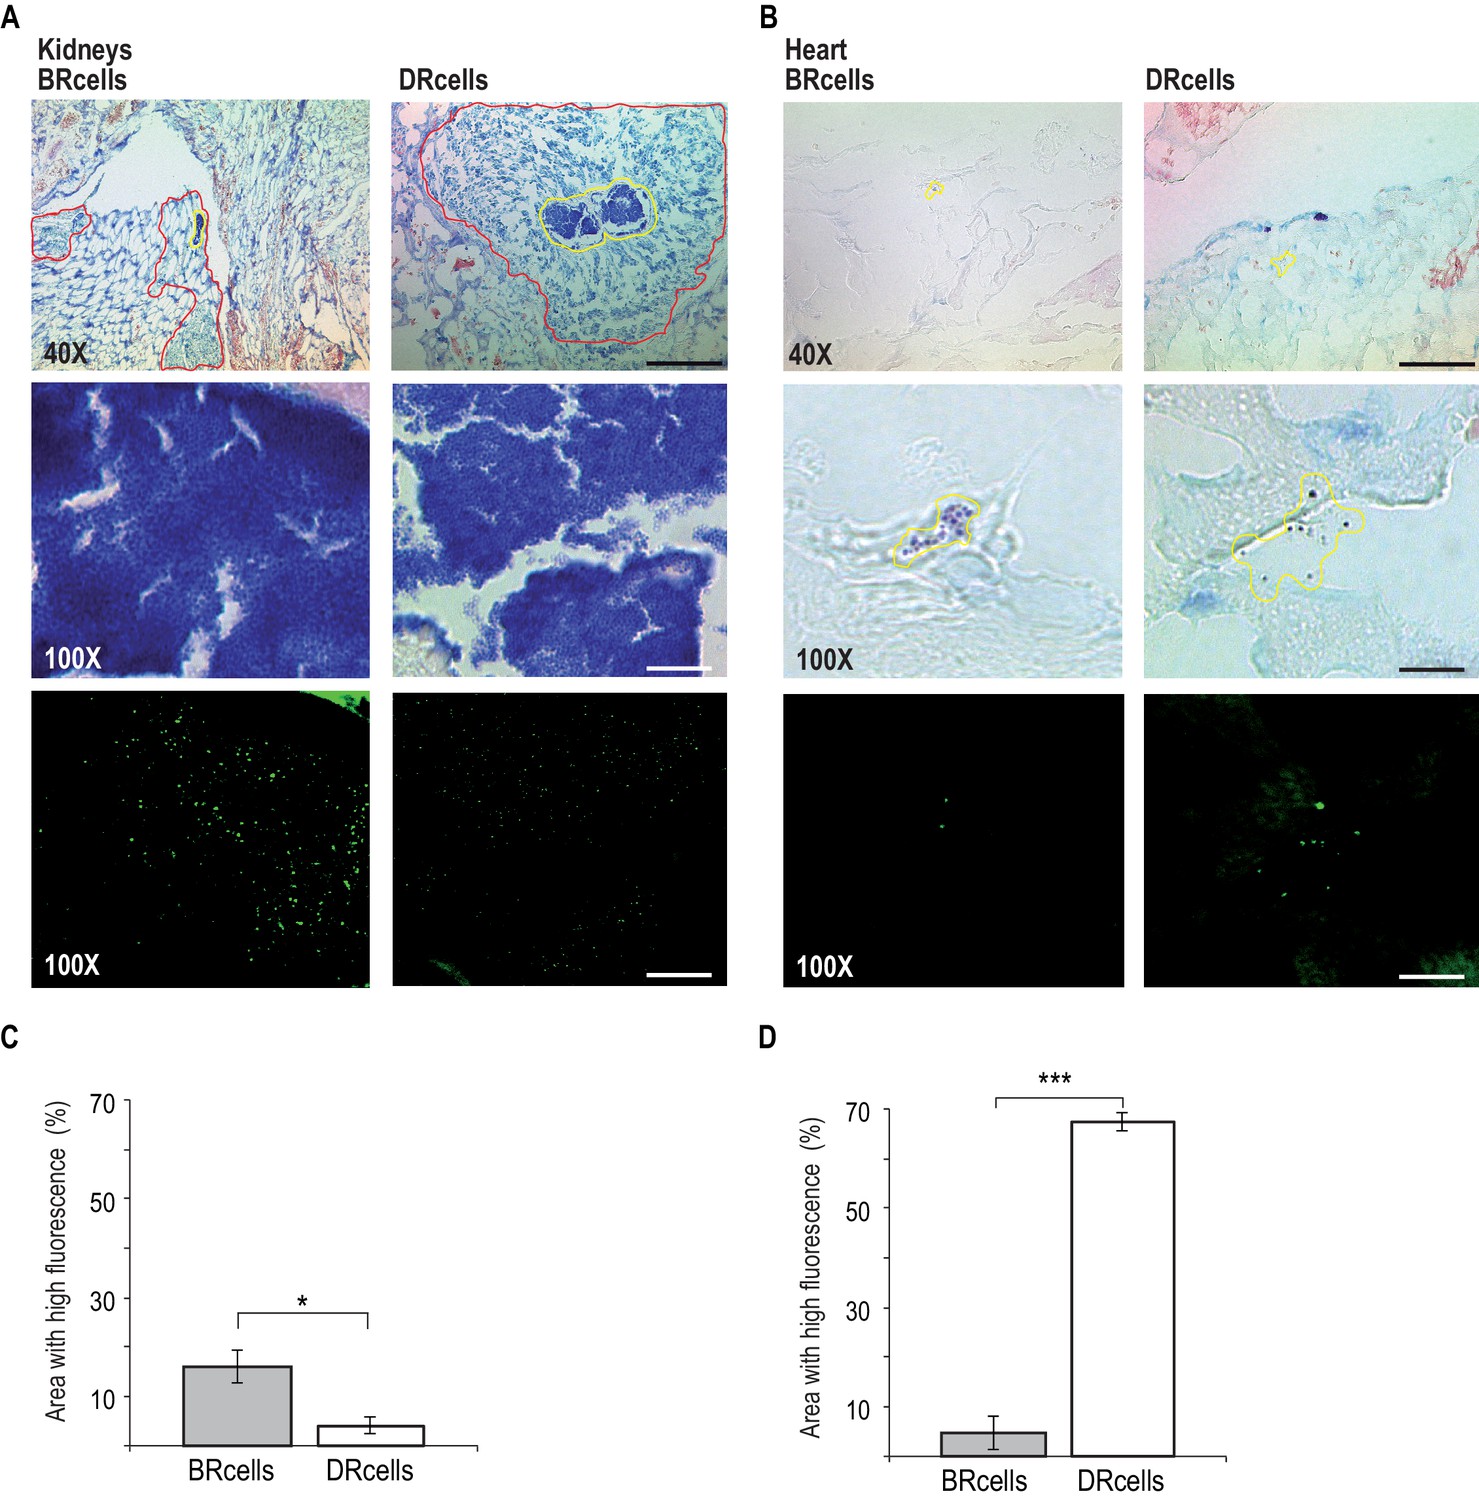
BRcells are more represented in infected kidneys and DRcells are more represented in infected hearts.
Histological preparations of infected kidneys (A) or hearts (B) stained with Giemsa solution and visualized using light microscopy. Upper row, 40X magnification of the preparation. Bar = 50 μm. The area delineated in red corresponds to the immune cell infiltrates that surround bacterial aggregates in infected kidneys. The area delineated in yellow corresponds to the bacterial aggregates surrounded by immune cell infiltrates in infected kidneys or, to dispersed S. aureus cells in the case of infected hearts. This area is magnified at 100X in central row. Central row, compact aggregates of S. aureus cells can be seen in dark blue. Bar = 20 μm. Bottom row, confocal fluorescence microscopy images of the bacterial populations imaged in row 3. Right, monitoring of BRcell subpopulation using a Pica-yfp S. aureus labeled strain. Left, monitoring of DRcell subpopulation using a Ppsmα-yfp S. aureus labeled strain. Magnification, 100X. The fluorescence signal is shown in green. Bar = 20 μm. (C and D) Quantitative estimate of the relative fluorescent signal is shown as a percentage of the fluorescent area over the total bacterial aggregate area in the images. Statistical significance was measured by an unpaired, two-tailed Student’s t-test. *p<0.05. Data shown as mean ± SD of three independent measurements (n = 3) each one obtained from different infected organs.
The in vitro results correlated with the in vivo experiments; bacteria proliferated more efficiently in Mg2+-rich organs such as kidney. Infected kidneys showed a bacterial load of 1010 CFU/g of tissue (Figure 7—figure supplement 1A), and histological preparations of these organs showed large bacterial aggregates surrounded by immune cell infiltrates (Figure 7A, Figure 7—figure supplement 1B and Figure 7—figure supplement 3), indicative of long-term colonization during septicemia (Prabhakara et al., 2011). Confocal microscopy analyses showed approximately three-fold more BRcells than DRcells in kidney aggregates (Figure 7C Figure 7—figure supplement 2), similar to levels detected in in vitro experiments; this was consistent with reports that kidneys are Mg2+ reservoirs in the body (Günther, 2011; Jahnen-Dechent and Ketteler, 2012), and that 82% of patients with urinary catheterization develop long-term S. aureus infections (Muder et al., 2006).
On the other hand, infected hearts showed a bacterial load of 107 CFU/g of tissue (Figure 7—figure supplement 1A), which suggested that S. aureus cells that colonized heart tissues proliferated less actively than those in kidney. Infected hearts had a larger DRcell subpopulation, consistent with the lower metabolic activity, the lower proliferation rate of these cells in vitro and the lower Mg2+ concentration typically found in heart tissue (Günther, 2011; Jahnen-Dechent and Ketteler, 2012). Histological preparations of infected hearts revealed deposits of disperse cells with no immune cell infiltrates (Figure 7B, Figure 7—figure supplement 2 and Figure 7—figure supplement 3), which is indicative of acute bacteremia (McAdow et al., 2011). Confocal microscopy analysis showed that as much as 60% of the total heart tissue-colonizing bacterial population consists of DRcells (Figure 7D and Figure 7—figure supplement 2), as observed in in vitro experiments.
To further correlate the presence of extracellular Mg2+ with infection outcome, we performed infection studies using the suite of low- and high-tagB strains (Figure 8A). Kidneys showed a reduction in bacterial load when infected with the Mg2+-hyposensitive low-tagB strain, although this strain colonized heart tissues more efficiently than S. aureus WT. qRT-PCR analyses verified that these differences were associated with upregulation of key genes whose expression is restricted to DRcells (agrA, agrB and psmα/β), which suggests that infections with a low-tagB strain had marked representation of DRcells (Figure 8B–C). In contrast, the Mg2+-hypersensitive high-tagB strain was able to infect kidneys more efficiently than the WT strain, concomitant with a reduced infection of heart tissues. qRT-PCR analyses showed higher expression of genes related to BRcells (icaA, icaB and spa), which suggested that the high-tagB strain differentiated a larger subpopulation of BRcells. We generated a new strain derived from the high-tagB strain that also lacks σB. Higher TA content in this strain increases cell wall rigidity in response to Mg2+, but the lack of σB should prevent activation of biofilm formation via downregulation of agr. The infection pattern of this ΔsigB high-tagB strain resembled the low-tagB pattern in all the organs analyzed. Kidneys infected with this strain thus showed a reduction in bacterial load, while heart tissues were colonized more efficiently. qPCR analyses demonstrated higher expression of genes related to DRcells in infected kidneys and heart tissues, pointing to a larger number of DRcells in the infection of these strains. In addition, infected livers, which had a moderate of Mg2+ concentration (Günther, 2011; Jahnen-Dechent and Ketteler, 2012), also showed comparable bacterial loads between low-tagB, high-tagB and ΔsigB high-tagB strains.
Figure 8

Low- and high-tagB strains display different infection patterns.
(A) Bacterial loads on different genetic backgrounds in kidney, heart and liver of infected mice. (B, C) qRT-PCR analysis of BRcell- (B) and DRcell- (C) related genes in kidney, heart and liver of mice infected with S. aureus strains of different genetic backgrounds. Data shown as mean ± SD of five independent animals (n = 5) (A) and three independent experiments (n = 3) (B, C). Statistical significance was measured by multiple comparison analysis using the Mann-Whitney test (A) and unpaired two-tailed Student’s t-test (B, C). *p<0.05, **p<0.01, ***p<0.001; ns, not significant differences.
Discussion
The bimodal behavior of the agr system results in the differentiation of two genetically identical, cell types that specialize in biofilm- or dispersal-associated lifestyles in S. aureus communities. These cell types were detected in in vitro cultures and during in vivo infections. The expression of specific markers by BRcells and DRcells is due to activation of the agr bimodal switch, which requires the production of the activating signal AIP above a certain threshold, similar to other quorum sensing systems, such as the heterogeneous expression of natural competence in cultures of B. subtilis in response ComX signal (Maamar and Dubnau, 2005; Smits et al., 2005) or quorum sensing activation of bioluminescence in a subpopulation of cells in Vibrio harveyi (Anetzberger et al., 2009). A growing number of bimodal switches are being found in QS pathways, and cell differentiation in response to a QS signal is becoming an established concept in microbiology.
The molecular mechanism of agr bimodal behavior is based on a sequential activation of the two adjacent divergent promoters P2 and P3. The P2 promoter triggers positive self-regulation of the agr operon (by activating the agr positive feedback loop) and the P3 promoter induces the agr regulon responsible for activation of virulence genes (P3 promoter activation is necessary for DRcell specialization). The differential affinity of AgrA~P for P2 and P3 promoters is crucial for the sequential promoter activation and thus for agr bimodal switch activation. AgrA~P binds P2 with greater affinity than the P3 promoter. The P2 promoter thus activates and triggers the feedback loop at lower AgrA~P concentrations and only in a given subpopulation (agr-on cells). Activation of this feedback loop produces high AgrA~P levels in this subpopulation, which licenses them to trigger the less-sensitive P3 promoter and induce the agr regulon, leading the agr-on cells to specialize in dispersion and virulence and become DRcells. In contrast, the cell subpopulation that expresses P2 below the threshold cannot activate the agr positive feedback loop (agr-off cells), and thus do not produce sufficient AgrA~P to induce P3 promoter expression. In these cells, genes normally repressed by AgrA~P are upregulated, including biofilm-related genes, which licenses them to differentiate as biofilm-producing cells thus to become BRcells.
Once the agr bimodal switch is activated and BRcells and DRcells differentiate, subpopulation size is modulated by other extracellular cues that affect bimodal switch activity. We report that extracellular Mg2+ is incorporated into the bacterial cell wall by binding teichoic acids and increases cell wall rigidity, provoking activation of sigB expression. As σB downregulates the agr bimodal switch, its activation above the threshold becomes more difficult, leading to differentiation of a smaller DRcell and a larger BRcell subpopulation, which in turn facilitates biofilm formation. In contrast, increasing AIP above the threshold concentration facilitates activation of the agr bimodal switch, leading to differentiation of a larger DRcell and a smaller BRcell subpopulation, which in turn facilitates dispersion and acute infection.
The activity of these agr input cues neither generates nor abolishes the agr positive feedback loop; agr bimodal switch activity is only modulated, which regulates the size of the two subpopulations. DRcell and BRcell subpopulations can therefore be detected in the presence of input cues; in our in vitro and in vivo assays, only their ratio differed in the overall bacterial community, thus varying infection outcome in distinct scenarios. In mouse models, we found that in vivo infections developed a larger DRcell subpopulation in tissues with low Mg2+ levels (cardiac tissue), in which the microbial population became dispersed. In contrast, BRcells were more prevalent in tissues with high Mg2+ concentrations (bone, kidney) and bacteria organized in microbial aggregates characteristic of biofilm-associated infections. The results recapitulate clinical studies in which a marked number of biofilm-associated persistent infections develop in urinary tract and bone, usually following surgery or catheterization (Muder et al., 2006; Brady et al., 2008; Flores-Mireles et al., 2015; Idelevich et al., 2016). These data help to understand how nosocomial pathogens such as S. aureus can simultaneously cause dissimilar types of infections in distinct organs, and show that cell differentiation in nosocomial pathogens is particularly relevant for adaptation to different host tissues.
The molecular mechanism whereby extracellular Mg2+ downregulates the agr bimodal switch relies on the capacity of magnesium to bind TA to increase cell wall rigidity (Heptinstall et al., 1970; Hughes et al., 1971), in turn causing agr downregulation via activation of the repressor σB. Staphylococcus aureus cells with reduced cell wall TA adhere poorly, have poor biofilm formation ability (Vergara-Irigaray et al., 2008), and do not colonize nasal (Weidenmaier et al., 2004) or kidney-derived endothelial tissues (Weidenmaier et al., 2005a). An effect similar to that of Mg2+ incorporation into the cell wall is caused by D-alanine esterification of TA (Lambert et al., 1975a; Lambert et al., 1975b). The Dlt protein machinery decorates TA with D-alanine esters to reduce repulsive interactions between TA negative charges, which also increases cell wall rigidity (Perego et al., 1995). Previous reports showed that Dlt activity is important for biofilm formation in S. aureus (Gross et al., 2001) and for developing biofilm-associated infections in vivo in animal models (Weidenmaier et al., 2005b). Our results are consistent with these findings and suggest that, given the intricacy of agr bimodal switch regulatory control, many extracellular cues probably contribute to the outcome of S. aureus infections. Extracellular Mg2+ and hence, increased cell wall rigidity are probably important cues for triggering biofilm-associated infections.
Here we show that infections generated by clonal populations of bacteria can bifurcate into distinct, specialized cell types that localize physically in different colonization tissues in the course of an infection. The prevalence of physiologically distinct bacterial cells in different organs could offers bacteria an adaptive strategy that increases their chance of evading the immune system evasion during infection, or provides a bet-hedging strategy that increases the possibility of survival during antimicrobial therapy (Beaumont et al., 2009). Understanding cell differentiation in bacteria is central to designing new anti-infective strategies that target specific cell subpopulations, particularly to pathogens like Staphylococcus aureus, considered endemic in hospitals and which has an approximately 20% mortality rate (Klevens et al., 2007).
Materials and methods
Strains, media and culture conditions
Request a detailed protocolA complete list of strains used in this study is shown in Supplementary file 1. The laboratory S. aureus strain RN4220 (Kornblum et al., 1990) was used for cloning purposes. The strain Escherichia coli DH5α was used for propagating plasmids and genetic constructs in laboratory conditions. B. subtilis and E. coli strains were regularly grown in LB medium. When required, selective media were prepared in LB agar using antibiotics at the following final concentrations: ampicillin 100 μg/ml, kanamycin 10 μg/ml, chloramphenicol 5 μg/ml, tetracycline 10 μg/ml, and erythromycin 2 μg/ml. S. aureus strains were routinely propagated in liquid TSB medium incubated with shaking (220 rpm) at 37°C for 16 hr. When required, selective media were prepared in TSB using antibiotics at the following final concentrations: kanamycin 10 μg/ml, chloramphenicol 10 μg/ml, tetracycline 10 μg/ml, erythromycin 2 μg/ml, neomycin at 75 μg/ml, Spectinomycin at 300 μg/ml and Lincomycin at 25 μg/ml.
For S. aureus aggregates in TSBMg, 4 μl of an overnight liquid culture was spotted in TSBMg (TSB medium supplemented with MgCl2100 mM) (Koch et al., 2014) and dried in a sterile culture cabin. Plates were allowed to grow for five days at 37°C (Koch et al., 2014). For S. aureus traditional biofilms in liquid TSBMg and TSB, we followed the protocol proposed by O'Toole and Kolter (O'Toole and Kolter, 1998a). Briefly, an overnight liquid culture was inoculated 1:100 in fresh TSB media and after 6 hr at 37°C with shaking at 220 rpm, the OD600 nm was measured and normalized to a final OD600 0.05. From the normalized cultures, 5 μl was inoculated in 995 μl of TSB or TSBMg in a 24-well microtiter plate (Thermo) (RRID:SCR_008452) and incubated for 24 or 48 hr at 37°C without shaking. Biofilm formation was measured as follows: media was discarded by aspiration; wells were washed twice with PBS and allowed to dry for 45 min at 65°C. Then, 500 μl of a solution of Crystal Violet at 0.1% was added and to stain the organic material associated with the well for 5 min. After staining, wells were washed three times with deionized water. For quantitative analyses, Crystal Violet was solubilized using 500 μl of acetic acid at 33%. The solubilized dye was diluted 1:100 in deionized water and transferred to 96-well microtiter plates (Thermo). The absorbance was determined at 595 nm using an InfiniteF200 Pro microtiter plate reader (Tecan). Background was corrected by subtracting the absorbance values of non-bacteria inoculated wells. Specific growth conditions are presented in figure legends.
For the experiments using the synthetic orthogonal agr model generated in B. subtilis wild type and ΔsigB mutant, cells were incubated in LB medium at 220 rpm at 37°C until cultures reached an OD600nm = 0.5. After incubation, 50 μl of the culture was added to 50 ml of chemically-defined MSgg growing medium (Branda et al., 2001) and allowed to grow for 4 hr at 37°C at 220 rpm. After incubation, 50 μl of culture was used to inoculate 50 ml of fresh LB and allowed to grow for 12 hr at 37°C with constant shaking. Addition of AIP to the culture defined the initiation of the experiment (time = 0 hr). Samples were taken at 0 hr, 2 hr, 4 hr, 6 hr, 8 hr, 10 and 12 hr.
Strain generation
Request a detailed protocolTo generate the S. aureus strain Newman Δica, Δpsmα, Δpsmβ and ΔdltA-E mutants, 500 bp flanking each gene and the respective antibiotic cassettes were PCR amplified and the fragments were subsequently joined together using a long-flanking homology PCR (LFH-PCR). The resulting fragments were cloned into pMAD plasmid (Arnaud et al., 2004) and transformed into the laboratory strain S. aureus RN4220. To transfer the mutations from RN4220 to Newman and to generate the double mutant strains, φ11 phage lysates were generated from RN4220 mutants to infect Newman, NewHG and USA300 LAC* (Rudin et al., 1974). Clones resistant to the respective antibiotic were further verified to carry the mutation using PCR. Positive clones were validated to carry the mutation using Sanger sequencing.
To generate the S. aureus strains single-labeled with Pica-yfp, Pspa-yfp, Ppsmα-yfp, Ppsmα-mars, Ppsmβ-yfp, PdnaA-yfp and double-labeled with Pspa-yfp Pica-mars, Ppsmβ-yfp Ppsmα-mars, Ppsmα-yfp Pica-mars, Pspa-yfp Ppsmα-mars, Pica-yfp PclfA-mars, Pica-yfp PisdA-mars, Pspa-yfp PclfA-mars and Pspa-yfp PisdA-mars transcriptional fusions, the respective promoter region comprising 200 to 500 bp upstream of the start codon was fused to the yfp reporter-gene using the plasmid pKM003 or to the rfp (mars) reporter-gene using the plasmid pKMmars. These fusions were subcloned into the plasmids pAmy and pLac (Yepes et al., 2014). The plasmids were integrated into the neutral amy and lac loci of S. aureus chromosome to ensure a uniform and chromosome-equivalent copy number of the reporters in all the cells within the microbial community. The integration of reporters in amy and lac neutral loci occurs in a two-step recombination process, as described in (Yepes et al., 2014). Briefly, integration of the plasmid into the chromosome of S. aureus occurs via a single recombination event. This first recombination occurs by growing the plasmid-carrying strain overnight at 30°C, plating serial dilutions onto selective media (erythromycin 2 μg/ml and X-Gal 100 μg/ml) and incubating the plates at 44°C. This is a temperature-sensitive plasmid, which does not allow plasmid replication at higher temperatures (Arnaud et al., 2004). Therefore, incubation at 44°C allows only the strains that incorporate the plasmid into the chromosome to grow. The genetic constructs obtained from the first recombination process in the strain RN4220 were transferred to strain Newman by φ11 phage transduction (Rudin et al., 1974). Once the constructs were transferred to the recipient strain (Newman and USA300 LAC* strains), we forced a second recombination process to leave only the reporter in the integration locus. To do this, a culture of a light-blue colony was incubated overnight at 30°C in the absence of erythromycin, plating serial dilutions onto selective (erythromycin and X-Gal) media and then incubating the plates at 44°C. After 48 hr of incubation at 44°C, the light-blue colonies still carrying the plasmid in the chromosome were discarded. A four-step process of screening, including fluorescence, antibiotic susceptibility, PCR and Sanger sequencing, was designed to validate whether the white colonies carried the corresponding insertion in the neutral loci. The S. aureus strains tagB-lower (NWMN_0187), tagG-lower (NWMN_1763) and tagH-lower (NWMN_1763) were obtained by phage transduction using as donor strain the respective mutants deposited in the transposon-mapped mutant collection (Bae et al., 2004). Clones were verified using PCR and Sanger sequencing. The S. aureus strain that overexpresses the tagB gene (tagB-higher) (NWMN_0187) or the agrBCDA operon (NWMN_1943 to NWMN_1946) were obtained by cloning the complete ORF into the replicative plasmid pJL74 (Klijn et al., 2006). The sarA P1 promoter and the RBS of sodA guarantee high expression and translation levels in S. aureus.
To construct the agr synthetic orthologous model in B. subtilis ΔsigB, the two genes agrC and agrA, which are adjacent in the operon agrBDCA, were cloned as a chimeric version agrCA. The gene agrC encodes the histidine kinase and the gene agrA encodes the cognate regulator (Recsei et al., 1986; Boles and Horswill, 2008; Peng et al., 1988). The resultant construct was integrated into the amyE neutral chromosomal locus of B. subtilis ΔsigB (strain 168). Moreover, the Pica-yfp, Pspa-yfp, Ppsmα-yfp, Ppsmβ-yfp, PRNAII-yfp and PRNAIII-yfp transcriptional fusions were cloned into plasmid pDR183 and integrated into the neutral locus lacA. For transformation via double heterologous recombination, all plasmids were linearized and added to competence-induced liquid cultures of B. subtilis ΔsigB strain 168 (Hardwood and Cutting, 1990). Resultant colonies were verified that contained the reporter using Sanger sequencing. The synthetic model that recreates the divergent P2 and P3 promoters of S. aureus contains a DNA fragment of the construct of RNAII and RNAIII joined to the cfp and yfp genes divergently transcribed by the P2 (RNAII) and P3 (RNAIII) promoter, respectively. This fragment was cloned into the plasmid pDR183 and integrated into the neutral locus lacA. The integration of the fragment occurs by double heterologous recombination. The plasmids were linearized and added to competence-induced liquid cultures of B. subtilis ΔsigB strain 168. The resultant colonies were verified to contain the construct using Sanger sequencing.
Staphyloxanthin extraction and quantification
Request a detailed protocolFor staphyloxanthin extraction, we used a protocol adapted from Pelz et al. (2005). After 72 hr of growth, cells were harvested, washed once and resuspended in PBS buffer. The cell densities at OD600 nm were measured and the samples normalized. One ml of cells was centrifuged and the pellet resuspended in 200 μl of methanol and heated at 55°C for 3 min. Samples were centrifuged to eliminate debris. Then, 200 μl of the supernatant was taken and the methanol extraction repeated. A volume of 180 μl was recovered and added to 820 μl of methanol. Absorption spectra of the methanol extracts were measured using a spectrophotometer at a peak of 465 nm, normalized and reported as relative absorbance to express the total amount of staphyloxanthin pigment.
Atomic force microscopy indentation
Request a detailed protocolMechanical indentation via atomic force microscopy (AFM) was applied according to previous publications (Dufrêne, 2014; Formosa-Dague et al., 2016). Overnight cultures were diluted into fresh TSB or TSBMg liquid media to a final OD600 of 0.05. Cells were grown overnight at 37°C and 220 rpm. One (1) ml of the culture was washed with sterile PBS or PBS supplemented with MgCl2 final concentration 100 mM (PBSMg), depending on culture conditions and were normalized to a final OD600 of 0.5 in PBS or PBSMg. Cells were fixed with 4% p-formaldehyde for 6 min and washed twice with 500 μl of PBS. One series of mild sonication was applied to produce a homogenous sample of single cells. Finally, 40 μl of a dilution of 1:5 in deionized water was immobilized on poly-lysine coated microscopy slides. Samples were washed twice with Milli-Q water and allowed to dry. Samples were processed immediately after immobilization, in air and at room temperature, using a CFM conical probe AFM (Nanotec, Spain) with nominal spring constant 3 N/m and resonant frequency 75 kHz. Optical lever calibration and sensitivity was obtained by tapping the probe cantilever onto the glass surface of the slide and measuring the force response to z-piezo extension (z is vertical to the glass surface). For cell indentation, the AFM probe was placed above a cell and repeatedly pressed down onto the surface (and retracted) at 50 nm/s over distances of 100 nm, several times at several positions of the cell surface. Z position and speed of the AFM probe were controlled by a piezoelectric translator. The force response of the cell membrane was measured at three different positions for three individual cells. Young’s modulus was obtained by fitting the resulting force-indentation curves for forces <10 nN, resulting in indentations <~20 nm. Best fits were produced with a modified Hertz model assuming a conical punch probe geometry.
Purification of AIP
Request a detailed protocolFor purification of AIP1 from S. aureus strain Newman, we used a protocol that is adapted from (MDowell et al., 2001). To obtain an enriched fraction of AIP, a 500 ml culture of each strain was grown for 24 hr in TSB and, after the removal of bacterial cells by centrifugation, the supernatant was filtered through a 0.22 μm membrane filter and mixed 1:1 volumes with binding buffer (2% CH3CN and 1% trifluoroacetic acid). The filtered supernatant was loaded into a C18 Sep-Pak cartridge (Waters) previously stabilized with binding buffer. Elution of AIP was achieved with a 60% concentration range of CH3CN and subsequently concentrated using a SpeedVac system. Fresh AIP fractions were used in each experiment due to the instability of the preparation.
Extraction and quantification of cell wall peptidoglycan
Request a detailed protocolPeptidoglycan from S. aureus was purified using a protocol adapted from (Bera et al., 2005; Peterson et al., 1978). Cells were grown in 2 L of TSB medium and incubated overnight at 37°C with vigorous shaking. Bacteria were harvested by centrifugation (5000 × g, 4°C, 10 min), washed with cold buffer 1 (20 mM ammonium acetate, pH 4.8) and resuspended in 30 ml of buffer 1. Cell suspension was transferred to a falcon tube, centrifuged and determined the weight of the pellet. Cell pellet was resuspended in 2 ml of buffer and cells were disrupted with a bead beater (Genogrinder, SPEXsamplePrep, USA). After centrifugation, the interphase between glass beads and the foam at the top of the tube was collected and treated with 40 U of DNase, 80 U of RNase and 5 mM of MgSO4 and were incubated 5 hr at 37°C. Cell walls were resuspended in 2% SDS in buffer 1 and incubated 1 hr at 65°C. The material was washed twice with distilled water and resuspended in 30 ml of buffer 1. 5% trichloroacetic acid was added to remove WTA from peptidoglycan and incubated 4 hr at 60°C. PG was then washed four to six times with cold Milli-Q water, lyophilized, and weighed. Before use, PG was resuspended in PBS buffer and sonicated on ice.
Quantification of peptidoglycan was performed using a protocol adapted from (Nocadello et al., 2016; Zhou et al., 1988). PG pellets were resuspended in 5 ml of cold buffer 1 and diluted 1:50 in a final volume of 2 ml. PG was labeled with Remazol Brilliant Blue (RBB) by incubating the samples with 20 mM RBB in 0.25 M NaOH ON at 37°C with constant shaking. The labeled samples were neutralized with HCl and pelleted by centrifugation at 14000 rpm for 20 min at room temperature. We performed intense washing using distilled water to eliminate the remaining RBB. After washing, the RBB-PG complexes were diluted 1:50 and the OD 595 nm was determined. OD 595 nm values were normalized to wet weight of each PG-isolated sample.
Stereomicroscopy and fluorescence microscopy
Request a detailed protocolDigital images of the development of S. aureus multicellular aggregates were captured with an AxioCAm-HR digital camera (Carl Zeiss) using AxioVision AC Release 4.3 software (Carl Zeiss) (RRID:SCR_002677). For fluorescence microscopy, cells from the multicellular communities or from the liquid cultures were washed in PBS and resuspended in 0.5 ml of 4% paraformaldehyde solution and incubated at room temperature for 6 min. After two washing steps with PBS buffer, samples were resuspended in 0.5 ml of PBS buffer and mildly sonicated to guarantee samples of dispersed single cells. Microscopy images were taken on a Leica DMI6000B microscope equipped with a Leica CRT6000 illumination system (Leica). The microscope was equipped with a HCX PL APO oil immersion objective with 100 × 1.47 magnification and a color camera Leica DFC630FX. Linear image processing was done using Leica Application Suite Advance Fluorescence Software (RRID:SCR_013673). The YFP fluorescence signal was detected using an excitation filter 489 nm and an emission filter 508 nm (excitation filter BP 470/40 and suppression filter BP 525/20). The RFP-mars fluorescence signal was detected using an excitation filter 558 nm and an emission filter 582 nm (excitation filter BP 546/12 and suppression filter BP 605/75). Excitation times were 567 and 875 msec, respectively. Transmitted light images were taken with 21 msec of excitation time.
To quantitatively measure cell fluorescence from microscopy images, we adapted an image protocol originally published by McCloy RA et al., using ImageJ64 v1.48s (NIH, USA) (RRID:SCR_003070) (McCloy et al., 2014). Briefly, to quantify the number of fluorescent cells and determine their fluorescence level within a microscopy field, the overlapping image of the bright field and fluorescent channels was converted to RGB and inverted it to highlight fluorescent cells. An automatically adjusted threshold generated an image in which only fluorescent cells were represented (image A). Using the same procedure without the inversion step generated an additional image in which only non-fluorescent cells were represented (Image B). The sum between fluorescent and non-fluorescent cells from Images A and B, respectively, represented the total number of cells in the field. Quantification of fluorescence at the single cell level in the microscopy field was determined using the same software using the following commands: from the analyze menu, we selected set measurements, making sure that Area, Min and Max gray values and Mean gray value were selected. Then, we selected analyze particles and set: size in pixel unit from 20 to 200 pixels, circularity from 0.1 to 1.00 and show overlay outlines, making sure that the options display results, summarize and in situ show were selected. It is recommended to run a configuration test to set the analyze particles parameters that correctly cover all cells in the microscopy image. Analysis results were transferred to a Microsoft Excel sheet and to calculate the Total Cell Fluorescent (TCF) as TCF = Area of selected cell X Mean fluorescence. Results were used to generate a histogram that represents the number of particles for each mean fluorescence value. At least three independent images were analyzed for each experiment and the mean values were plotted. In average, each microscopy field comprised 500–765 cells. For analysis of overlapping signals using fluorescence microscopy, we considered signals to overlap when both signals were detected in a 3:1–1:3 range. This is the range in which green and red signals merge to yellow signal in microscopy and thus define green/red fluorescence overlap.
For thin cryosectioning of S. aureus multicellular communities, bright field and fluorescence images were acquired using a TCS SP5 II confocal microscope (Leica). The hardware settings included: Argon laser power at 25% and 496 nm laser intensity at 15%. Bright field images were collected using the PMT-1 Trans scan channel at 512 V with a gain offset of −0.15%. Fluorescent images were collected using the HyD-2 channel with a gain of 10 and an emission bandwidth of 500 nm for excitation and 550 nm for emission (excitation filter BP 470/40 and suppression filter BP 525/20). The acquisition mode included a xyz scan mode, with z-stacks in the z-wide mode from 4 to 8 μm. To determine the structural features of the thin sections and localize the fluorescence, a series of horizontal optical sections were collected using a z-step size of 0.3 μm. Width and height format in X and Y was set to 1024 × 1024 pixels at a scan speed of 200 Hz. Air 1 pinhole was set to automatic detection. A HCX PL APO CS 40.0 × 1.30 OIL UV objective was used for image acquisition. Digital images were captured using the Leica AF 6000 system software that is provided with the confocal microscope. All parameters were kept identical for the unlabeled control and the different labeled samples. To quantitatively measure fluorescence area from each thin cryosection image, we used ImageJ64 v1.48s and we adapted an image protocol as in (McCloy et al., 2014; Gavet and Pines, 2010; Potapova et al., 2011). Using this software, we quantified the bacterial aggregate area from each image of infected tissue. We quantify the proportion of fluorescent area from the total area occupied by S. aureus cells and referred it in percentage as relative fluorescence signal. We quantified fluorescence of three different thin cryosection samples obtained from three independent multicellular aggregates.
The infected mice organs were aseptically extracted and immersed in a solution 1:1 of PBS and paraformaldehyde 4% and left at 4°C overnight. 4 μm-thick sections were obtained using a CM 3050 s cryostat set to −20°C (Leica). These histological sections were placed on SuperFrost plus poly lysine-coated slides (Thermo) and immediately rinsed twice with PBS buffer precooled at 4°C. Then, fixed-samples where stained with Giemsa staining solution (Sigma) including a dehydration step before the staining and a rehydration step after staining using Xylol and ethanol at 96%, 70% and 50% (Thammavongsa et al., 2009). Slides were immediately mounted with coverslips and processed by confocal microscopy. Histological digital images were obtained using the Diskus software (Hilgers). For fluorescence imaging, a Leica TCS SP5 II confocal microscope equipped with A HCX PL APO CS 100 × 1.47 OIL objective was used. The hardware settings included: Argon laser power at 25% and 496 nm laser intensity at 10%. Bright field images were collected using the PMT-1 Trans scan channel at 512 V. Fluorescent images were collected using the HyD-2 channel with a gain of 5 and an emission bandwidth of 500 nm for excitation and 550 nm for emission (excitation filter BP 470/40 and suppression filter BP 525/20). The acquisition mode included a xyz scan mode, with z-stacks in the z-wide mode from 4 to 8 μm. To localize fluorescence, a series of horizontal optical sections were collected using a z-step size of 0.2 μm and with an optimized system. Width and height format in X and Y was set to 1024 × 1024 pixels at a scan speed of 200 Hz. Air one pinhole was set to automatic detection. Digital images were captured using the Leica AF 6000 system software provided with the confocal microscope. All parameters remained constant during the examination of the different labeled samples. To measure fluorescence signal in infected organs, we used ImageJ64 v1.48s and we adapted an image protocol from (McCloy et al., 2014; Gavet and Pines, 2010; Potapova et al., 2011). Using this software, we quantified the bacterial aggregate area that exists in each one of the infected tissue images. From the area that is occupied by S. aureus cells, we used the same software to quantify the proportion of fluorescent area and referred in percentage relative to the total bacterial aggregate area. We quantified fluorescence of three different histological sections obtained from independent organs from three different infected mice.
Flow cytometry
Request a detailed protocolFor flow cytometry analysis, cells from the multicellular communities were fixed with a treatment of 4% paraformaldehyde as mentioned above, washed and resuspended in PBS buffer. After fixation, a sonication treatment was required to separate single cells in the sample. In this case, samples were subjected to series of 25 pulses (power output 70% and cycle 0.7 s) and kept on ice. Dilution of samples 1:500 was necessary prior flow cytometry analyses. For YFP fluorescence, a laser excitation of 488 nm coupled with 530/30 and 505LP sequential filter was used. The photomultiplier voltage was set at 777 V.
Fluorescence-activated cell sorting
Request a detailed protocolTo obtain samples enriched in BRcells or DRcells, we used single-labeled Staphylococcus aureus multicellular communities between day 4 and 5 of development. These strains were labeled to differentiate cells expressing the extracellular matrix-production reporter (Pica-yfp) or the detachment/virulence reporter (Ppsmα-yfp). Multicellular communities were scraped from the TSBMg plates and immediately resuspended in RNAlater (Qiagen) in 1.5 ml RNAse-free Eppendorf tubes, in order to fix the cell fluorescence and at the same time preserve the RNA within the cells. Previous reports (Rosenberg et al., 2003) and fluorescence microscopy experiments performed in our laboratory (data not shown) showed that the fixing procedure of these multicellular communities in RNAlater had no effect in the conservation of the fluorescence when compared to cells fixed using 4% paraformaldehyde. Multicellular communities were disrupted in the RNAlater by extensive pipetting, followed by one series of mild sonication as mentioned above, and previously treating the sonicator with RNaseZap RNase Decontamination Solution (Life Technologies) (RRID:SCR_008817). All procedures were performed on ice. After sonication, samples were immediately processed using FACS. Cell fixation and subsequent mild sonication allowed cell separation without affecting cell integrity. For the sorting procedure, 50 μl of the cell suspension was resuspended in 10 ml of filtered and autoclaved PBS buffer prepared in DEPC-treated water. This cell suspension was sonicated, changing cycles from 70% to continuous (100%) and performing 1 round of 20 s. Immediately, cells were FACS-sorted based on their fluorescence intensity in a FACS Aria III (Becton Dickinson) (RRID:SCR_008418) using the following parameters: Nozzle size of 70 microns, FITC/Alexa Fluor 488 nm laser, a 530/30 nm filter for data collection and a 502 LP mirror. Flow cytometry parameters were set as: SSC 341 V with a threshold of 500, FSC 308 V with a threshold of 500, FITC 769 V and a variable Flow Rate to guarantee that the number of events per second never exceeded 1500; hence, the Sorting Efficiency never dropped from 97%. These data were analyzed using the BDIS FACS Diva software version 7.0 provided with the FACS Aria III. Sorting was performed in the Precision Mode set to ‘Single Cell’ in a first round, followed by a second sorting round set to ‘Purity’. Using the sorting Precision Mode, we recovered approx. 25 million cells of each subpopulation (fluorescent cells) and their respective non-fluorescent counterparts, based on manually established Target Gates P1 for highly fluorescent cells and P2 for non-fluorescence cells. Once sorted (approximately 5 million cells per 15 ml tube), cells were immediately quick-frozen by immersing the tubes in liquid nitrogen prior to ultra-freezing until sorting was completed.
RNA isolation
Request a detailed protocolFor the FACS-sorted bacterial cells, the ultra-frozen samples were thawed using a 37°C water bath. The volume was poured in a vacuum filter system provided with a 47 mm filter diameter and 0.45 μm pore-size. The equipment was previously sterilized using 75% ethanol in DEPC-treated water, followed by two DEPC-treated water rinses and finally UV light for 180 s and then precooled at −20°C. Filters containing each of the sorted samples were individually ground using liquid Nitrogen in an RNAse-free, sterile precooled mortar. The powder was carefully scraped out from the mortar and placed in a 2 ml RNAse-free Eppendorf tube and the RNA isolated as described below.
To isolate RNA from S. aureus infected organs, 450 μl of the homogenized organs were incubated for 15 min on ice with 50 μl of RNAlater and 5 μl of Triton X100 briefly vortexing every 5 min to lyse the murine cells. After lysis, RNA was isolated as described below. To isolate RNA from S. aureus infected organs, 450 μl of the homogenized organs were incubated for 15 min on ice with 50 μl of RNAlater and 5 μl of Triton X100 briefly vortexing every 5 min to lyse the murine cells. After lysis, RNA was isolated as described below.
One volume of TE lysis buffer (Tris 20 mM pH 7.5, EDTA 10 mM) prepared in DEPC-prepared water and 25 μl of Lysostaphin (1 mg/ml) were added and taken to a hybridization oven (with rotation), pre-warmed at 37°C. Samples were incubated for 30 min at 37°C prior to transferring the whole material to a new tube for mechanical lysis. This was performed using FastPrep Lysing Matrix glass beads in a Fast Prep Shaker (MP Biomedicals) (RRID:SCR_013308) set at 6500 rpm for 50 s. Samples were lysed using 2 cycles of 50 s. The lysate was transferred to a new 2 ml RNAse-free Eppendorf tube and centrifuged for 10 min at 14000 rpm and 4°C to remove the filter and beads. The supernatant (700 μl) was recovered and used for RNA isolation using the standard hot phenol methodology with some modifications. The sample recovered from was mixed with 60 μl of 10% SDS and incubated at 64°C for 2 min. 66 μl of sodium acetate 3 M pH 5.2 and 750 μl of phenol Roti-Aqua (Carl Roth) were added and the mixture was incubated at 64°C for 6 min with mixing every 30 s. The sample was centrifuged for 10 min at 13000 rpm and 4°C and the upper aqueous layer was transferred to a 2 ml Phase Lock Gel Heavy (PLGH) tube (5Prime). Then, 750 μl of Chloroform was added and the sample was centrifuged for 12 min at 13000 and 15°C. The aqueous layer was transferred to a new tube and mixed with 2 volumes of a 30:1 ethanol and sodium acetate 3 M pH 6.5 mix. Additionally, 0.5 μl of GlycoBlue co-precipitant (15 mg/ml) (Life Technologies) was added. This mix was left at −20°C overnight. The following day, the sample was removed from storage at −20°C, centrifuged for 30 min at 13000 rpm and 4°C and the pellet was washed with 300 μl of precooled 75% ethanol. After washing, the total RNA was resuspended in 42 μl of RNAse-free water (Qiagen) were added and the sample was incubated at 65°C at 1000 rpm for 5 min prior storage in ice. To remove any DNA traces, the isolated RNA was treated (one to three times, depending on the sample) with 4 Units of RNase-free DNase I (Thermo), 10 Units of SUPERase In RNase Inhibitor (Life Technologies) and incubated for 45 min at 37°C. To remove the DNase I, 50 μl of RNAse-free water and 100 μl of Roti-Aqua-P/C/I (Phenol, Chloroform, Isoamyl alcohol 25:24:1 pH 4.5–5) (Carl Roth) were added to the reaction tube, mixed, transferred to a 2 mL PLGH tube and centrifuged for 12 min at 13000 rpm and 15°C. The sample was mixed with 2.5 volumes of the 30:1 ethanol and sodium acetate with 0.5 μl of GlycoBlueTM, which led to RNA precipitation when stored at −20°C overnight. On the following day, samples were centrifuged for 30 min at 13000 rpm and 4°C, washed with 200 μl of 75% ethanol and the pellets were dried and resuspended in 50 μl of DEPC-water. To remove phenol residues, 50 μl of RNAse-free water and 100 μl of Chloroform (Carl Roth) were added to the reaction tube, mixed by inversion for 1 min, transferred to a 2 mL PLGH tube and centrifuged for 12 min at 13000 rpm and 15°C. The sample was mixed with 2.5 volumes of the 30:1 ethanol and sodium acetate with 0.5 μl of GlycoBlueTM, which led to RNA precipitation when stored at −20°C overnight. On the following day, samples were centrifuged for 1 hr at 13000 rpm and 4°C, washed with 200 μl of 75% ethanol and the pellets were dried. This RNA was resuspended in 22 to 44 μl of RNAse-free water and then incubated at 65°C at 1000 rpm for 5 min. To assess the concentration and purity of the total RNA, OD260 was measured using a Nanodrop (Thermo) and the OD260/OD280 ratio and the OD260/OD230 ratio determined.
RNA-Seq library construction, sequencing and quantitative-PCR analysis
Request a detailed protocolThe cDNA prepared was strictly strand-specific, allowing transcriptome sequencing and expression profiling in both the forward and reverse strands. The combined-length of the flanking sequences was 100 bases. The cDNA is generated and size fractionated by preparative gel electrophoresis or by using the LabChip XT fractionation system from Caliper/PerkinElmer in order to obtain cDNA fractions, optimally suited for the different NGS systems. For this, the RNA samples were poly (A)-tailed using a poly(A) polymerase. The 5'-PPP were removed using tobacco acid pyrophosphatase (TAP) followed by the ligation of the RNA adapter to the 5'-monophosphate of the RNA. First-strand cDNA synthesis was performed with an oligo (dT)-adapter primer and the M-MLV reverse transcriptase. The resulting cDNA was PCR-amplified to reach a concentration of 20–30 ng/μl using a high fidelity DNA polymerase. The cDNA was purified using the Agencourt AMPure XP kit (Beckman) (RRID:SCR_008940) and was analyzed by capillary electrophoresis. The primers used for PCR amplification were designed for TruSeq sequencing according to the instructions of Illumina. The following adapter sequences flank the cDNA inserts: TruSeq_Sense: 5’-AATGATACGGCGACCACCGAGATCTACACTCTTTCCCTACACGACGCTCTTCCGAT-T-3’ TruSeq-Antisense NNNNNN (NNNNNN = Barcode) 5’-CAAGCAGAAGACGGCAT ACGAGATNNNNNNGTGACTGG-AGTTCAGACGTGTGCTCTTCC-GATC(dT25)−3’.
For quantification of gene expression, total RNA was reverse-transcribed using hexameric random primers followed by quantitative real-time PCR (qRT–PCR) using the SsoAdvanced SYBR Green Supermix (Bio-Rad) (RRID:SCR_013553), following manufacturer’s instructions. Primer pairs used are described in the Supplementary file 2. Gene expression was normalized to gyrA/gapA expression and expression fold changes were calculated using the 2−ΔΔCt method. These qRT-PCR experiments were performed following the standard MIQE guidelines for publication of qRT-PCR experiments (Bustin et al., 2009).
Bioinformatics analysis
Request a detailed protocolThe pooled sequence reads were de-multiplexed and the adapter sequences were removed. After that, the reads in Fastq format were quality trimmed using fastq_quality_trimmer (from the FastX suite version 0.0.13) (RRID:SCR_005534) with a cut-off Phred score of 20 and converted to Fasta format using Fastq_to_Fasta (also from the FastX suite). The reads were processed, which included poly(A) removal, size filtering (minimum read length of 12 nucleotides after clipping), statistics generation, coverage calculation and normalization, which were performed with the RNA-analysis pipeline READemption version 0.3.3. READemption uses segemehl version 0.1.7 for the read alignment to the reference and DESeq 1.18.0 (Anders and Huber, 2010) (RRID:SCR_000154) for the differential gene expression analysis. The reference genome NC_009641 was taken from the NCBI database for the purpose of alignment and gene-quantification. DESeq calculates statistically significant expression fold change and their log2 values by computing the ratio of normalized read counts of each gene in two libraries. The genes with log2fold value higher than 1.5 and lower than −1.5 were selected as up- and down-regulated gene-sets, respectively. Scatter plots for the visualization of sample correlation were generated using matplotlib 1.4.2. 2. Datasets used for gene ontology for functional classification of genes differentially expressed, hierarchical clustering and the calculation of the hypergeometric probability for genes differentially expressed are presented in Figure 6—source data 2 to 4.
Genome-wide analyses to compare BRcells and DRcells
Request a detailed protocolWe estimated the difference between the reference genome and the sequences from the libraries (total number of reads in the libraries range from ~6–11 million with an average of 100 nucleotides per read). Libraries were analyzed using SAMtools (mpileup command) and variant calling by BCFtools (RRID:SCR_005227). The variants were quantified for the reads mapped to the coding regions of the reference genome using the standard quality score >40 (base call accuracy 99.99%). SAM (Sequence Alignment/Map) tools enables quality checking of reads, and automatic identification of genomic variants (Li et al., 2009b). A high quality score means higher number of sequences showing a particular kind of variation. Quality score is proportional to the number of reads mapped to a gene that account for the variation. The BCFtools were used for the variance calling to identify general variances in each library and compared with each other to determine the existence of library-specific variations (Li, 2011). Using this approach, we detected a minimum of 99.999934% genome similarities at the nucleotide level between distinct cell types.
Statistical analysis
Request a detailed protocolAll statistical analyses were performed using the software Prism 6 (version 6.0 f, GraphPad) (RRID:SCR_002798). Graphs represent data from at least three independent experiments with at least three independent technical replicates for experiment. Error bars represent standard deviation (mean ±SD). For the analysis of experiments with two groups, the parametric unpaired two-tailed Student’s t-test with Welch’s correction was done and, the non-parametric unpaired Mann-Whitney test were done. For the analysis of experiments with three or more groups, the parametric one-way ANOVA test was done. Post hoc analysis included multiple comparisons Tukey's test, Dunnett’s test or Dunn’s tests, depending on the data set. Differences were considered significant when p value was smaller than 0.05. Statistical significance: ns = not statistically significant, *p<0.05, **p<0.01, ***p<0.001.
Mouse infection studies
Request a detailed protocolAll animal studies were approved by the local government of Lower Franconia, Germany (license number 55.2-DMS-2532-2-57 and were performed in strict accordance with the guidelines for animal care and animal experimentation of the German animal protection law and directive 2010/63/EU of the European parliament on the protection of animals used for scientific purposes. Female BALB/c mice (16 to 19 g) were purchased from Charles River (Charles River Laboratories, Erkrath, Germany) (RRID:SCR_003792), housed in polypropylene cages and supplied with food and water ad libitum. The different S. aureus strains used were cultured for 18 hr at 37°C on BHI medium. Subsequently, cells were collected and washed three times with PBS and diluted to reach an OD600 nm = 0.05. Viable cell counts were determined by plating dilutions of the inoculum on TSB agar plates. To compare the representation of each cell type of S. aureus in the bacterial communities that colonize the distinct organs, three cohorts of 3 mice for the unlabeled strain and six mice for each labeled strains (Pica-yfp and Ppsmα-yfp) were infected with 150 µl of cultures of S. aureus, containing 1 × 10⁷ cells via tail vein injection. Each strain was used to infect one cohort of mice. Infections were allowed to progress until severe infection signs occurred or to the endpoints of 24 hr, 48 hr, 72 hr and 96 hr after mice challenging. Animals were sacrificed when they met the following criteria: 1) loss of at least 20% of body weight; 2) loss of at least 15% of body weight and ruffled fur; 3) loss of at least 10% of body weight and hunched posture; or 4) 24 hr, 48 hr, 72 hr and 96 hr time points after infection. Infected kidneys and hearts were aseptically harvested and processed for thin sectioning, histology and confocal microscopy, as described above. Organs were also used to calculate bacterial burden calculated as CFU/g of organ, as proposed by Marincola et al. (2012). For this purpose, kidneys and hearts were homogenized in 2 ml of sterile PBS using GentleMACSTM M Tubes (Miltenyi Biotec) (RRID:SCR_008984) and serial dilutions from 10−2 to 10−8 of the organ homogenates were immediately plated on TSB plates and incubated at 37°C for 24 hr, To compare the representation of the S. aureus low-tagB and high-tagB strains colonizing the kidneys, heart and liver, four cohorts of 5 mice each, were infected with 150 µl of cultures of S. aureus and organs were processed as described above. Three days after bacterial challenge all mice were euthanized, organs were aseptically harvested and processed as described above, CFU determined and RNA isolated.
Mathematical modeling of agr bimodal behavior
Request a detailed protocolTo study the dynamic processes of the synthetic network, we mathematically described the reactions of the genetic circuitry of the orthologous system. In this circuit, the phosphorylation state is only reached inside the cell after the concentration of AIP is above the threshold. The complex AgrA~P is the transcription factor that upregulates the expression of P2 promoter (also called PRNAII) responsible for activation of the positive feedback loop. Moreover, AgrA~P upregulates the expression of the rest of the promoters that were used in this work; P3 (Also called PRNAIII), Ppsmα, Ppsmβ. Pica and Pspa promoters are not directly regulated by AgrA~P and were therefore used as negative controls. The reactions that define the former genetic network are the following:
(1)
(2)
(3)
(4)
(5)
(6)
(7)
(8)
(9)
(10)
(11)
(12)
(13)
(14)
(15)
(16)
where k1 and k-1 are the binding and unbinding rates of AgrA~P to P2, k2 is the transcription rate of P2 once AgrA~P binds the promoter, k3 is the basal transcription rate of P2, k2 and k3 produce the mRNA of agrA, k4 is the translation rate of AgrA protein, k5 is the phosphorylation rate of AgrA, k6 is the availability rate of phosphate in the system, k7 and k-7 are the binding and unbinding rates of AgrA~P to the different promoters (Px), k8 is the transcription rate of Px once AgrA~P binds to the promoter (Pax), k9 is the basal transcription rate of Px, k10 is the translation rate of the YFP protein and k11 to k16 are the degradation rates of mRNAs and proteins involved in this system.
Deterministic modeling using differential equations pointed to a quasi-steady state assumption (Murray, 2002), which we used to identify the elements responsible for the behavior of the system. The resulting equations are:
(17)
(18)
(19)
where α1 = k3k-1k4PtagrA/k1k11, β1 = k2k4PtagrA/k11, γ1 = k-1/k1, δ = k14/k5, α2 = k9k-7k10Ptx/k7k15, β2 = k8k10Ptx/k15, γ2 = k-7/k7 and Pti = Pi + Pai with i = [agrA, x].
The following values are used to run the Gillespie algorithm of the full model (reactions 1–16). We focused our first set of simulations on the dynamics that affect YFP directly, to further study the behavior of the system when considering variations in AgrA and AgrA~P. The first set of simulations allowed us to find parameters that show a fixed value among all of the experiments independently on the promoter that is under consideration. These parameters are shown here:
| Parameter | Meaning | Value |
|---|---|---|
| k1 | Binding rate | 0.01 molecules/h |
| k-1 | Unbinding rate | 2/h |
| k2 | Transcription rates | 500/h |
| k3 | Basal transcription rate | 50/h |
| k9 | Basal transcription rate | 90/h |
| k4, k10 | Translation rates | 50/min |
| k5 | Phosphorylation rate | 0.05/molecules/hour |
| k6 | Entry rate | 40/molecules/hour |
| k11, k15 | Degradation rates | 10/hour |
| k12 | Degradation rate | 0.05/hour |
| k13 | Degradation rate | 0.1/hour |
| k14, k16 | Degradation rates | 1/hour |
Consequently, the values of these parameters did not change through the rest of the simulations that aimed to characterize the kinetics of each particular promoter. Initial simulations assumed the high stability of AgrA~P to test the response of the system to saturated levels of AgrA~P. The following simulations assumed unstable AgrA~P. The specific rates to simulate each promoter were defined as follows:
| Parameter | Meaning (rate) | PRNAIII | Ppsmα | PRNAII | Ppsmβ | PRNAIII-dual | PRNAII-dual |
|---|---|---|---|---|---|---|---|
| k8 | Transcription | 300 | 300 | 450 | 470 | 300 | 450/hour |
| k7 | Binding | 3 | 6.5 | 10 | 20 | 12 | 40 × 10−4* |
| k-7 | Unbinding | 0.08 | 0.08 | 0.1 | 0.1 | 0.08 | 0.1/hour |
-
*molecules−1 hour−1
The simulations that involved an unstable AgrA~P established values of k5 = 0.2 × 10⁻⁴ and k6 = 5. Using these values, we resolved a 3-mode decision-making model. Further simulations that involved changeable values of k6 (phosphate availability) revealed that the activation rate of P2 and P3 occurs within a range of 0 and a maximum value of saturation of 40. The values for the rest of the parameters were selected from standard numbers obtained from previously reported studies (Andersen et al., 1998; Balagaddé et al., 2008; Ben-Tabou de-Leon and Davidson, 2009; Dublanche et al., 2006; Goñi-Moreno and Amos, 2012).
Mathematical modeling of multicellular communities development
Request a detailed protocolWe used a so-called reaction diffusion system, which not only describes the changes of concentrations and density in time to any type of reaction but also their spread in space. In our case, we used a model with two spatial dimensions. Our system consisted of four equations, describing how the concentrations of nutrients, AIP and the density of replicative and non-replicative bacteria evolved in time. In the following, denotes the nutrient concentration, the density of replicative bacteria, the density of non-replicative bacteria and the concentration of AIP. We assumed that nutrients and AIP underlie diffusion. Diffusion parameters are denoted by and, respectively. In the case of the replicative bacteria, the diffusion coefficient depends on nutrient concentration and the density of replicative bacteria. It is of the form where also contains a stochastic fluctuation of random movement. This form for the diffusion of active bacteria cells was chosen according to the model developed by Kawasaki et al. (1997). We assumed that non-replicative bacteria are not able to diffuse on their own and their diffusion is driven by movement of the replicative cells. The diffusion of non-replicative bacteria depends on the density of replicative bacteria. If there are more replicative bacteria, the non-replicative cells will be pushed in a type of diffusion. This effect is limited. The diffusion coefficient for the non-replicative bacteria is assumed to be of the form:
where and are constant. The replicative bacteria proliferate by consuming nutrients. In our system of equations, the consumption rate of the nutrients was given by and the bacterial growth was described by the term where was the conversion rate of consumed nutrients to bacterial growth. We assumed to be of the form:
Here, we chose a Monod growth term (Monod, 1949) to describe the increase in the concentration of replicative bacteria in relation to nutrient consumption. It reproduces the fact that a high nutrient concentration will cause a faster increase in the concentration of replicative bacteria but that these bacteria cannot reproduce infinitely fast. An additional factor accounts for the effect of the quorum sensing signal. If the concentration of active bacteria is already high, a high concentration of AIP slows down the conversion process. We furthermore assumed that there is only a transition from replicative to non-replicative cells. This process is described by a term of the form:
This choice is in agreement with (Matsushita et al., 1999). The equation number four described the concentration of AIP. We considered that the diffusion and the increase in the concentration of AIP are related with the concentration of replicative bacteria but we also considered that there is degradation process of AIP. The degradation of AIP is described by, whereas the production of AIP typically has two levels in a Hill type function (Gustafsson et al., 2004) with Hill coefficient 2 to reflect bistability. This is caused by a positive feedback including nonlinearity in the underlying regulation system. The low production rate of AIP is denoted by while the increased production rate is denoted by. The threshold between the low and the increased production is denoted by. For more details see (Müller et al., 2006). With the above-mentioned terms we achieved the following system of equations, which are able to represent the growth dynamics of S. aureus multicellular aggregates:
(20)
(21)
(22)
(23)
It remains necessary to define the initial and boundary conditions. Since the bacteria grow on an agar plate, we chose no-flux boundary conditions, e.g. where Ω denotes the area of the agar plate. The agar has the same concentration of nutrients throughout and therefore we defined the initial condition for the nutrients as constant over the entire domain, e.g. for . The replicative bacteria are set on the agar as a drop in the center. At this stage, neither non-replicative bacteria nor AIP exist and thus the initial conditions read with a compact support, and . The (non-dimensionalized) parameters chosen for this simulation are given by:
Our model was able to capture differences in texture on the surfaces of different S. aureus mutants. For the simulation of mutants, we only changed the parameter value, which corresponds to the modified gene and phenotype for the mutant, the other parameter values were maintained from the wild type, as follows:
| Background | σ | G | p1 | p2 |
|---|---|---|---|---|
| Wild type | 0.5 | 7 | 1 | 1 |
| spa | 0.5 | 3 | 1 | 1 |
| ica | 0.75 | 2 | 1 | 1 |
| psm | 1 | 8 | 1 | 1 |
| psm | 1 | 4 | 1 | 1 |
| agr | 1 | 5 | 0 | 0 |
| spa ica | 1 | 2 | 1 | 1 |
The non-mentioned parameters were maintained at the same value as the wild type strain. In the case of the mutant, as influencing the biofilm, we modified the biofilm production rate constant G from 7 to 3. The mutants and differ from the wild type also by their ability to move on; therefore apart from also the parameter was modified. To obtain the mutant not only a simple change in the parameters is needed, but also a combination of different mutant behaviors since the system influences several components of biofilm production and properties. Especially the ability of the model to produce AIP is lost, expressed by setting p1 and p2 to 0.
Data availability
-
Cell Differentiation Defines Acute and Chronic Infection Cell Types in Staphylococcus aureusPublicly available at the NCBI Gene Expression Omnibus (accession no. GSE69835).
References
-
New unstable variants of green fluorescent protein for studies of transient gene expression in bacteriaApplied and environmental microbiology 64:2240–2246.
-
Heterogeneity in quorum sensing-regulated bioluminescence of Vibrio harveyiMolecular Microbiology 73:267–277.https://doi.org/10.1111/j.1365-2958.2009.06768.x
-
New vector for efficient allelic replacement in naturally nontransformable, low-GC-content, gram-positive bacteriaApplied and Environmental Microbiology 70:6887–6891.https://doi.org/10.1128/AEM.70.11.6887-6891.2004
-
A synthetic Escherichia coli predator-prey ecosystemMolecular Systems Biology 4:187.https://doi.org/10.1038/msb.2008.24
-
Modeling the dynamics of transcriptional gene regulatory networks for animal developmentDevelopmental Biology 325:317–328.https://doi.org/10.1016/j.ydbio.2008.10.043
-
Influence of a functional sigB operon on the global regulators sar and agr in Staphylococcus aureusJournal of Bacteriology 183:5171–5179.https://doi.org/10.1128/JB.183.17.5171-5179.2001
-
Control of replication of plasmid R1: the duplex between the antisense RNA, CopA, and its target, CopT, is processed specifically in vivo and in vitro by RNase IIIThe EMBO journal 9:2331–2340.
-
Agr-mediated dispersal of Staphylococcus aureus biofilmsPLoS Pathogens 4:e1000052.https://doi.org/10.1371/journal.ppat.1000052
-
Osteomyelitis and the role of biofilms in chronic infectionFEMS Immunology & Medical Microbiology 52:13–22.https://doi.org/10.1111/j.1574-695X.2007.00357.x
-
Tackling antibiotic resistanceNature Reviews Microbiology 9:894–896.https://doi.org/10.1038/nrmicro2693
-
Hyperproduction of alpha-hemolysin in a sigB mutant is associated with elevated SarA expression in Staphylococcus aureusInfection and immunity 67:1331–1337.
-
Regulation of virulence determinants in vitro and in vivo in Staphylococcus aureusFEMS Immunology & Medical Microbiology 40:1–9.https://doi.org/10.1016/S0928-8244(03)00309-2
-
Noise in transcription negative feedback loops: simulation and experimental analysisMolecular Systems Biology 2:41.https://doi.org/10.1038/msb4100081
-
Assessment of magnesium status for diagnosis and therapyMagnesium research 23:S194–198.https://doi.org/10.1684/mrh.2010.0213
-
Acapsular clinical Staphylococcus aureus isolates lack agr functionClinical Microbiology and Infection 20:O414–O417.https://doi.org/10.1111/1469-0691.12429
-
Urinary tract infections: epidemiology, mechanisms of infection and treatment optionsNature Reviews Microbiology 13:269–284.https://doi.org/10.1038/nrmicro3432
-
Progressive activation of CyclinB1-Cdk1 coordinates entry to mitosisDevelopmental Cell 18:533–543.https://doi.org/10.1016/j.devcel.2010.02.013
-
Intersection of the stringent response and the CodY regulon in low GC Gram-positive bacteriaInternational Journal of Medical Microbiology 304:150–155.https://doi.org/10.1016/j.ijmm.2013.11.013
-
Phenotypic heterogeneity and temporal expression of the capsular polysaccharide in Staphylococcus aureusMolecular Microbiology 98:1073–1088.https://doi.org/10.1111/mmi.13174
-
Characterization of the sigma(B) regulon in Staphylococcus aureusJournal of Bacteriology 182:6983–6991.https://doi.org/10.1128/JB.182.24.6983-6991.2000
-
Sigma(B) activity depends on RsbU in Staphylococcus aureusJournal of Bacteriology 183:1843–1852.https://doi.org/10.1128/JB.183.6.1843-1852.2001
-
Adaptation of Staphylococcus aureus to the cystic fibrosis lungInternational Journal of Medical Microbiology 300:520–525.https://doi.org/10.1016/j.ijmm.2010.08.003
-
An implementation-focused bio/algorithmic workflow for synthetic biologyACS Synthetic Biology 5:1127–1135.https://doi.org/10.1021/acssynbio.6b00029
-
Staphylococcal strains vary greatly in their ability to induce an inflammatory response in endothelial cellsThe Journal of Infectious Diseases 201:871–880.https://doi.org/10.1086/651023
-
Characterizing the dynamics of the quorum-sensing system in Staphylococcus aureusJournal of Molecular Microbiology and Biotechnology 8:232–242.https://doi.org/10.1159/000086704
-
Magnesium in bone and the magnesium load testMagnesium Research 24:223–224.https://doi.org/10.1684/mrh.2011.0297
-
Extended Staphylococcus aureus persistence in cystic fibrosis is associated with bacterial adaptationInternational Journal of Medical Microbiology 303:685–692.https://doi.org/10.1016/j.ijmm.2013.09.012
-
Staphylococcus aureus-Associated Musculoskeletal InfectionsCurrent topics in microbiology and immunology.https://doi.org/10.1007/82_2016_19
-
Clinical significance and pathogenesis of staphylococcal small colony variants in persistent infectionsClinical Microbiology Reviews 29:401–427.https://doi.org/10.1128/CMR.00069-15
-
Modeling spatio-temporal patterns generated by Bacillus subtilisJournal of Theoretical Biology 188:177–185.https://doi.org/10.1006/jtbi.1997.0462
-
Construction of a reporter vector for the analysis of Bifidobacterium longum promotersApplied and Environmental Microbiology 72:7401–7405.https://doi.org/10.1128/AEM.01611-06
-
Staphylococcus aureus AgrA binding to the RNAIII-agr regulatory regionJournal of Bacteriology 186:7549–7555.https://doi.org/10.1128/JB.186.22.7549-7555.2004
-
Molecular Biology of the StaphylococciAgr: a polycistronic locus regulating exoprotein synthesis in Staphylococcus aureus, Molecular Biology of the Staphylococci, New York, VCH Publishers.
-
Deletion of the alternative sigma factor sigmaB in Staphylococcus aureus reveals its function as a global regulator of virulence genesJournal of bacteriology 180:4814–4820.
-
rRNA regulation during growth and under stringent conditions in Staphylococcus aureusEnvironmental Microbiology 17:4394–4405.https://doi.org/10.1111/1462-2920.12867
-
The interaction of magnesium ions with teichoic acidBiochemical Journal 149:519–524.https://doi.org/10.1042/bj1490519
-
Influence of alanyl ester residues on the binding of magnesium ions to teichoic acidsBiochemical Journal 151:671–676.https://doi.org/10.1042/bj1510671
-
Multidrug tolerance of biofilms and persister cellsCurrent topics in microbiology and immunology 322:107–131.
-
The Sequence Alignment/Map format and SAMtoolsBioinformatics 25:2078–2079.https://doi.org/10.1093/bioinformatics/btp352
-
Cold Spring Harbor perspectives in biologya000398, Cold Spring Harbor perspectives in biology, 2.
-
Extracellular signals that define distinct and coexisting cell fates in Bacillus subtilisFEMS Microbiology Reviews 34:134–149.https://doi.org/10.1111/j.1574-6976.2009.00199.x
-
Structure, activity and evolution of the group I thiolactone peptide quorum-sensing system of Staphylococcus aureusMolecular microbiology 41:503–512.
-
RNase Y of Staphylococcus aureus and its role in the activation of virulence genesMolecular Microbiology 85:817–832.https://doi.org/10.1111/j.1365-2958.2012.08144.x
-
Formation of colony patterns by a bacterial cell populationPhysica A: Statistical Mechanics and its Applications 274:190–199.https://doi.org/10.1016/S0378-4371(99)00328-3
-
The growth of bacterial culturesAnnual Review of Microbiology 3:371–394.https://doi.org/10.1146/annurev.mi.03.100149.002103
-
Overexpression of sigma factor, sigma(B), urges Staphylococcus aureus to thicken the cell wall and to resist beta-lactamsBiochemical and Biophysical Research Communications 288:385–389.https://doi.org/10.1006/bbrc.2001.5774
-
Interdisciplinary Applied MathematicsMathematical Biology, an introduction, Interdisciplinary Applied Mathematics, Vol. 17, 3rd Edn, Springer.
-
Cell-cell communication by quorum sensing and dimension-reductionJournal of Mathematical Biology 53:672–702.https://doi.org/10.1007/s00285-006-0024-z
-
The sociobiology of biofilmsFEMS Microbiology Reviews 33:206–224.https://doi.org/10.1111/j.1574-6976.2008.00150.x
-
Crystal Structures of the SpoIID Lytic Transglycosylases Essential for Bacterial SporulationJournal of Biological Chemistry 291:14915–14926.https://doi.org/10.1074/jbc.M116.729749
-
MRSA virulence and spreadCellular Microbiology 14:1513–1521.https://doi.org/10.1111/j.1462-5822.2012.01832.x
-
The sigmaB regulon in Staphylococcus aureus and its regulationInternational Journal of Medical Microbiology 296:237–258.https://doi.org/10.1016/j.ijmm.2005.11.011
-
Bacterial biofilms: an emerging link to disease pathogenesisAnnual Review of Microbiology 57:677–701.https://doi.org/10.1146/annurev.micro.57.030502.090720
-
Effect of tampon composition on production of toxic shock syndrome toxin-1 by Staphylococcus aureus in vitroThe Journal of Infectious Diseases 173:98–103.https://doi.org/10.1093/infdis/173.1.98
-
Structure and biosynthesis of staphyloxanthin from Staphylococcus aureusJournal of Biological Chemistry 280:32493–32498.https://doi.org/10.1074/jbc.M505070200
-
Incorporation of D-alanine into lipoteichoic acid and wall teichoic acid in Bacillus subtilis. Identification of genes and regulationThe Journal of biological chemistry 270:15598–15606.
-
Phenol-soluble modulins and staphylococcal infectionNature Reviews Microbiology 11:667–673.https://doi.org/10.1038/nrmicro3110
-
The key role of peptidoglycan in the opsonization of Staphylococcus aureusJournal of Clinical Investigation 61:597–609.https://doi.org/10.1172/JCI108971
-
Mitotic progression becomes irreversible in prometaphase and collapses when Wee1 and Cdc25 are inhibitedMolecular Biology of the Cell 22:1191–1206.https://doi.org/10.1091/mbc.E10-07-0599
-
Murine immune response to a chronic Staphylococcus aureus biofilm infectionInfection and Immunity 79:1789–1796.https://doi.org/10.1128/IAI.01386-10
-
Regulation of exoprotein gene expression in Staphylococcus aureus by agarMGG Molecular & General Genetics 202:58–61.https://doi.org/10.1007/BF00330517
-
Preservation of fluorescent protein activity in tumor tissueBioTechniques 34:476–478.
-
Factors affecting competence for transformation in Staphylococcus aureusJournal of bacteriology 118:155–164.
-
Effect of magnesium on production of toxic-shock-syndrome toxin-1 by Staphylococcus aureusJournal of Infectious Diseases 152:618–620.https://doi.org/10.1093/infdis/152.3.618
-
Molecular analysis and organization of the sigmaB operon in Staphylococcus aureusJournal of Bacteriology 187:8006–8019.https://doi.org/10.1128/JB.187.23.8006-8019.2005
-
BookTake it of leave it: Mechanisms underlying bacterial bistable regulatory networks (1 ed)Caister Academic Press.
-
Signaling and DNA-binding activities of the Staphylococcus aureus HssR-HssS two-component system required for heme sensingJournal of Biological Chemistry 282:26111–26121.https://doi.org/10.1074/jbc.M703797200
-
Staphylococcus aureus synthesizes adenosine to escape host immune responsesThe Journal of Experimental Medicine 206:2417–2427.https://doi.org/10.1084/jem.20090097
-
Peptide signaling in the staphylococciChemical Reviews 111:117–151.https://doi.org/10.1021/cr100370n
-
Atomic force microscopy of cell growth and division in Staphylococcus aureusJournal of Bacteriology 186:3286–3295.https://doi.org/10.1128/JB.186.11.3286-3295.2004
-
Staphylococcus aureus small-colony variants are adapted phenotypes for intracellular persistenceThe Journal of Infectious Diseases 202:1031–1040.https://doi.org/10.1086/656047
-
Phosphatases modulate the bistable sporulation gene expression pattern in Bacillus subtilisMolecular Microbiology 56:1481–1494.https://doi.org/10.1111/j.1365-2958.2005.04659.x
-
Generation of virulence factor variants in Staphylococcus aureus biofilmsJournal of Bacteriology 189:7961–7967.https://doi.org/10.1128/JB.00789-07
-
Reconstruction of mreB expression in Staphylococcus aureus via a collection of new integrative plasmidsApplied and Environmental Microbiology 80:3868–3878.https://doi.org/10.1128/AEM.00759-14
-
A dye release assay for determination of lysostaphin activityAnalytical Biochemistry 171:141–144.https://doi.org/10.1016/0003-2697(88)90134-0
Article and author information
Author details
Juan-Carlos García-Betancur

Funding
H2020 European Research Council (335568)
- Daniel Lopez
Deutsche Forschungsgemeinschaft (Lo1804-2/2)
- Daniel Lopez
Ministerio de Economía y Competitividad (BFU2014-55601-P)
- Daniel Lopez
The funders had no role in study design, data collection and interpretation, or the decision to submit the work for publication.
Acknowledgements
We thank M Luna (CSIC, Spain) for assistance with atomic force microscopy and C Mark (CSIC, Spain) for editorial assistance. JCGB was supported by GSLS from the University of Würzburg. Sequencing files have been deposited in the NCBI GEO Series (accession number GSE69835).
Ethics
Animal experimentation: All animal studies were approved by the local government of Lower Franconia, Germany (license number 55.2-DMS-2532-2-57 and were performed in strict accordance with the guidelines for animal care and animal experimentation of the German animal protection law and directive 2010/63/EU of the European parliament on the protection of animals used for scientific purposes.
Copyright
© 2017, García-Betancur et al.
This article is distributed under the terms of the Creative Commons Attribution License, which permits unrestricted use and redistribution provided that the original author and source are credited.
Metrics
-
- 4,729
- views
-
- 710
- downloads
-
- 80
- citations
Views, downloads and citations are aggregated across all versions of this paper published by eLife.
Citations by DOI
-
- 80
- citations for umbrella DOI https://doi.org/10.7554/eLife.28023
Download links
A two-part list of links to download the article, or parts of the article, in various formats.
Downloads (link to download the article as PDF)
Open citations (links to open the citations from this article in various online reference manager services)
Cite this article (links to download the citations from this article in formats compatible with various reference manager tools)
Cell differentiation defines acute and chronic infection cell types in Staphylococcus aureus
eLife 6:e28023.
https://doi.org/10.7554/eLife.28023


