Cell differentiation defines acute and chronic infection cell types in Staphylococcus aureus
- University of Würzburg, Germany
- Newcastle University, United Kingdom
- Technical University of Munich, Germany
- University Hospital Würzburg, Germany
- National Center for Biotechnology, Spain
Figures
Figure 1 with 1 supplement
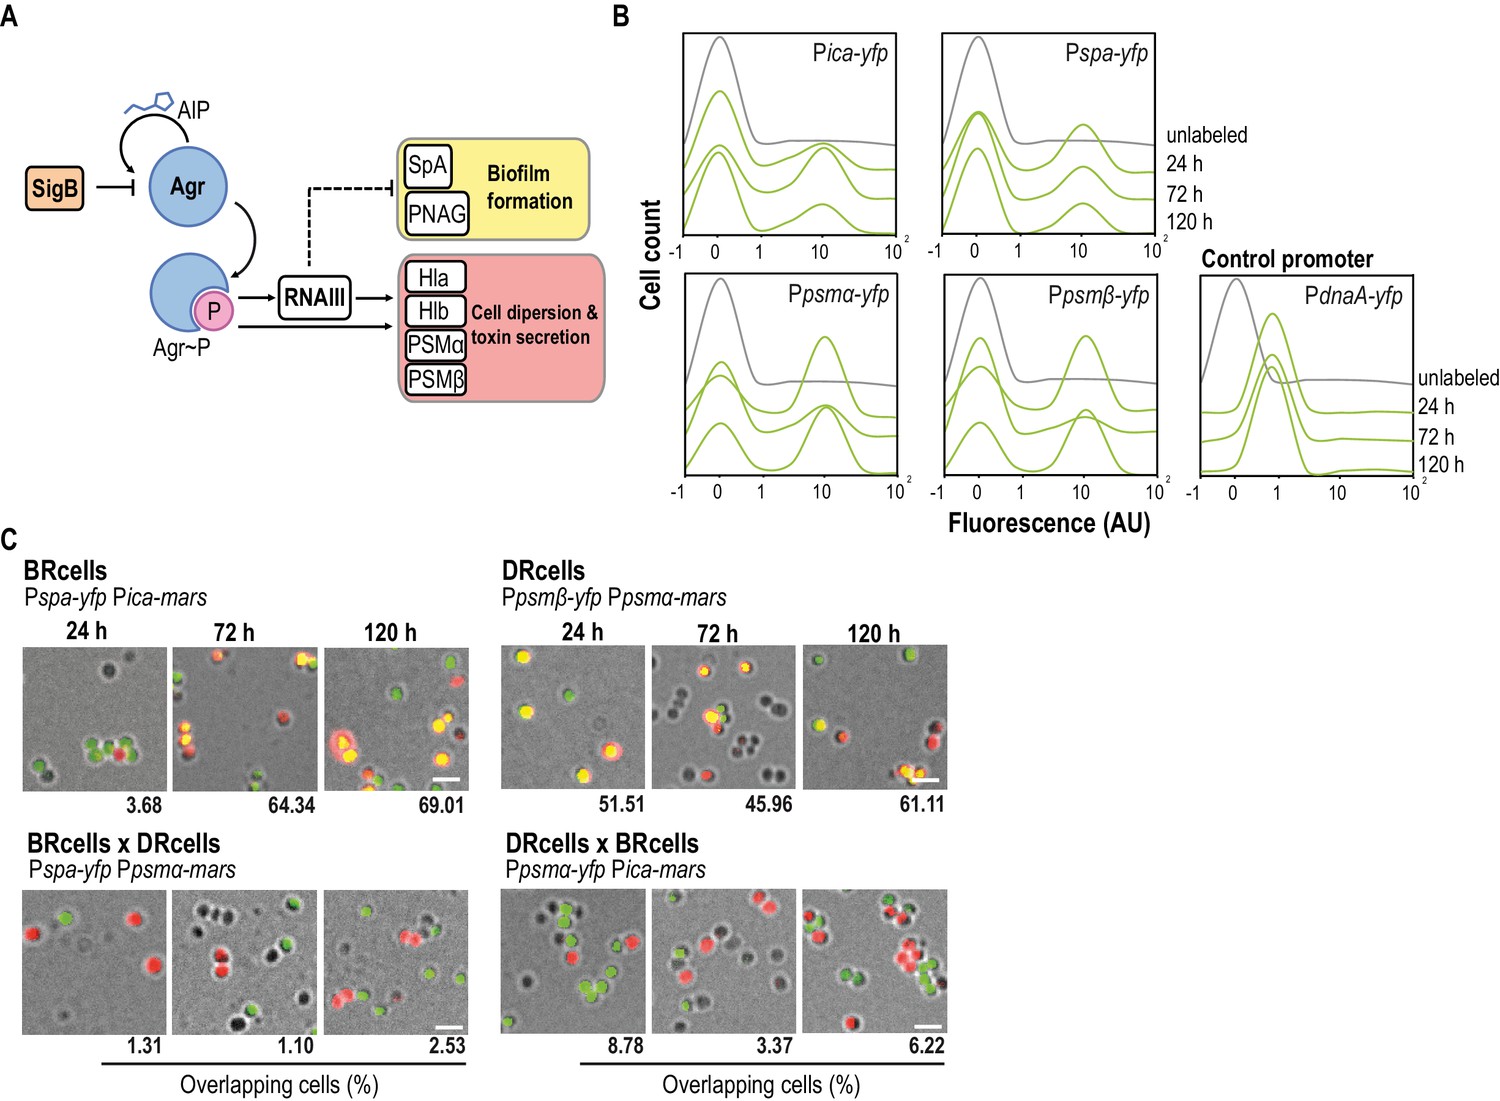
Staphylococcus aureus aggregates contain specialized cell types.
(A) Scheme of the agr signaling cascade in S. aureus. AIP binds to the AgrC histidine kinase membrane receptor and activates its cognate regulator AgrA via phosphorylation (AgrA~P). AgrA~P upregulates toxin-coding genes that are also responsible for cell dispersion (hla, hlb, psmα and psmβ) and it downregulates genes involved in biofilm formation (ica and spa). (B) Quantitative analysis of fluorescence microscopy images of agr-related promoters. The control promoter is the agr-independent dnaA, which has a monomodal expression pattern. We counted 700 random cells from each of three independent microscopic fields from independent experiments (2100 cells total for each strain). (C) Fluorescence microscopy images of double-labeled cells at various times during aggregate formation (24, 72 and 120 hr). Percentages of cells quantified in the fields with positive overlapping signal. Cells were counted as in (A). A signal is considered to overlap when signals are detected in a 3:1-1:3 range, the range in which green and red signals merge to yellow. Top row, double-labeled strains with Pica-yfp, Pspa-yfp (BRcells) and Ppsmα-yfp, Ppsmβ-yfp (DRcells) promoters. Bottom row, double-labeled strains with antagonistic promoters. Bar = 2 μm.
Figure 1—figure supplement 1
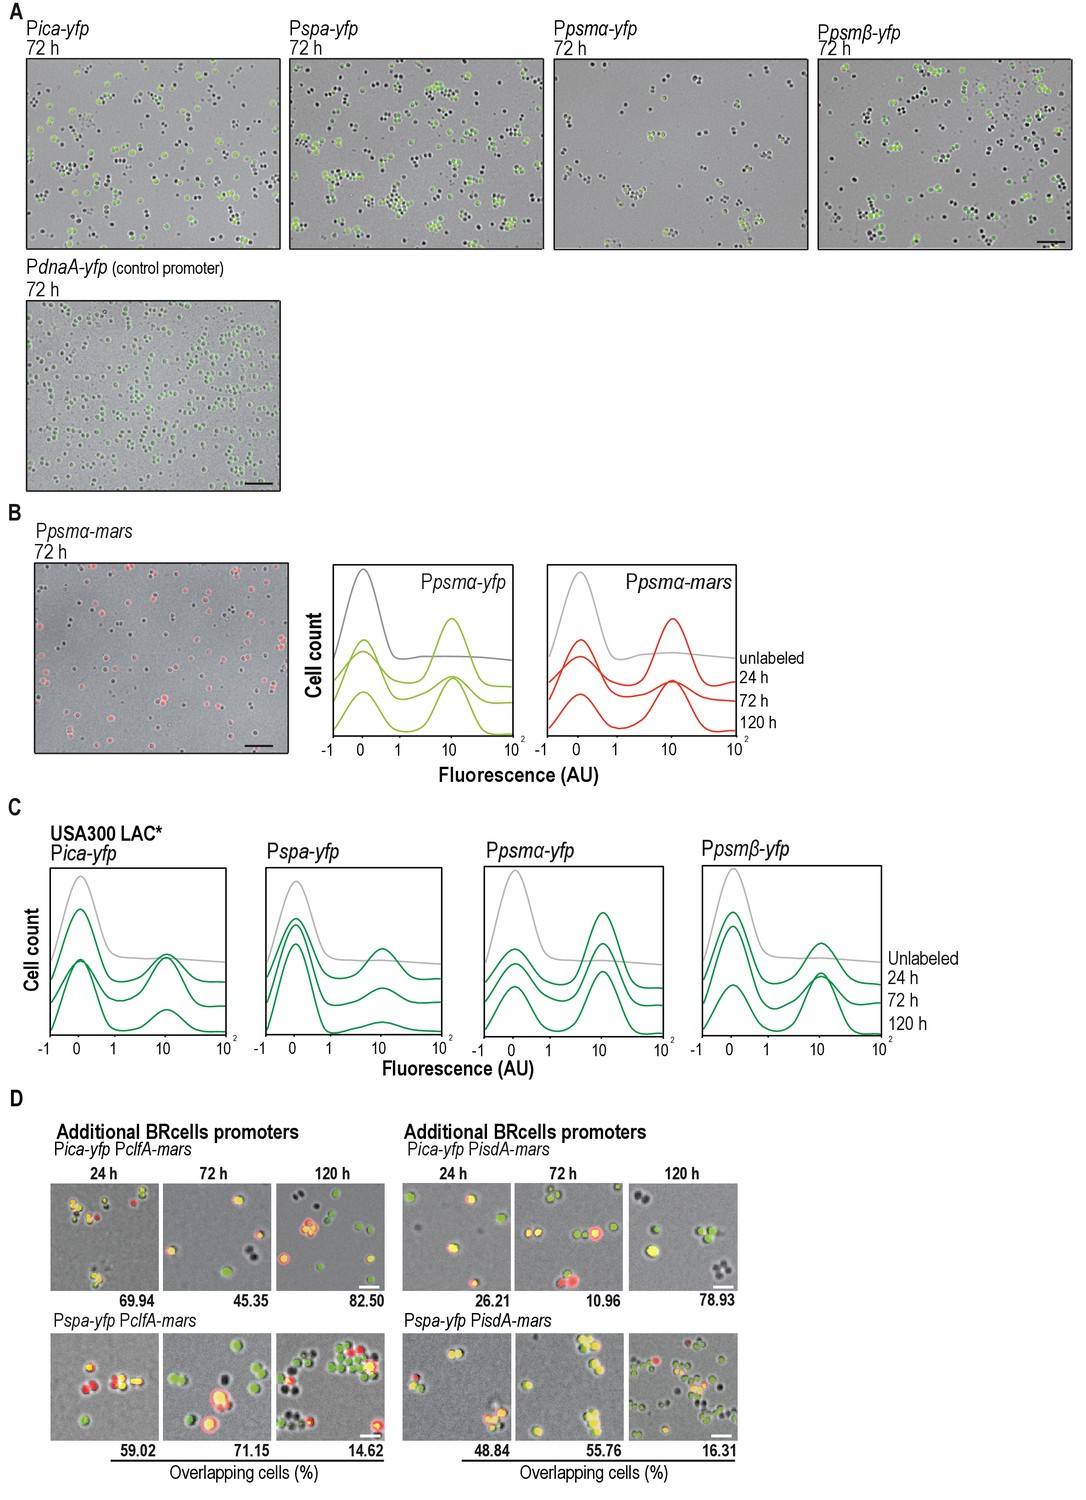
Staphylococcus aureus multicellular aggregates contain distinct cell types.
(A) Fluorescence microscopy image fields of S. aureus cells harboring transcriptional fusions of biofilm-associated ica/spa genes and planktonic psmα/β agr-related genes and, the transcriptional fusion of the housekeeping gene dnaA. Expression of this gene is not regulated by the agr positive feedback loop and therefore, its shows a homogeneous unimodal expression in S. aureus cultures. The fluorescence signal is false-colored in green. Scale bar is 20 μm. (B) Left panel, fluorescence microscopy images fields of S. aureus cells harboring a transcriptional fusion of Ppsmα-mars. Fluorescence signal related to the expression of Mars is false-colored in red. Scale bar = 20 μm. Right panel, expression patterns of yfp- and mars-labeled strains. Histograms representing the quantitative analysis of cell fluorescence in microscopy images of strains labeled with the Ppsmα−yfp or Ppsmα-mars transcriptional fusions. Images were taken at different time points (24, 72 and 120 hr). Expression profiles of the two reporters are comparable thus our results are not affected by the use of YFP or RFP (mars) fluorescent proteins. (C) Specialized cell types are detected in different S. aureus strains. Histograms representing the quantitative analysis of cell fluorescence in microscopy images of cells labeled with transcriptional fusions of biofilm-associated ica/spa genes and planktonic psmα/β agr-related genes in the MRSA clinical isolate USA300 LAC*. Subpopulations of cells expressing higher and lower fluorescence are detected in multicellular aggregates of the different S. aureus strains. (D) Fluorescence microscopy images of double-labeled strains simultaneously expressing BRcell reporters and additional reporters for adhesion proteins (PclfA-mars and PisdA-mars). Bar = 2 μm.
Figure 2 with 1 supplement
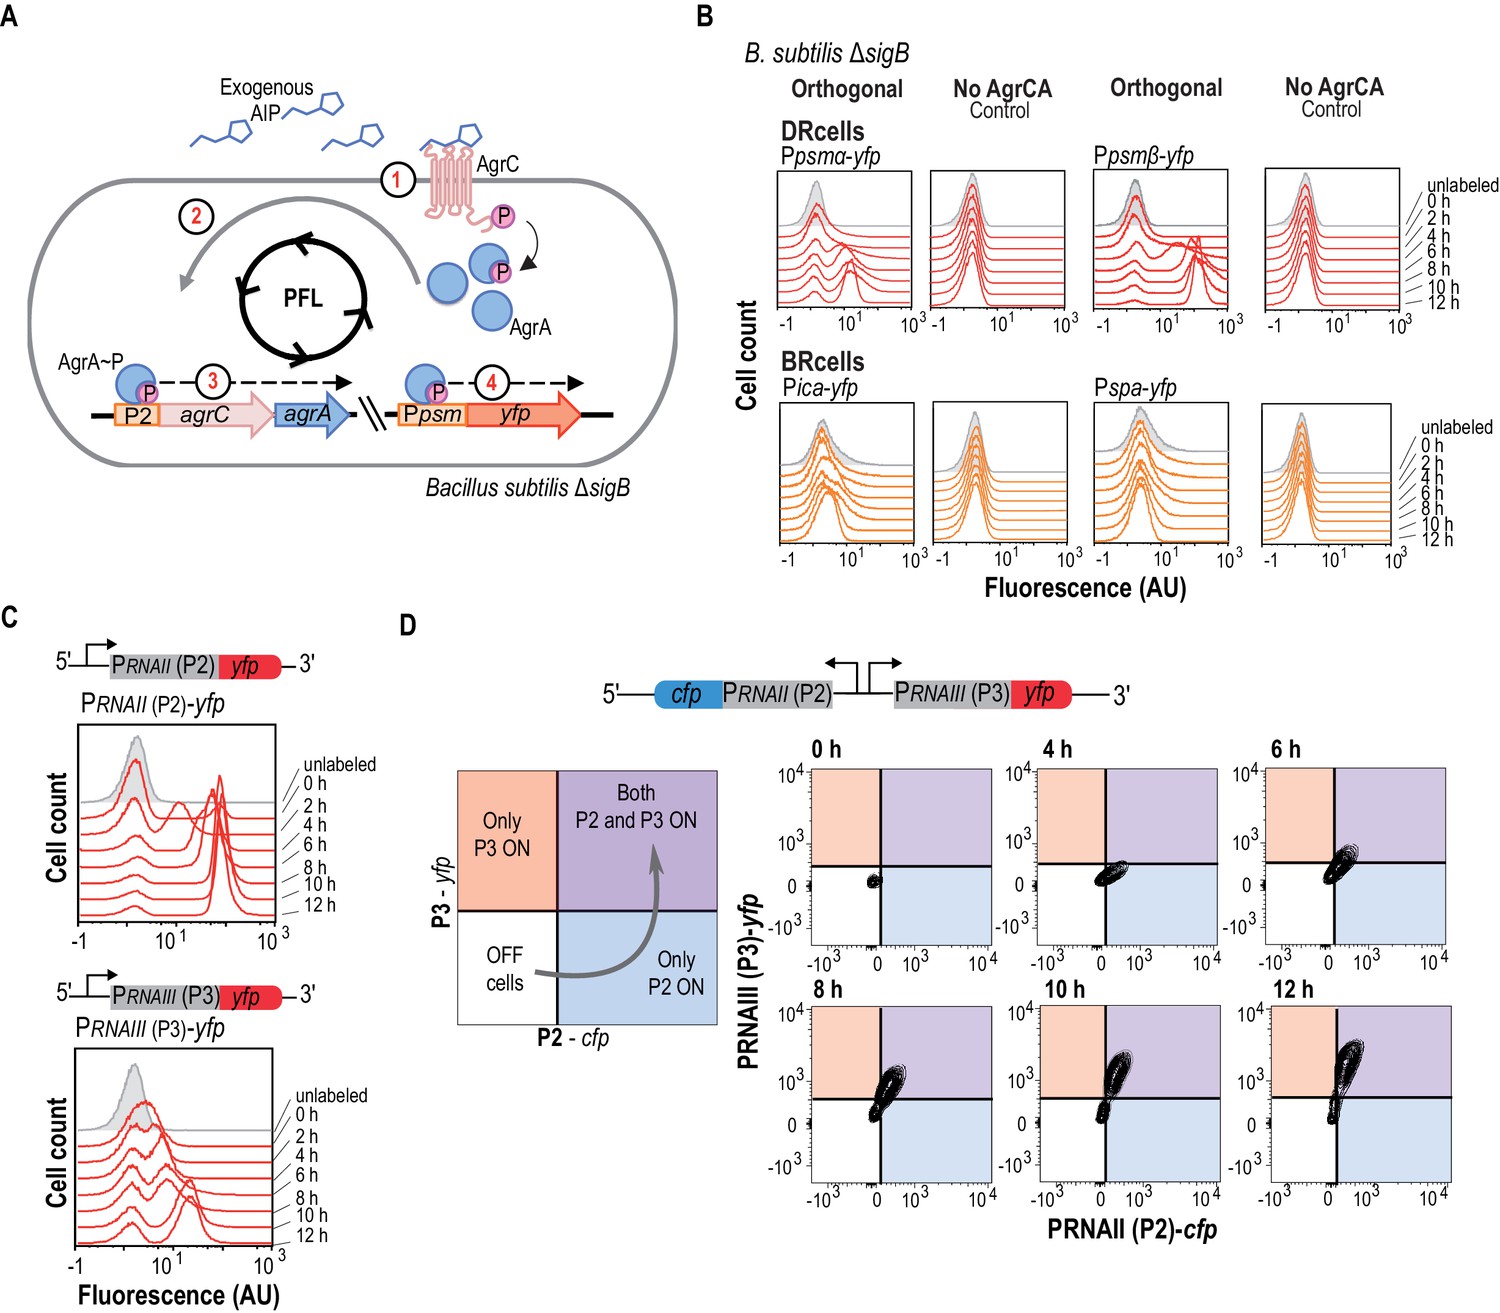
The agr QS system is an autonomous program for cell fate decision-making.
(A) Scheme showing the orthogonal system generated in Bacillus subtilis. In this system, the membrane kinase AgrC and its cognate regulator AgrA were expressed under the control of their own P2 promoter. This strain also harbors a Ppsmα-yfp or a Ppsmβ-yfp reporter, which allows monitoring agr activation. Addition of purified AIP to B. subtilis cultures as input signal activated the agr system and led to bimodal expression of chromosomally integrated Ppsmα- or Ppsmβ-yfp reporters. (B) Flow cytometry profiles of the orthogonal agr system in B. subtilis showing bimodal expression of the agr-dependent psmα/β reporters at different times after AIP induction. Control panels show no expression of these reporters without the AgrCA chimera. The ica/spa promoters were not activated, as they are not regulated directly by AgrA~P (Recsei et al., 1986; Boles and Horswill, 2008; Peng et al., 1988). Cultures were grown in liquid LB medium and incubated (37°C, 12 hr, 200 rpm agitation). (C) Flow cytometry showed bimodal expression of P2 (up) and P3 (down) promoters after AIP induction. Cultures were grown in liquid LB medium and incubated (37°C, 12 hr, 200 rpm agitation). (D) Flow cytometry monitoring simultaneous expression of PRNAII or P2 (y-axis) and PRNAIII or P3 (x-axis) in a population of P2-cfp P3-yfp double-labeled cells cultured with AIP (10 μM). Samples were collected at various times and represented in a 2D graph (x axis, CFP signal; y axis, YFP signal). Dual system at various times after AIP induction. Isolines in the graph represent cell populations. The subpopulation that initially expressed the P2-cfp reporter was the same as that which later expressed the P3-yfp reporter.
Figure 2—figure supplement 1

Mathematical simulations of the agr orthologous system.
(A) Flow cytometry profiles of the orthogonal agr system in B. subtilis ΔsigB and control experiments with B. subtilis wild type strain and, when no AIP was added to the cultures. In this control experiment, expression of the reporters was not detected, which indicates that the orthogonal system responds to the presence of AIP in the medium and is not influenced by additional inputs. Cultures were grown in liquid LB medium and were incubated at 37°C for 12 hr with 200 rpm agitation. (B) Computational analysis of promoter expression (red) relative to experimental data (blue) allowed definition of promoter expression dynamics and parameters; Kon (AgrA~P promoter binding rate), Koff (release rate) and Kt (transcription rate). (C) Mathematical simulation of the effect of exogenous AIP entry in the orthogonal system to induce the activation of P2 expression (blue bars) and P3 expression (red bars) promoters. The maximum value of 40 represents the saturation level of exogenous AIP. In the mathematical model, expression of the promoters is activated in response to an increase of AIP concentration or in response to an increase in the exposure time to a defined AIP concentration. In this simulation, the expression of PRNAII-yfp (reporter used as a proxy to monitor P2 expression) and PRNAIII-yfp (reporter used as a proxy to monitor P3 expression) responded to an increase of the AIP entry rate into the system. The X-axis represents the different rates for AIP entry of AIP (Kintroduction). Y-axis represents the activation of the agr system via quantification of the size of the subpopulation that expresses the reporter. Quantitative changes in the activation state of P2 and P3 can be explained by just altering the entry rate of exogenous AIP into the system. The level of AIP correlates to the production of AgrA~P, which in turn, plays a key role in activation of the program for cell-fate decision-making. This behavior is observed experimentally in the orthogonal system when increased the exposure time to a defined concentration of AIP. (D) Temporal ‘bursts’ of promoter expression for the P2 and P3 promoters. This mathematical modeling of P2 and P3 expression simulates the behavior of the positive feedback loop (time to become functional) in relation to the binding efficiency of the AgrA~P. This simulation shows early activation (‘bursts’) of P2 followed by later and more frequent ‘bursts’ of P3. The positive feedback loop acts as a retardant that controls activation of the system. Activation of P2 occurred after approximately three hours of exposure to exogenous AIP and the number of bursts increased significantly after three hours of exposure (i.e. four to six hours), which strongly suggests the existence of a positive feedback loop. Activation of P3 relies on activation of the positive feedback loop and occurred after seven hours of exposure to exogenous AIP, once the positive feedback loop is active. (E) Mathematical simulation of P2 (y-axis) and P3 (x-axis) expression in 20,000 cells of the dual system. Grey dots represent cells. Arrows indicate transition between states. Left, AgrA~P saturation; center, absence of P; right, low AgrA~P concentration (K(i)~P introduction rate; K(p) phosphorylation rate). (F) Color-switch of the dual orthogonal system. Flow cytometry analysis of simultaneous expression of P2 (RNAII) (y-axis) and P3 (RNAIII) (x-axis) in the dual system at different time points after AIP induction. In this control experiment, the CFP and YFP proteins were switched from the P2 to the P3 promoter, respectively. The panel shows FACS analysis in which YFP and CFP signals are simultaneously monitored in a population of P2-yfp P3-cfp double-labeled cells that were grown in the presence of exogenous AIP (10 μM). We compared its differentiation pattern to the original P2-cfp P3-yfp strain that is shown in Figure 2D. Samples were collected at several time points during incubation and plotted in a 2D graph in which P2-yfp signal is represented in the Y axis and P3-cfp signal is represented in the X axis. Isolines in the graph represent cells population. The subpopulation of cells that initially expressed P2-yfp reporter is the subpopulation that expressed P3-cfp reporter later on. Results were similar to Figure 2D, indicating that maturation differences in the fluorescent proteins do not influence results.
Figure 3 with 1 supplement

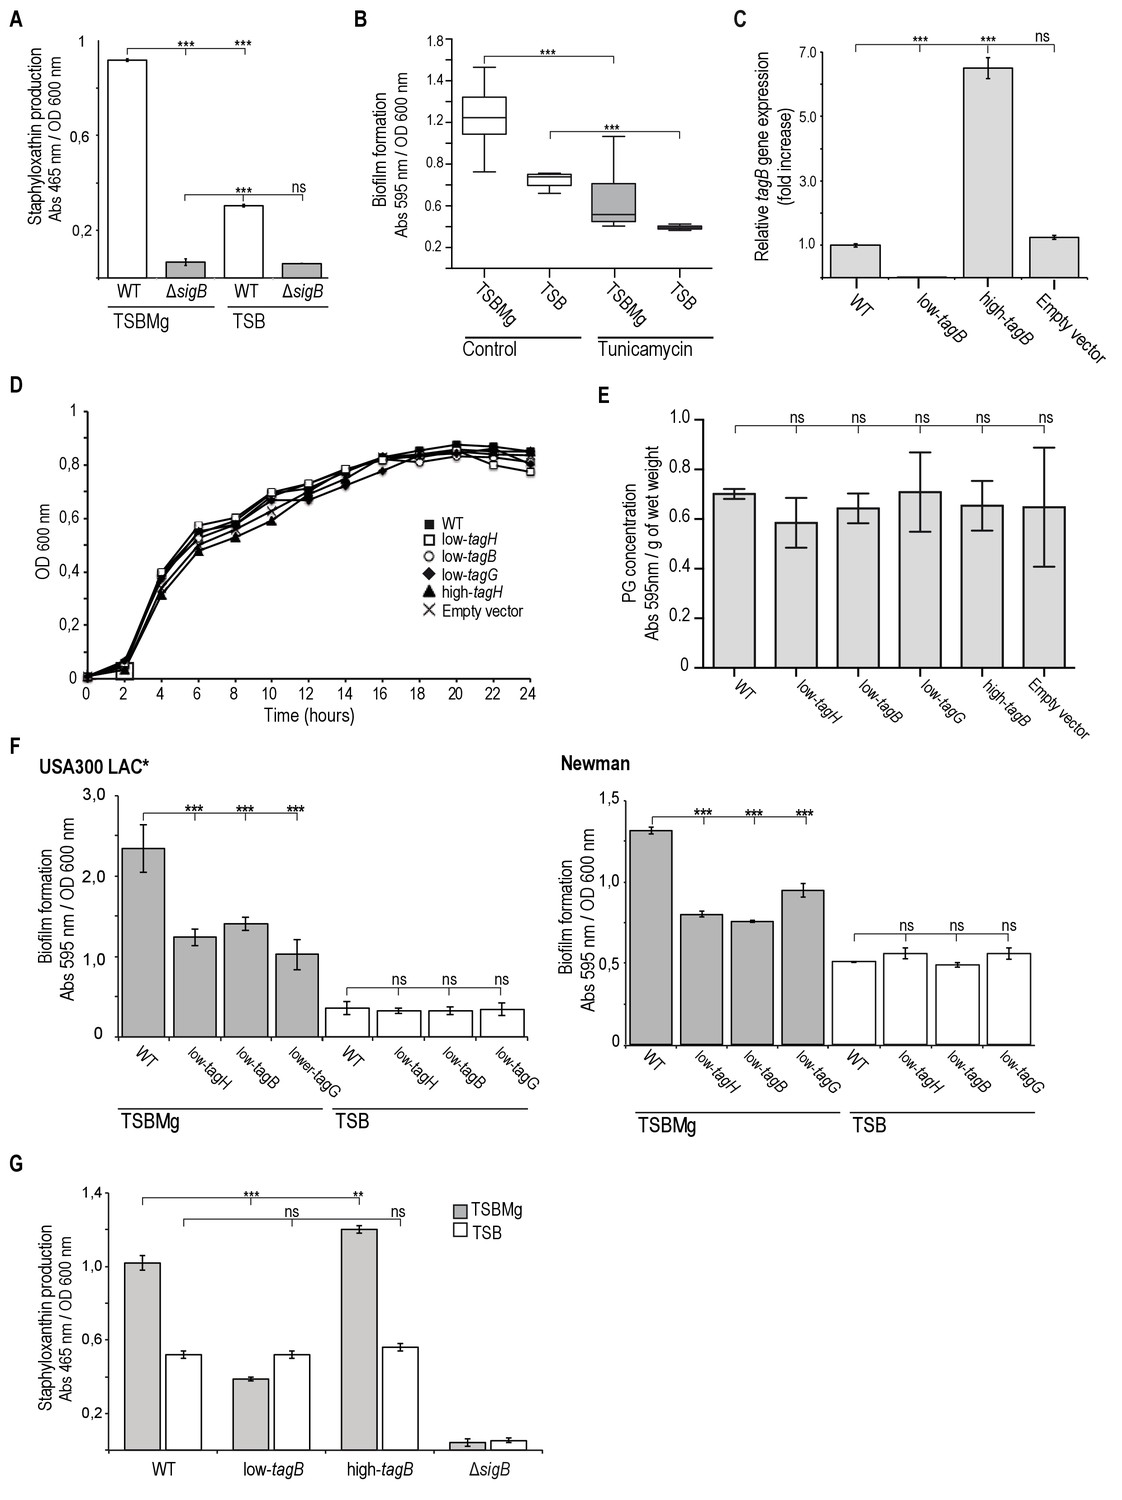
Extracellular Mg2+increases cell wall rigidity in S. aureus.
(A) qRT-PCR assay to monitor σB activation using relative asp23 expression as readout (expression of this gene is dependent on σB activity) in TSB and TSBMg cultures of S. aureus strains of different genetic backgrounds. The ΔdltA mutant was used as control strain to show reduced asp23 expression in TSB and increased expression in TSBMg. (B) Biofilm formation quantification in S. aureus strain Newman wild type strain using the traditional microtiter assay (O'Toole and Kolter, 1998b) in liquid TSBMg and TSB. (C) Biofilm formation quantification in different S. aureus genetic backgrounds using the traditional microtiter assay (O'Toole and Kolter, 1998b) in liquid TSBMg and TSB. The ΔsigB strain did not form biofilm in TSBMg and the biofilm formation phenotype was partially recovered in a ΔsigBΔagr double mutant. (D) Atomic force microscopy quantification of S. aureus cell surface rigidity (in KPa). Mean surface rigidity was measured using force-indentation curves and Young’s modulus. Best fits were produced with a modified Hertz model, assuming conical punch probe geometry. The ΔdltA mutant serves as positive control, as described (Saar-Dover et al., 2012). In this mutant, D-alanine esterification of TA is absent (Perego et al., 1995). D-alanylation of TA introduces positively charged amines and prevents repulsive interactions between neighboring ribitol phosphates, which increases cell wall rigidity, similar to the effect of Mg2+ incorporation to the cell wall. Cell wall rigidity was therefore compromised in the Δdlt mutant when grown in TSB medium. (E, F) Quantification of biofilm formation in liquid TSBMg and TSB of S. aureus WT, low-tagB (E) and high-tagB strains (F). All experiments show the mean ±SD for three independent experiments (n = 3). Statistical significance was measured using unpaired Student's t-test for panel (A); for remaining panels, we used one-way ANOVA with Tukey's test for multiple comparisons. *p<0.05, **p<0.01, ***p<0.001; ns, no significant differences.
Figure 3—figure supplement 1
Extracellular Mg2+ activates σB stress regulon in S. auresus.
(A) Quantification of staphyloxantin production in TSBMg and TSB media was used as a proxy to monitor activation of σB, since the expression of the operon responsible for staphyloxanthin production is directly regulated by σB (Kullik et al., 1998; Gertz et al., 2000; Cheung et al., 1999; Morikawa et al., 2001). Therefore, a σB-deficient mutant shows no pigmentation differences growing in TSBMg and TSB media. (B) Quantification of biofilm formation of S. aureus WT in liquid TSBMg and TSB, alone or with sublethal doses of tunicamycin (0.8 mg/ml). (C) qRT-PCR assay to monitor TA expression in low-tagB and high-tagB strains using relative tagB expression. (D, E) Low-tagB and high-tagB strains growth analyses. No significant differences in growth (D) and peptidoglycan production (E) were detected in comparison to WT strain. Growth curves were performed in TSB medium at 37°C with 200 rpm agitation. of WT and several genetically engineered strains that produced different levels of TA in TSB medium. Peptidoglycan quantification of WT and several genetically engineered strains that produced different levels of TA. (F) Quantification of biofilm formation of different genetic backgrounds in liquid TSBMg and TSB. Biofilm formation was monitored in WT and several genetically engineered strains that produced different levels of TA in the MRSA USA300 LAC* and Newman strains. (G) Quantification of staphyloxanthin production as a proxy for σB activity in S. aureus WT, ΔsigB, and engineered strains that express distinct levels of TA on the cell wall. Data represent mean of three independent experiments (n = 3). Error bars represent standard deviation (mean ±SD). Statistical significance was measured using one-way ANOVA and Tukey's test for multiple comparisons. *p>0.05, **p<0.01, ***p<0.001. ns No significant differences.
Figure 4
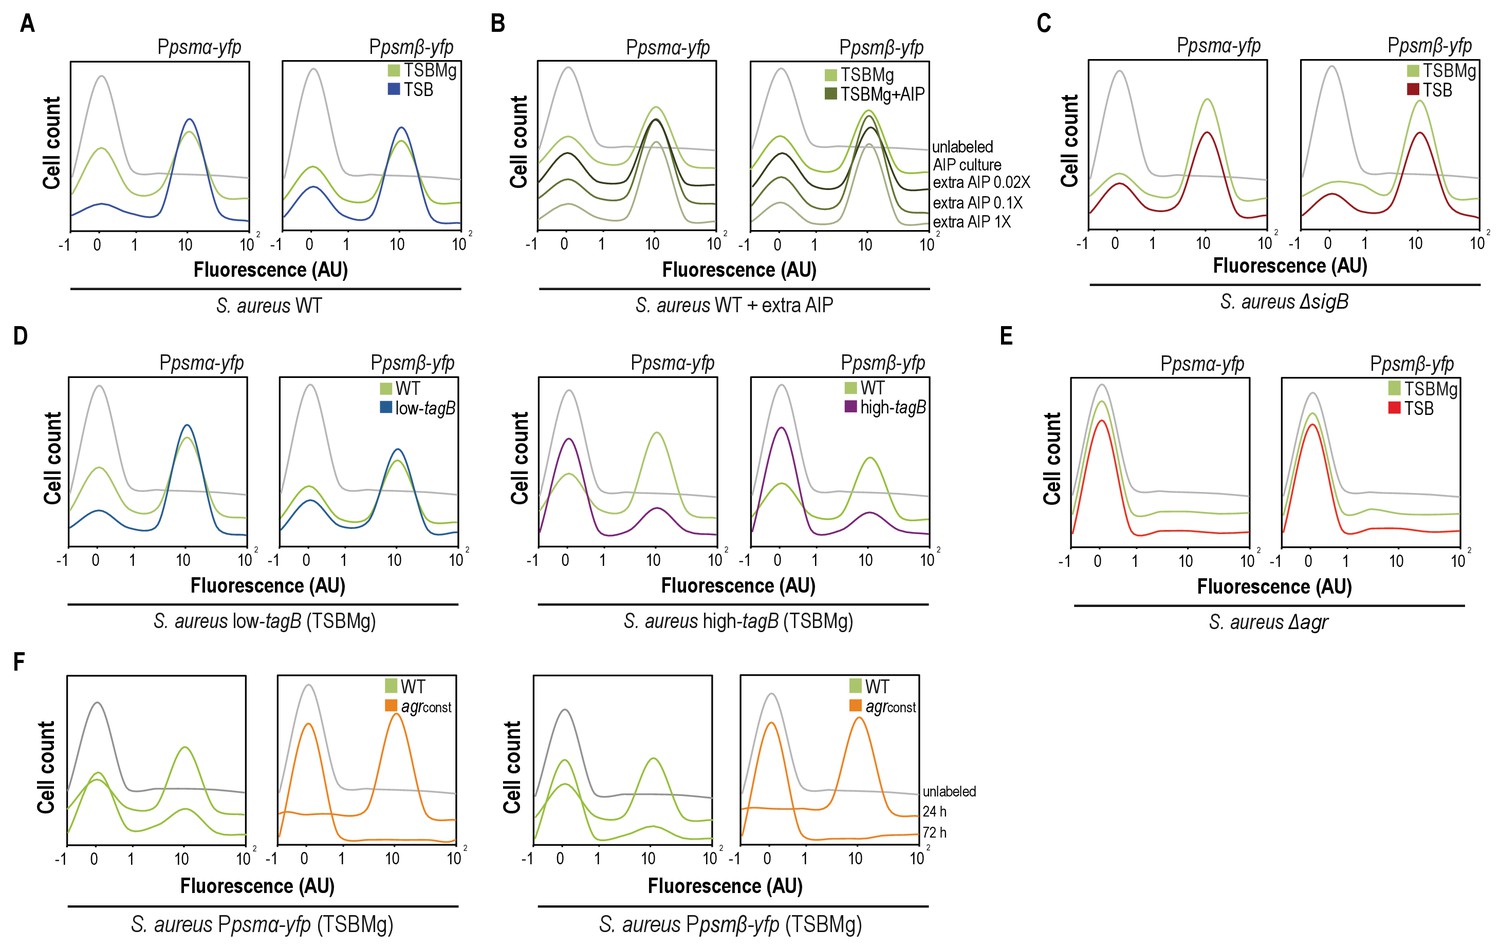
AIP and Mg2+modulate the BRcell:DRcell ratio in S. aureus communities.
(A) Quantitative analysis of fluorescence microscopy images of agr-related promoters (Ppsmα and Ppsmβ) in TSBMg and TSB. We counted ~700 random cells from each of three independent microscopic fields from independent experiments (~2100 cells total for each strain). In the absence of extracellular Mg2+, the proportion of DRcells increases in the staphylococcal community, in accordance with the role of Mg2+ in repression of agr via σB. (B) Quantitative analyses of fluorescence microscopy images (n = 2100) of agr-related promoters in TSBMg with different concentrations of exogenous AIP1 (0.02x to 1x). Increasing AIP1 concentrations above threshold upregulates the agr bimodal switch and increases DRcell subpopulation size, although both on and off subpopulations are always detected (‘AIP culture’=no exogenous AIP, equivalent to the 10 μM threshold concentration). (C) Quantitative analyses of fluorescence microscopy images (n = 2100) of agr-related promoters of S. aureusΔsigB mutant in TSBMg and TSB. The ΔsigB mutant shows upregulation of the agr bimodal switch and differentiates a larger DRcell subpopulation. (D) Quantitative analysis of fluorescence microscopy images (n = 2100) of agr-related promoters in TSBMg and TSB, using engineered S. aureus strains that produce different TA levels (low-tagB and high-tagB). The differential sensitivity of these strains to extracellular Mg2+ alters the proportion of DRcells within S. aureus aggregates. (E) Quantitative analyses of fluorescence microscopy images (n = 2100) of agr-related promoters of S. aureusΔagr mutant in TSBMg and TSB. The Δagr mutant lacks the bimodal switch that triggers cell differentiation. (F) Quantitative analysis of fluorescence microscopy images (n = 2100) of agr-related promoters in TSBMg, of S. aureus WT and a strain engineered to express the agrBDCA operon under the control of a constitutive promoter (agrconst); this disrupted the positive feedback loop, as the promoter that activates agr expression is no longer self-inducible. In the absence of a functional agr positive feedback loop, cell differentiation was not detected and Ppsmα and Ppsmβ reporter expression was homogeneous throughout the bacterial population.
Figure 5 with 2 supplements
Collective behavior of BRcells and DRcells in vitro.
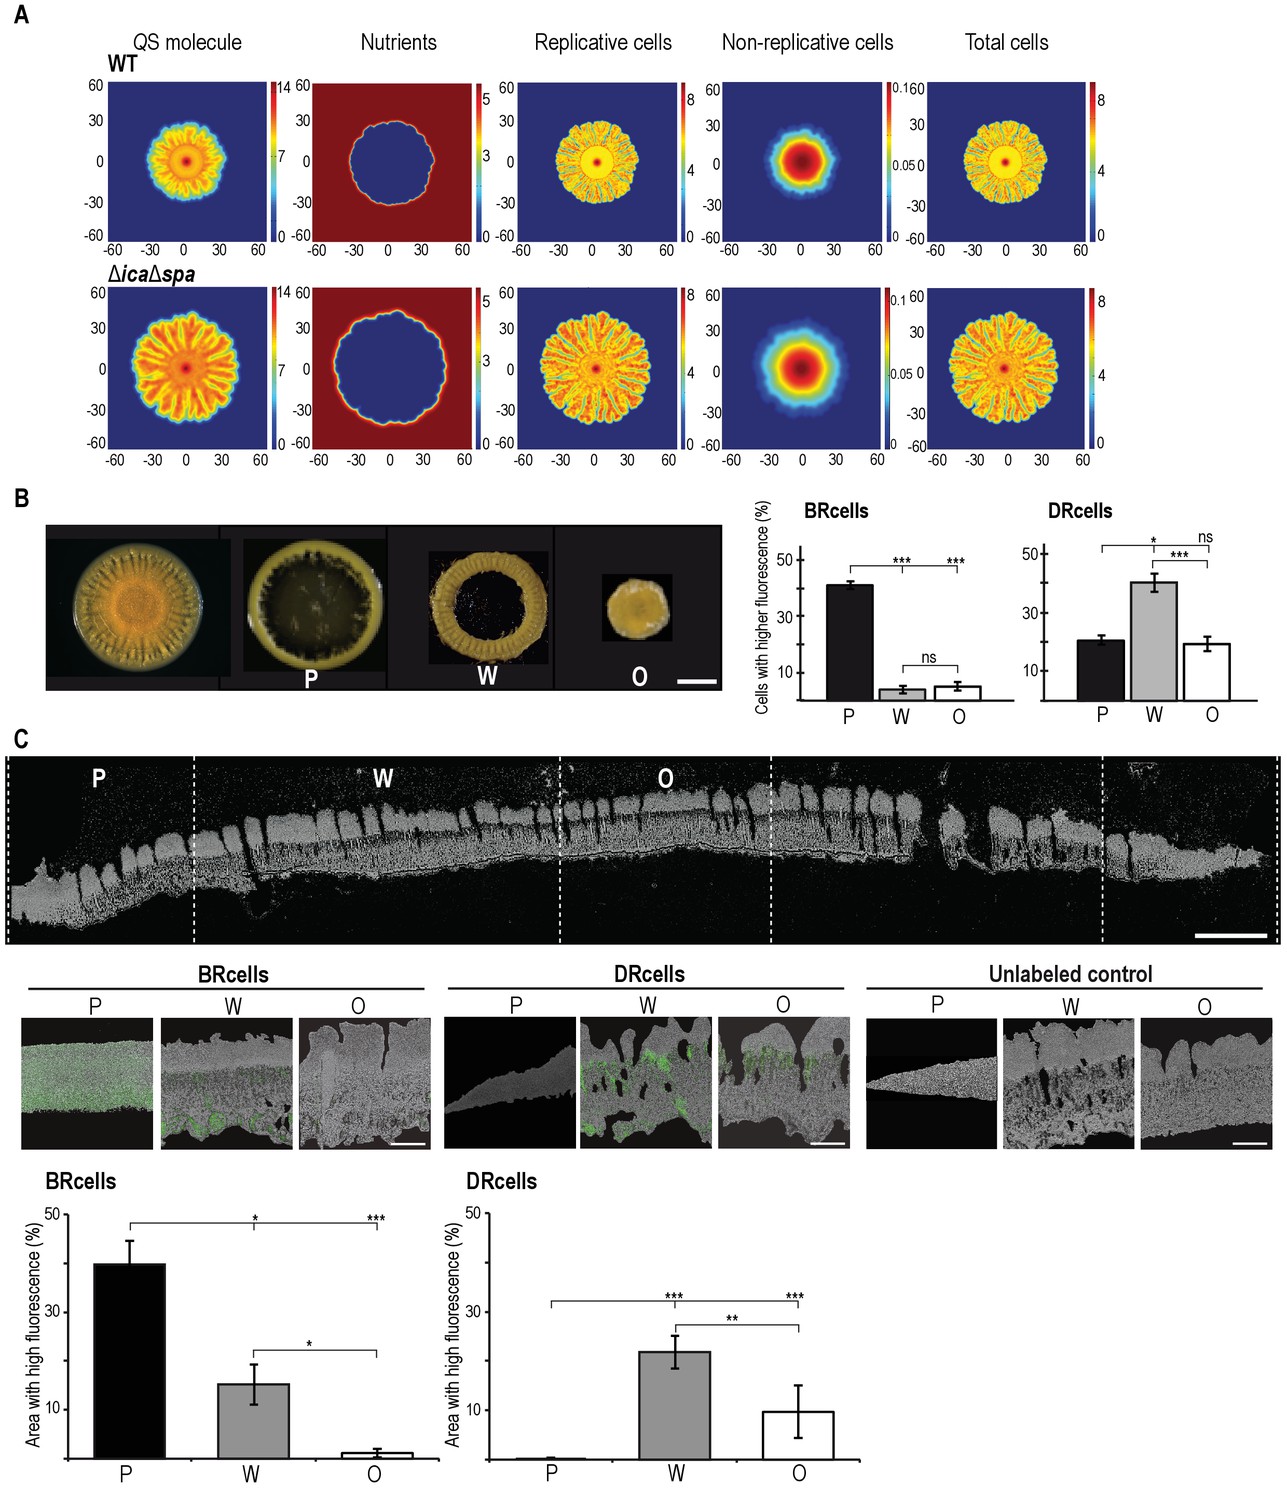
(A) Mathematical modeling of WT and a matrix-deficient mutant (ΔicaΔspa) S. aureus growth in multicellular aggregates. Local concentrations of factors that affect AIP activity are represented on a color scale. (B) Left, dissection of a 5 day multicellular aggregate into three distinct, concentric morphological regions, a peripheral region (P), a surrounding wrinkled area (W) and a central older region or origin (O); each one can be separated from the aggregate and processed independently. Bar = 5 mm. Right, quantitative analysis of flow cytometry data for BRcells and DRcells in concentric regions of a mature aggregate (n = 50,000). (C) Top, longitudinal-transverse cryosection of a mature S. aureus aggregate. Bar = 500 μm. Center, spatial distribution of BRcells and DRcells within the aggregate. Bar = 100 μm. Bottom, quantitative estimate of BRcells (ica and spa reporters) and DRcells (Ppsmα and Ppsmβreporters) fluorescent area over the total thin section aggregate area in representative images (see Material and methods for quantification details). Statistical significance was measured using one-way ANOVA and Tukey's test for multiple comparisons. *p<0.05, **p<0.01, ***p<0.001; ns, no significant differences. Data shown as mean ±SD of three independent experiments (n = 3).
Figure 5—figure supplement 1
Staphylococcus aureus develops architecturally complex multicellular aggregates in Magnesium-supplemented TSB medium (TSBMg).
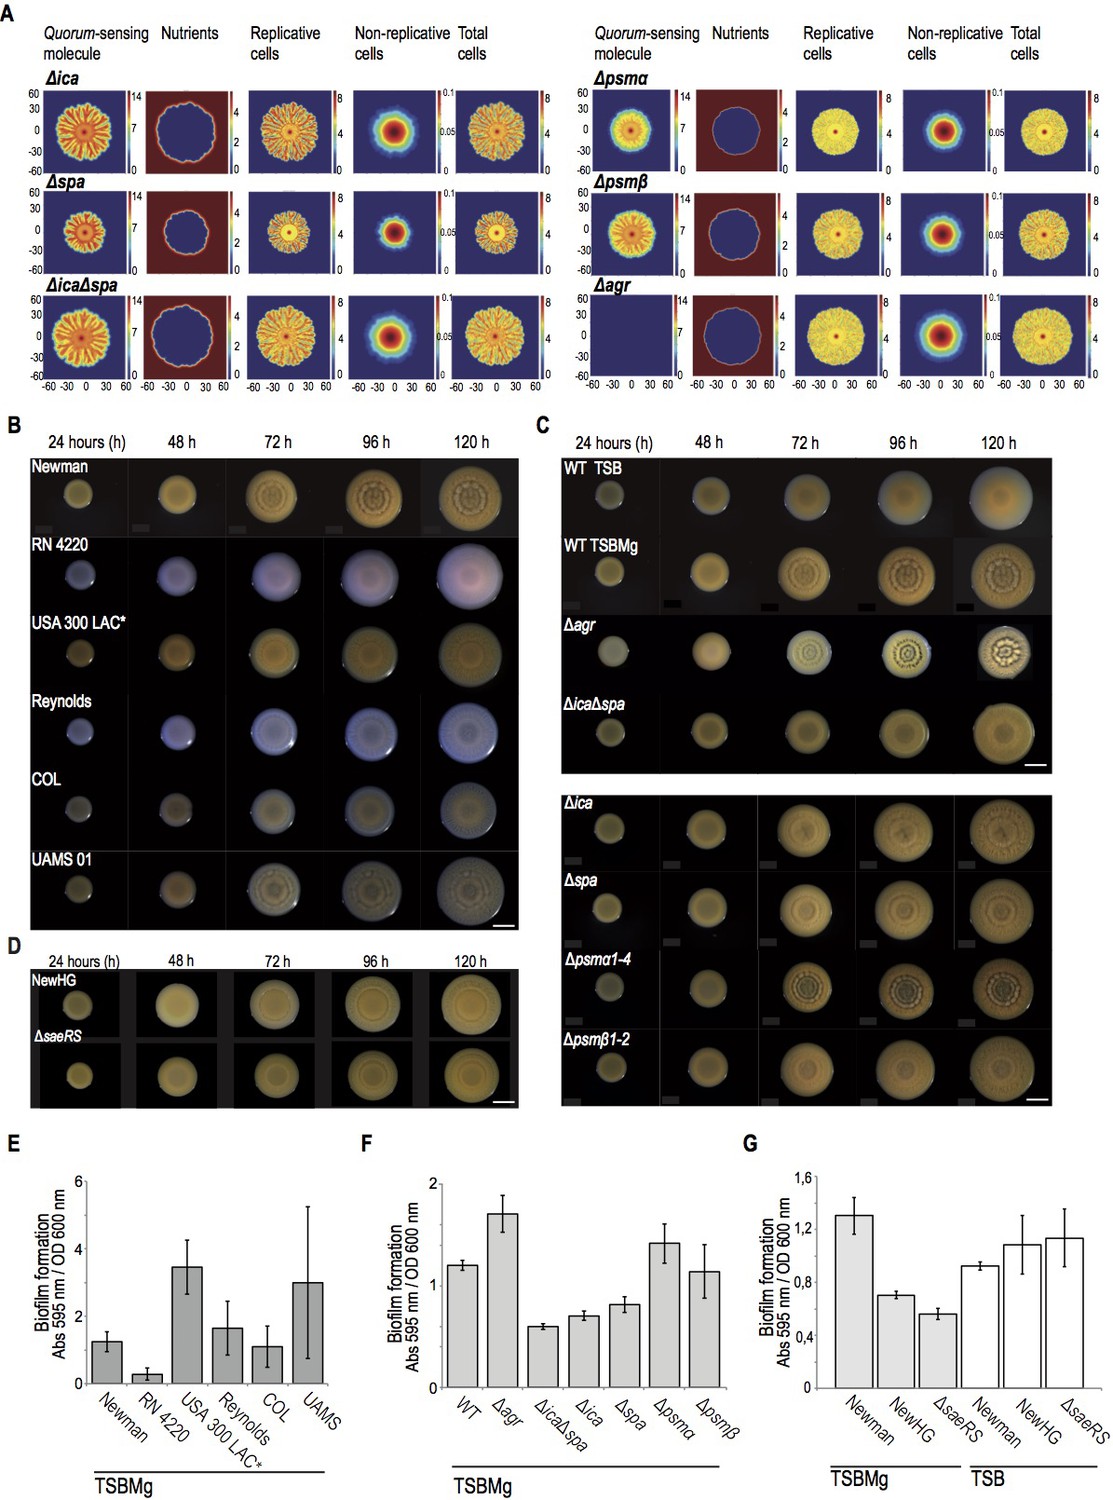
(A) Local concentration of AIP and nutrients control the spatial distribution of replicative and the non-replicative cells in multicellular aggregates of S. aureus. Mathematical modeling of S. aureus growth in different genetic backgrounds, in 5 day-old multicellular aggregates. Each one of the rows represented the genetic backgrounds that have been modeled. The different properties of the microbial community that are quantified are represented in columns and their concentration is shown in a color scale. The mathematical model predicts that the extracellular matrix of the multicellular aggregate prevents the diffusion of AIP (first left column). Therefore, higher concentrations of AIP will be found in the centered older regions of the aggregate. Consequently, this mathematical model shows that the diffusion of the AIP is more efficient in matrix-deficient mutants, such as Δica, Δspa and ΔicaΔspa mutants. Moreover, the mathematical model predicts that, as an aggregate grows and expands through the surface of the agar, the nutrients exhaust in the centered older region (second left column). Therefore, this centered region of the aggregate contained higher concentration of non-actively dividing cells (second right column). Because this centered older region is particularly enriched in AIP concentration, it also contains a higher representation of specialized DRcells. Moving towards the aggregate’s edge increases nutrient availability and cells divide actively (first and second right columns). This generates newer regions with lower concentrations of AIP (first left column), which are enriched in BRcells. (B) Top-view pictures showing the development of microbial communities of different clinical isolates and laboratory strains of Staphylococcus aureus when they grow in TSBMg (Koch et al., 2014). Scale bar = 5 mm. (C) Top-view pictures showing the development of microbial communities of different genetic backgrounds of S. aureus strain Newman when they grow in TSBMg. Scale bar = 5 mm. (D) Top-view pictures showing the development of microbial communities of Newman derivative strains. Among all the clinical isolates initially tested, we deliberately selected the classical model strain Newman to perform further experiments. However, this strain has been catalogued as poor biofilm former using the classical pellicle formation assay in liquid TSB (Cue et al., 2015). In contrast, the strain Newman develops robust multicellular aggregates in TSBMg plates and robust biofilms in liquid TSBMg. Since the Newman strain was originally isolated from a long-term bone-associated infection that usually involves biofilm formation (Duthie and Lorenz, 1952) and bones are important reservoir of Mg2+ in the body (Günther, 2011; Jahnen-Dechent and Ketteler, 2012), possibly Newman strain naturally develops strong biofilms in Mg2+-enriched growing conditions that could resemble the colonizing niches in which Newman develops biofilm-associated infections. It is important to remark that the features of organisms are the result of environmental conditions as well as genes (Darwin, 1859). Therefore, it is perhaps most accurate to describe a phenotype as a product of the interaction between a set of genes and an environment (Moxon et al., 1994). The reduced ability of the Newman strain to form biofilms in TSB medium has been attributed to a point mutation in the SaeS histidine kinase, which generates a constitutively active SaeS that activates the sae regulon, which includes inhibition of biofilm formation (Cue et al., 2015). Thus replacement of the Newman SaeS with a wild type copy of SaeS (NewHG strain) or deletion of saeRS (ΔsaeRS) restored biofilm formation (Cue et al., 2015). However, it is possible that the point mutation in SaeS in Newman strain occurred to naturally develop strong biofilms in Mg2+-enriched growing conditions because Newman strain is a robust biofilm former in TSBMg. We tested the capacity of the NewHG and Δsae strains to form multicellular aggregates in TSBMg medium and, in contrast to Newman strain, the NewHG strain showed limited capacity to form aggregates in TSBMg. Moreover, the Δsae strain showed almost totally impaired to develop aggregates in TSBMg. These results are consistent with the hypothesis that a constitutively active SaeS facilitates biofilm formation of Newman strain in Mg2+-enriched colonization niches. (E) Quantification of biofilm formation of the different strains of S. aureus when they grow in liquid TSBMg medium using the traditional assay of biofilm formation in 24-well titer plates (O'Toole and Kolter, 1998a). (F) Quantification of biofilm formation of different genetic backgrounds of S. aureus strain Newman when they grow in liquid TSBMg medium in 24-well titer plates. There is a strong correlation between the architectural complexity of the multicellular aggregate (see panels A and B) and the ability of the strain to form biofilm in the classical biofilm formation assay that entitles forming submerged pellicles in the bottom of a well that contains liquid medium (O'Toole and Kolter, 1998a). (G) Quantification of biofilm formation of Newman and derivative NewHG and ΔsaeRS strains when they grow in liquid TSBMg and TSB in 24-well titer plates. The strains showed different biofilm behavior in TSBMg and TSB media. The capacity to form biofilm in TSB medium directly correlates to sae expression levels. However, in TSBMg, biofilm formation indirectly correlates to sae expression.
Figure 5—figure supplement 2
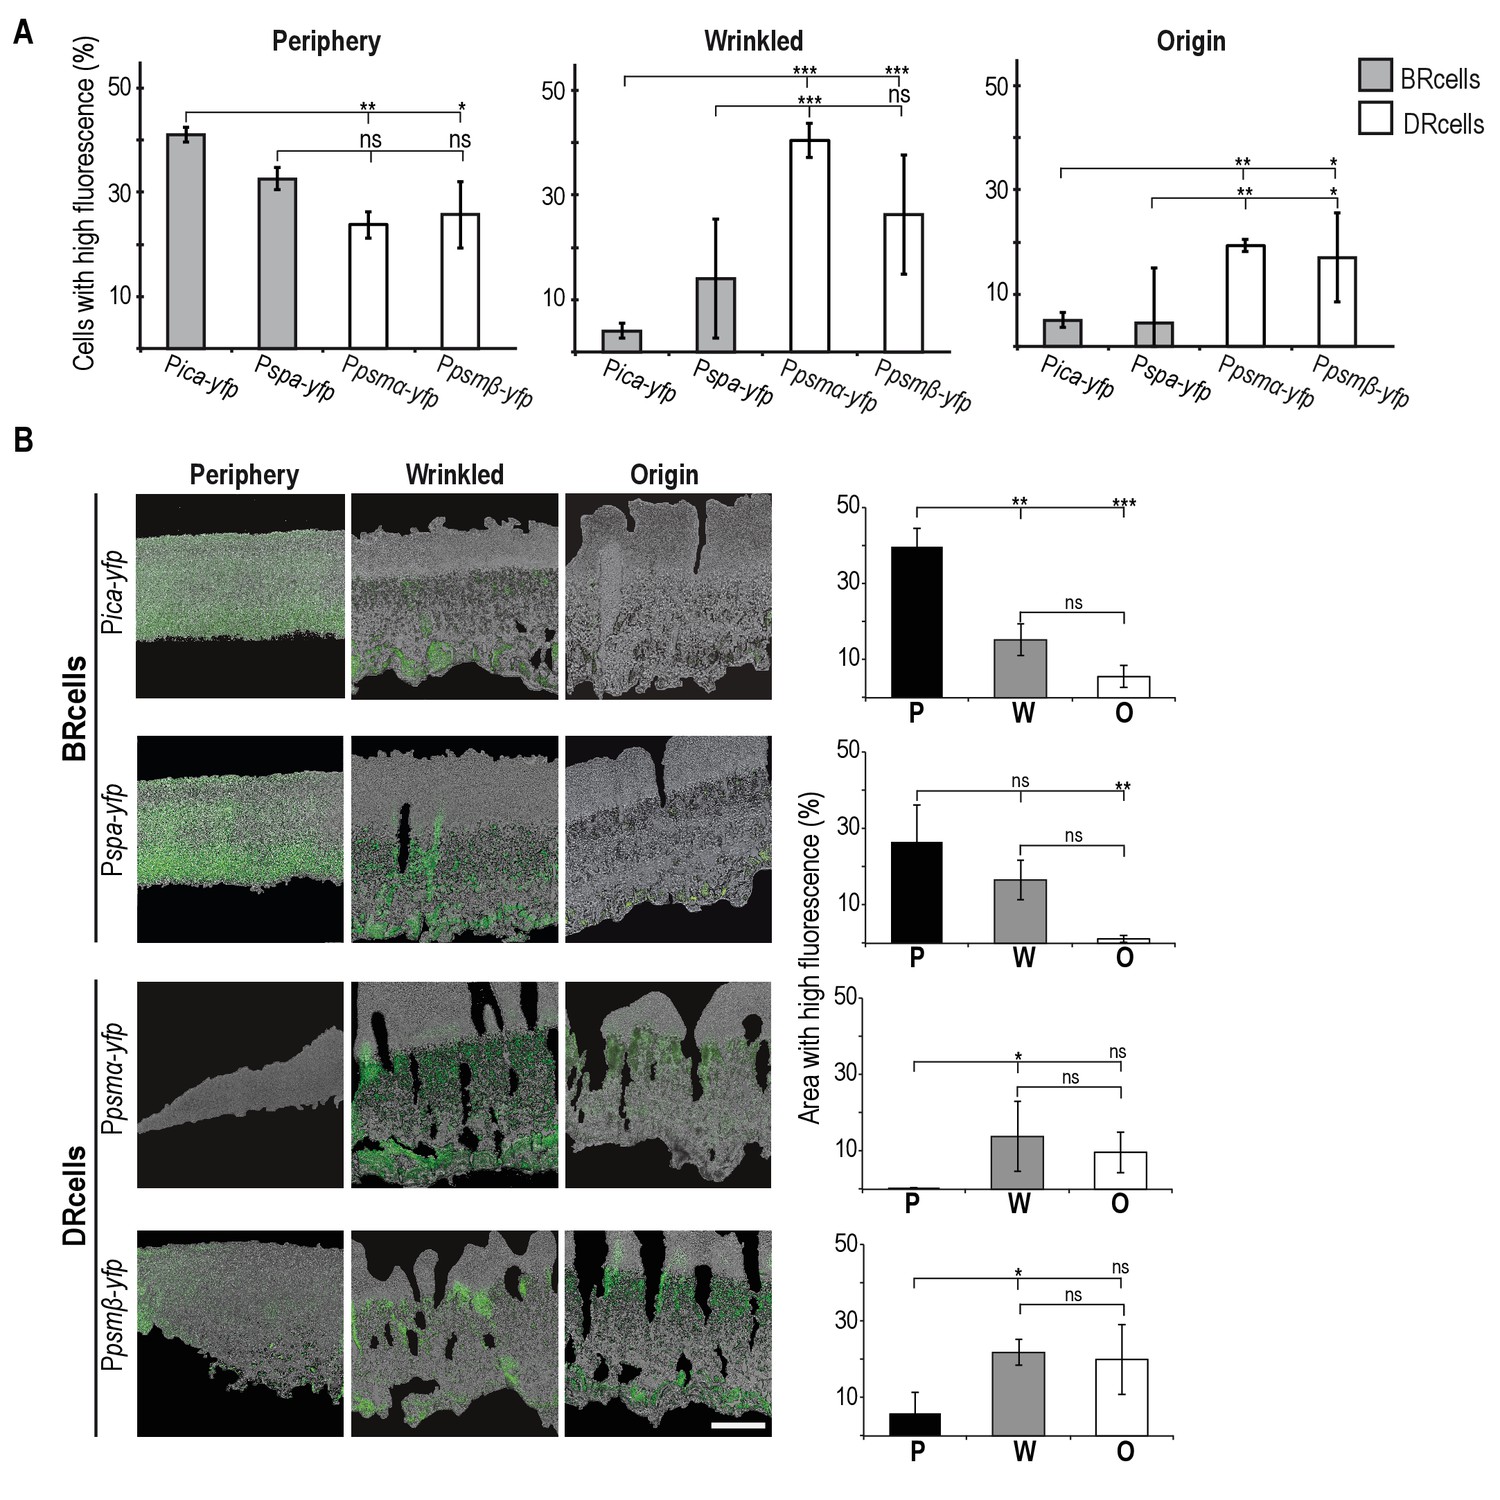
Spatial distribution of BRcells and DRcells in vitro.
(A) Spatial localization of the distinct cell types within the morphologically different regions of the multicellular aggregates. Flow cytometry quantification of the size of each cell type of BRcells and DRcells in the three dissected morphological regions (P, W and O). Fluorescence signal is represented by the percentage of fluorescent cells over the total community using an unlabeled strain as control for no fluorescence. (B) Spatial localization of the distinct cell types within the longitudinal plane of the microbial aggregate. Fluorescence micrographs of selected P, W and O regions of the microbial aggregates. Fluorescence signal is false-colored in green. Scale bar = 100 μm. Percentages denote the proportion of fluorescent area over the total cell aggregate area (see Materials and methods for quantification details). Graphs represent data analyses from three independent multicellular aggregates. Localization of the fluorescence signal is spatially confined to regions of the multicellular aggregate. All data (mean ±SD) are from three independent experiments (n = 3). Statistical significance was measured using one-way ANOVA and Tukey's test for multiple comparisons. *p<0.05, **p<0.01, ***p<0.001, ns No significant differences.
Figure 6 with 2 supplements
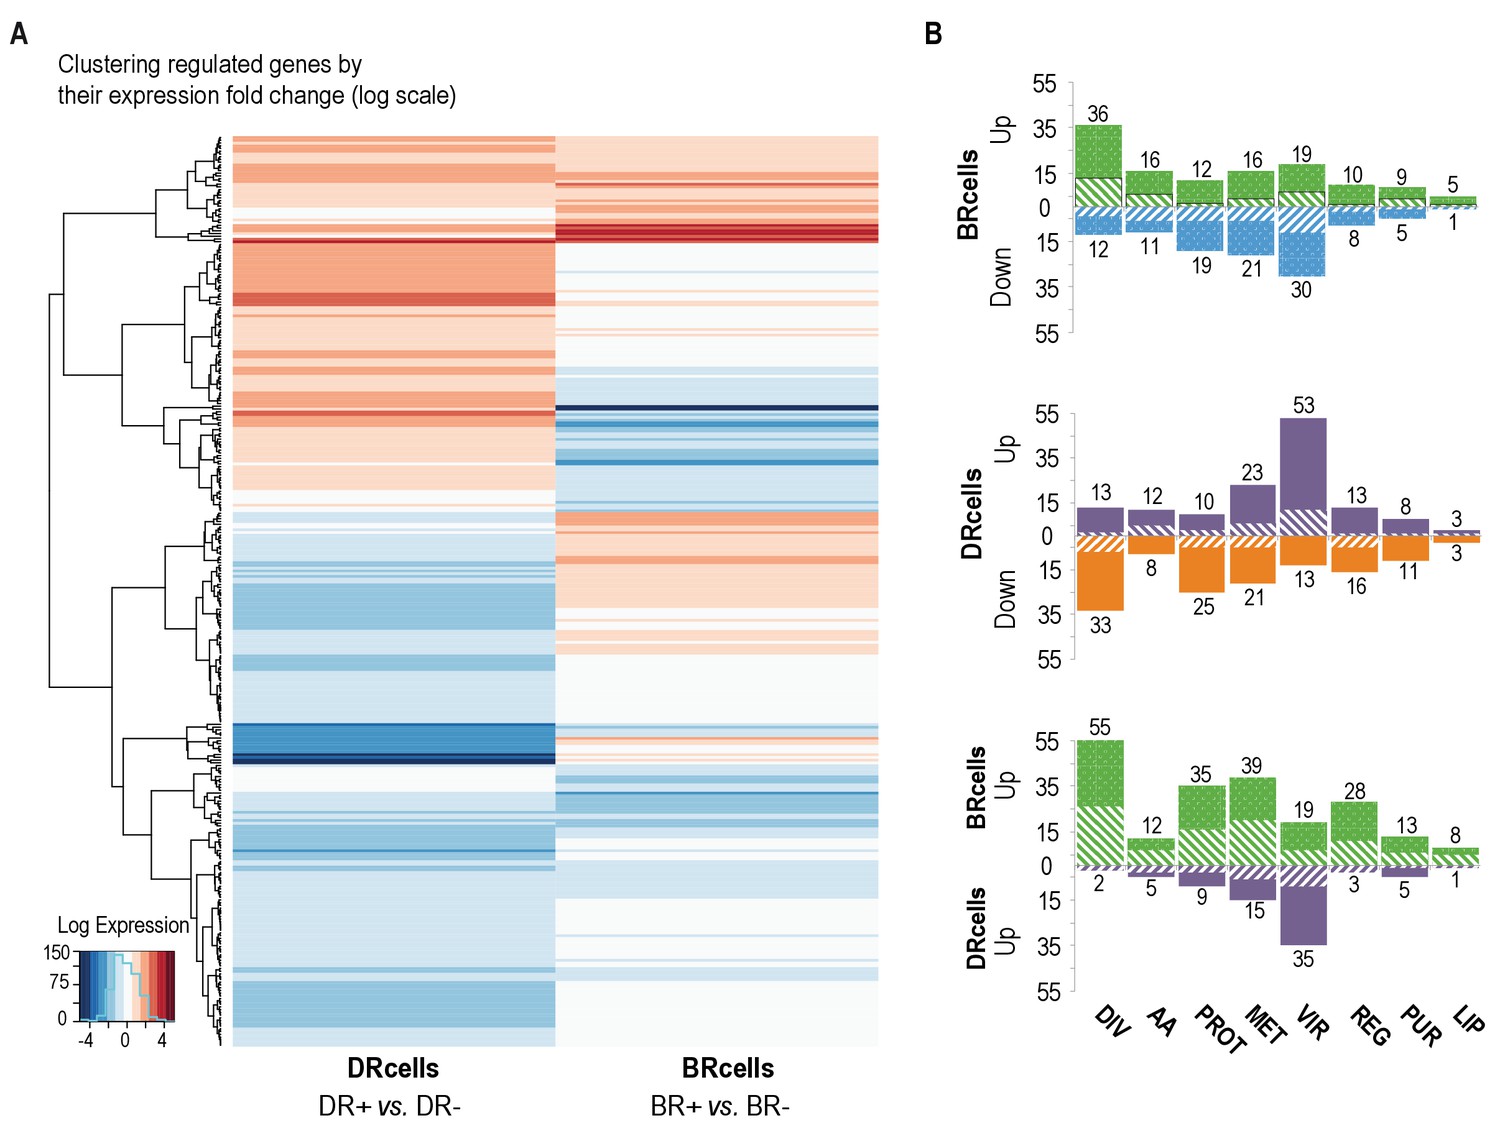
BRcell and DRcell subpopulations have different gene expression profiles.
(A) Unsupervised hierarchical clustering of commonly expressed genes differentially regulated in at least one of the libraries shows a specific, divergent expression profile for BRcells and DRcells. Color scales represent log2 fold-changes for differential expression. Clustering was carried out on the regulated genes (minimum fold-change 2) with Ward hierarchical biclustering using the heatmap.2 command in the ggplots package of the R programming language on Euclidean distances. This approach successfully grouped the common genes, which are upregulated (orange) in both sets of libraries, and far from the cluster of downregulated genes (blue). The third set of genes was identified based on this clustering (in the center of the heatmap), which showed library-specific phenotypes (upregulated in one library and downregulated in the other. (B) Classification of the differentially expressed genes using TIGRfam, SEED and Gene Ontology (GO) functional categories, followed by manual curation. For each category, solid and dashed columns represent the number of regulated genes from DESeq analysis using the raw read threshold of >8 and >25, respectively. DIV, DNA replication, cell envelope and cell division; AA, amino acid synthesis; PROT, protein synthesis and processing; MET, energy and intermediary metabolism; VIR, virulence, binding and transport; REG, regulation, transcription and signal transduction; PUR, purines, pyrimidines, nucleotides and nucleosides; LIP, lipid metabolism.
-
Figure 6—source data 1
Genome-wide analysis of DRcell and BRcell sorted subpopulations.
Library specific variations are 0, showing that no statistically significant genetic differences were found between BRcells and DRcells genomes.
- https://doi.org/10.7554/eLife.28023.016
-
Figure 6—source data 2
Gene quantification and differential expression analysis of BRcells and DRcells.
This data table contains the table for gene-wise quantification calculated for different cDNA libraries used in this study. DESeq analysis data for library comparisons.
- https://doi.org/10.7554/eLife.28023.017
-
Figure 6—source data 3
Functional classification of annotated genes.
Gene Ontology classification of annotated genes that showed significant log2fold change value for differential expression generated by DESeq analysis. Aureowiki functional classification of the annotated genes that showed significant log2fold change value for differential expression generated by DESeq comparison analysis.
- https://doi.org/10.7554/eLife.28023.018
-
Figure 6—source data 4
Hypergeometric analysis for library comparison comprising the log2fold values for differentially expressed genes that were shown to be expressed by DESeq analysis comparison of DRcells+ against BRcells+ sample sets.
Hypergeometric analysis probability and hypergeometric analysis heatmap comparison.
- https://doi.org/10.7554/eLife.28023.019
Figure 6—figure supplement 1
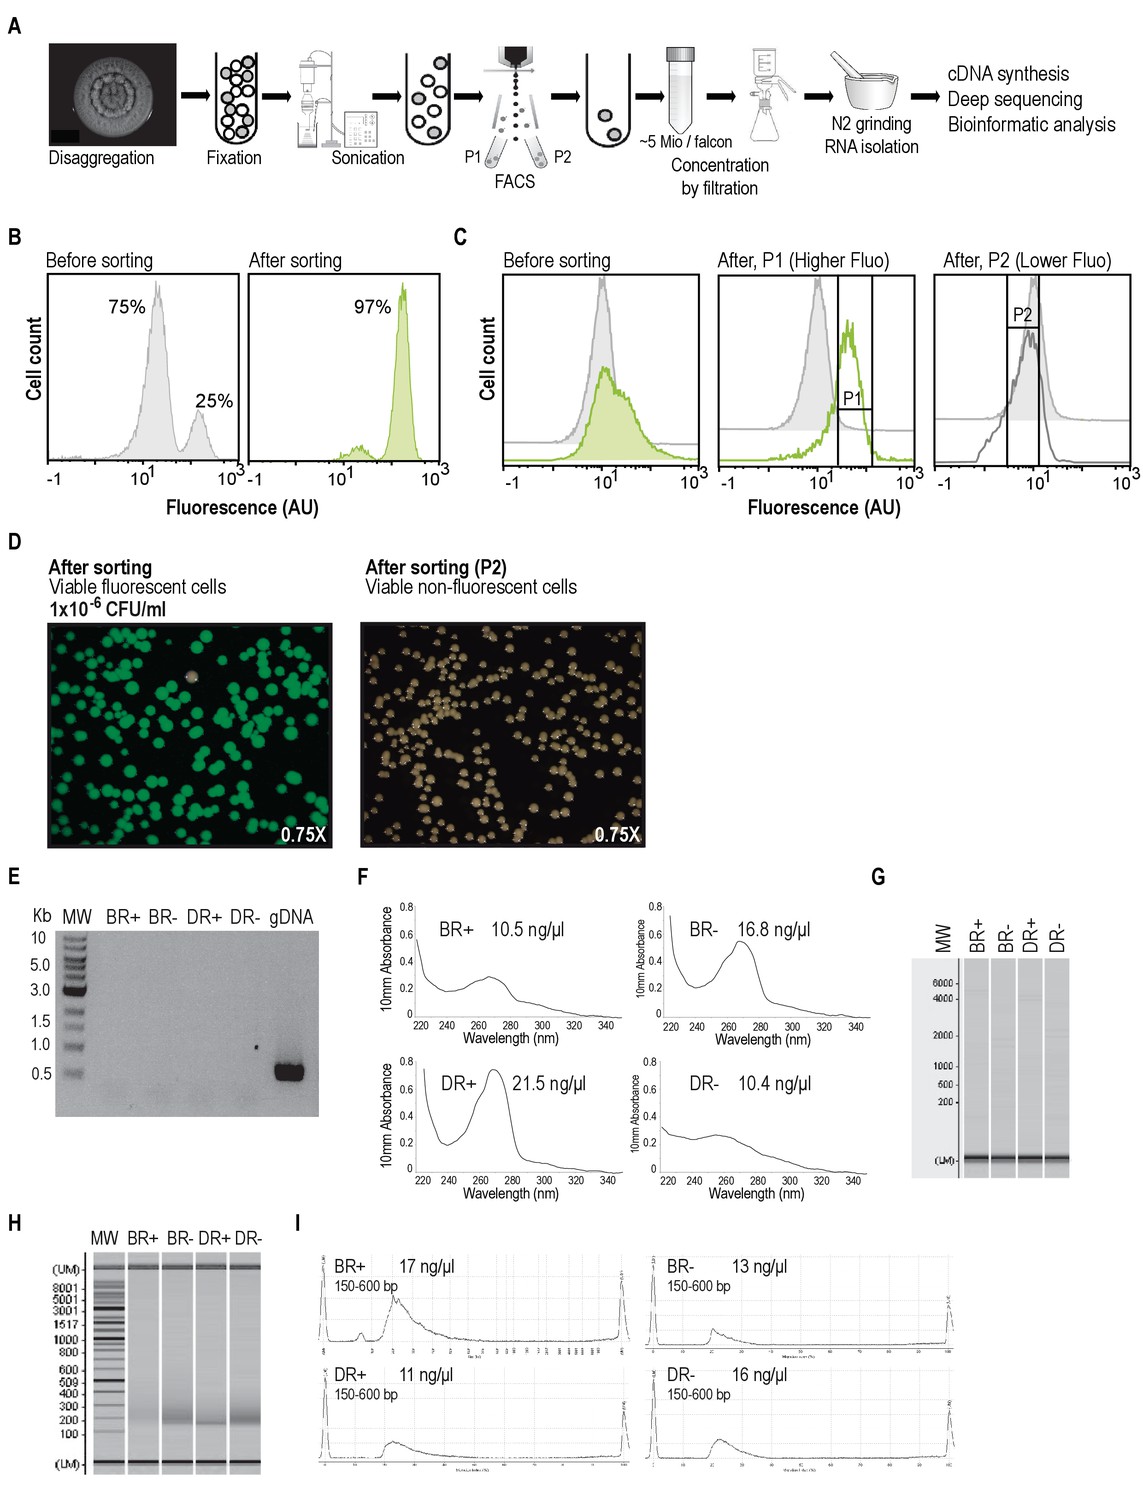
Experimental workflow to sort BRcells and DRcells using Fluorescence Activated Cell Sorting (FACS) to analyze and compare their transcriptomic profile.
(A) Schematic flow of the experimental approach used for cell sorting and RNA-sequencing of specific cell types. Multicellular aggregates were resuspended and disaggregated in RNAlater for cell fixation. A homogenous suspension of single cells was obtained using mild sonication. FACS analysis separated the subpopulation of cells expressing the reporter in a test tube and the subpopulation of cells that did not express the reporter in a different test tube. We collected and concentrated the cells in a filter and isolated total RNA using hot phenol extraction protocol (Blomberg et al., 1990). Total RNA was used to construct cDNA libraries that were sequenced using the Illumina HiSeq 2500. Results were analyzed using diverse bioinformatics tools. For further experimental procedures see Materials and Methods. (B) Control experiment of cell sorting. In the first panel, S. aureus wild type living cells from liquid cultures (non-fluorescent cells) were mixed with Pica-yfp labeled cells from liquid cultures (fluorescence cells) in relation 3:1 and analyzed using FACS. Second panel shows the flow cytometry analysis of sorted cells from the initial 3:1 mixture. The FACS-sorted bacterial population reached 97% enrichment of fluorescent cells. (C) Cell sorting of multicellular aggregates of S. aureus. A 4-days-old multicellular aggregate of Pica-yfp labeled strain was fixed using RNAlater. Cells were dispersed and their fluorescence signal was analyzed using flow cytometry (left panel). Flow cytometry analysis showed higher expression of the reporter in a subpopulation of cells (subpopulation P1), as evidenced by the shoulder observed in the fluorescence expression profile of the culture. FACS of this sample led to an efficient separation of the subpopulation of fluorescence cells (P1) and the subpopulation of non-fluorescent cells (P2) in two different tubes. Flow cytometry analyses of P1 and P2 fluorescence signal showed that most of the cells from the P1 sample were fluorescent, whereas most of the cells from the P2 sample were non-fluorescent (center panel). In further experiments, we used a Pica-yfp labeled strain to separate a P1 subpopulation (BR+ sample) and a P2 subpopulation (BR- sample). Likewise, we used a Ppsmα-yfp labeled strain to separate a P1 subpopulation (DR+ sample) and a P2 subpopulation (DR- sample). We sorted approximately 25 million cells per sample prior RNA isolation. (D) Sorted fractions were diluted and plated on TSB and the resulting colonies were examined for viability and for emission of fluorescence using a fluorescence stereoscope. Consistent with our flow cytometry enrichment data, more than 95% of the colonies carried the transcriptional fusion and were fluorescent. In addition, the non-fluorescence cells (P2 fraction) revealed similar viability as the its fluorescent counterpart and. (E) PCR analysis of total RNA samples showed that samples are free of DNA contamination after DNaseI treatment. Amplification of rrna16s control gene was detected only in the positive control (genomic DNA from S. aureus). Molecular weight = 500 bp ladder. (F) Quantification of RNA concentration using spectrophotometry. The RNA concentration and absorption ratios for each sample were determined using the Nanodrop. Concentration is shown in the top right section of each panel. (G) Quality check of the RNA samples. RNA samples were examined using MultiNA microchip electrophoresis (Shimadzu) to determine quality and concentration of the RNA. After analysis, cDNA was synthesized following the protocol described in Materials and Methods. Molecular weight = 200 bp ladder. (H) Analysis of the PCR-amplified cDNA samples on a Shimadzu MultiNA microchip electrophoresis system. For Illumina sequencing, the cDNA was size-fractionated in the size range of 150–600 bp using a differential cleanup system. (I) An aliquot of each cDNA was analyzed by capillary electrophoresis. Each double-stranded cDNA sample was flanked with different adapter sequences to generate a cDNA with a combined length of 100 bases. Length range and concentration are shown at the top left section of each panel.
Figure 6—figure supplement 2
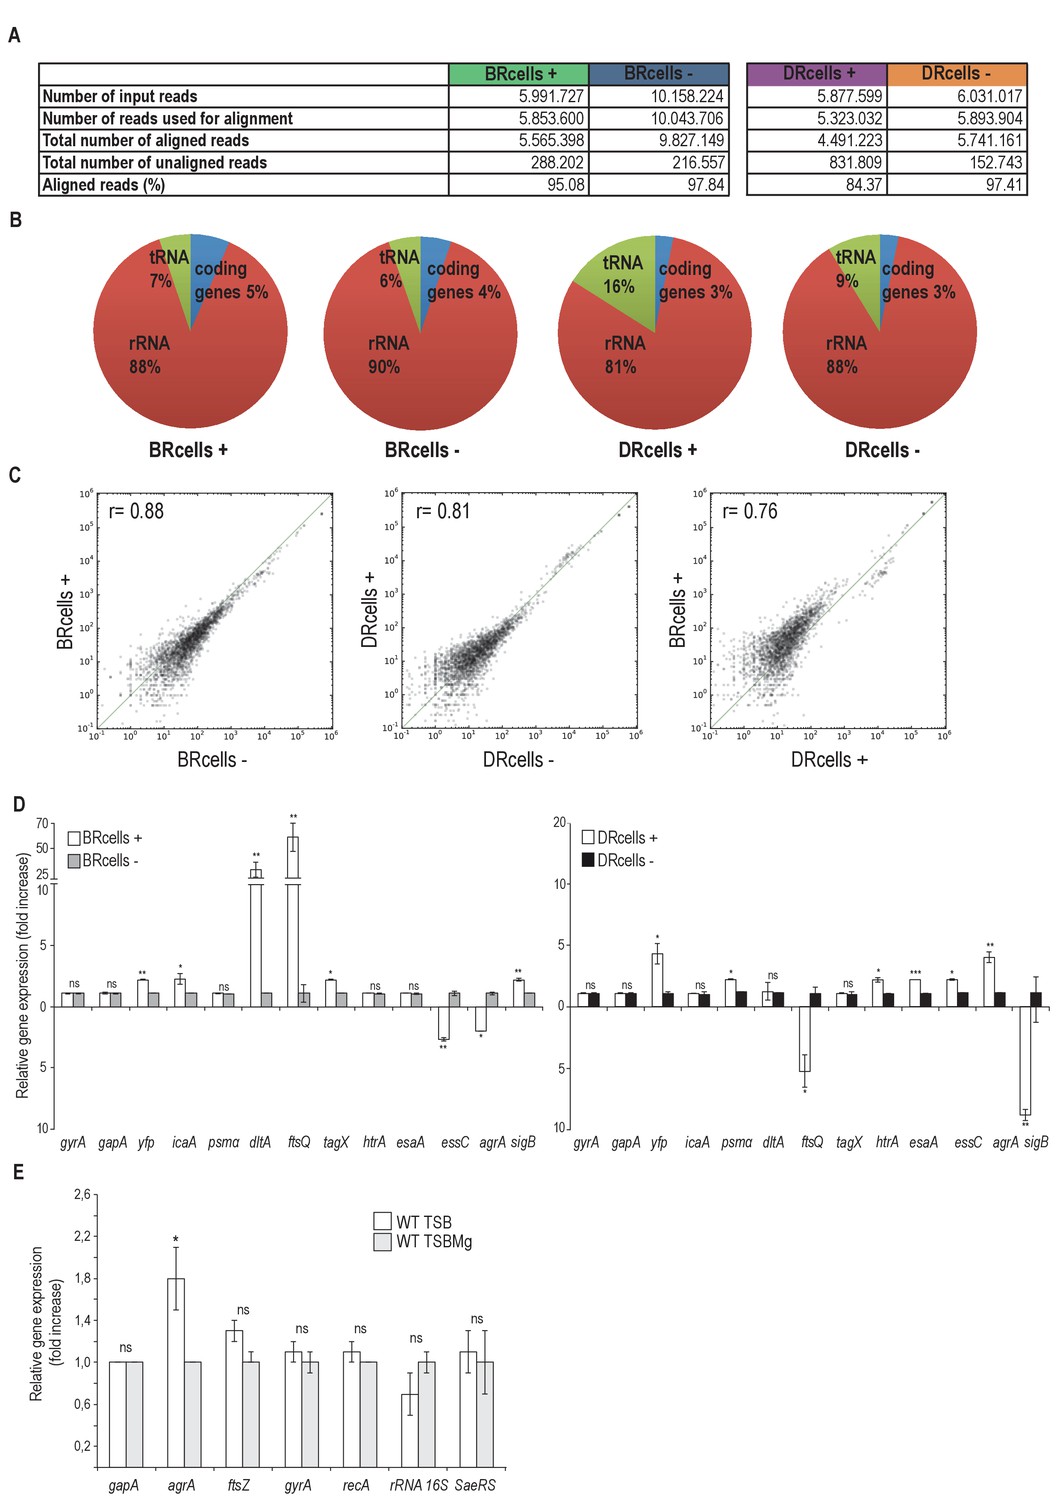
Read alignment statistics, transcriptomic profile of BRcells and DRcells and differential distribution of cell types in distinct infected organs.
(A) Basic statistics of the samples. Number of reads obtained from sequencing; number of reads that passed the bioinformatics standard quality check and thus were aligned against the reference genome, number of aligned and unaligned reads and the percentage of aligned reads are shown. On average, we obtained 7 million reads per sample and approx. 97% of reads could be aligned to the reference genome. (B) Distribution of the aligned reads in each library into different RNA classes based on the annotation obtained from NCBI database. (C) Pearson correlation index of the relative gene expression within different samples. First panel shows correlation within the BR+ and BR- populations (r = 0.88). Second panel shows the correlation within the DR+ and DR- populations (r = 0.81). The third panel shows the correlation within the BR+ and DR+ populations (r = 0.76). These results denote a different expression pattern between BR+ and BR- cells as well as between DR+ and DR- cells. Indeed, a different expression pattern was detected between BRcells and DRcells. (D) Quantitative qRT-PCR analysis of selected genes that showed different expression pattern in the transcriptomic data of BRcells and DRcells. Left graph shows the qRT-PCR analysis of the selected genes expressed in BRcells. The right graph shows the qRT-PCR analysis of selected genes expressed in DRcells. Expression of the yfp gene, which is not part of the S. aureus reference genome, was used as gene expression control experiment. (E) Quantitative qRT-PCR analysis of S. aureus reference genes (Sihto et al., 2014) in TSB and TSBMg showed no statistical significant differences. In contrast, expression of cell-division-related genes, such as dltA and ftsQ, is significantly high in BRcells (panel D left graph) probably due to the more active division of BRcells. Moreover, expression of agrA regulatory gene showed significant differences between TSB and TSBMg. qRT-PCR experiments follow the standard MIQE guidelines for publication of qRT-PCR experiments (Bustin et al., 2009). Data represents mean of three independent experiments (n = 3). Error bars means standard deviation (mean ± SD) Statistical significance was measured using unpaired, two-tailed t-test. *p<0.05, **p<0.01, ***p<0.001, ns No significant differences.
Figure 7 with 3 supplements
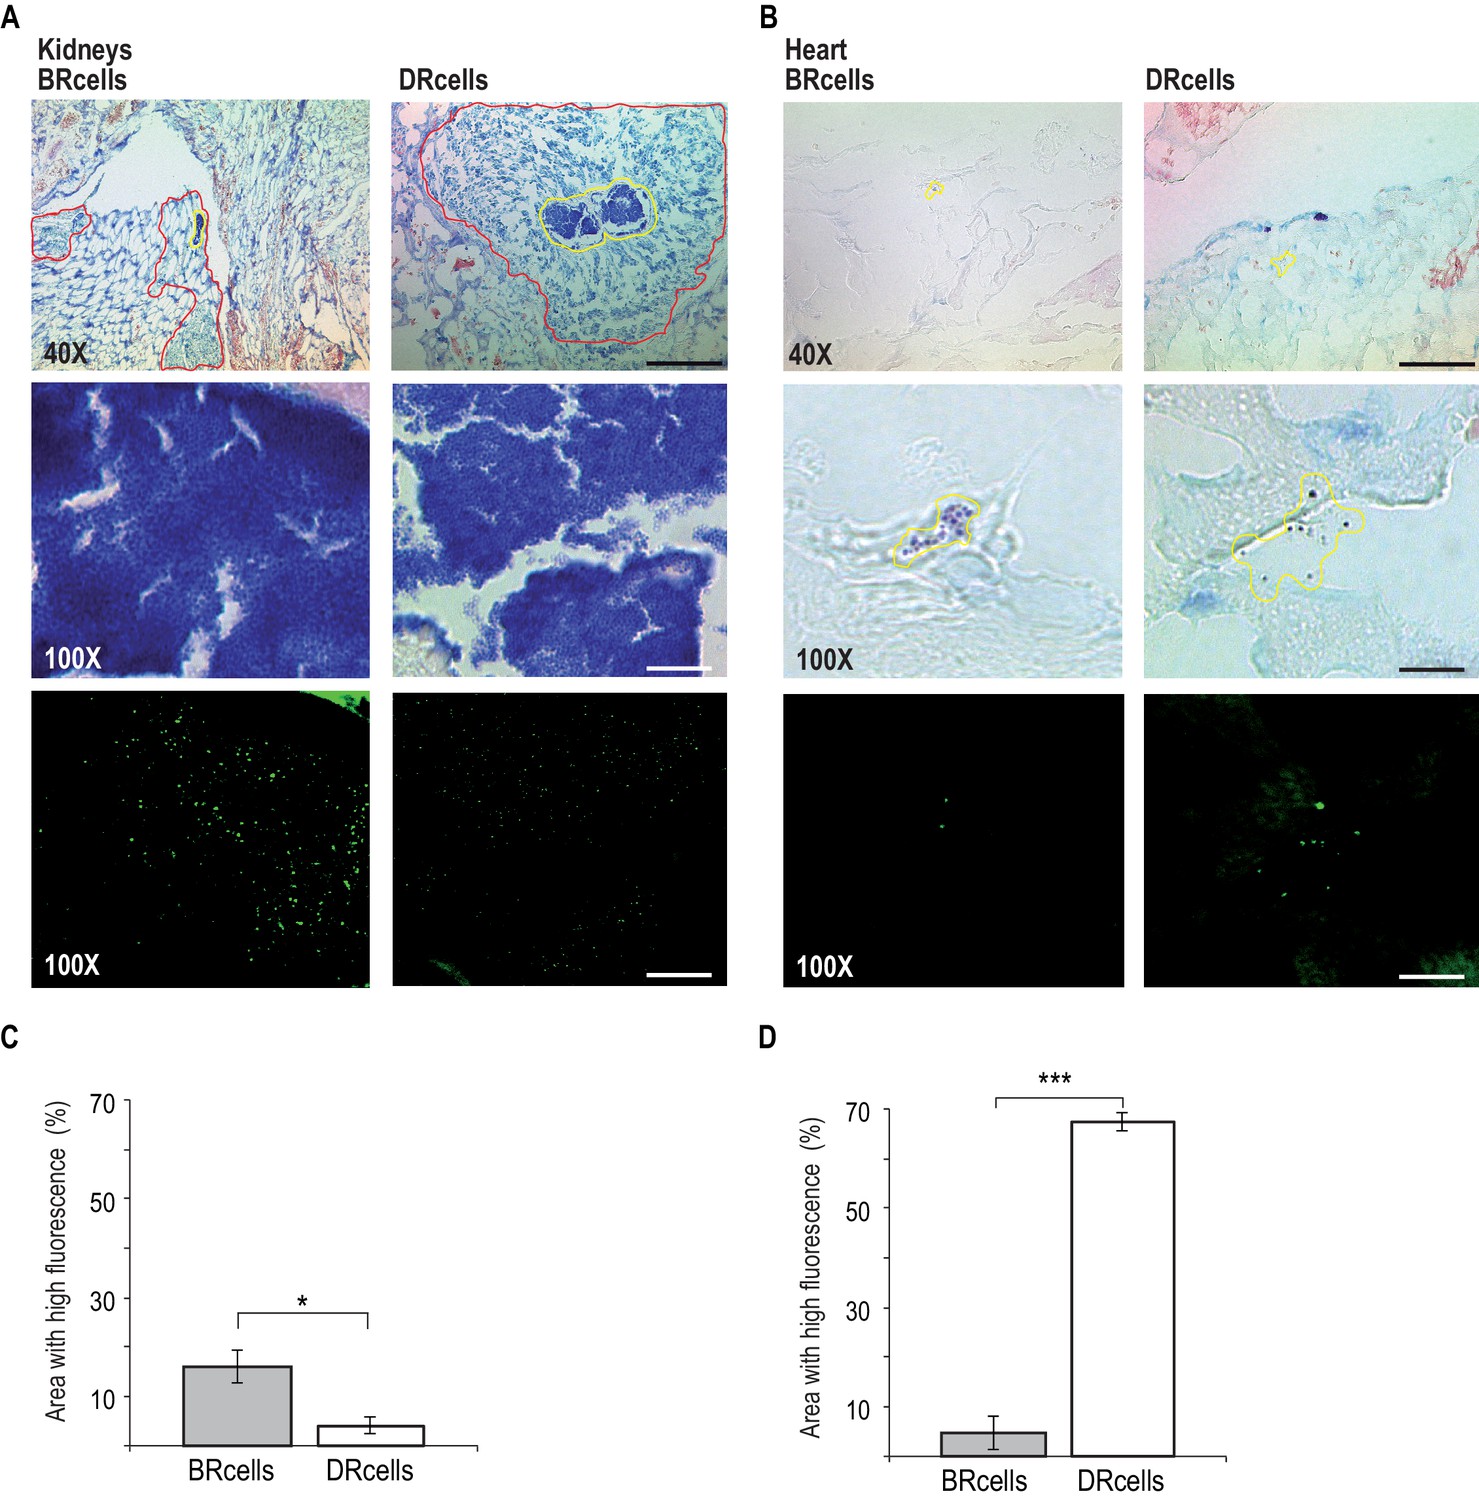
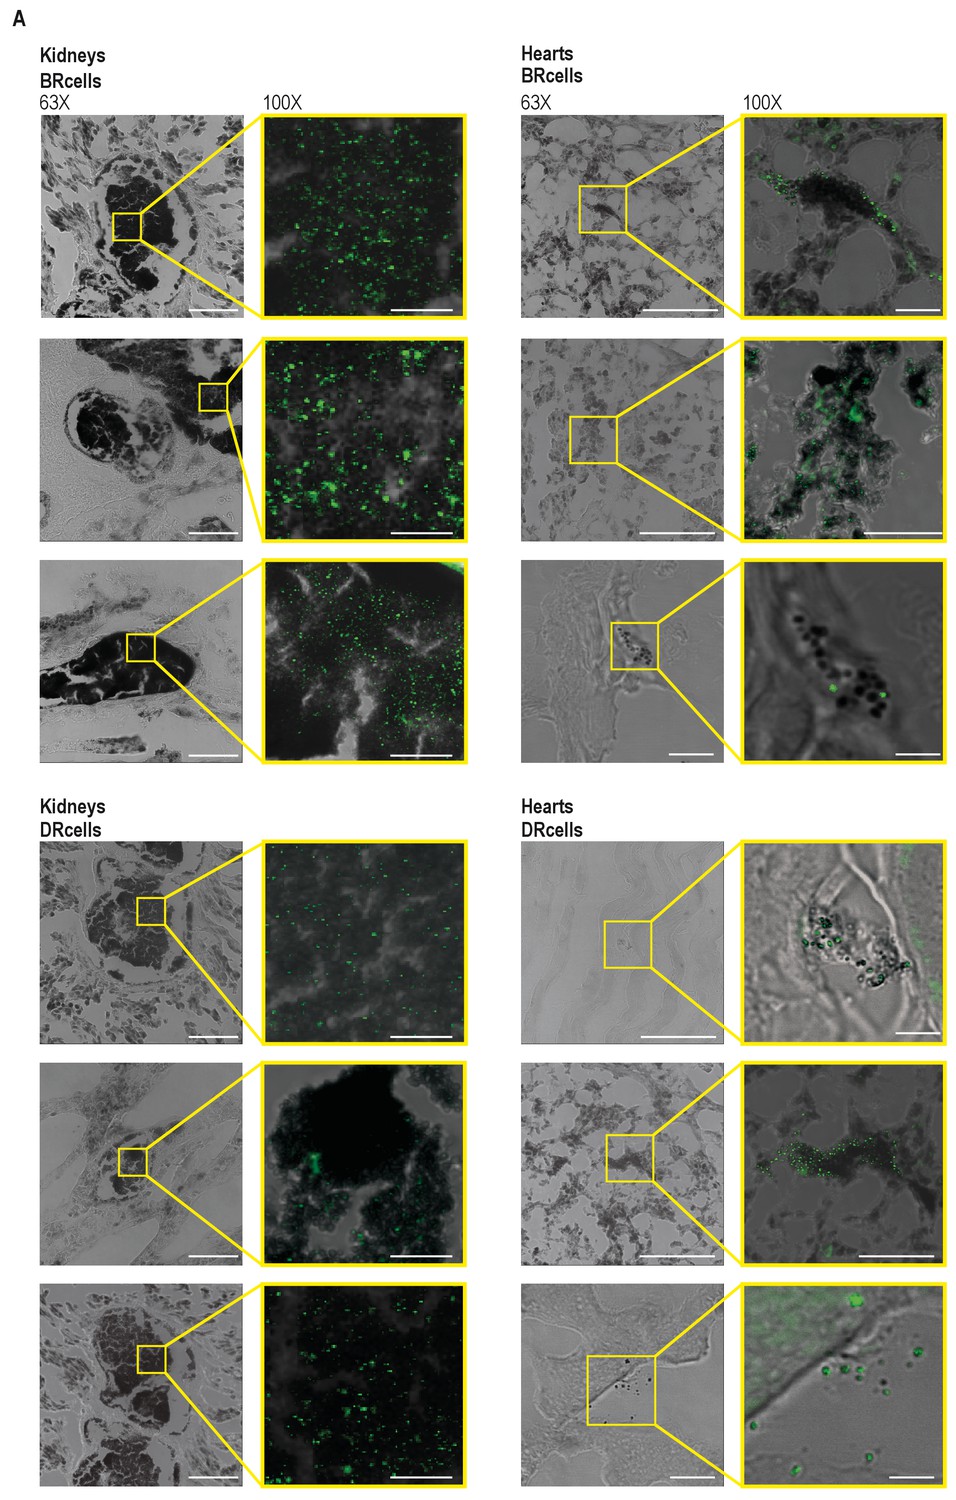
BRcells are more represented in infected kidneys and DRcells are more represented in infected hearts.
Histological preparations of infected kidneys (A) or hearts (B) stained with Giemsa solution and visualized using light microscopy. Upper row, 40X magnification of the preparation. Bar = 50 μm. The area delineated in red corresponds to the immune cell infiltrates that surround bacterial aggregates in infected kidneys. The area delineated in yellow corresponds to the bacterial aggregates surrounded by immune cell infiltrates in infected kidneys or, to dispersed S. aureus cells in the case of infected hearts. This area is magnified at 100X in central row. Central row, compact aggregates of S. aureus cells can be seen in dark blue. Bar = 20 μm. Bottom row, confocal fluorescence microscopy images of the bacterial populations imaged in row 3. Right, monitoring of BRcell subpopulation using a Pica-yfp S. aureus labeled strain. Left, monitoring of DRcell subpopulation using a Ppsmα-yfp S. aureus labeled strain. Magnification, 100X. The fluorescence signal is shown in green. Bar = 20 μm. (C and D) Quantitative estimate of the relative fluorescent signal is shown as a percentage of the fluorescent area over the total bacterial aggregate area in the images. Statistical significance was measured by an unpaired, two-tailed Student’s t-test. *p<0.05. Data shown as mean ± SD of three independent measurements (n = 3) each one obtained from different infected organs.
Figure 7—figure supplement 1
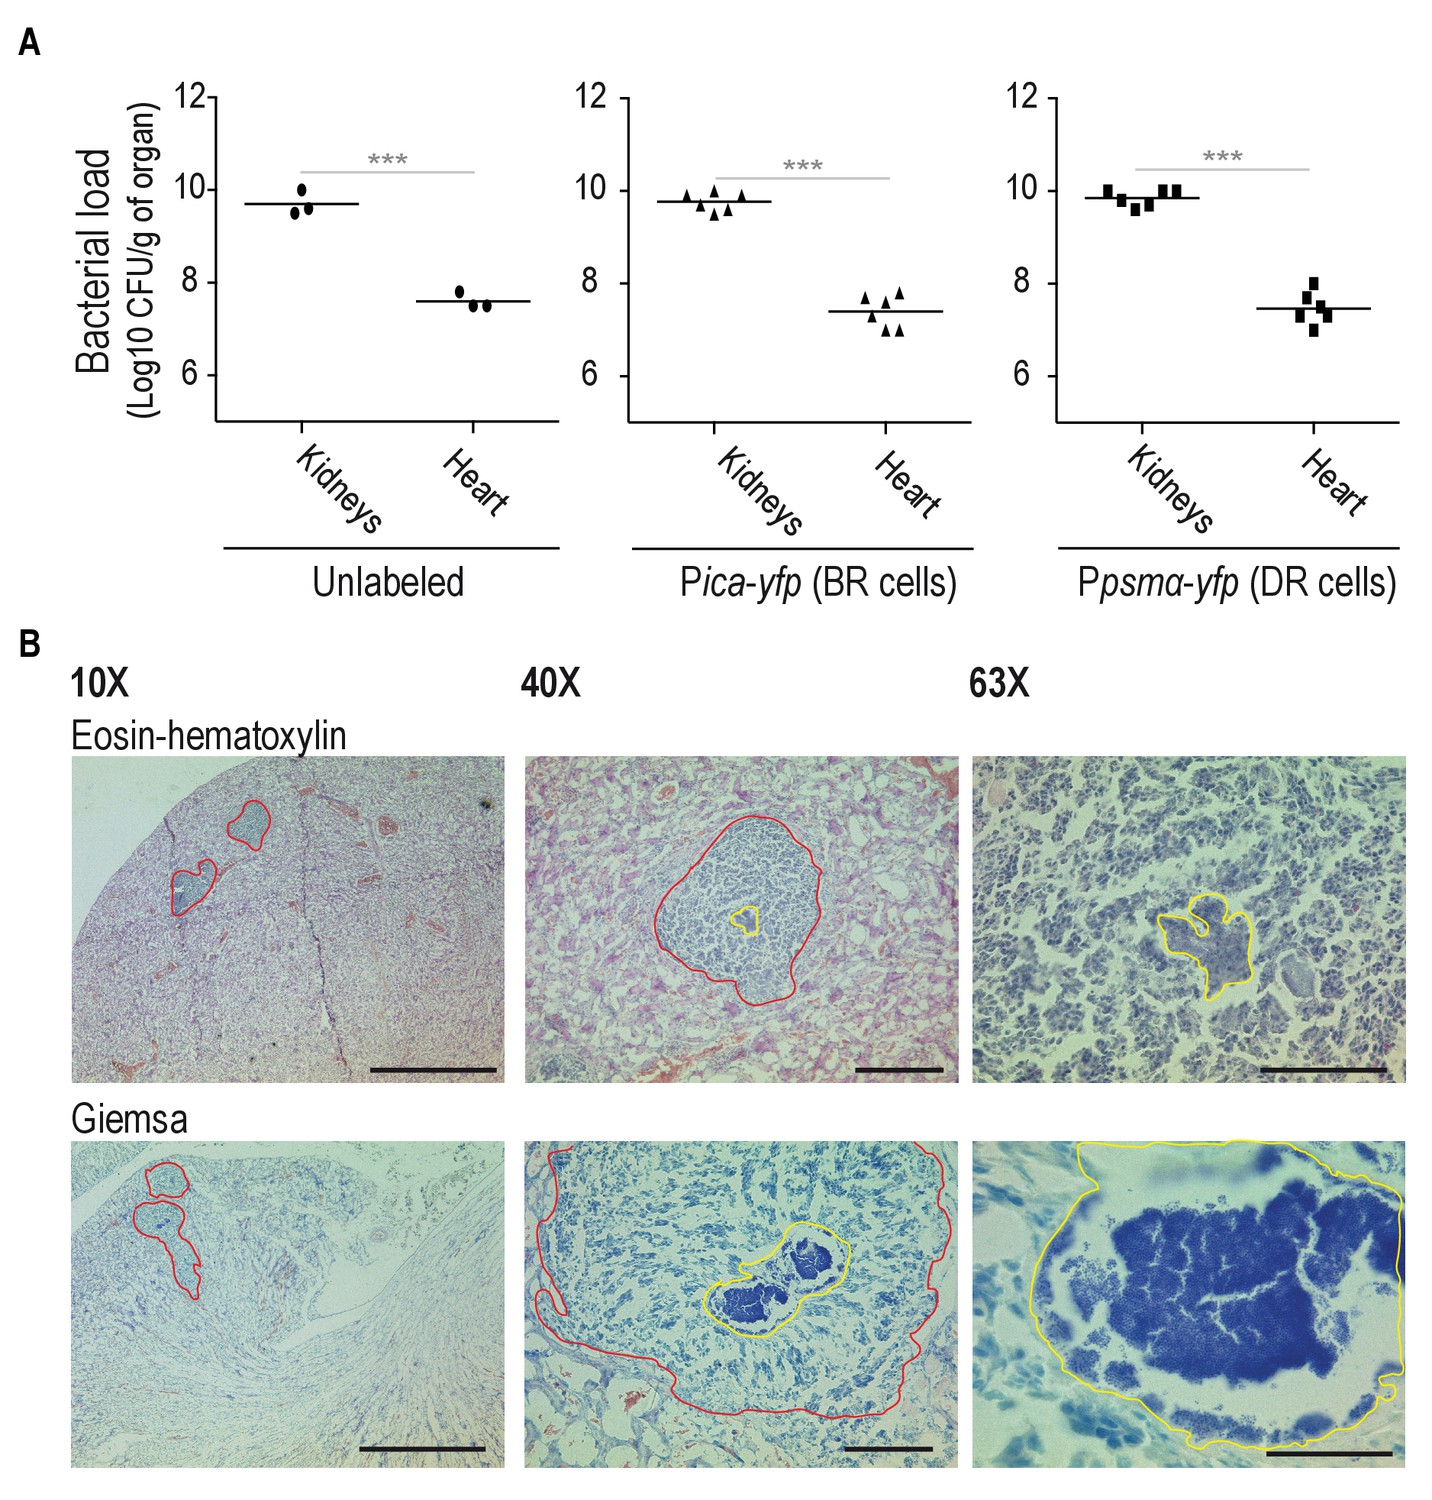
Bacterial loads in Mg2+-enriched and Mg2+-depleted organs.
(A) Bacterial loads of mice infected with and unlabeled S. aureus strain, Pica-yfp (BRcells) and Ppsmα-yfp (DRcells) labeled strains. (B) Upper panels, histological preparations of infected kidneys using Eosin-Hematoxylin (EH) staining (Prabhakara et al., 2011; Thammavongsa et al., 2009; Bubeck Wardenburg et al., 2006). Lower panels, histological preparations of infected kidneys and infected hearts using Giemsa staining. EH staining allows more clear identification of immune cells infiltrates in infected kidneys. Giemsa staining however, is more suitable for identification and localization of S. aureus cells. Bars = 500 μm left panels, 50 μm center panels and 20 μm right panels. Data represents mean of three independent experiments (n = 3) from independent animals. Statistical significance was measured using Mann-Whitney test. ***p<0.001.
Figure 7—figure supplement 2
BRcells are more represented in infected kidneys and DRcells are more represented in infected hearts.
(A) Confocal microscopy images of infected kidneys and infected hearts, which were used for the quantitative analysis of Figure 7C,D. Left panels; bright field 63X-magnification images of different preparations of kidneys and hearts infected with Pica-yfp and Ppsmα-yfp S. aureus labeled strains to monitor BRcells and DRcells, respectively. Bars = 50 μm in infected kidneys and 20 μm in infected hearts. Selected area (in yellow) represents one of the different representative areas that were used for quantification in each of the three independent organs analyzed. Right panels; overlay 100X-magnification images of the different preparations presented in the left panels. Bars = 20 μm in infected kidneys and 5 μm in infected hearts.
Figure 7—figure supplement 3

BRcells are more represented in infected kidneys and DRcells are more represented in infected hearts.
(A) Low magnification (10X) histological preparations of the infected kidneys (upper row) or hearts (lower panels) presented in Figure 7. Bar = 500 μm. The area delineated in red corresponds to the immune cell infiltrates that surround bacterial aggregates in infected kidneys. The area delineated in yellow corresponds to dispersed S. aureus cells in infected hearts.
Figure 8

Low- and high-tagB strains display different infection patterns.
(A) Bacterial loads on different genetic backgrounds in kidney, heart and liver of infected mice. (B, C) qRT-PCR analysis of BRcell- (B) and DRcell- (C) related genes in kidney, heart and liver of mice infected with S. aureus strains of different genetic backgrounds. Data shown as mean ± SD of five independent animals (n = 5) (A) and three independent experiments (n = 3) (B, C). Statistical significance was measured by multiple comparison analysis using the Mann-Whitney test (A) and unpaired two-tailed Student’s t-test (B, C). *p<0.05, **p<0.01, ***p<0.001; ns, not significant differences.
Additional files
-
Supplementary file 1
List of strains used in this study.
- https://doi.org/10.7554/eLife.28023.025
-
Supplementary file 2
List of plasmids and plasmids used in this study.
- https://doi.org/10.7554/eLife.28023.026
-
Transparent reporting form
- https://doi.org/10.7554/eLife.28023.027
Download links
A two-part list of links to download the article, or parts of the article, in various formats.
Downloads (link to download the article as PDF)
Open citations (links to open the citations from this article in various online reference manager services)
Cite this article (links to download the citations from this article in formats compatible with various reference manager tools)
Cell differentiation defines acute and chronic infection cell types in Staphylococcus aureus
eLife 6:e28023.
https://doi.org/10.7554/eLife.28023


