Proximal clustering between BK and CaV1.3 channels promotes functional coupling and BK channel activation at low voltage
- University of Washington, United States
- University of California, Davis, United States
Figures
Figure 1 with 2 supplements
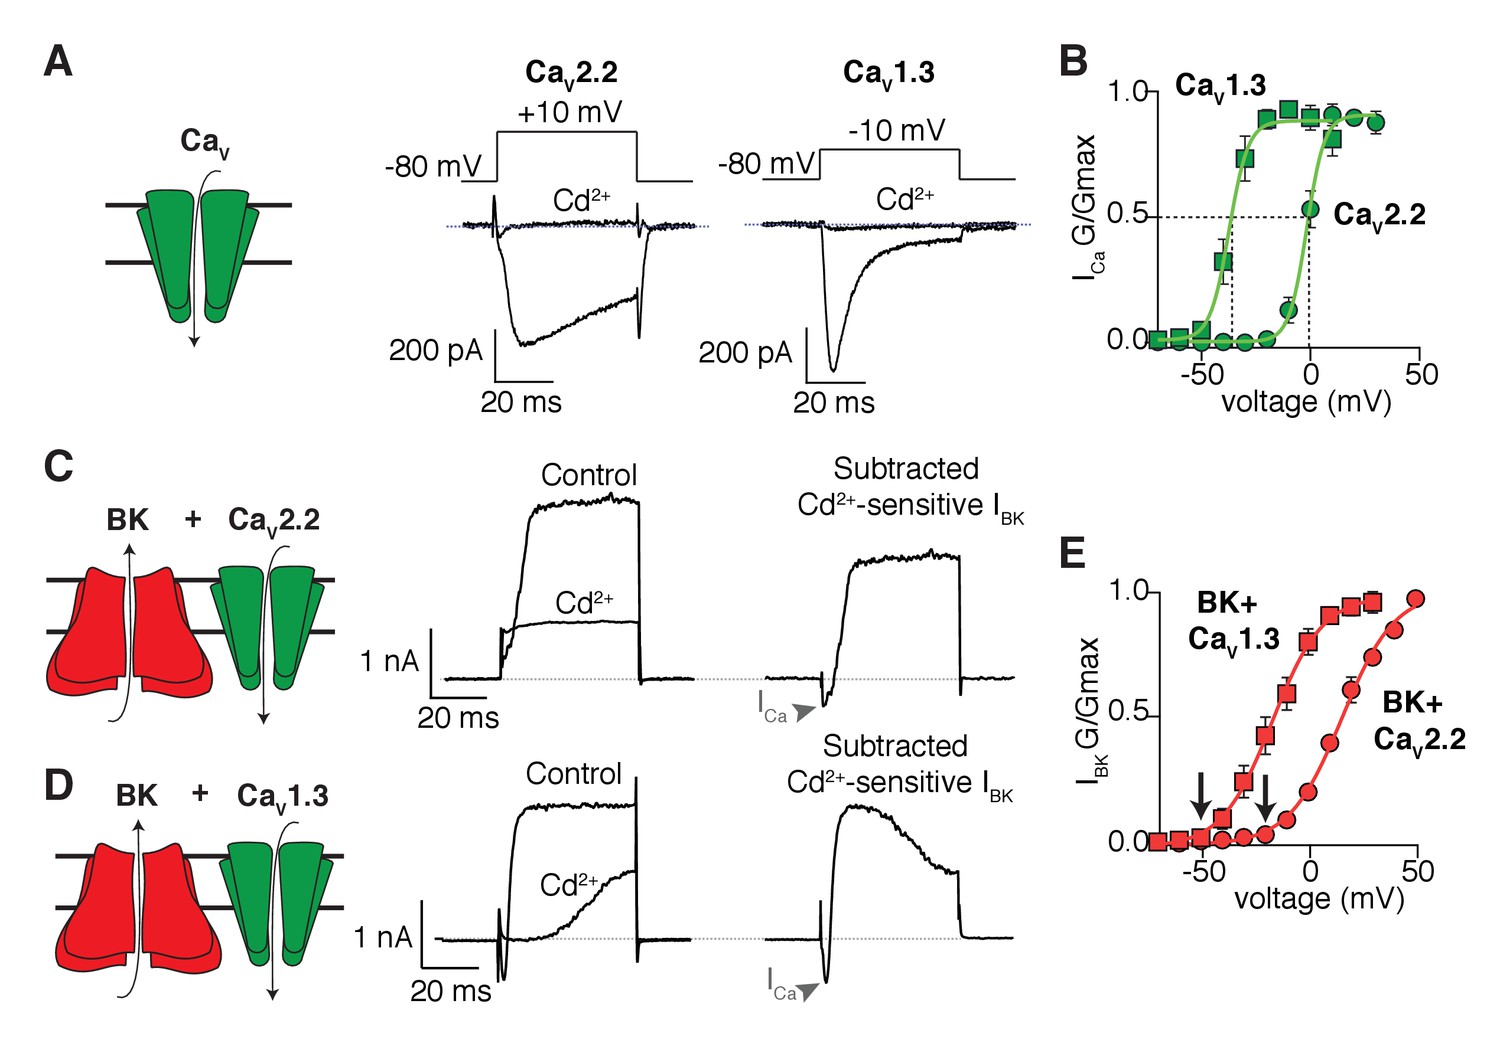
Shift in the activation profile of BK channels by co-expression with different CaV channels.
(A) Representative cadmium-sensitive inward (negative) calcium currents activated with the voltage protocol indicated above in tsA-201 cells transfected only with CaV2.2 or CaV1.3 channels. (B) Average conductance-voltage (G–V) relationships of CaV2.2 channels (green circles, n = 8) and CaV1.3 channels (green squares, n = 9) showing that CaV1.3 channels activate at more negative potentials than CaV2.2 channels. (C) Representative outward (positive) potassium currents activated with the same voltage protocol (above) in tsA-201 cells co-transfected with BK + CaV2.2 channels before and after application of cadmium. The subtracted current shows the inward calcium current (arrow heads) followed by the outward potassium current. (D) Same as in C but tsA-201 cells were co-transfected with BK + CaV1.3 channels. (E) Average G-V relationships for BK channels co-expressed with CaV2.2 (red circles, n = 9) or CaV1.3 channels (red squares, n = 7) showing that BK channels activate at more negative potentials when activated by CaV1.3 than when activated by CaV2.2. Arrows point at activation threshold. The smooth G-V curves in (B) and (E) are fitted Boltzmann functions: G/Gmax = 1/(1+ exp(-(V-Vmid)/slope)), where V is membrane voltage, Vmid is the voltage for the half-maximal activation, and slope describes the voltage dependency of channel gating. For the curves in (B), the CaV parameters Vmid and slope are −37 mV and 4 mV for CaV1.3 and −2 mV and 4 mV for CaV2.2. For the curves in (E), the BK parameters are −17 mV and 12 mV with CaV1.3 and +16 mV and 12.3 mV with CaV2.2.
Figure 1—figure supplement 1
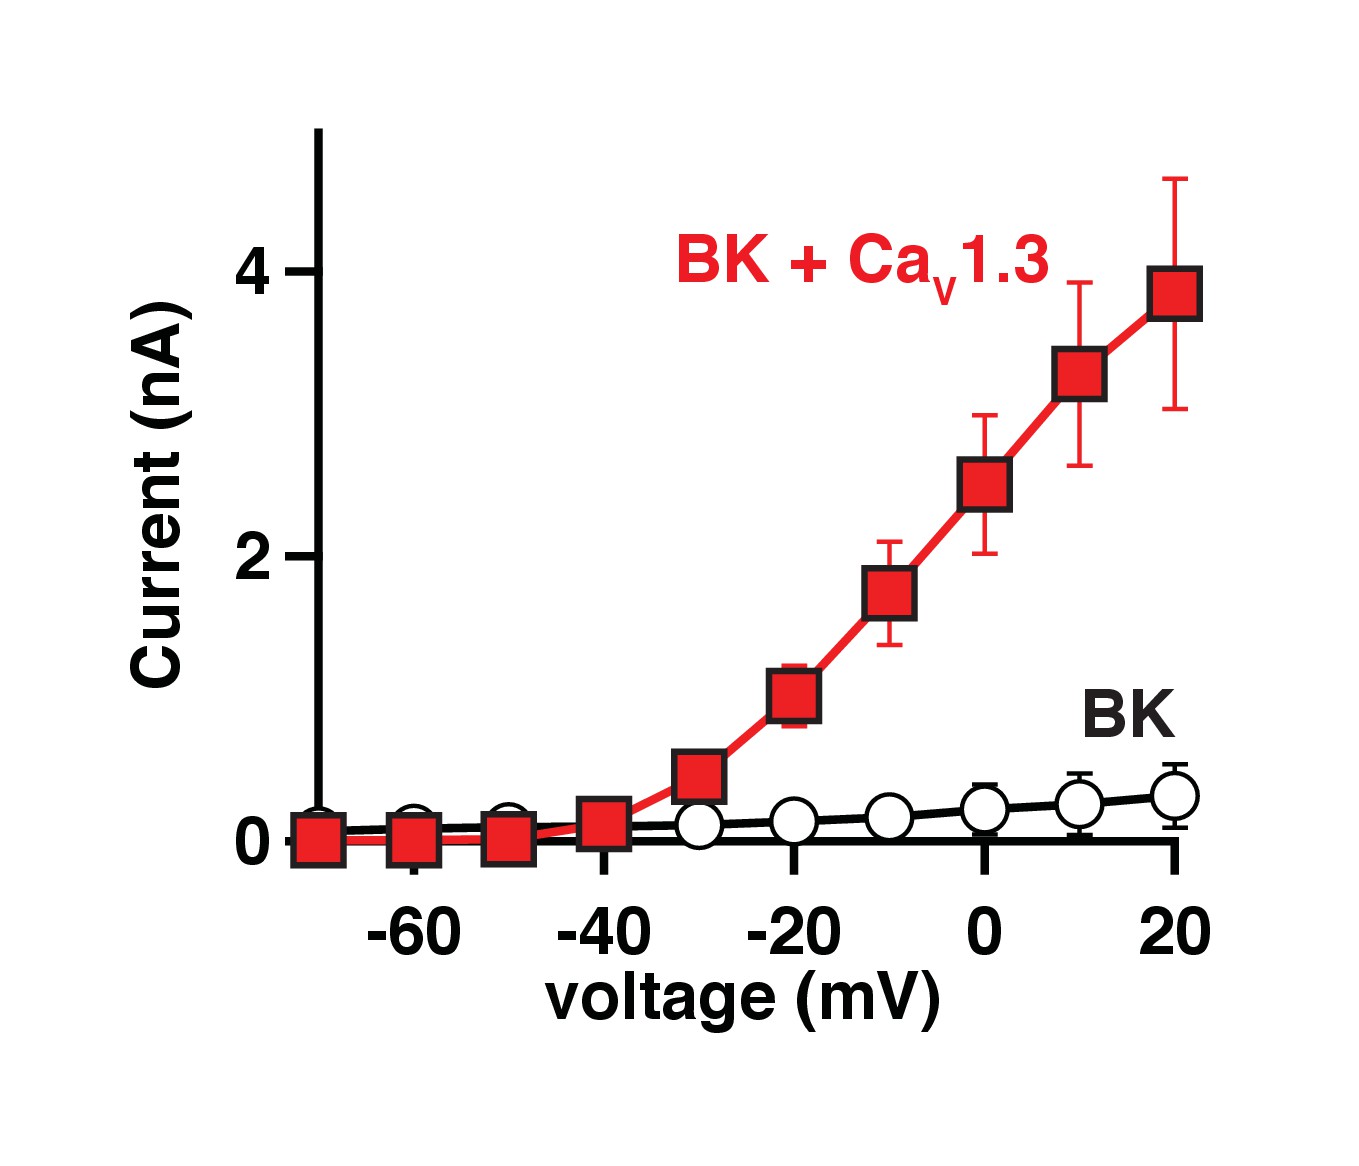
BK currents in tsA-201 cells require co-expression of CaV1.3 channels.
Average current-voltage curves from tsA-201 cells transfected with either BK channels only (empty circles, n = 8) or BK and CaV1.3 channels (red squares, n = 7) showing that calcium influx through CaV is required to activate BK channels in this expression system.
Figure 1—figure supplement 2
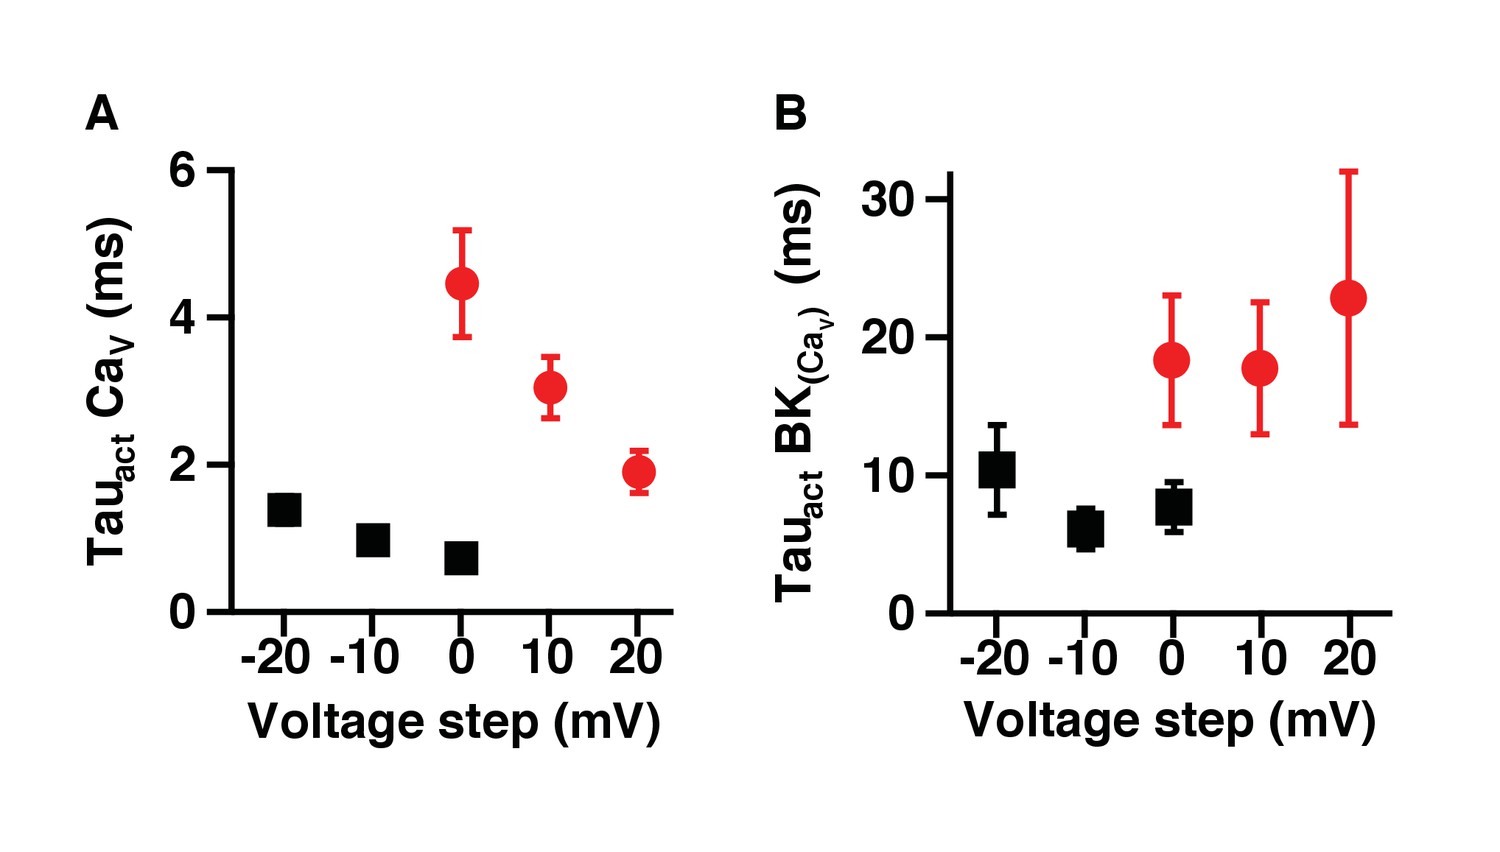
Activation of BK channels is slower when coupled with CaV2.2 channels.
(A) Activation time constant of currents at different voltages from CaV1.3 (black squares) or CaV2.2 (red circles) channels expressed in tsA-201 cells. (B) Activation time constants of currents at different voltages from BK channels co-expressed with CaV1.3 (black squares) or CaV2.2 (red circles) channels.
Figure 2 with 1 supplement
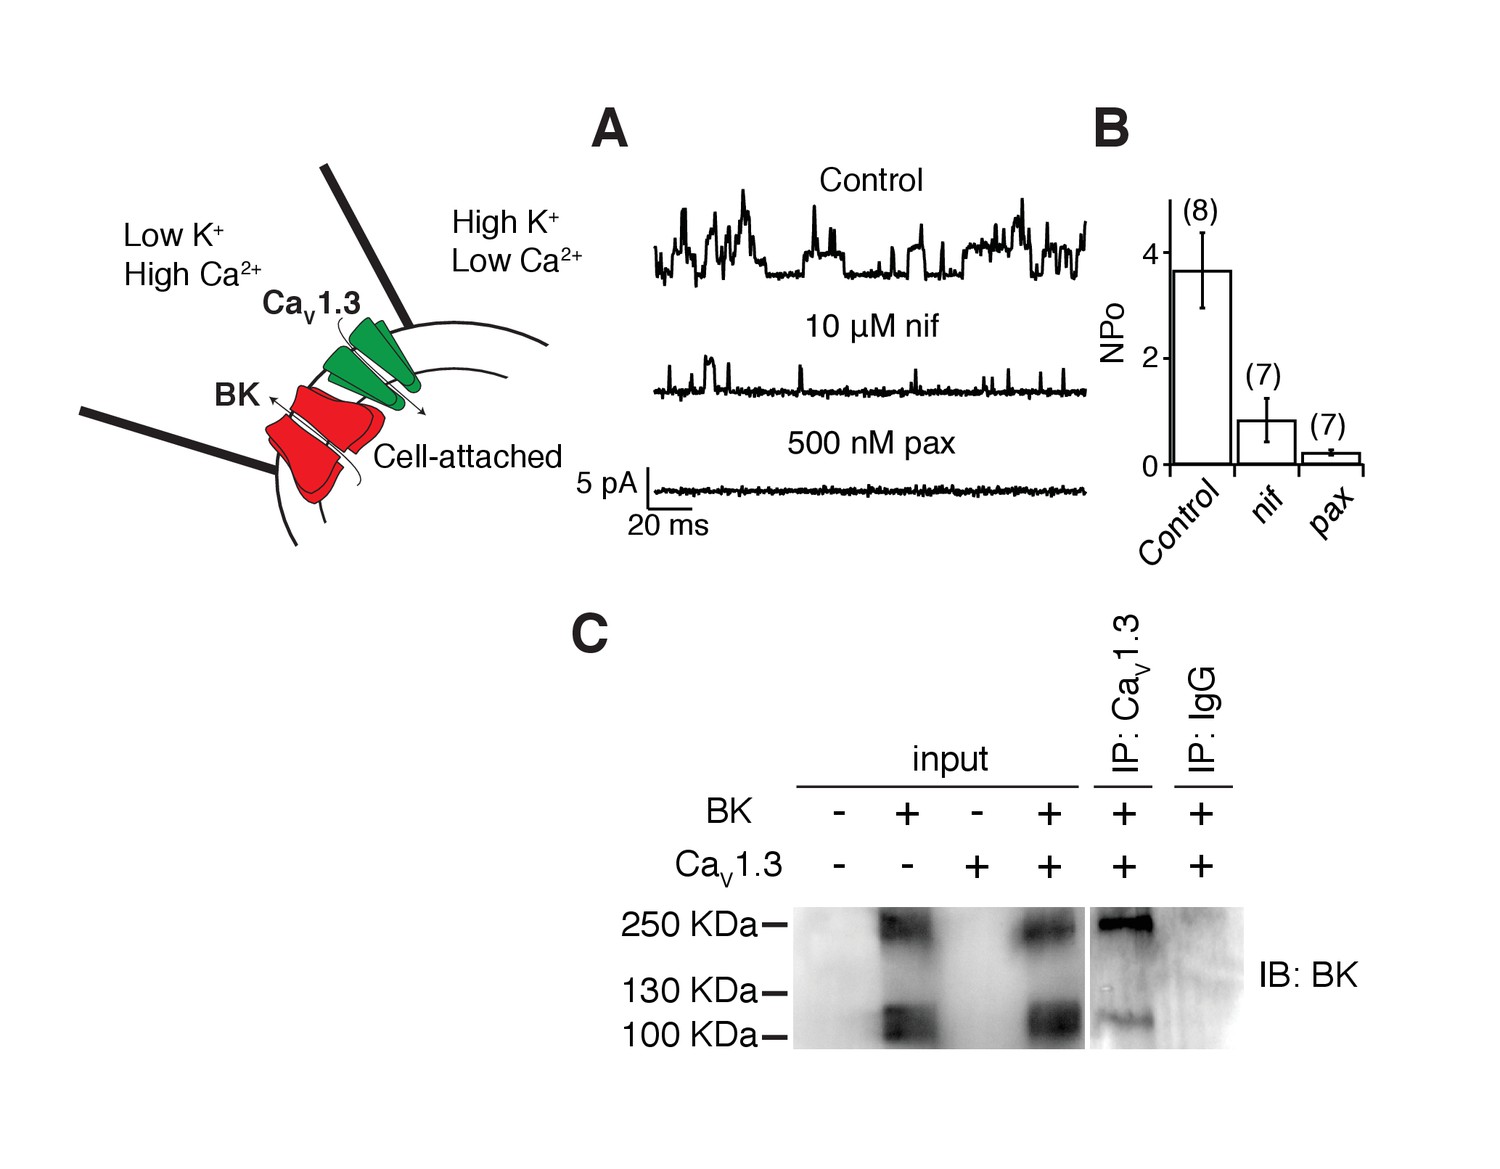
BK and CaV1.3 channels are close enough to be recorded in a small membrane patch and to be detected by co-immunoprecipitation.
(A) Representative single-channel recordings from tsA-201 cells expressing BK and CaV1.3 channels. Recordings were done in cell-attached mode, and outward (positive) BK currents were elicited by 1 s voltage steps to 0 mV, sufficient to activate CaV channels, from a holding potential of −80 mV. BK channel openings were decreased by sequential application of 10 μM nifedipine and 500 nM paxilline to the bath solution. The single-channel event-detection algorithm of pClamp 10.2 was used to measure single-channel opening amplitudes and to calculate the product of number of channels times probability of opening (NPo). (B) Quantification of BK channel activity (NPo) from each condition in A. (C) (left gel) Detection of BK channel protein by Western blot in tsA-201 cells transfected with BK cDNA only or with BK and CaV1.3 cDNA. BK channels were not detected when cells were not transfected or when only CaV1.3 cDNA was transfected. The molecular weight of the monomeric BK channel is around 130 KDa. The band located at around 250 KDa likely corresponds to dimers. (right gel) Detection of BK channels in a pulldown assay with CaV1.3 antibody (n = 3 gels from independent experiments). BK channels were not detected if proteins were pulled down with an unspecific IgG.
Figure 2—figure supplement 1

Raw BK single-channel recording.
(A) Raw single-channel recording from a tsA-201 cell transfected with CaV1.3 and BK channels that were activated with a voltage command to 0 mV. Holding potential was −80 mV. Arrow points to BK channel openings.
Figure 3
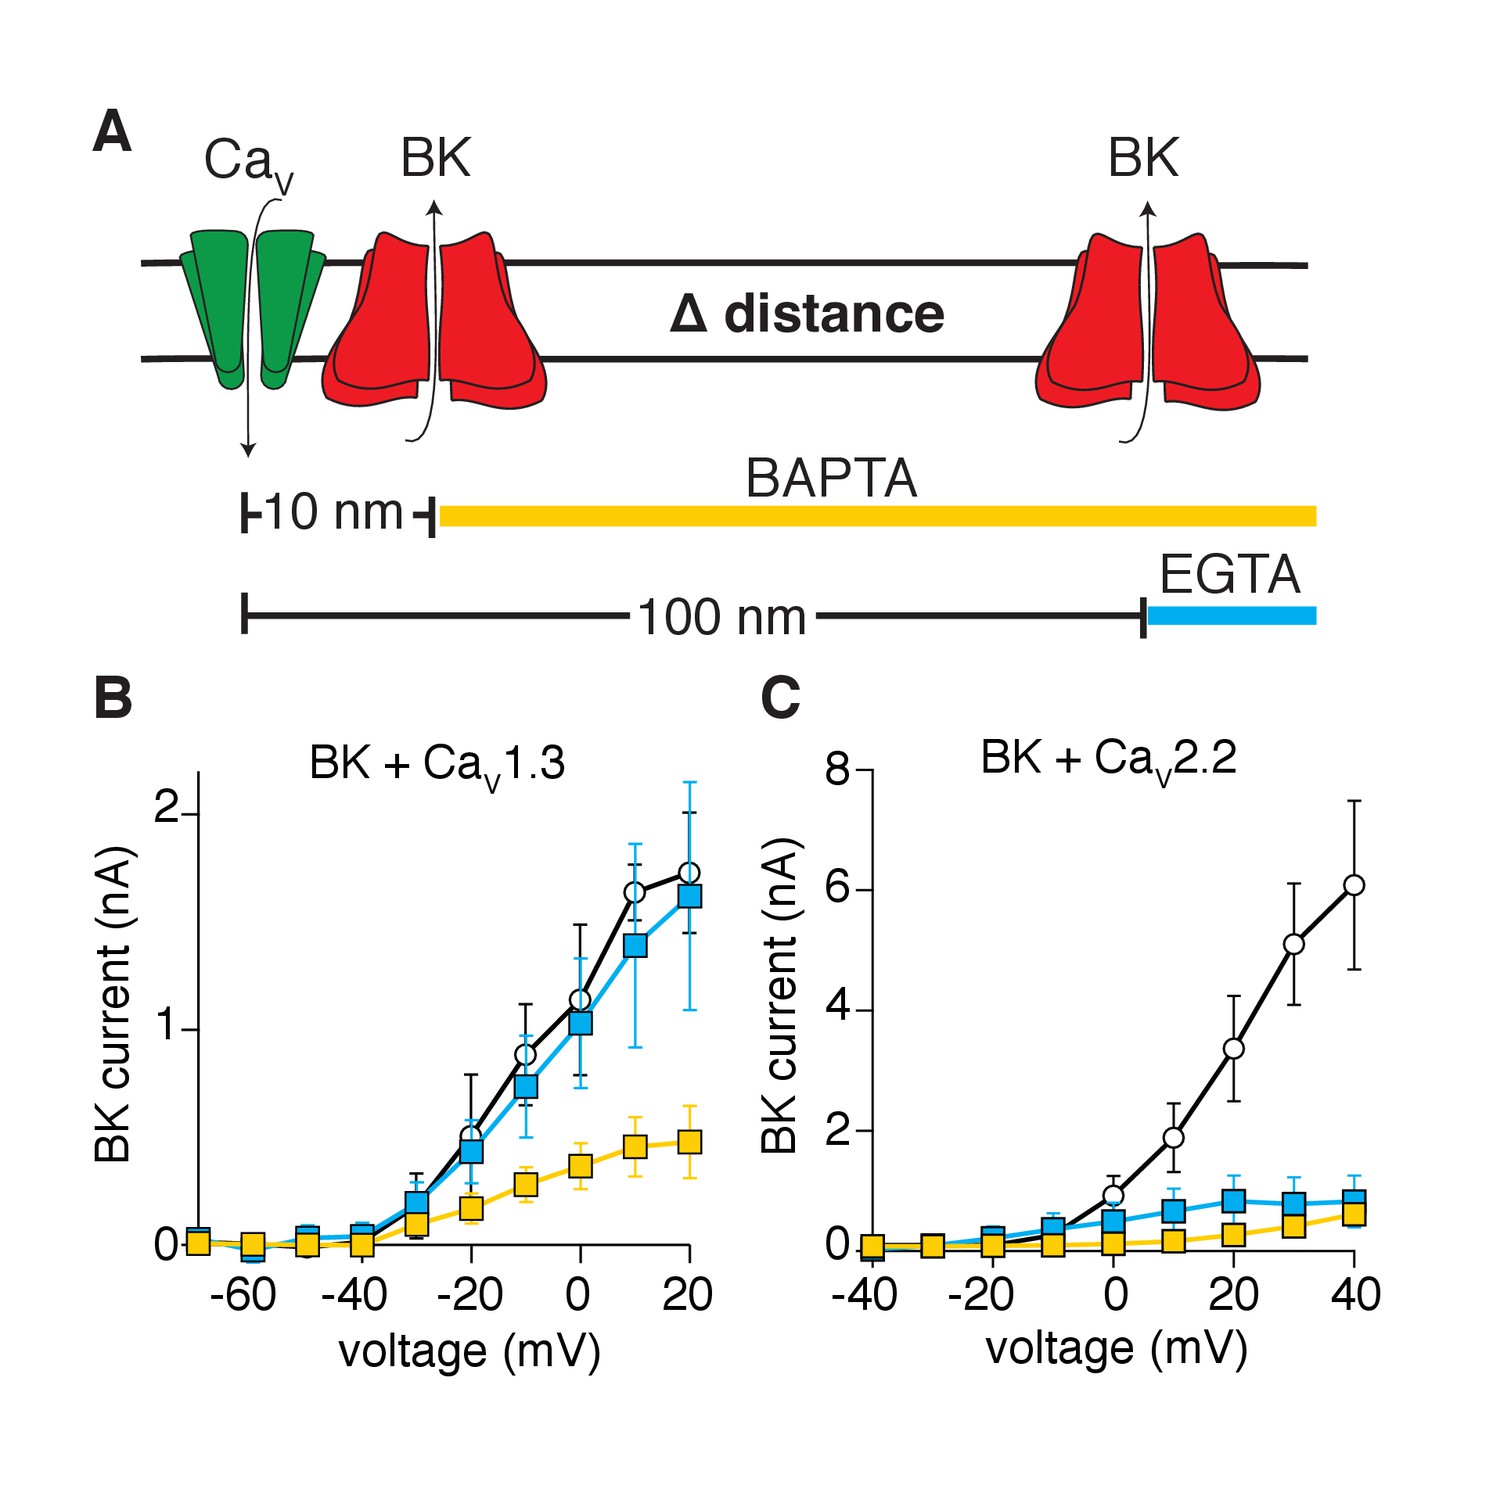
Activation of BK channels by CaV1.3 channels is blocked by fast calcium buffers.
(A) Diagram of the experimental strategy. BAPTA will buffer calcium farther than 10 nm from the calcium source. EGTA will buffer calcium farther than 100 nm from the calcium source. (B) Comparison of current-voltage relations for BK channels coexpressed with CaV1.3 channels and measured with either control pipette solution (empty circles, n = 5), EGTA-containing solution (blue squares, n = 5), or BAPTA-containing solution (yellow squares, n = 7). Recordings were done in whole-cell configuration. (C) Comparison of current-voltage relations for BK channels coexpressed with CaV2.2 channels and measured with either control pipette solution (empty circles, n = 7), EGTA-containing solution (blue squares, n = 9), or BAPTA-containing solution (yellow squares, n = 7).
Figure 4 with 5 supplements
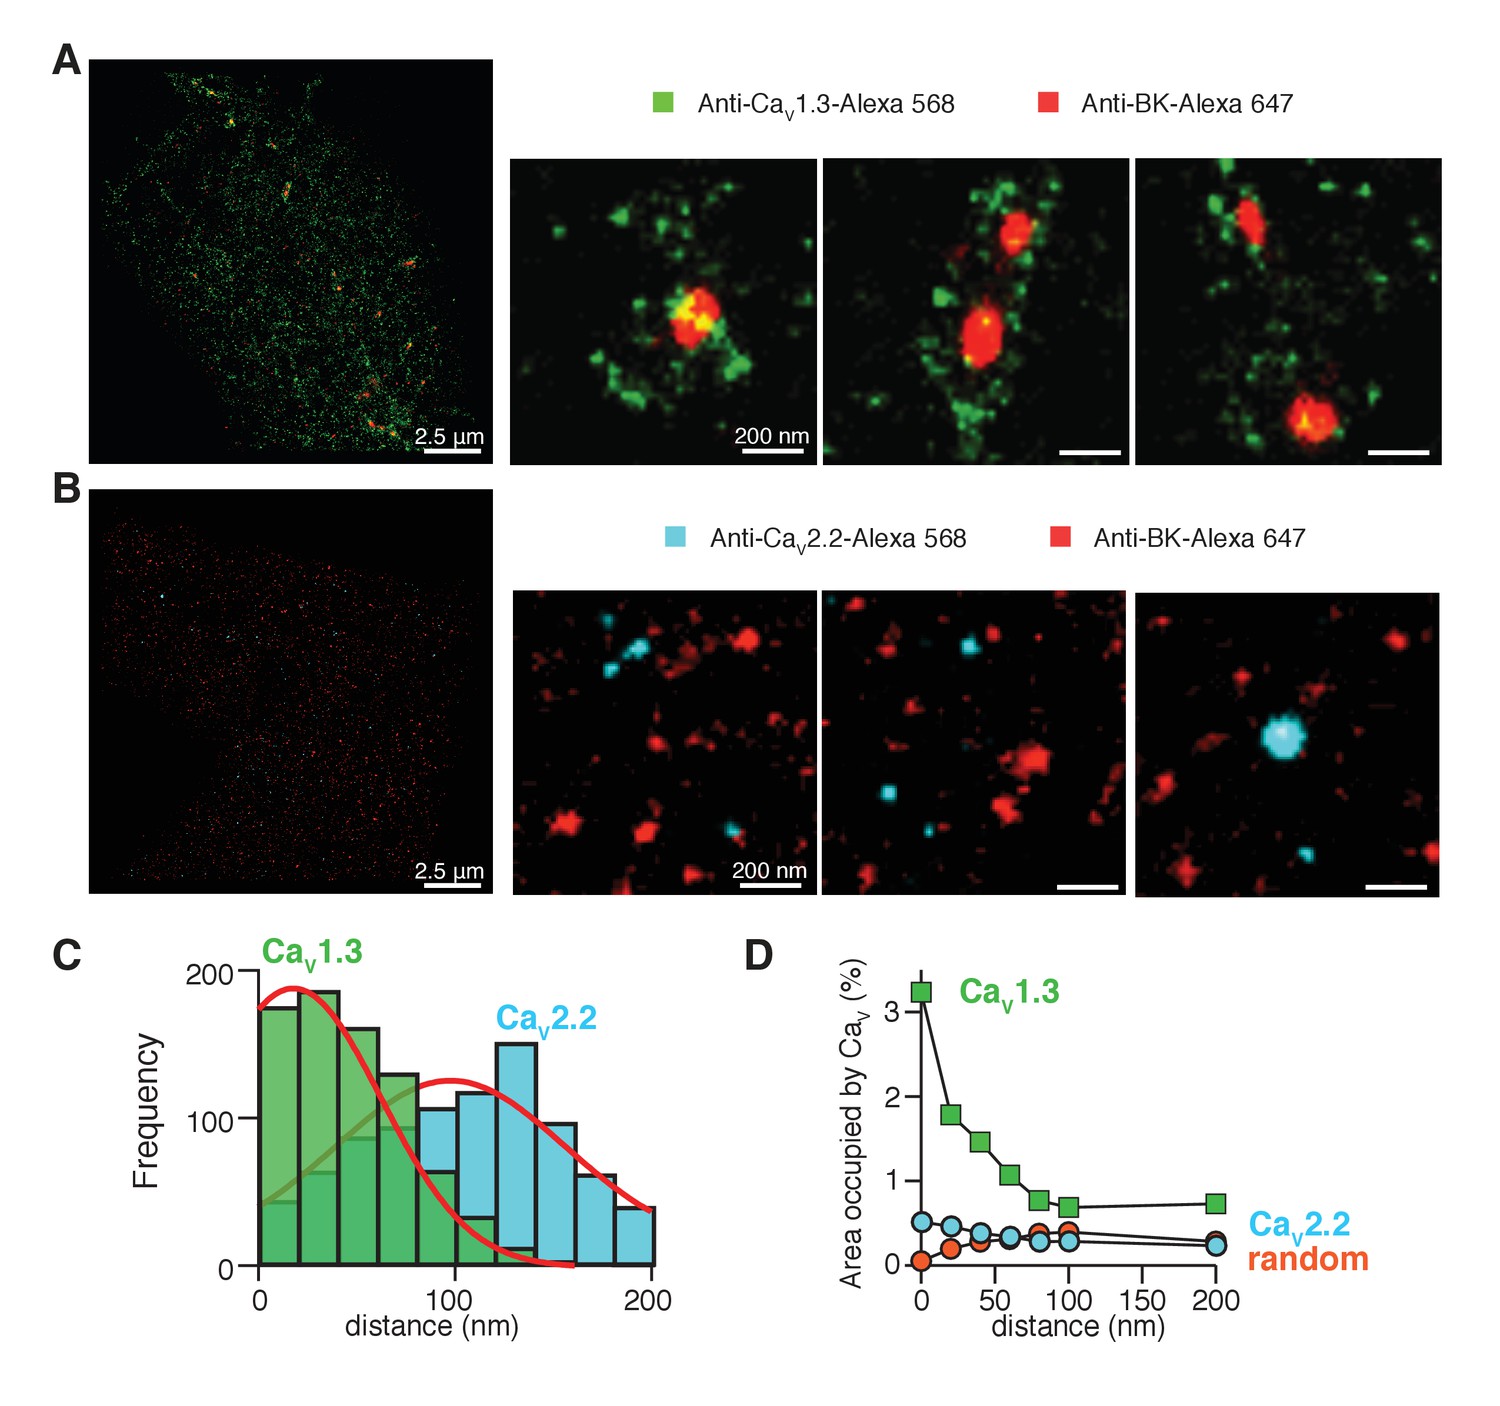
CaV1.3 channels are preferentially distributed in close proximity to BK channels.
(A) Three representative single-molecule localization maps from cells co-expressing BK (red) and CaV1.3 (green) channels, showing individual clusters of BK channels surrounded by several clusters of Cav1.3 channels. (B) Three representative single-molecule localization maps from cells co-expressing BK (red) and CaV2.2 (cyan) channels, showing no particular association between BK and CaV2.2 channels. (C) Frequency distribution of the distance from BK-positive clusters to CaV1.3-positive (green, n = 5 cells) or CaV2.2-positive (cyan, n = 4 cells) clusters. (D) Distribution analysis based on the percentage of area occupied by CaV1.3 clusters (green squares, n = 5 cells), CaV2.2 clusters (cyan circles, n = 4 cells), or randomized CaV1.3 clusters (orange circles, n = 5 cells) as a function of the distance from BK channels.
Figure 4—figure supplement 1
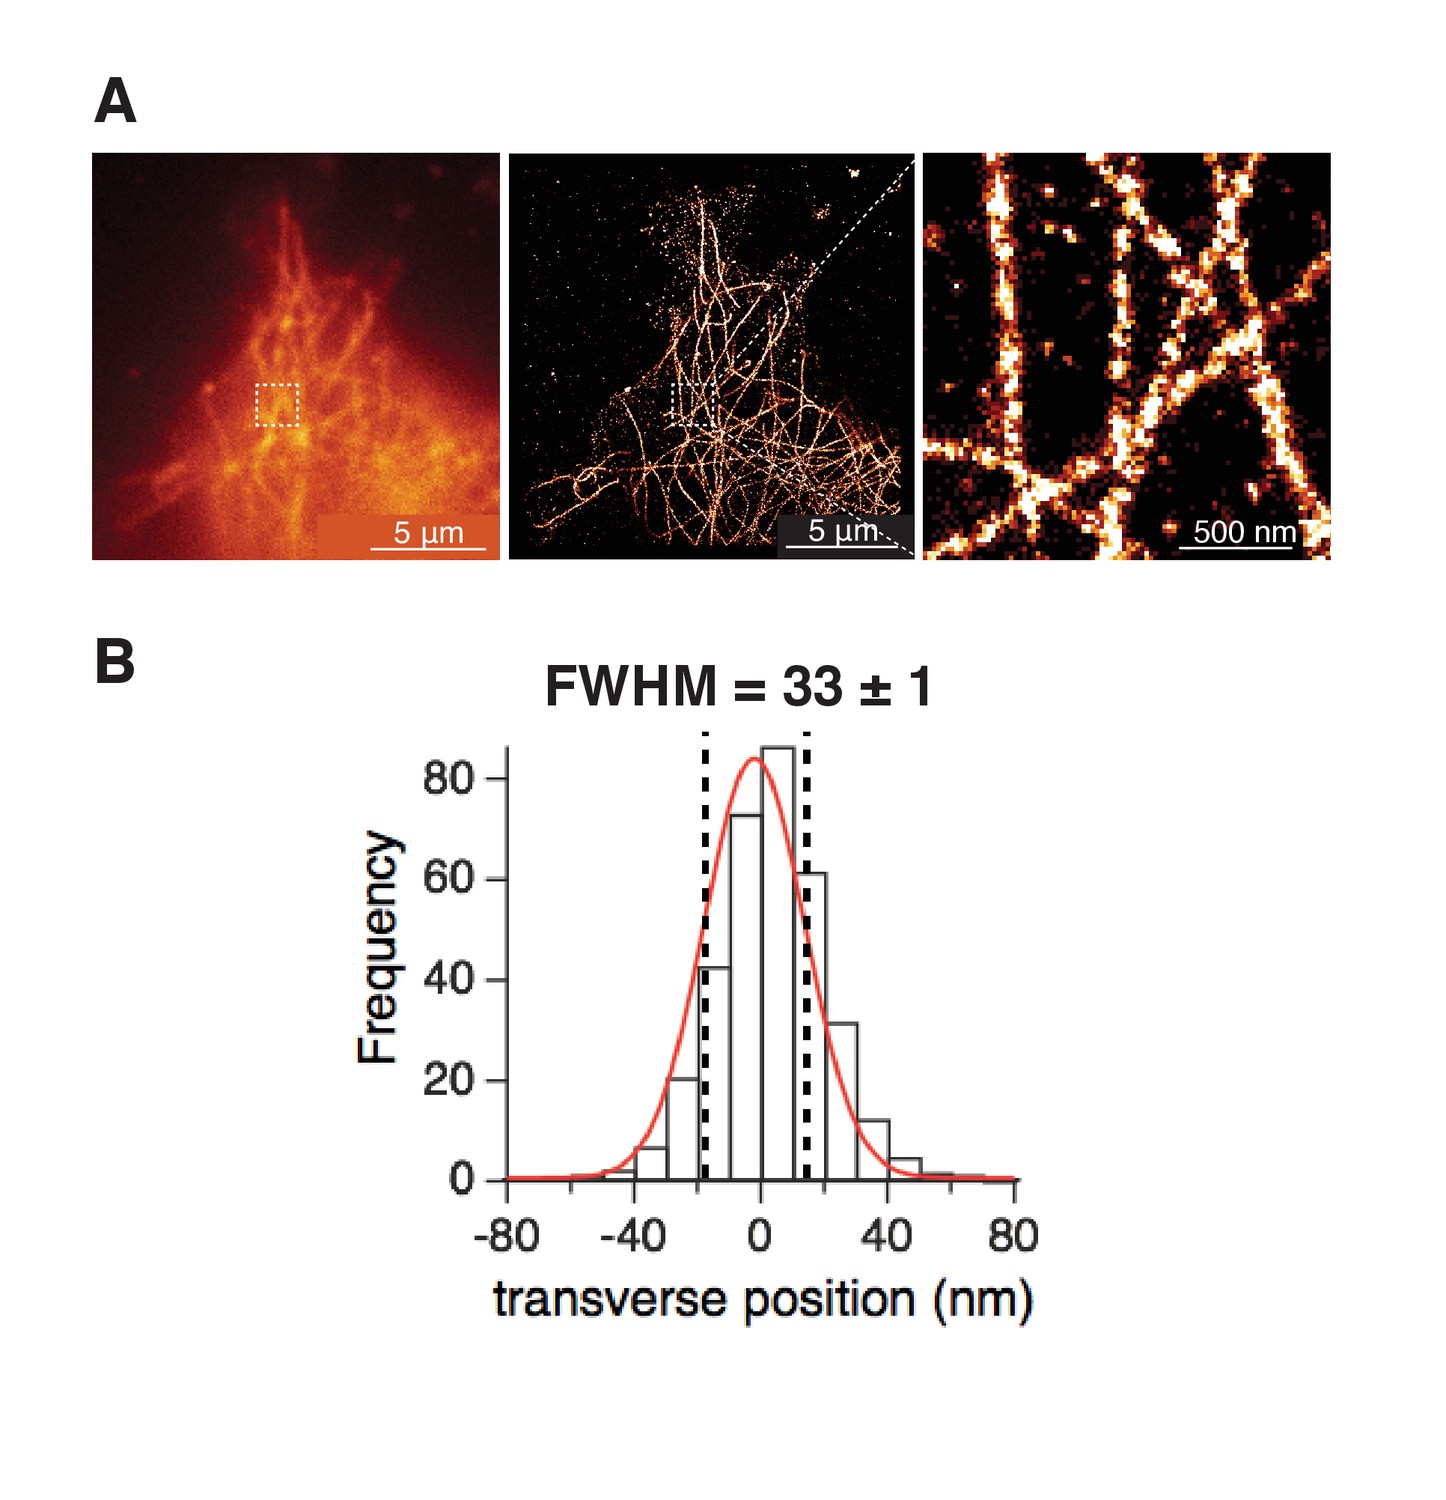
Single-molecule localization maps of α-tubulin in tsA-201 cells.
(A) (left) TIRF images in confocal mode or (middle) single-molecule localization mode of microtubules. (right) Zoom-in from the white square in middle image showing individual microtubules. (B) Frequency distribution of transverse profiles crossing single microtubules (44 ROIs from 3 cells). Profiles were aligned at the center, labeled as 0 nm. Fitting the profile with a Gaussian curve (red curve) gave the expected width of individual microtubules measured as the full-width-at-half-maximum (FWHM), which agrees with values reported before for microtubule widths (Burnette et al., 2011; Dempsey et al., 2011). Same settings were used to acquire single-molecule localization maps of BK and CaV1.3 channels.
Figure 4—figure supplement 2
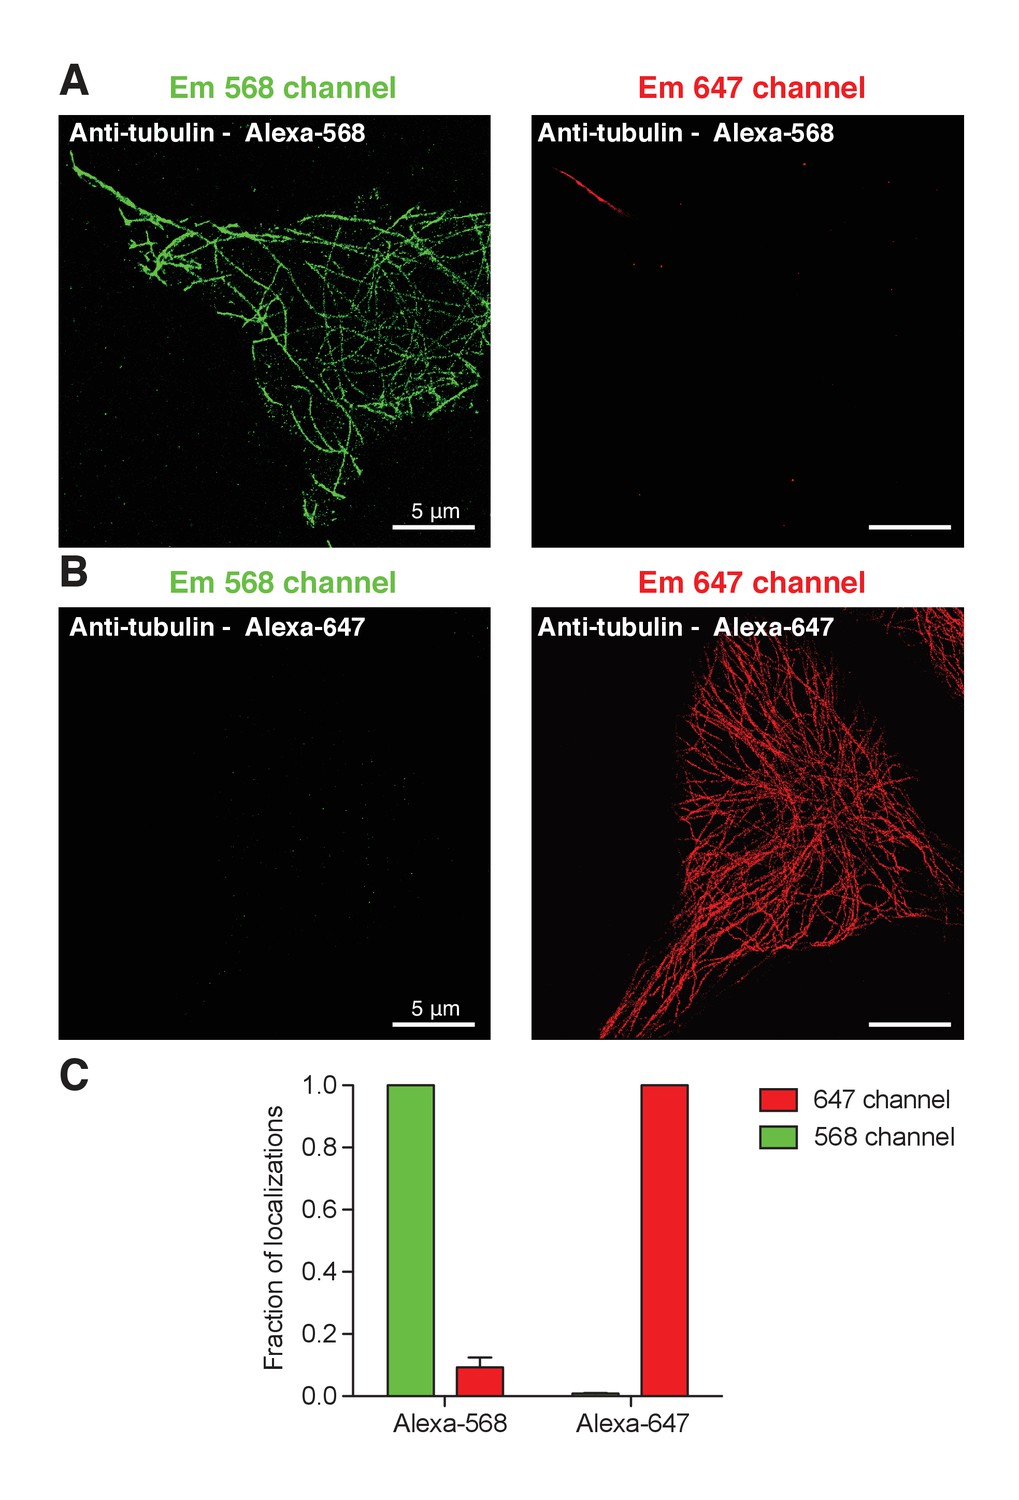
Little bleed-through between wavelength channels in super-resolution imaging.
(A). tsA-201 cell immunostained for α-tubulin with a secondary antibody conjugated with Alexa-568 and imaged in super-resolution in the 568 (green) and 647 (red) channel. (B). Same as in A but the secondary antibody was conjugated with Alexa-647. (C). Fraction of localizations from either Alexa-568 or Alexa-647 dye into the 568 channel (green bars) or 647 channel (red bars). The fraction of localizations of Alexa-568 dye into the 647 channel corresponds to the bleed-through and vice versa for Alexa-647 dye.
Figure 4—figure supplement 3
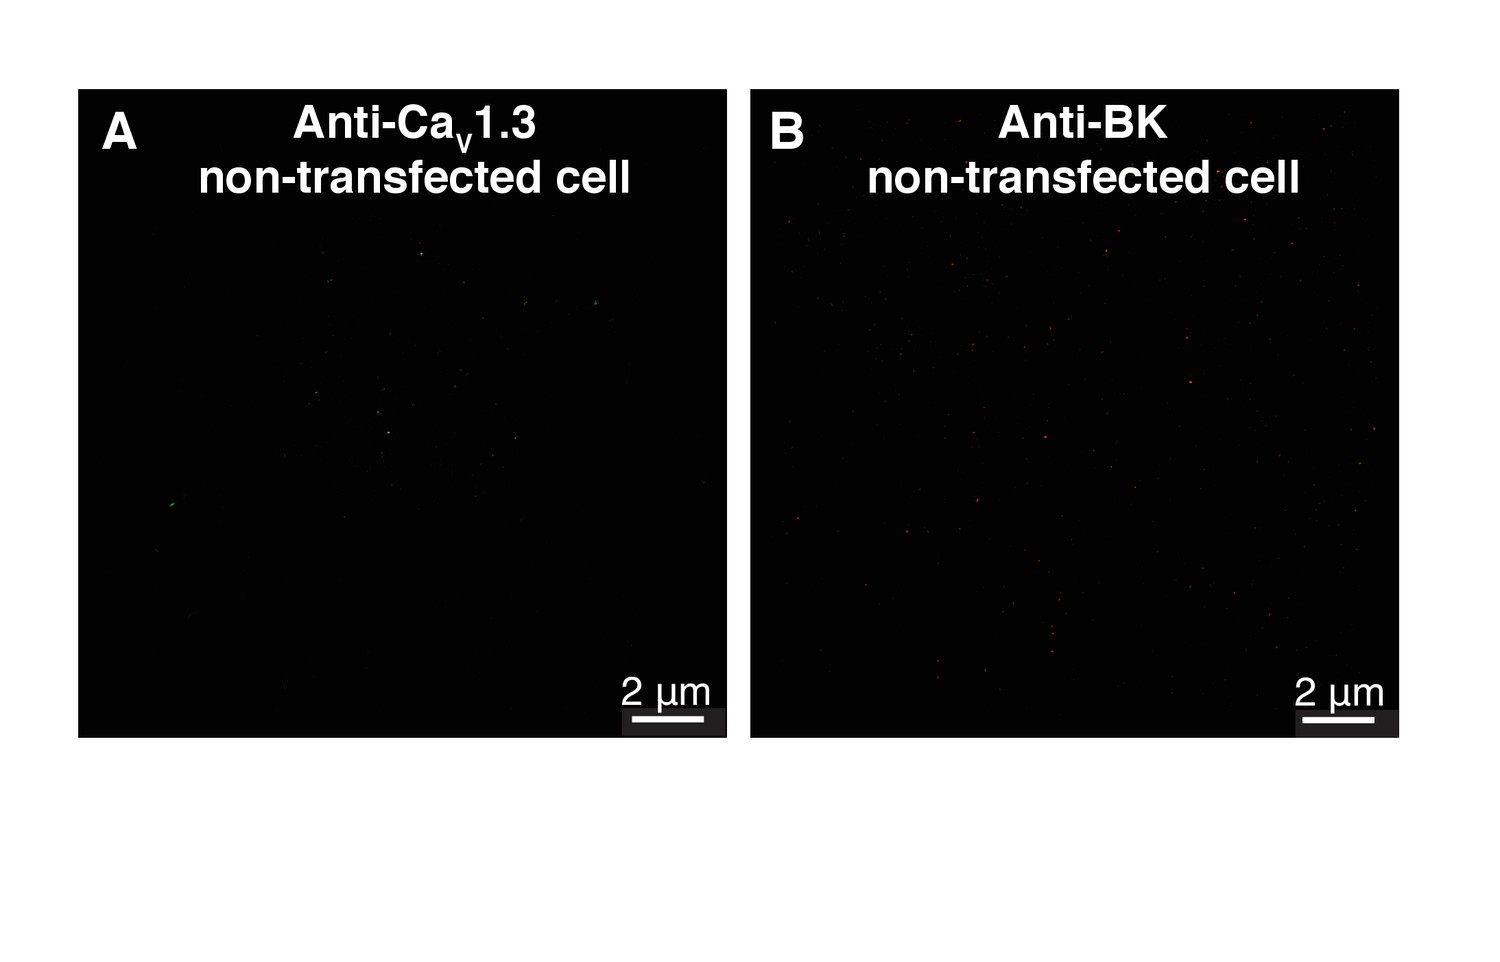
Control single-molecule localization maps of BK and CaV1.3 channels in tsA-201 cells.
(A) Map of a tsA-201 cell non-transfected with CaV1.3 channels and immunostained with the primary antibody against CaV1.3. (B) Map of a tsA-201 cell non-transfected with cDNA for BK channels and immunostained with the primary antibody against BK.
Figure 4—figure supplement 4
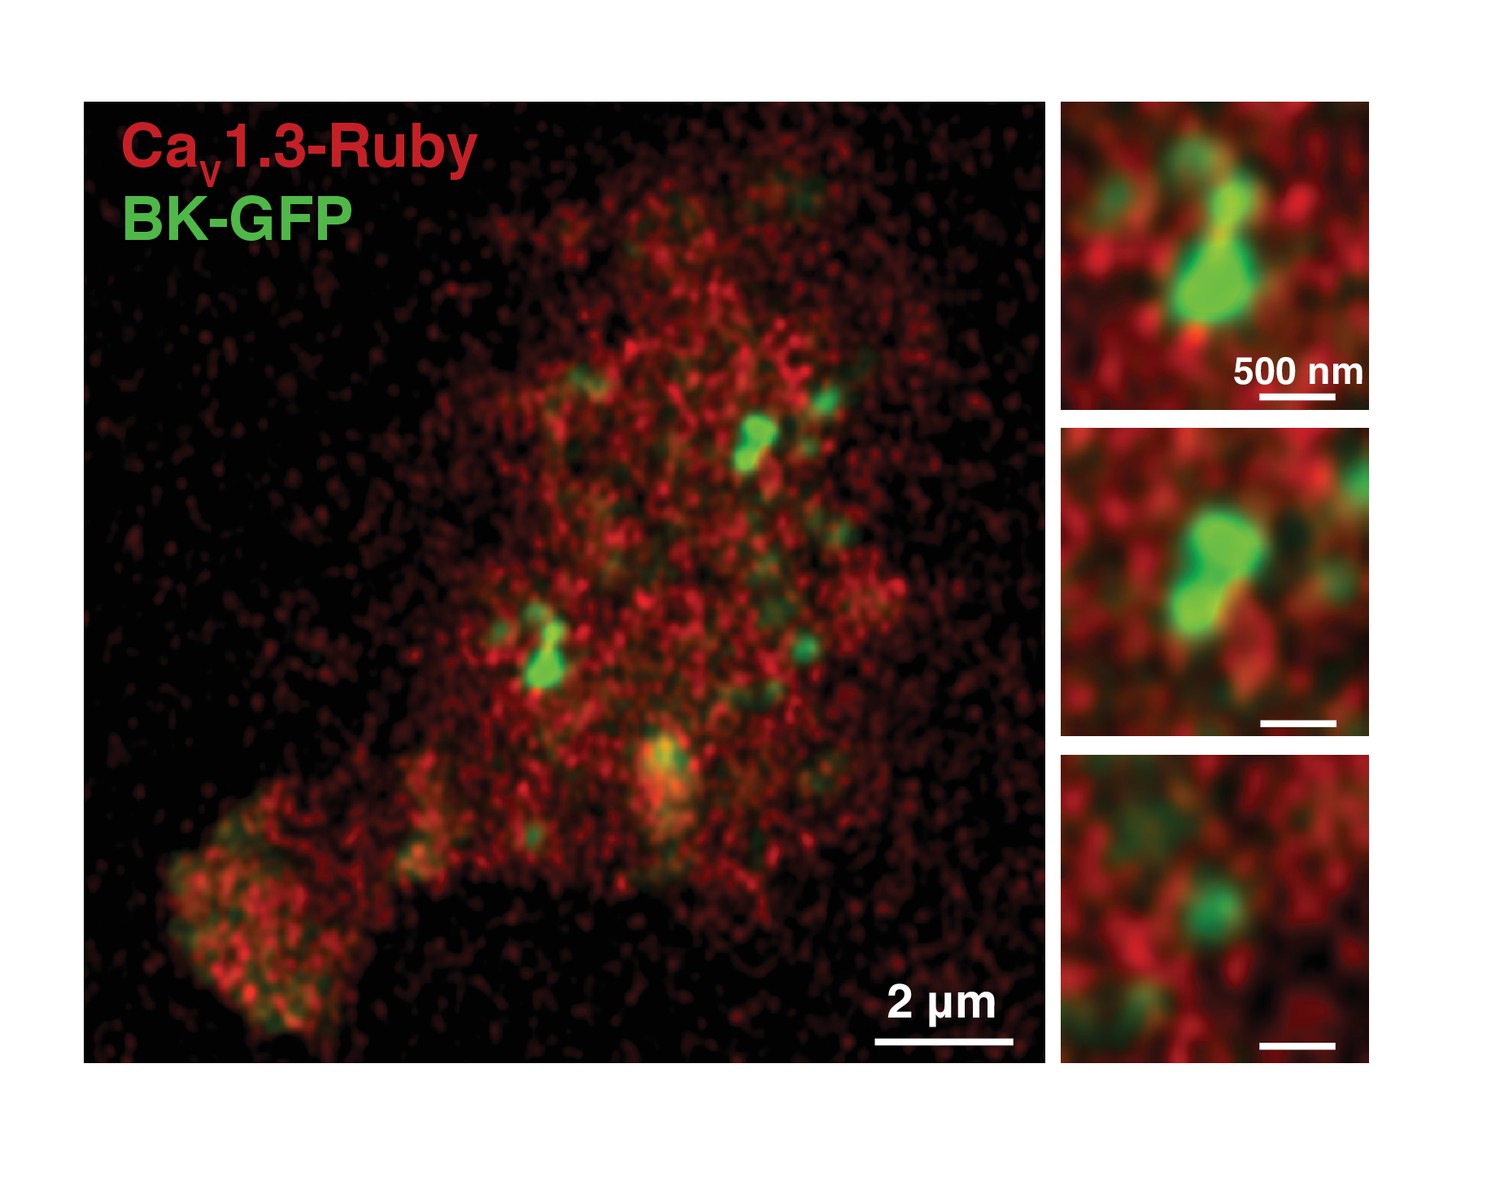
BK-CaV1.3 clustering is not an artifact of fixation.
BK-GFP (green) and CaV1.3-Rubby (red) were transfected in tsA-201 cells and imaged in an AiryScan microscope. Cells were not fixed. Magnifications of three regions are shown in the right panels. Note that the distribution of CaV1.3 channels around BK clusters is also observed in live cells.
Figure 4—figure supplement 5
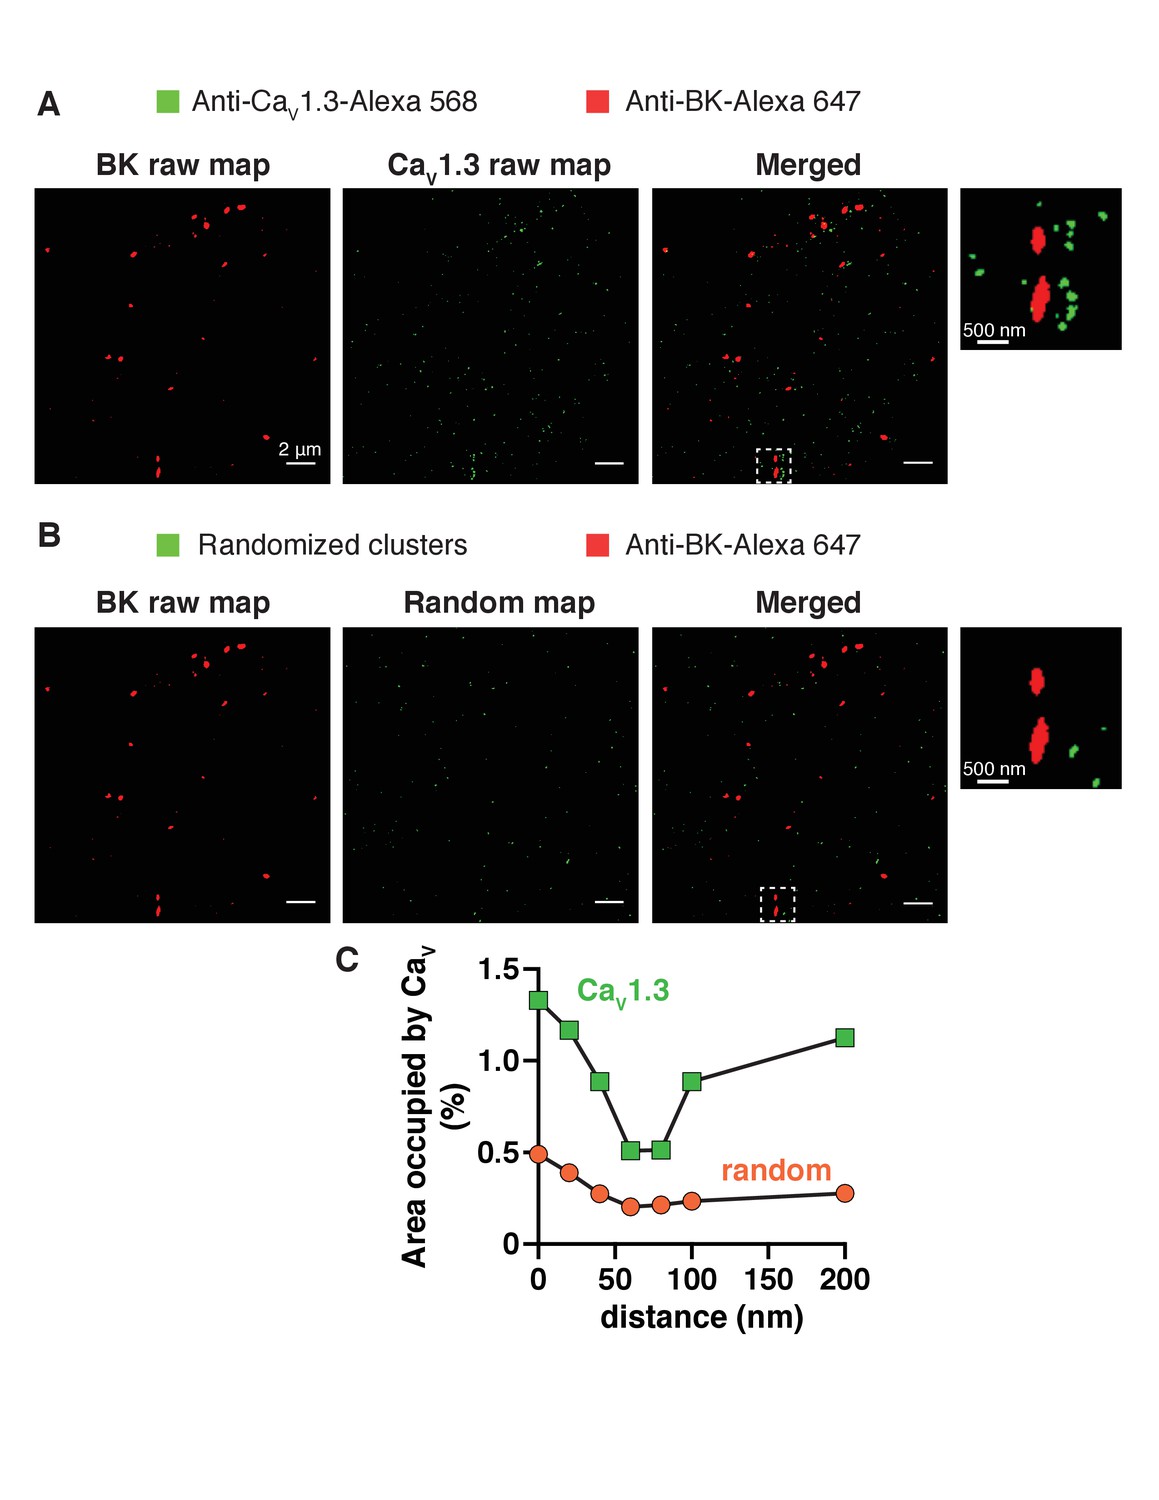
Generation and analysis of random single-molecule localization maps.
(A) Representative raw single-molecule localization map of a tsA-201 cell transfected with both BK and CaV1.3 channels. Secondary antibodies were Alexa-647 for BK channels (red, left) and Alexa-568 for CaV1.3 channels (green, middle). Right image shows the merged red and green signals. (Inset) Zoom-in from the white square in merged image. (B) Generation of random images. Red image was left intact (left). Green image in A was randomized (middle) keeping the same number, size, and shape of green particles. Right image shows the merged red and randomized green signals. (Inset) Zoom-in from the white square in merged image. (C) Distribution analysis based on the percentage of area occupied by CaV1.3 clusters (green squares) or random green particles (orange circles) as a function of the distance from BK channels.
Figure 5 with 3 supplements
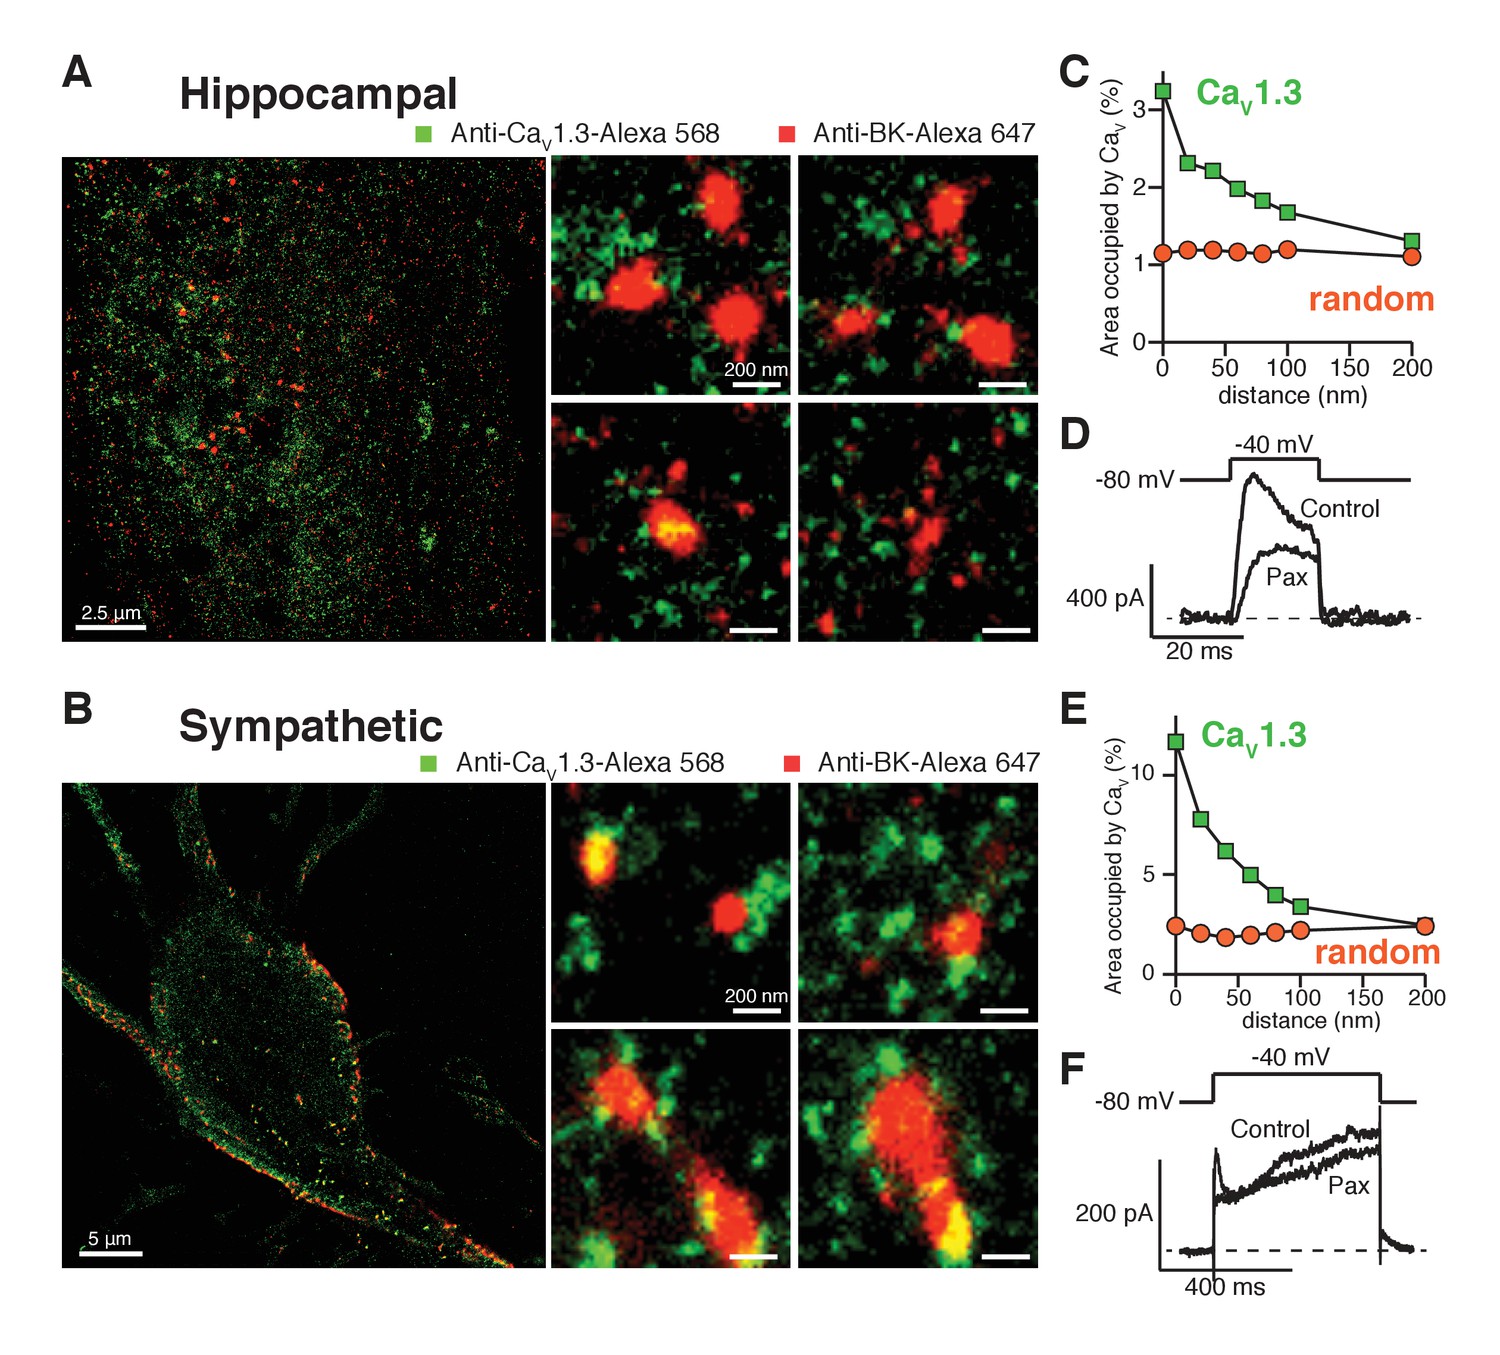
Endogenous BK and CaV1.3 channels also form clusters in neurons.
(A, B) Representative single-molecule localization maps from cultured hippocampal (A) and sympathetic (B) neurons labeled for BK (red) and CaV1.3 (green) channels; zoom-in panels to the right show clusters of BK channels surrounded by CaV1.3 channels. (C, E) Distribution analysis based on the percentage of area occupied by CaV1.3 clusters (green squares) or randomized CaV1.3 clusters (orange circles, n = 6) as a function of the distance from BK channels in hippocampal (C, n = 6) and sympathetic (E, n = 7) neurons. (D, F) Outward currents activated at low negative potentials (−40 mV, see voltage protocol) before and after the application of 500 nM paxilline in hippocampal (D, n = 3) and sympathetic (F, n = 3) neurons.
Figure 5—figure supplement 1
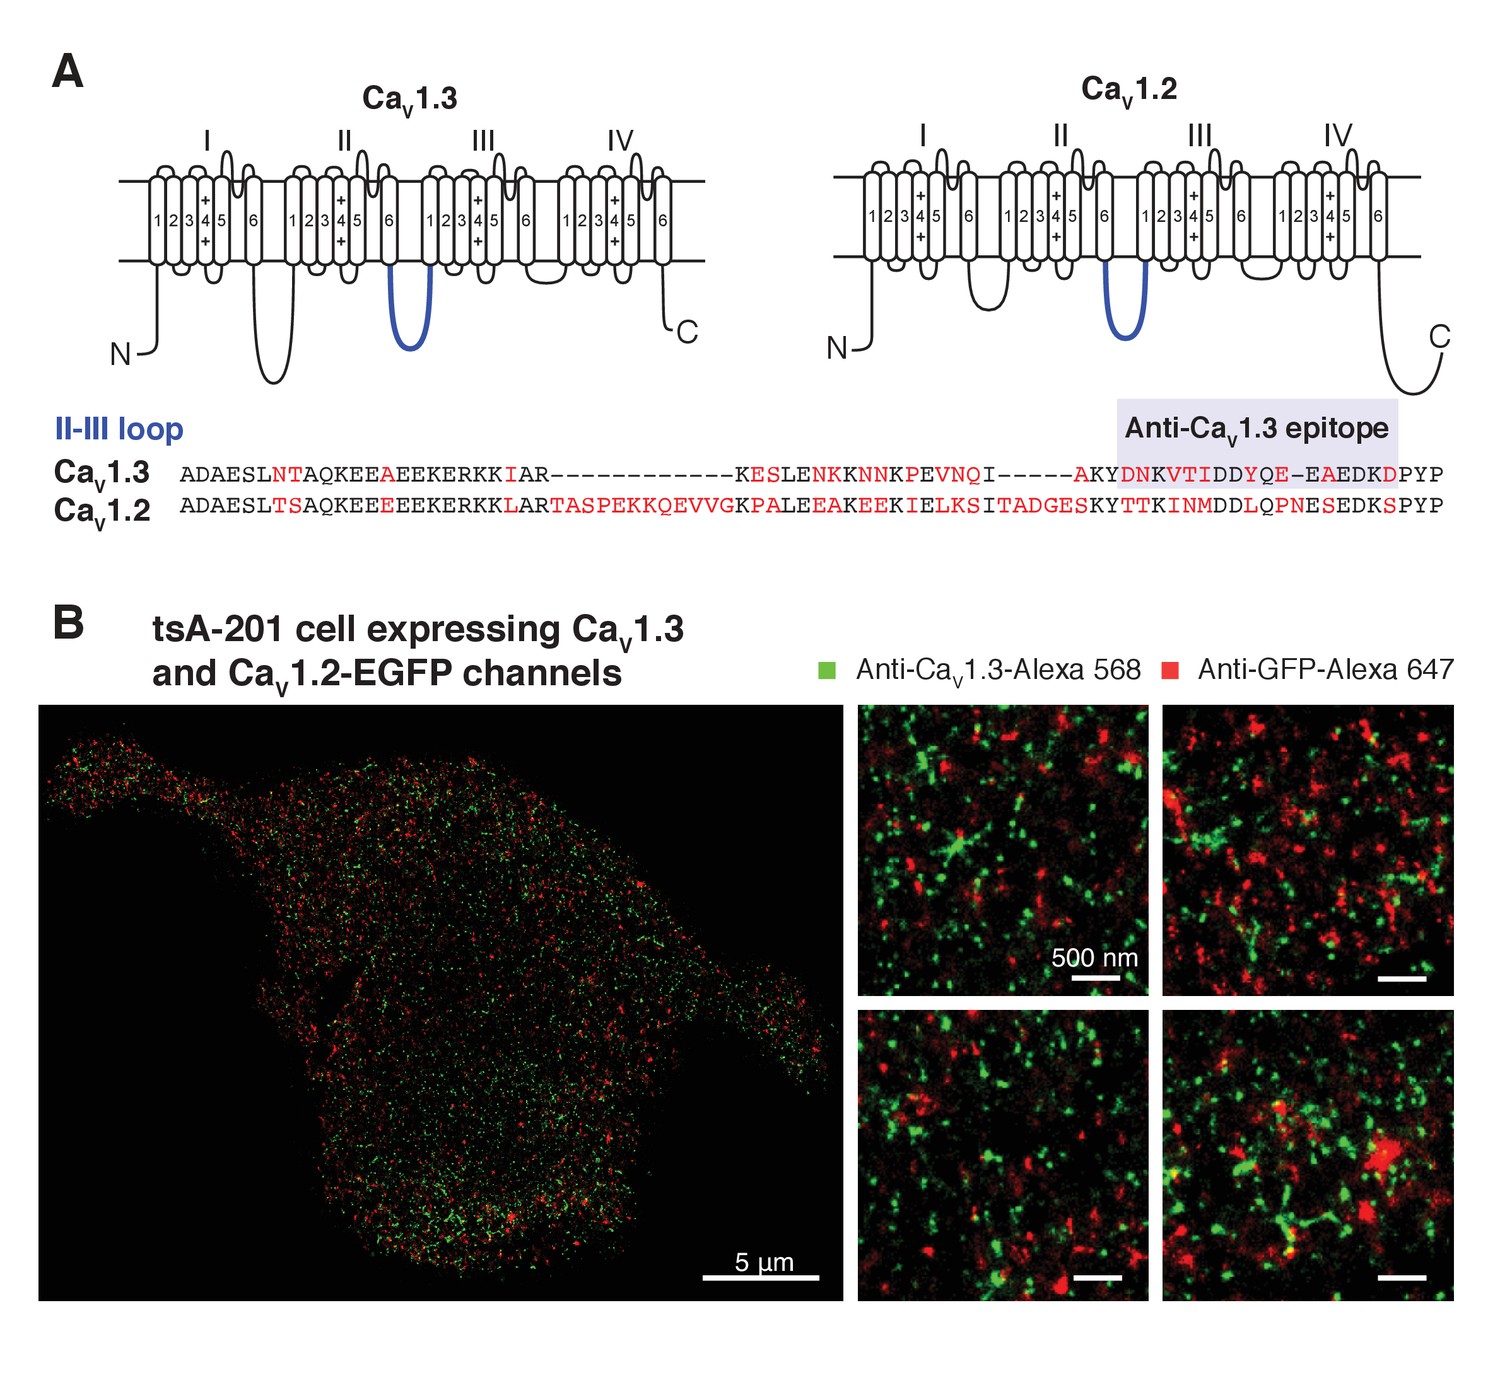
Specificity of anti-CaV1.3 antibody in tsA-201 cells expressing CaV1.3 and CaV1.2 channels.
(A) (top) Schematic of CaV1.3 and CaV1.2 channels depicting in blue the II-III intracellular loop. (bottom) Sequence homology of the II-III intracellular loop showing the epitope recognized by the anti-CaV1.3 antibody. Non-conserved amino acids between the two sequences are shown in red. (B) (left) single-molecule localization maps of a representative tsA-201 cell expressing CaV1.3 and CaV1.2-EGFP channels and immunostained with anti-CaV1.3 (green, Alexa-568 as 2ry antibody), and anti-GFP (red, Alexa-647 as 2ry antibody) antibodies. (right) Zoom-in panels, from different regions of the same cell, depicting the differential immunostaining pattern of both antibodies.
Figure 5—figure supplement 2
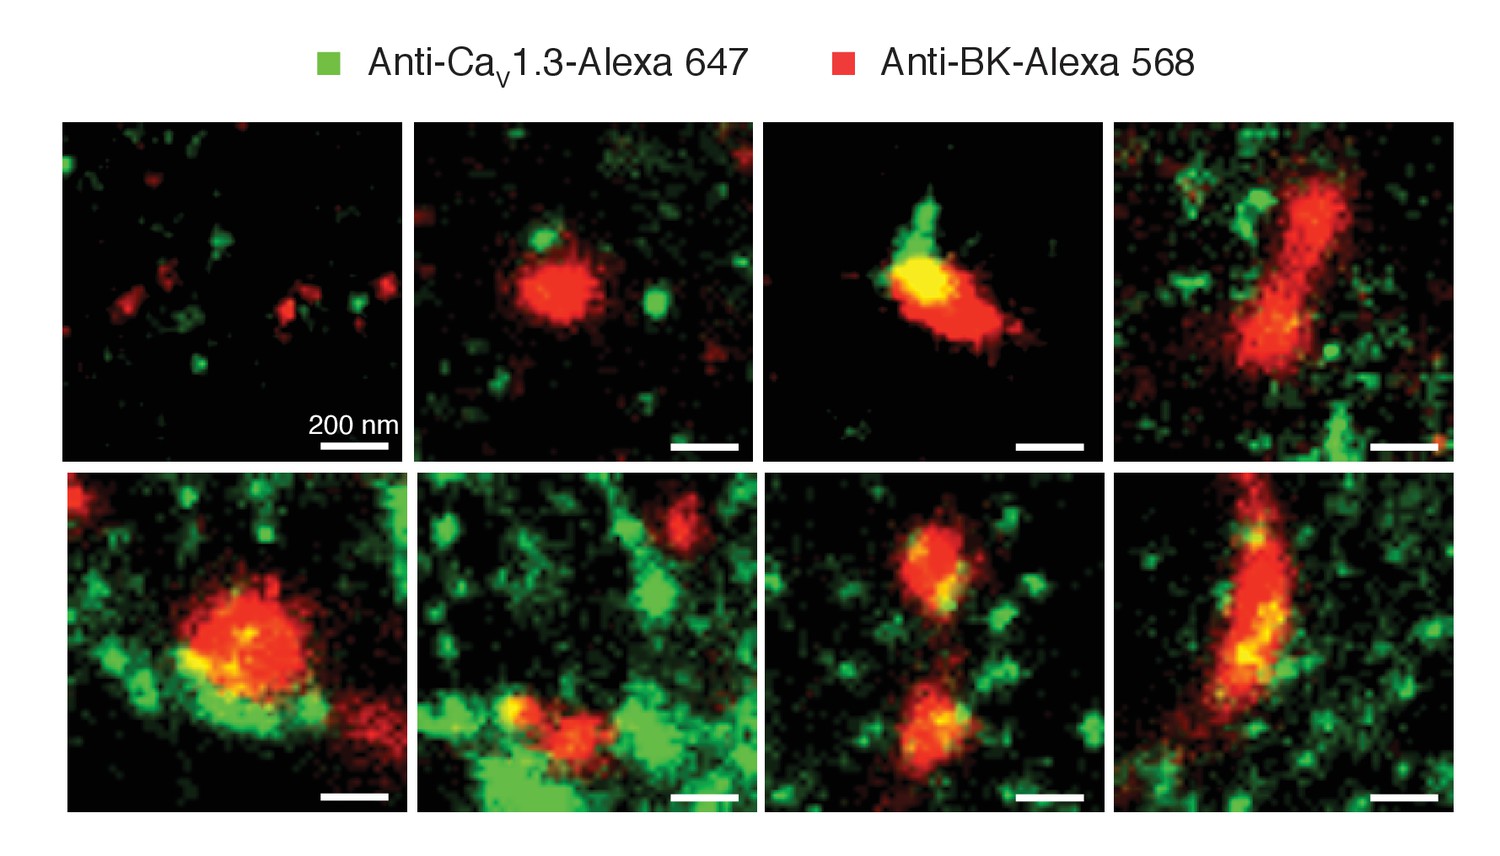
Clustering of BK and CaV1.3 channels is independent of the secondary antibody used.
Representative single-molecule localization maps of BK and CaV1.3 clusters. Note that in this case CaV1.3 antibody was labeled with a secondary antibody conjugated with Alexa-647 (green) and the BK antibody was labeled with a secondary antibody conjugated with Alexa-568 (red). Similar to Figure 5, green pixels denote the presence of CaV1.3 channels while red pixels denote the presence of BK channels.
Figure 5—figure supplement 3

Single-channel activity of L-type calcium channels in sympathetic neurons at low voltage.
(A) Image of a sympathetic neuron (SCG) patched in whole-cell mode with a pipette containing 200 μM Rhod-2 and 10 mM EGTA. (B) Same cell as in (A) but looking at the fluorescence footprint of the cell using TIRF microscopy. (C, D) TIRF images (top) of spontaneous calcium events (sparklets) and time courses (bottom) of calcium concentration in the sites marked by green circles in sympathetic neurons before (C) or after (D) application of 500 nM BayK. Membrane potential was held at −80 mV. Dotted red lines label the amplitude of consecutive quantal levels.
Additional files
-
Source code 1
Custom function to randomize binary particle images written in MATLAB.
- https://doi.org/10.7554/eLife.28029.018
-
Source code 2
Custom software for Ca2+ sparklet detection and analysis written in MATLAB.
- https://doi.org/10.7554/eLife.28029.019
Download links
A two-part list of links to download the article, or parts of the article, in various formats.
Downloads (link to download the article as PDF)
Open citations (links to open the citations from this article in various online reference manager services)
Cite this article (links to download the citations from this article in formats compatible with various reference manager tools)
Proximal clustering between BK and CaV1.3 channels promotes functional coupling and BK channel activation at low voltage
eLife 6:e28029.
https://doi.org/10.7554/eLife.28029


