Promiscuous binding by Hsp70 results in conformational heterogeneity and fuzzy chaperone-substrate ensembles
- The University of Toronto, Canada
- University of Toronto, Canada
- Weizmann Institute of Science, Israel
- Hospital for Sick Children, Program in Molecular Structure and Function, Canada
Figures
Figure 1
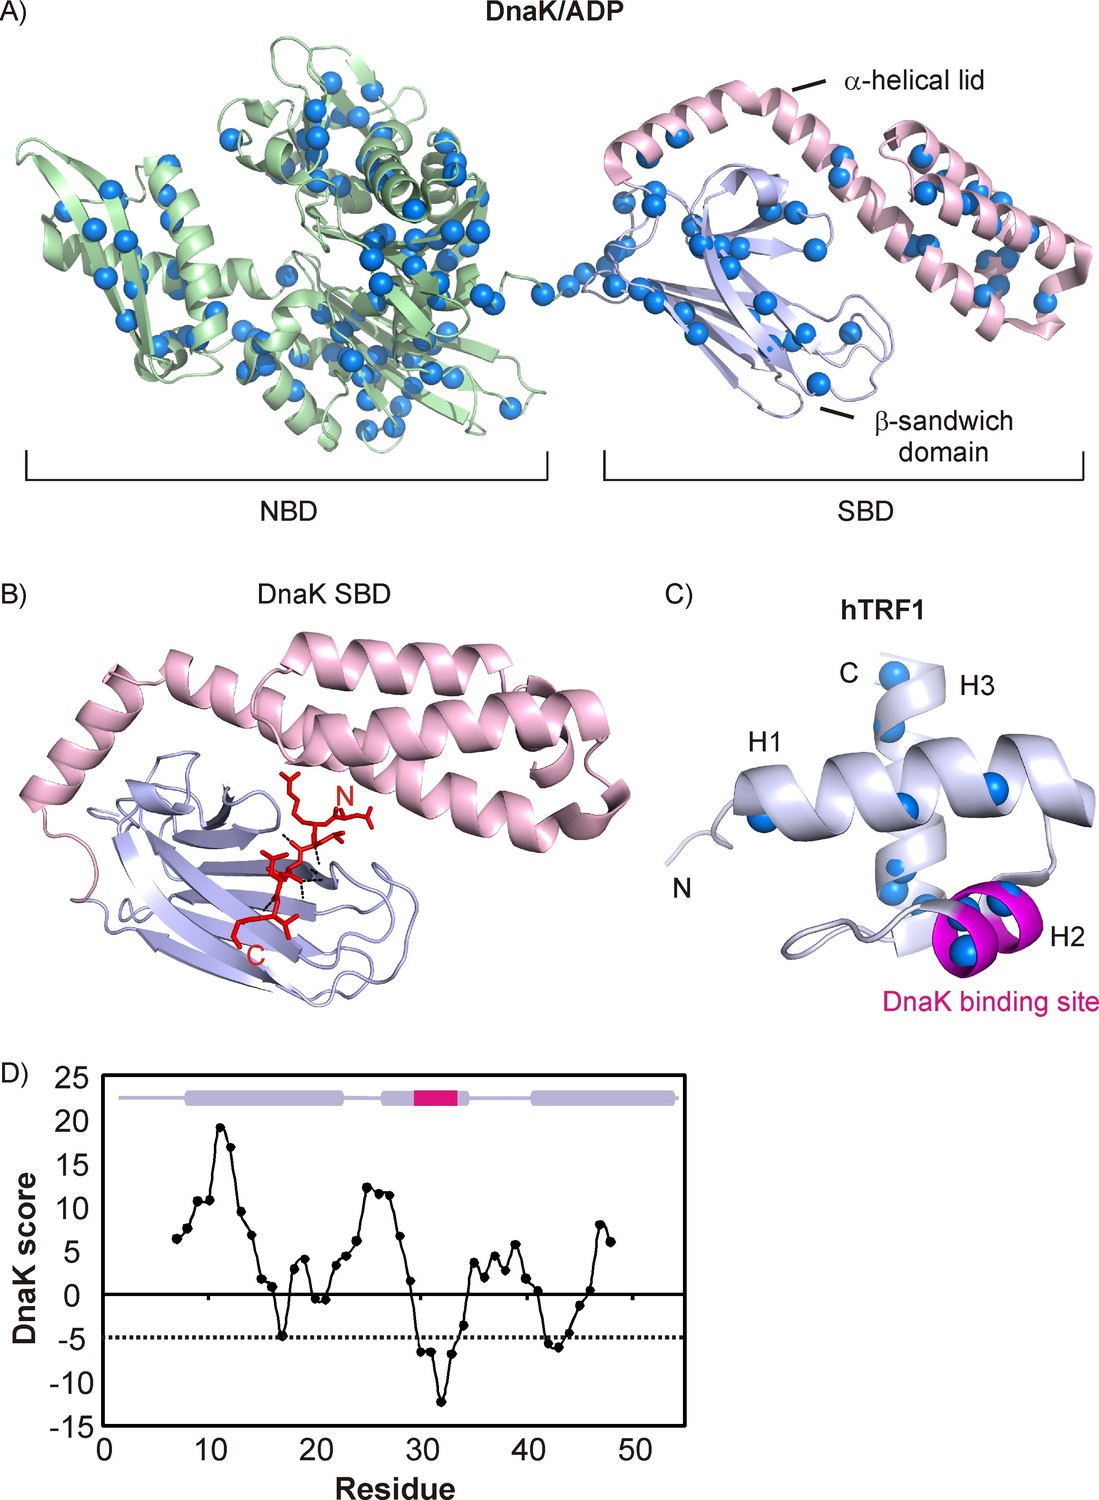
Architecture of DnaK and hTRF1 molecules.
(A) Cartoon representation of DnaK/ADP (PDB ID: 2KHO [Bertelsen et al., 2009]) highlighting the nucleotide binding (green, NBD) and substrate binding (SBD) domains, the latter of which is further subdivided into the β-sandwich domain (steel blue) and the α-helical lid (light pink). The backbone nitrogen atoms of Ile, Leu, Val and Met residues are indicated as blue spheres. (B) Crystal structure of the NRLLLTG peptide in complex with the DnaK SBD (PDB ID: 1DKZ [Zhu et al., 1996]) depicting the extended conformation of the peptide. Hydrogen bonds between the peptide backbone and the β-sandwich domain are shown as black dashed lines. (C) Cartoon representation of the three-helix bundle hTRF1 (PDB ID: 1BA5 [Nishikawa et al., 1998]) showing the strongest DnaK binding site in magenta. The backbone nitrogen atoms of Ile, Leu, Val and Met residues are indicated as blue spheres. (D) The DnaK score for hTRF1 showing the presence of one strong (around Leu 30) and two weak DnaK binding sites (around Val 18 and Val 41). The secondary structure of hTRF1 is indicated on the top of the plot with the strongest DnaK binding site in magenta. A DnaK score of −5 denotes the cutoff for a binding site (Rüdiger et al., 1997) and is drawn as a dashed line.
Figure 2 with 2 supplements
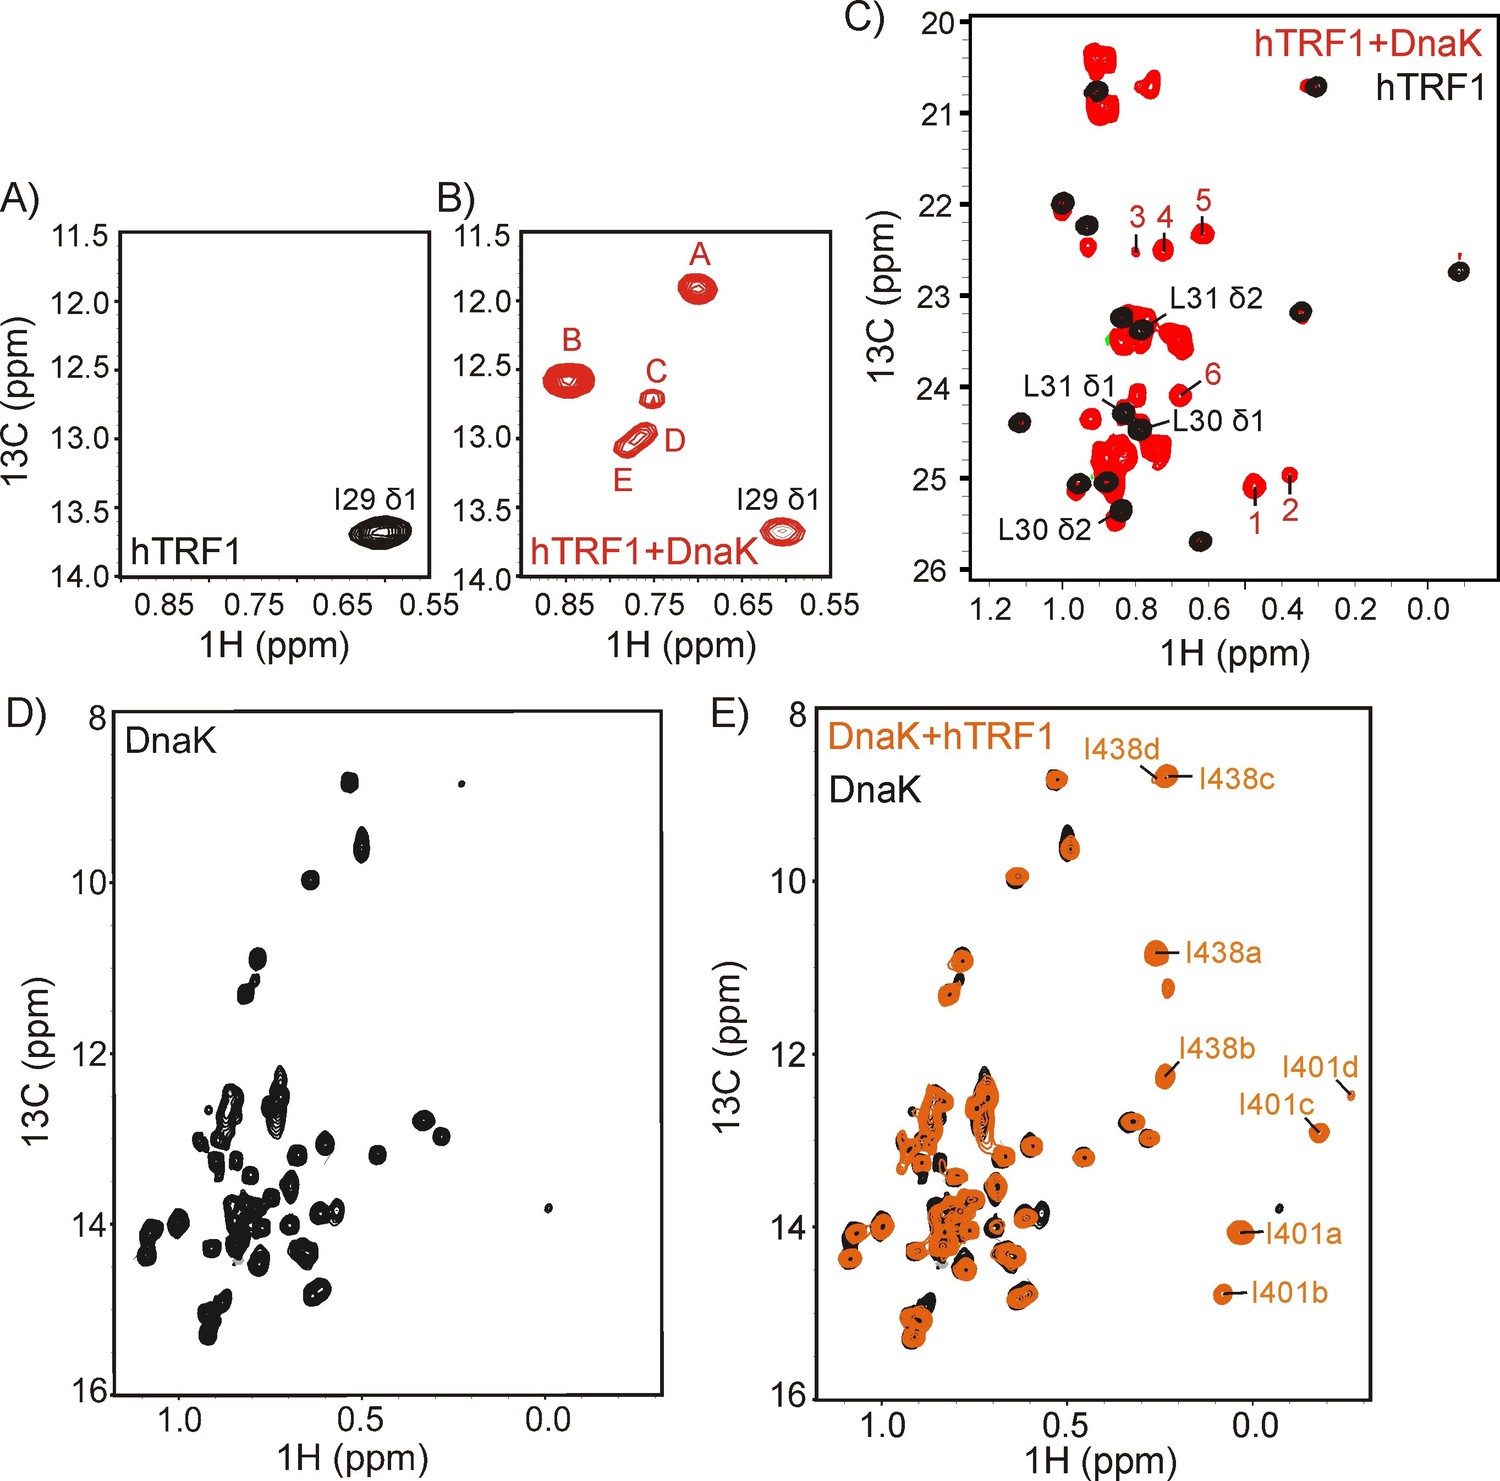
DnaK binds substrate via a multiplicity of interactions.
The Ile region of 1H-13C HMQC spectra of ILVM-13CH3 hTRF1 in the absence (A) and in the presence (B) of two-fold excess U-2H DnaK/ADP. The single Ile 29 peak in the unbound state (A) disperses into multiple resonances in the hTRF1-DnaK bound state, indicating multiple DnaK-bound conformations of hTRF1. These are denoted by the letters A-E. (C) Superposition of the Leu/Val regions of the same spectra shown in panels A and B with peaks arising from binding to DnaK that are outside the random coil region labeled from 1 to 6. (D,E) 1H-13C HMQC spectra of IM-13CH3 DnaK/ADP in the absence (D) and in the presence of two-fold excess U-2H hTRF1 (E) showing multiple peaks arising from Ile 401 and Ile 438 of hTRF1-bound DnaK/ADP and labeled as 'a'-'d' along with the Ile residue from which the peak originates.
Figure 2—figure supplement 1
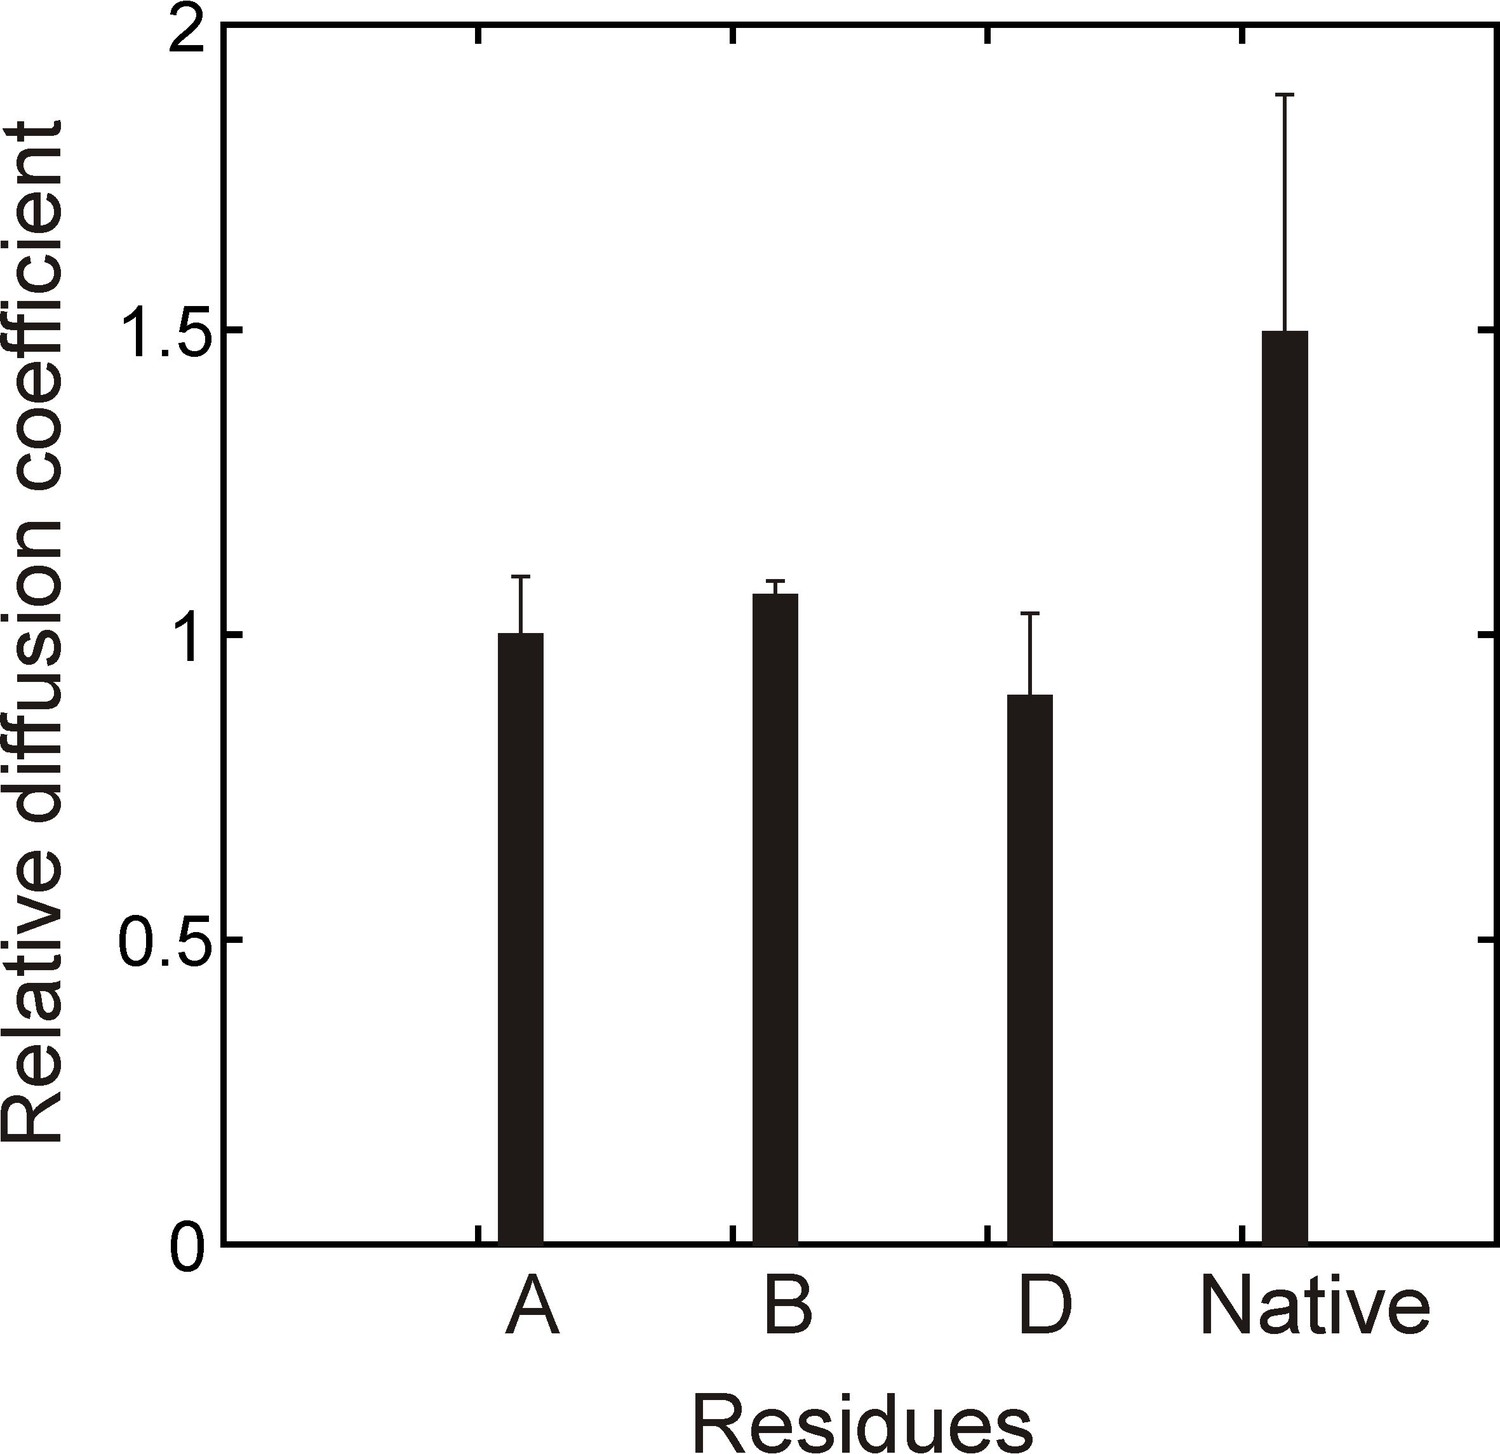
Verifying binding with a PFG diffusion experiment.
Relative diffusion coefficients of DnaK-bound (hTRF1 Ile residues A,B,D, Figure 2B) and native hTRF1 measured using a sample of 0.3 mM ILVM-13CH3 labeled hTRF1 and 0.5 mM U-2H DnaK/ADP and a 2D 1H-13C HMQC-based pulsed field gradient diffusion pulse sequence. Only DnaK-bound hTRF1 peaks that can be reliably quantified are shown in the plot.
Figure 2—figure supplement 2

Multiple conformers are observed upon DnaK binding to hTRF1 peptides.
(A) Superposition of 1H-13C HMQC spectra of IM-13CH3 DnaK/ADP bound to hTRF1 (black) and hTRF123-38 peptide containing the high affinity DnaK binding region (red, left) or hTRF134-49 peptide that comprises one of the lower affinity sites (red, right) showing that a subset of the multiple states are retained with each peptide. (B) Multiple conformations of the DnaK-hTRF1 complex are observed in both ADP- (red) and ATP- (blue) states, as established by 1H-13C HMQC spectra of methyl labeled hTRF1 focusing on either Ile (left) or Leu/Val spectral regions (right). * indicates the position of artifacts due to incomplete refocusing of the one-bond 1H-13C scalar coupled evolution during t1 of the HMQC pulse scheme.
Figure 3
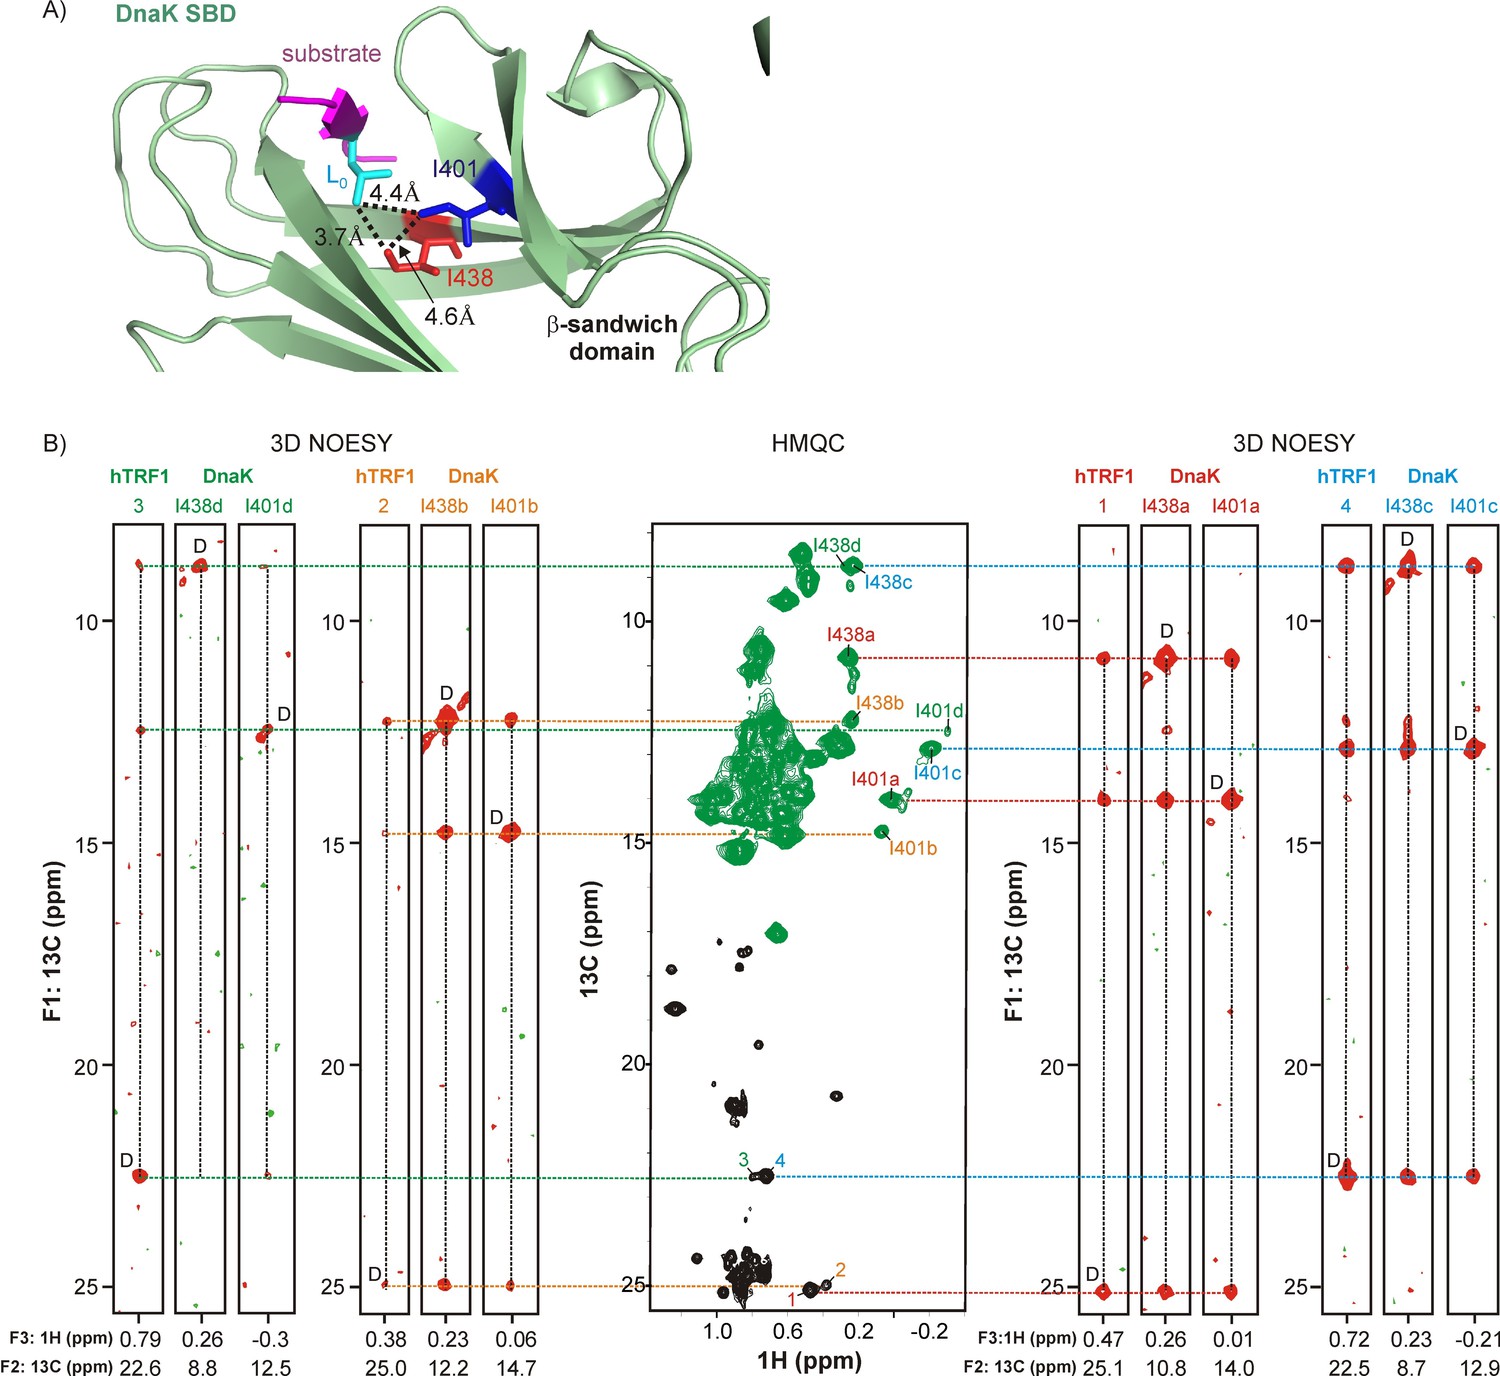
Linking multiple resonances and hence conformers of DnaK and hTRF1.
(A) Zoomed region of the crystal structure of a DnaK-NRLLLTG peptide complex (PDB ID: 1DKZ [Zhu et al., 1996]) highlighting interactions between sidechains of the peptide (magenta) bound to the substrate binding domain (SBD) of DnaK (green). Key hydrophobic sidechains lining the central cavity of the DnaK binding pocket, Ile 401 and Ile 438, are shown as sticks and coloured blue and red respectively. The Leu residue in the substrate occupying this central cavity (Lo) and forming hydrophobic interactions involving Ile 401 and Ile 438 is shown in cyan. Distances between the key residues in the binding cavity are denoted on the plot. (B) (middle) 1H-13C HMQC spectrum of 0.7 mM Iγ-proR-LV-13CH3 labeled hTRF1 bound to 1.8 mM IM-13CH3 labeled DnaK/ADP. Resonances in the HMQC spectrum arising from hTRF1 are coloured black, while peaks from DnaK are in green. Peaks are identified as in Figure 2. The HMQC dataset is flanked by four sets of F1-F3 strips from a 3D methyl NOESY spectrum with correlations of the form (13Cj-NOE-13Ck-1Hk). The first set of strips link hTRF1 conformation 3 with DnaK conformation d, the second set link hTRF1 and DnaK conformations 2 and b and so forth. The letter 'D' is used to identify the diagonal peak in each plot. The F2 13C chemical shift is indicated at the bottom of each strip.
Figure 4 with 3 supplements
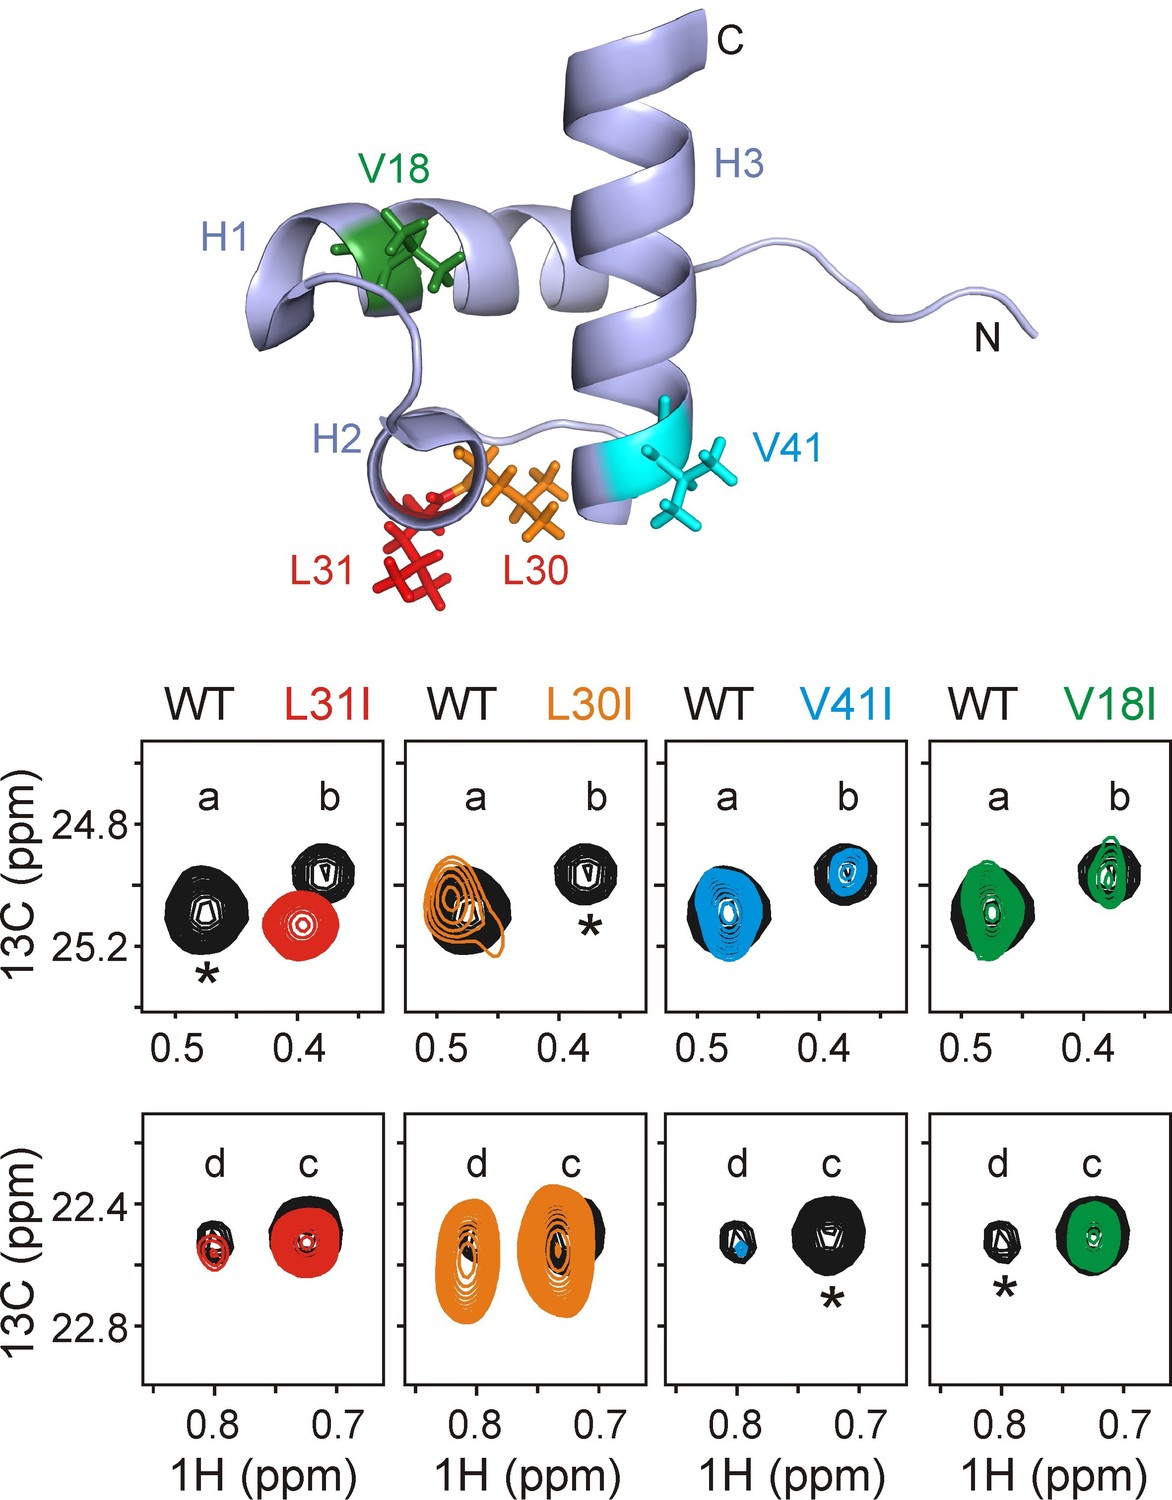
Assigning residues of hTRF1 at the central position of the DnaK binding cleft.
Selected regions of 1H-13C HMQC spectra of wild-type ILVM-13CH3 hTRF1 bound to U-2H DnaK/ADP (black), overlaid with ILVM-13CH3 labeled L31I (red), L30I (orange), V41I (cyan) and V18I (green) hTRF1 bound to U-2H DnaK/ADP. The locations of the four mutations are indicated in the appropriate colour on the structure of native hTRF1 (PDB ID: 1BA5, [Nishikawa et al., 1998]) at the top of the figure. The four hTRF1 resonances arising from methyl containing residues at the 0 position of the DnaK binding cavity identified from the 3D NOESY (Figure 3) are indicated by letters 'a'-'d'. These four peaks, all assigned to the proR 13CH3 group from proR labeling experiments (see text), are highlighted for each mutant considered. One among these four resonances in each column, denoted by an asterisk, disappears in the mutant spectrum thus leading to the assignment of peaks a-d to specific methyl groups in hTRF1.
Figure 4—figure supplement 1
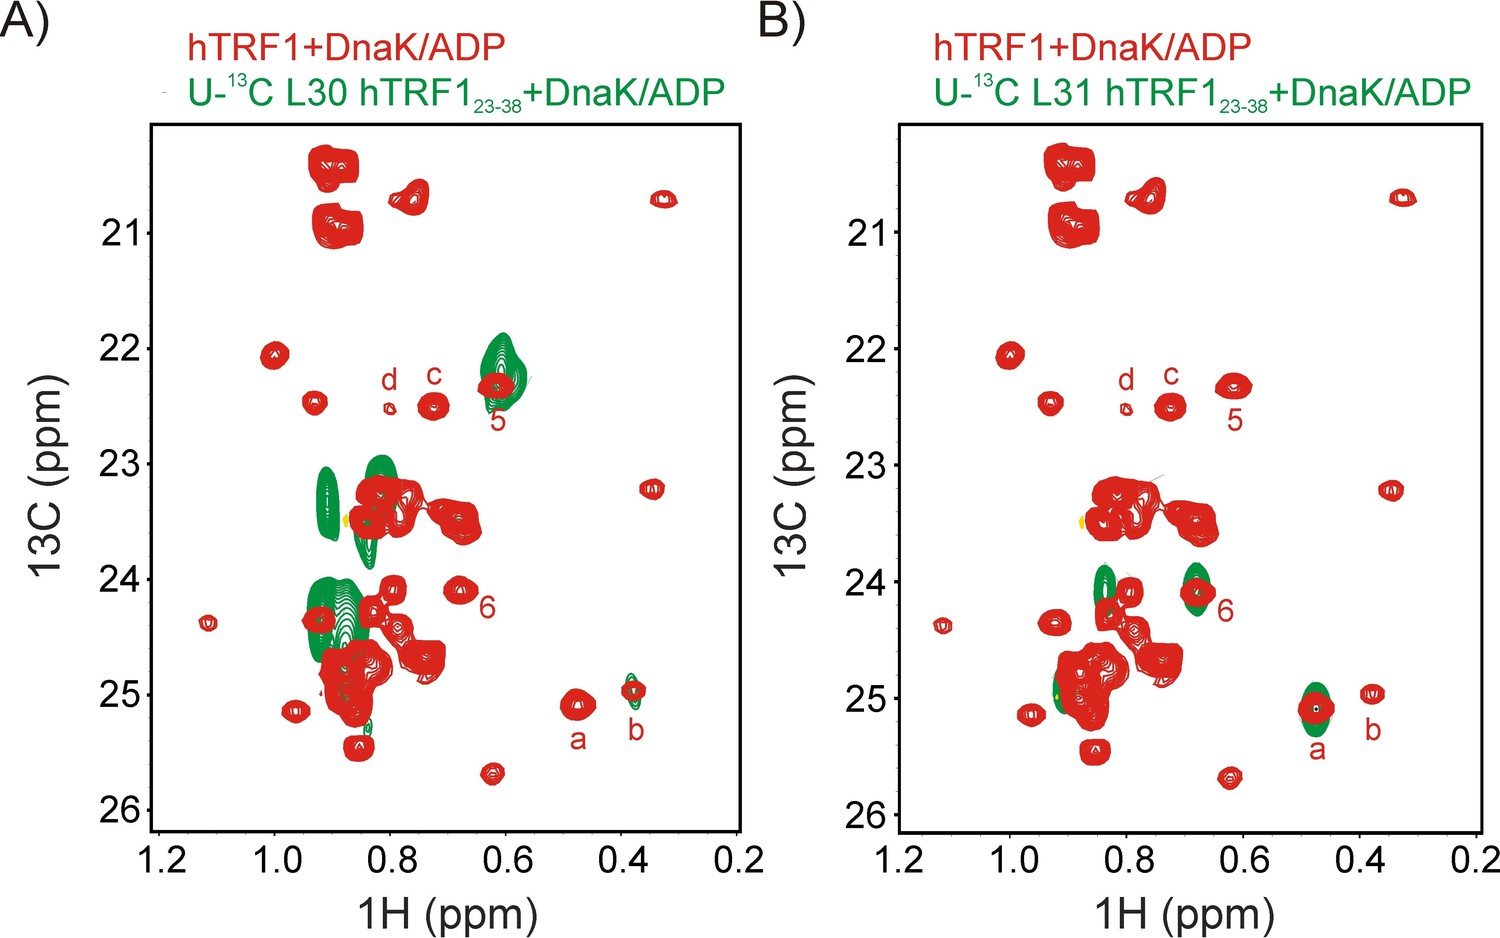
Assigning states 'a' and 'b' to L31 and L30 respectively.
Superposition of selected regions of 1H-13C HMQC spectra of ILVM-13CH3 hTRF1 bound to U-2H DnaK/ADP (red) and (A) U-13C L30 hTRF123-38 or (B) U-13C L31 hTRF123-38 bound to U-2H DnaK/ADP (green). Note that for both peptides only the single L30 or L31 is 13C labeled. These datasets establish that peaks labeled 5 (6) and b(a) derive from the proS and proR methyl groups of L30(L31). Note that the proR methyls of L30 and L31 were assigned using proR selectively labeled samples (Figure 3, linking 1 (L31) and 2 (L30) in Figure 2C with conformations 'a' and 'b', respectively).
Figure 4—figure supplement 2
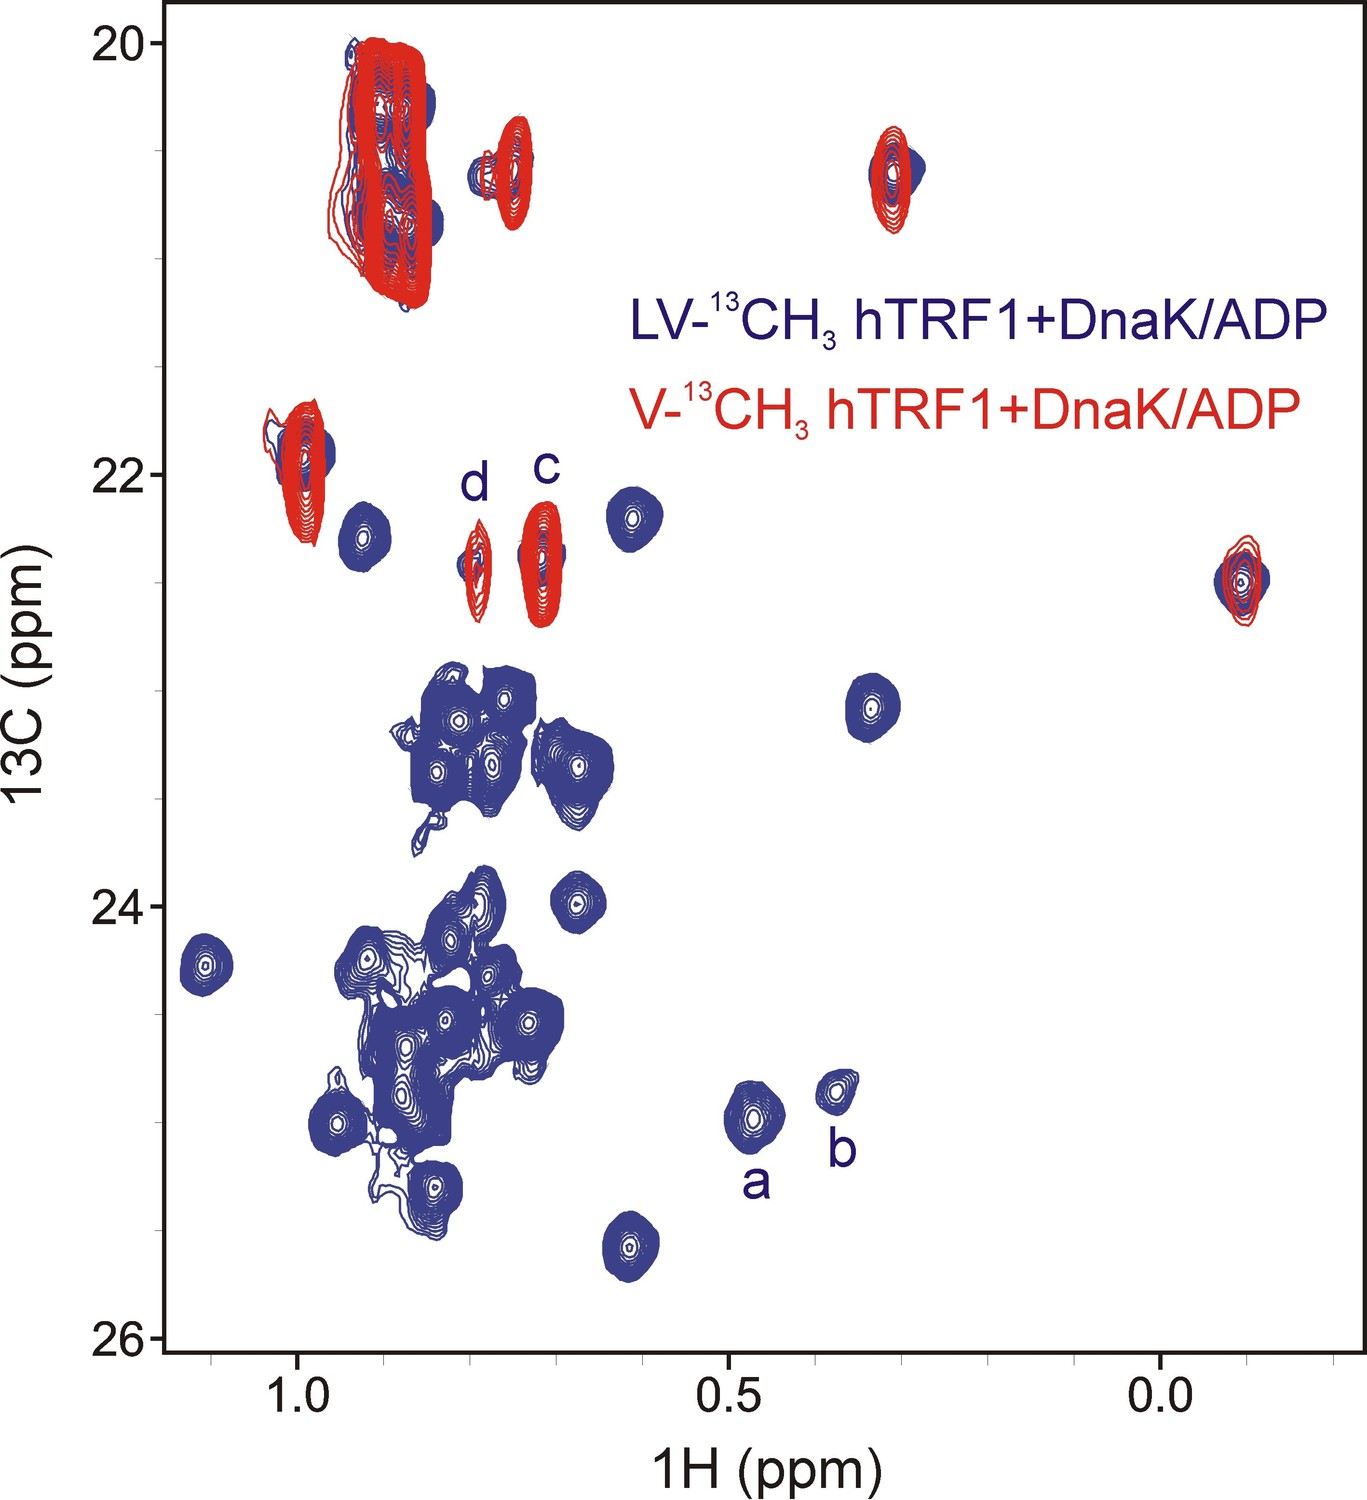
Assigning states 'c' and 'd' to Val residues of hTRF1 present at the 0 position of the DnaK binding cleft.
Overlay of selected regions from 1H-13C HMQC spectra of LV-13CH3 hTRF1 (blue) and V-13CH3 hTRF1 (red) bound to DnaK/ADP showing that peaks d and c derive from Val residues.
Figure 4—figure supplement 3

Additional unassigned DnaK-hTRF1 conformations.
Overlay of HMQC spectra of unlabeled hTRF134-49 bound to IM-13CH3 DnaK/ADP (blue) and Iγ-proR-LV-13CH3 labeled hTRF1 bound to IM-13CH3 labeled DnaK/ADP (red). Unassigned Ile 401 and Ile 438 peaks of DnaK present in both spectra are indicated by † and * respectively, while assignments for Ile 401 and 438 'a' - 'd' for the red spectrum are shown for reference.
Figure 5 with 2 supplements
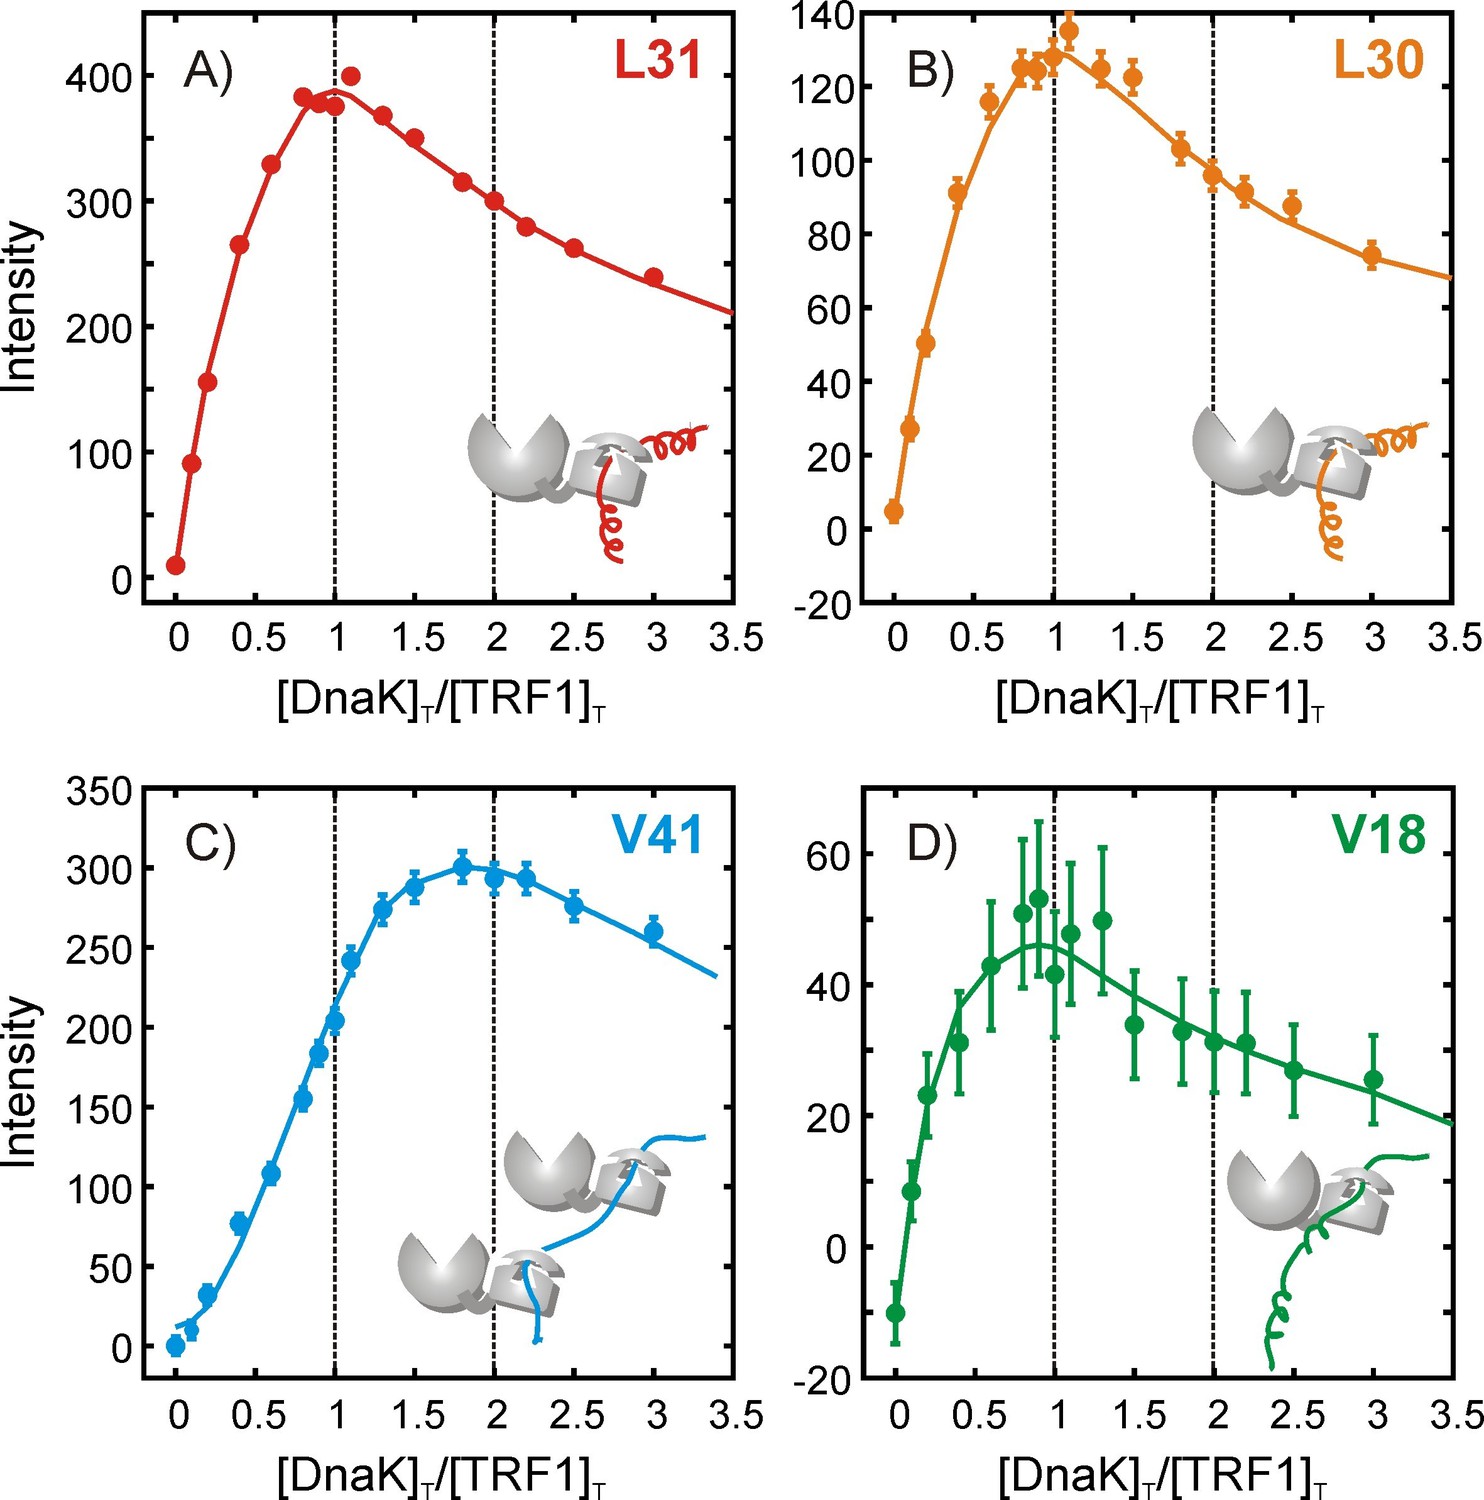
Quantifying the stoichiometry of hTRF1 binding to DnaK.
Peak intensities from an NMR titration focusing on the four hTRF1 residues Leu 30, Leu 31, Val 18 and Val 41 that occupy the central position of the DnaK binding cavity in different DnaK-bound conformations; (A) L31, (B) L30, (C) V41 and (D) V18. The ratio of the total concentrations of DnaK and hTRF1 at each titration point is plotted along the x-axis. Solid lines have been drawn to guide the eye and do not have physical significance.
Figure 5—figure supplement 1

Simulating multiple binding equilibria for quantifying stoichiometry.
Simulated profiles reporting the concentrations of different components formed during the course of a titration as a function of the ratio of [KT]/ [NT]. For the specific case analyzed here, [KT] = [DnaK]T and [NT] = [hTRF1]T (see Materials and Methods), where [DnaK]T and [hTRF1]T are the concentrations of all DnaK and hTRF1 species in solution, respectively. Two models are considered, as described in ‘Simulating NMR titration profiles’. A number of Kd1 and Kd2 values are considered and values for [DnaK]T/[hTRF1]T match those used in the experiments. Note that for each titration point a fixed volume is removed before adding an equivalent volume of a stock solution of DnaK. In this manner the total solution volume remains fixed but the total concentration of hTRF1 ([N]T) decreases (for example, in the Linear Model, [N]T = [N]+[U]+[UK]+[UK2], where N and U denote native and unfolded conformers, respectively and UKj, j ∈ (1,2), is the complex between the assumed binding competent hTRF1 state, U, and j molecules of DnaK). These simulations establish that the population of species UK (Linear Model) or UKA,UKB (Square Model) maximizes at a [DnaK]T/[hTRF1]T ratio ~1:1, while the population of UK2 (Linear Model) or UKAB (Square Model) is maximal at a ratio of ~1:2 for a range of Kd1 and Kd2 values in the strong binding regime even when 1:1 and 1:2 complexes are simultaneously present. It is worth noting that if another complex UK' with 1:1 stoichiometry is also present it will necessarily have the same titration profile as UK scaled by a constant that is related to the dissociation constants of the UK and UK' species, since . Consequently, the existence of two different titration profiles, one maximizing at a [DnaK]T/[hTRF1]T value of 1 and the other at 2, demonstrates the existence of at least two different stoichiometries of DnaK-hTRF1 complexes. The simulated data above strongly suggest that the experimental titration profiles maximizing at 1 report on complexes with 1:1 stoichiometry and the ones maximizing at 1:2 report on complexes with a 1:2 stoichiometry.
Figure 5—figure supplement 2
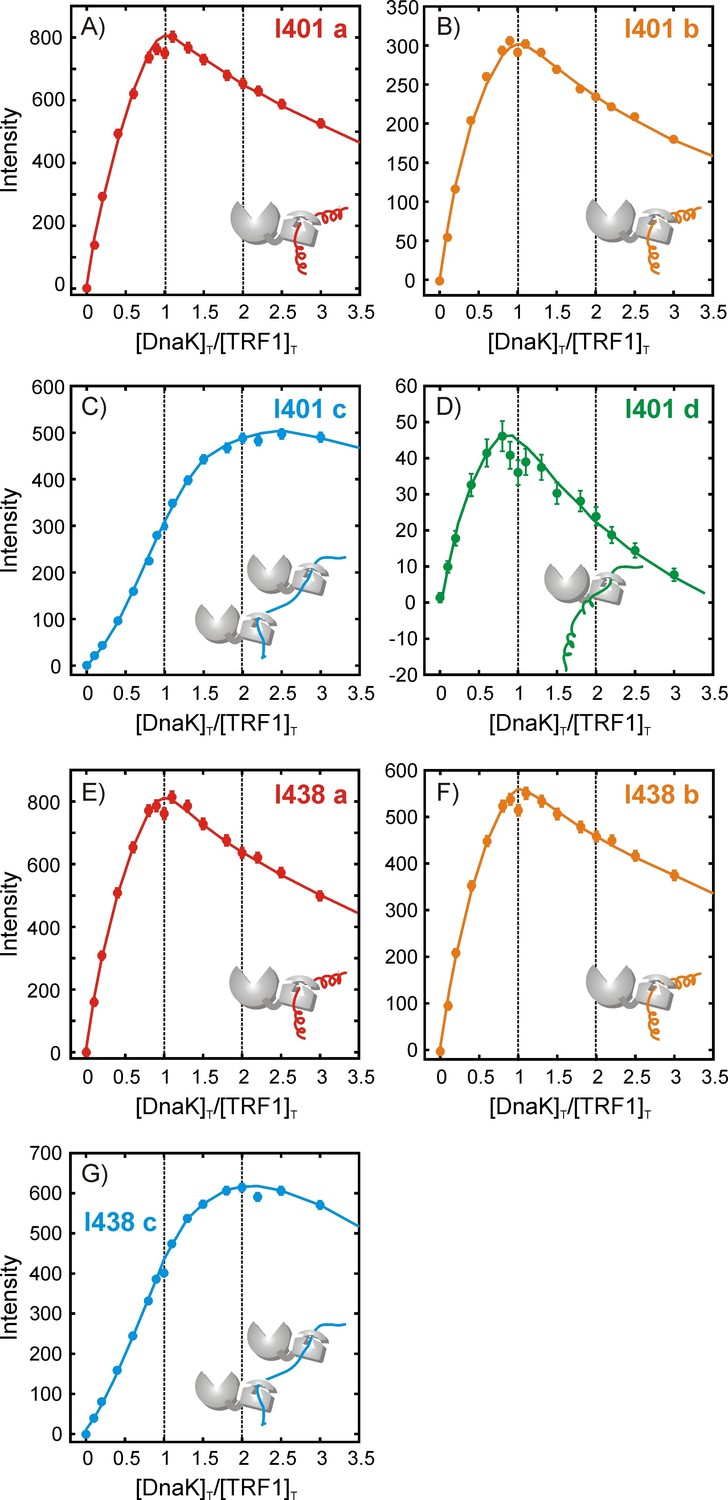
Quantifying the stoichiometry of hTRF1 binding to DnaK.
Experimental peak intensity profiles measured as a function of the ratio of [DnaK]T/[hTRF1]T, where [DnaK]T and [hTRF1]T are the concentrations of all DnaK and hTRF1 species in solution, respectively. For each titration point a fixed volume is removed before adding an equivalent volume of DnaK so that the total solution volume remains fixed. Profiles are shown for Ile 401 (A–D) and Ile 438 (E–G) that report on the various hTRF1-bound conformations of DnaK/ADP. The peak corresponding to Ile 438 state 'd' is weak and overlapped and cannot be reliably quantified. Solid lines have been drawn to guide the eye and do not have physical significance.
Figure 6

Both human Hsc70 and E.coli DnaK interact with hTRF1 at multiple sites.
Overlay of a 1H-13C HMQC spectrum of 200 μM ILVM-13CH3 hTRF1 containing a two-fold excess of U-2H Hsc70/ADP (red) with the spectrum of (A) free ILVM-13CH3 hTRF1 (black) and (B) ILVM-13CH3 hTRF1 bound to U-2H DnaK/ADP (blue). Four peaks are observed for the lone Ile 29 of hTRF1 bound to Hsc70, demonstrating that multiple conformations of the chaperone-substrate complex are formed with both E.coli Hsp70 (DnaK) and its human ortholog (Hsc70).
Figure 7 with 1 supplement
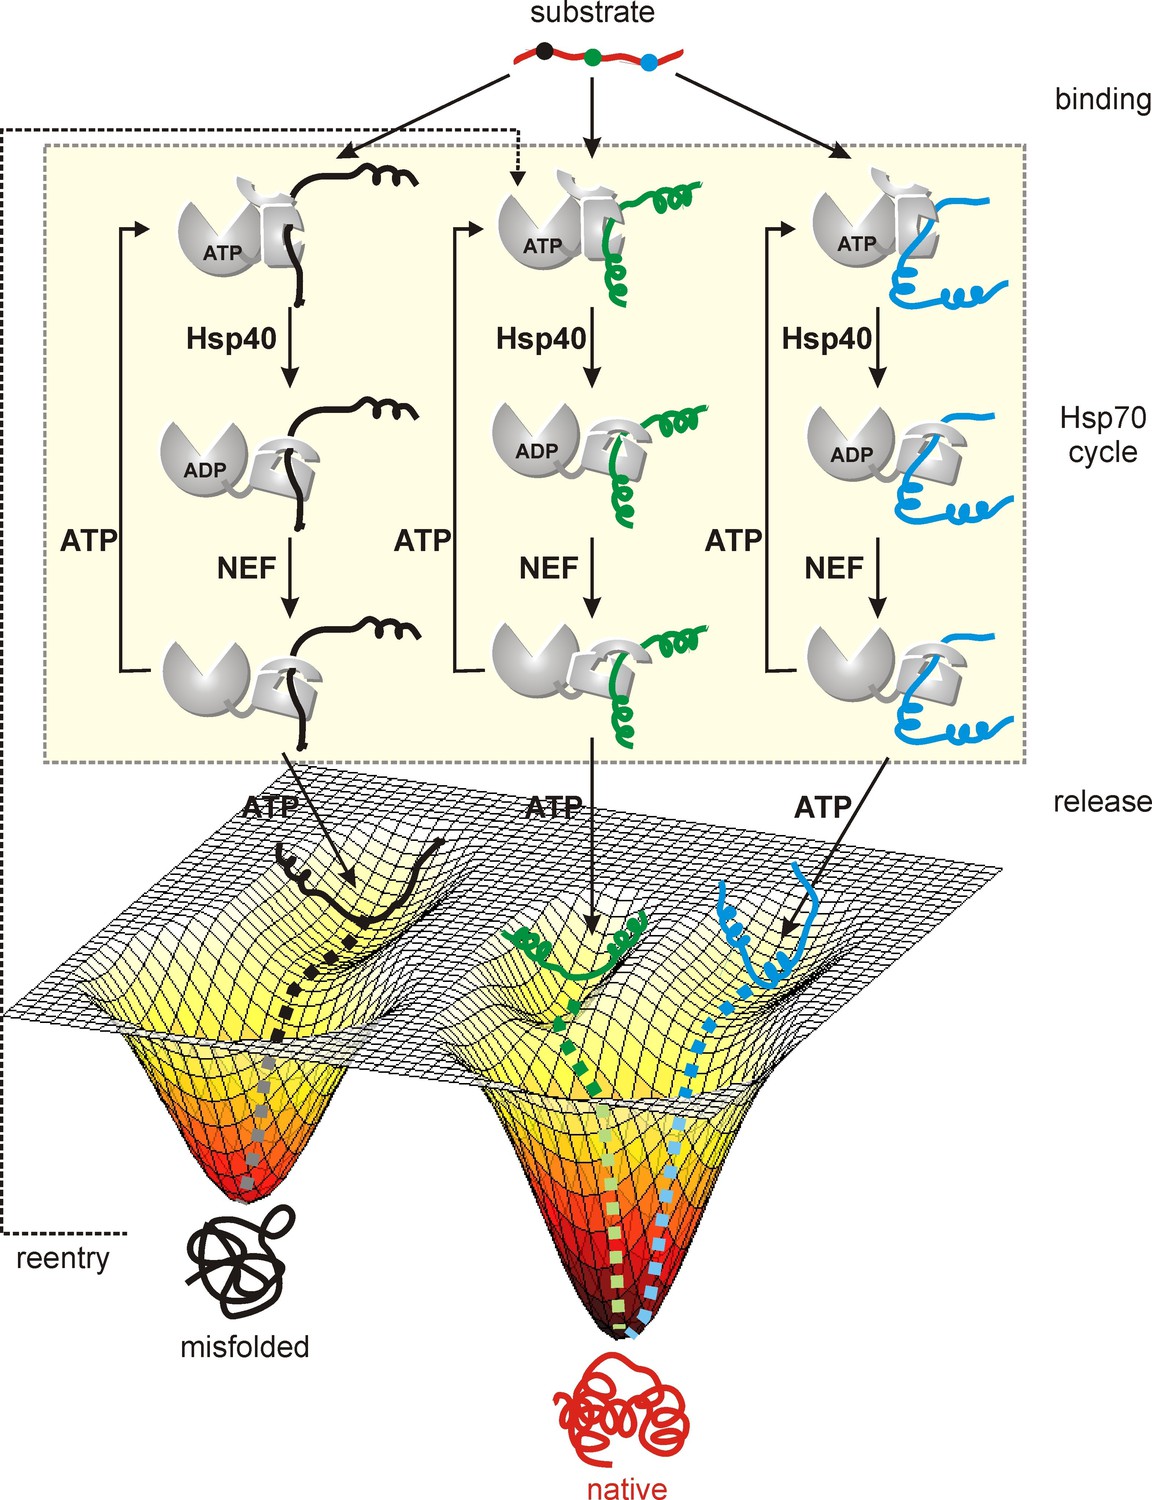
Model of a substrate with three Hsp70 binding sites (indicated in different colors) forming three distinct Hsp70 bound sub-ensembles.
By increasing the number of interaction sites a larger region of conformational space can be explored from which folding of the substrate occurs upon release from the chaperone. Proteins stuck in kinetic traps can enter the cycle again with Hsp70 binding to different sites increasing the probability of proper folding.
Figure 7—figure supplement 1
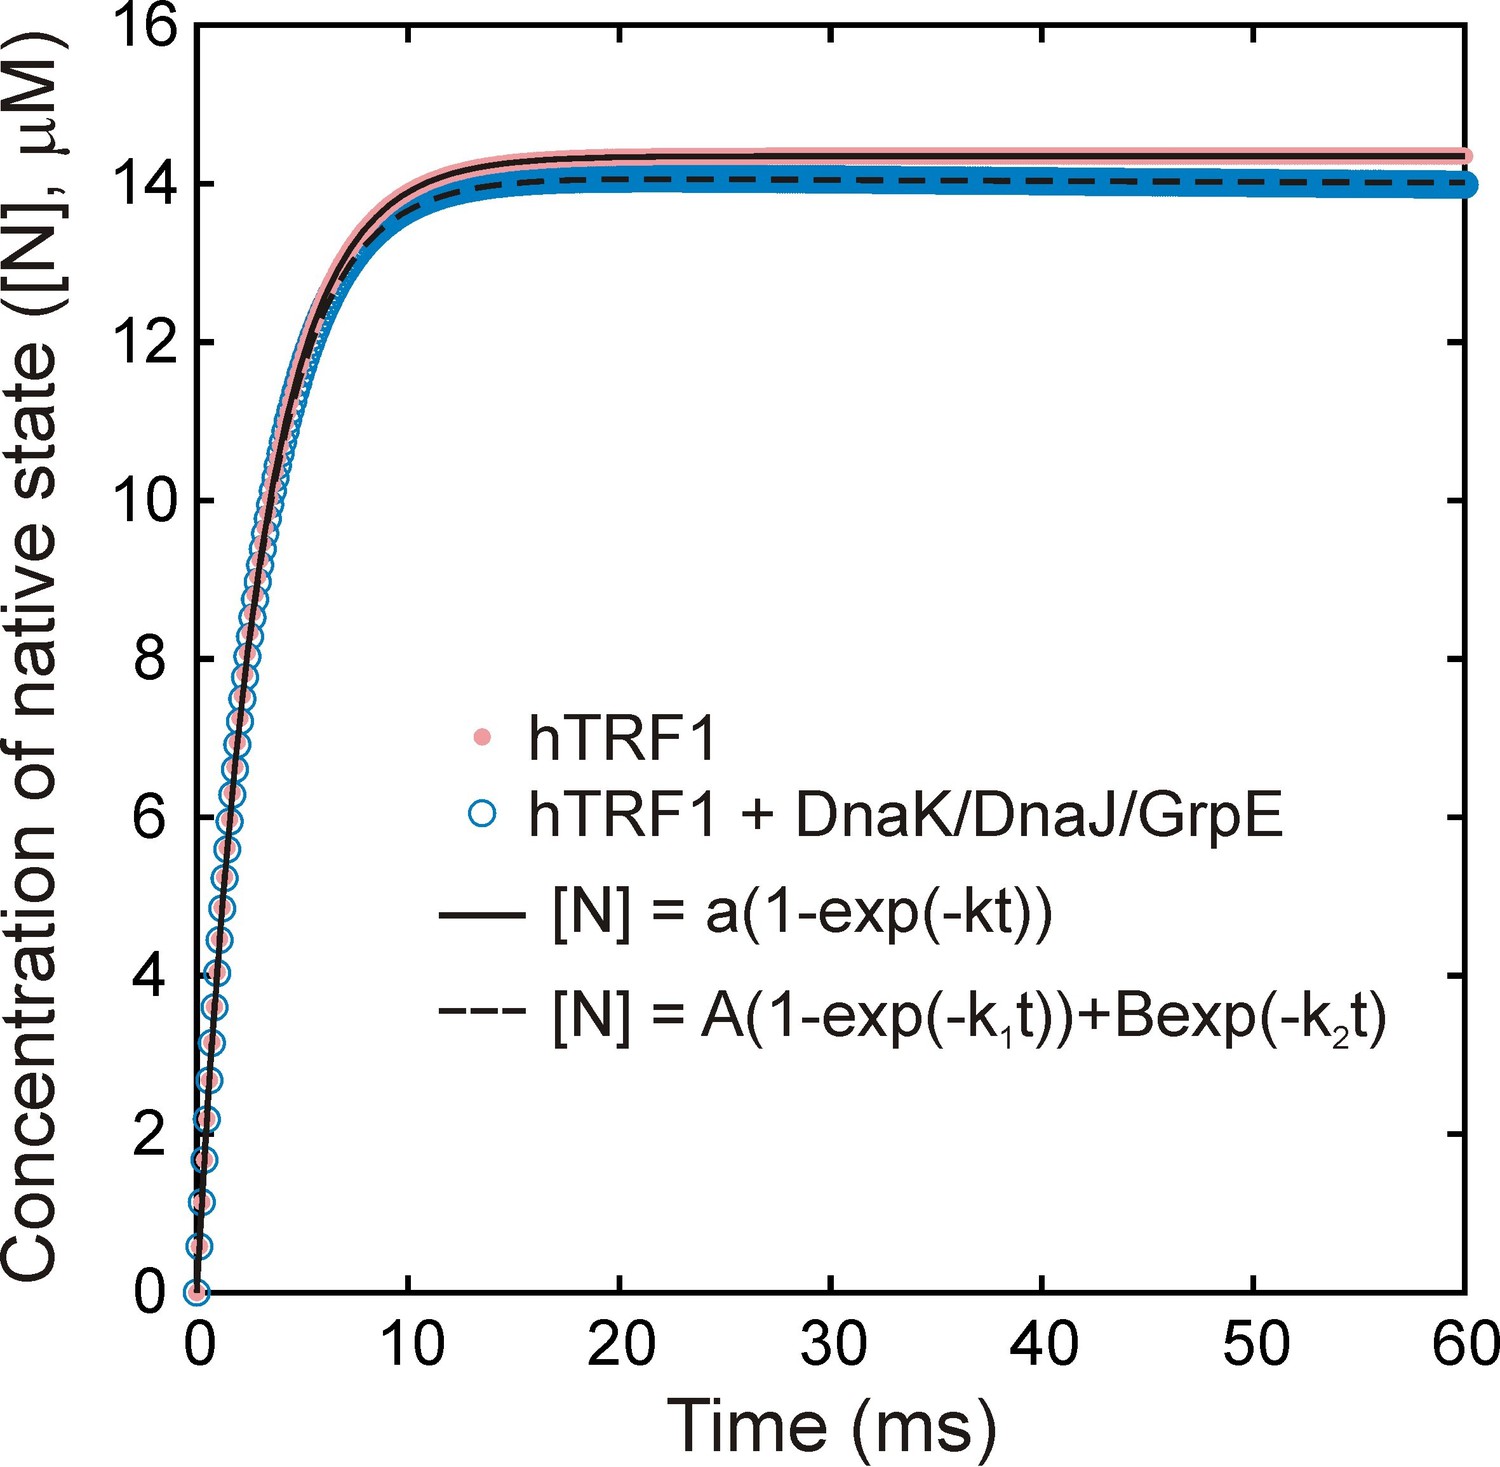
Folding of hTRF1 without and with DnaK/DnaJ/GrpE (K/J/E).
Simulated curves showing the time-dependent formation of native hTRF1 starting from the unfolded state in the absence (pink) and presence (blue) of the E.coli Hsp70 chaperone system (K/J/E). Simulations were carried out using a previously published kinetic model of protein folding in the presence of K/J/E (Sekhar et al., 2012b). 15 μM of hTRF1 was folded without or with 25 μM DnaK, 5 μM DnaJ and 10 μM GrpE, where the chaperone system without hTRF1 was pre-equilibrated for a sufficient time to ensure that all molecular species reached steady-state concentrations. The concentration of ATP was fixed at all times to be 2 mM. Curves were fit to single (- K/J/E, solid black line) or bi-exponential (+ K/J/E (dashed black line)) models to extract rate constants of folding without and with K/J/E of 345 and 347 s−1, respectively. These values are virtually identical, showing that interaction with K/J/E does not significantly slow down the folding of the fast-folding protein hTRF1.
Tables
Table 1
Percentages of Trans and Gauche- Ile 401 and Ile 438 Conformations*.
| a (Leu 31) | b (Leu 30) | c (Val 41) | d (Val 18) | |||||
|---|---|---|---|---|---|---|---|---|
| Ile 401 | Ile 438 | Ile 401 | Ile 438 | Ile 401 | Ile 438 | Ile 401 | Ile 438 | |
| Trans | 0.86 | 0.28 | 0.99 | 0.54 | 0.66 | 0.00 | 0.58 | 0.00 |
| Gauche- | 0.14 | 0.72 | 0.01 | 0.46 | 0.34 | 1.00 | 0.42 | 1.00 |
-
*Fractional Trans and Gauche- conformations calculated from Ile 13Cδ1 chemical shifts according to Hansen et al. (2010) for conformers 'a'-'d'. The identities of hTRF1 residues at the 0 position are noted.
Download links
A two-part list of links to download the article, or parts of the article, in various formats.
Downloads (link to download the article as PDF)
Open citations (links to open the citations from this article in various online reference manager services)
Cite this article (links to download the citations from this article in formats compatible with various reference manager tools)
Promiscuous binding by Hsp70 results in conformational heterogeneity and fuzzy chaperone-substrate ensembles
eLife 6:e28030.
https://doi.org/10.7554/eLife.28030


