Dynamic modulation of activity in cerebellar nuclei neurons during pavlovian eyeblink conditioning in mice
- Erasmus Medical Center, Netherlands
- Baylor College of Medicine, United States
- Netherlands Institute for Neuroscience, Royal Academy of Arts and Sciences (KNAW), Netherlands
Figures
Figure 1 with 1 supplement
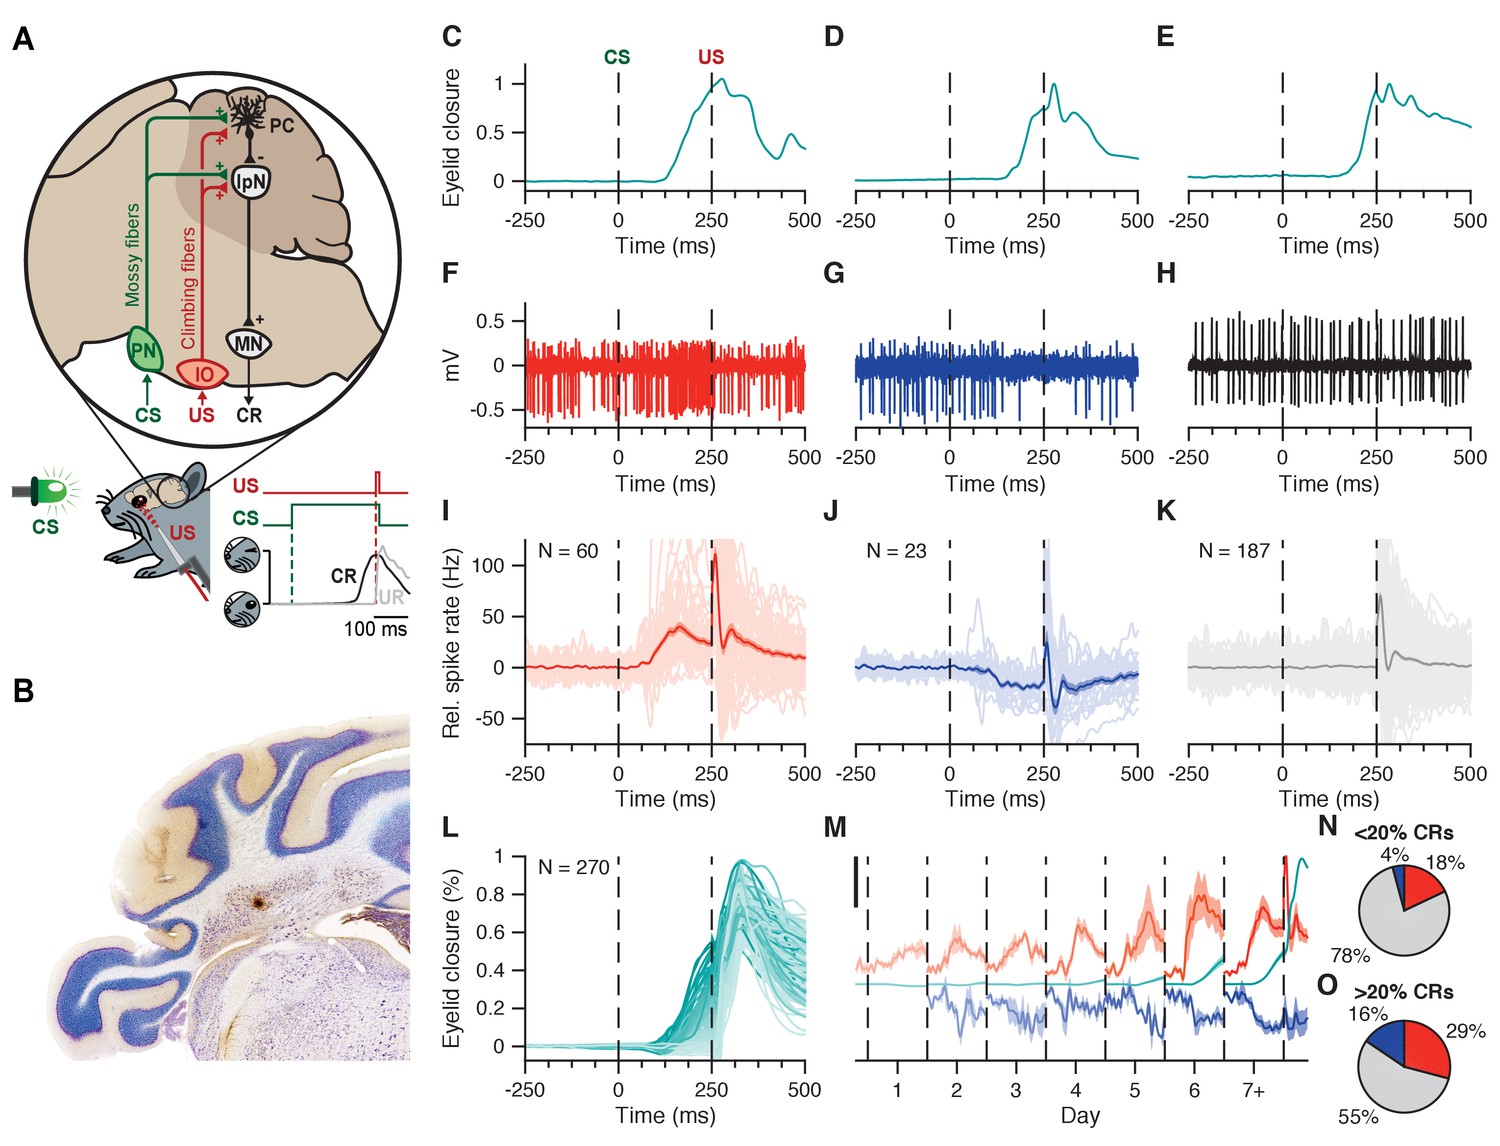
Interpositus nucleus electrophysiology overview.
(A) CS and US signals are transmitted through mossy fibers and climbing fibers, respectively, to Purkinje cells in the simplex lobule (HVI) of the cerebellar cortex, and to the IpN, to which cortical Purkinje cells send their inhibitory projection. Combined disinhibition and excitation then lead the IpN to drive CRs. Paired trials consisted of a 260 ms LED light CS, co-terminating with a 10 ms corneal air puff. (B) Coronal cerebellar section showing a typical recording site in the IpN. C-E Example eyelid traces for trials where the recorded cell showed spike facilitation (C), suppression (D), or no modulation (E) in the CS-US interval. (F-H) Electrophysiological trace showing IpN activity corresponding to the example eyelid traces in (C-E). (I) Spike trace averages for 60 cells from the first dataset showing at least 5 Hz facilitation in the CS-US interval; grand average is shown with SEM. (J) Same as in I, but for 23 suppressive cells. (K) Same as in I, but for 187 non-modulating cells. (L) Average traces of eyelid behavior for all 270 cells in the first dataset, color coded for average CR amplitude at US onset. (M) Daily CS-US interval averages of facilitatory cells (top traces, orange), suppressive cells (bottom traces, blue), and eyelid behavior for all cells showing modulation (middle traces, teal). Black scale bar denotes 25 Hz/% eyelid closure. (N, O) Proportion of cells showing facilitation, suppression, or no modulation, across cells with <20% CRs (n = 167), and cells with >20% CRs (n = 103). IpN: interpositus nucleus; IO: inferior olive; MN: motor nucleus; PC: Purkinje cell; PN: pontine nuclei.
Figure 1—figure supplement 1
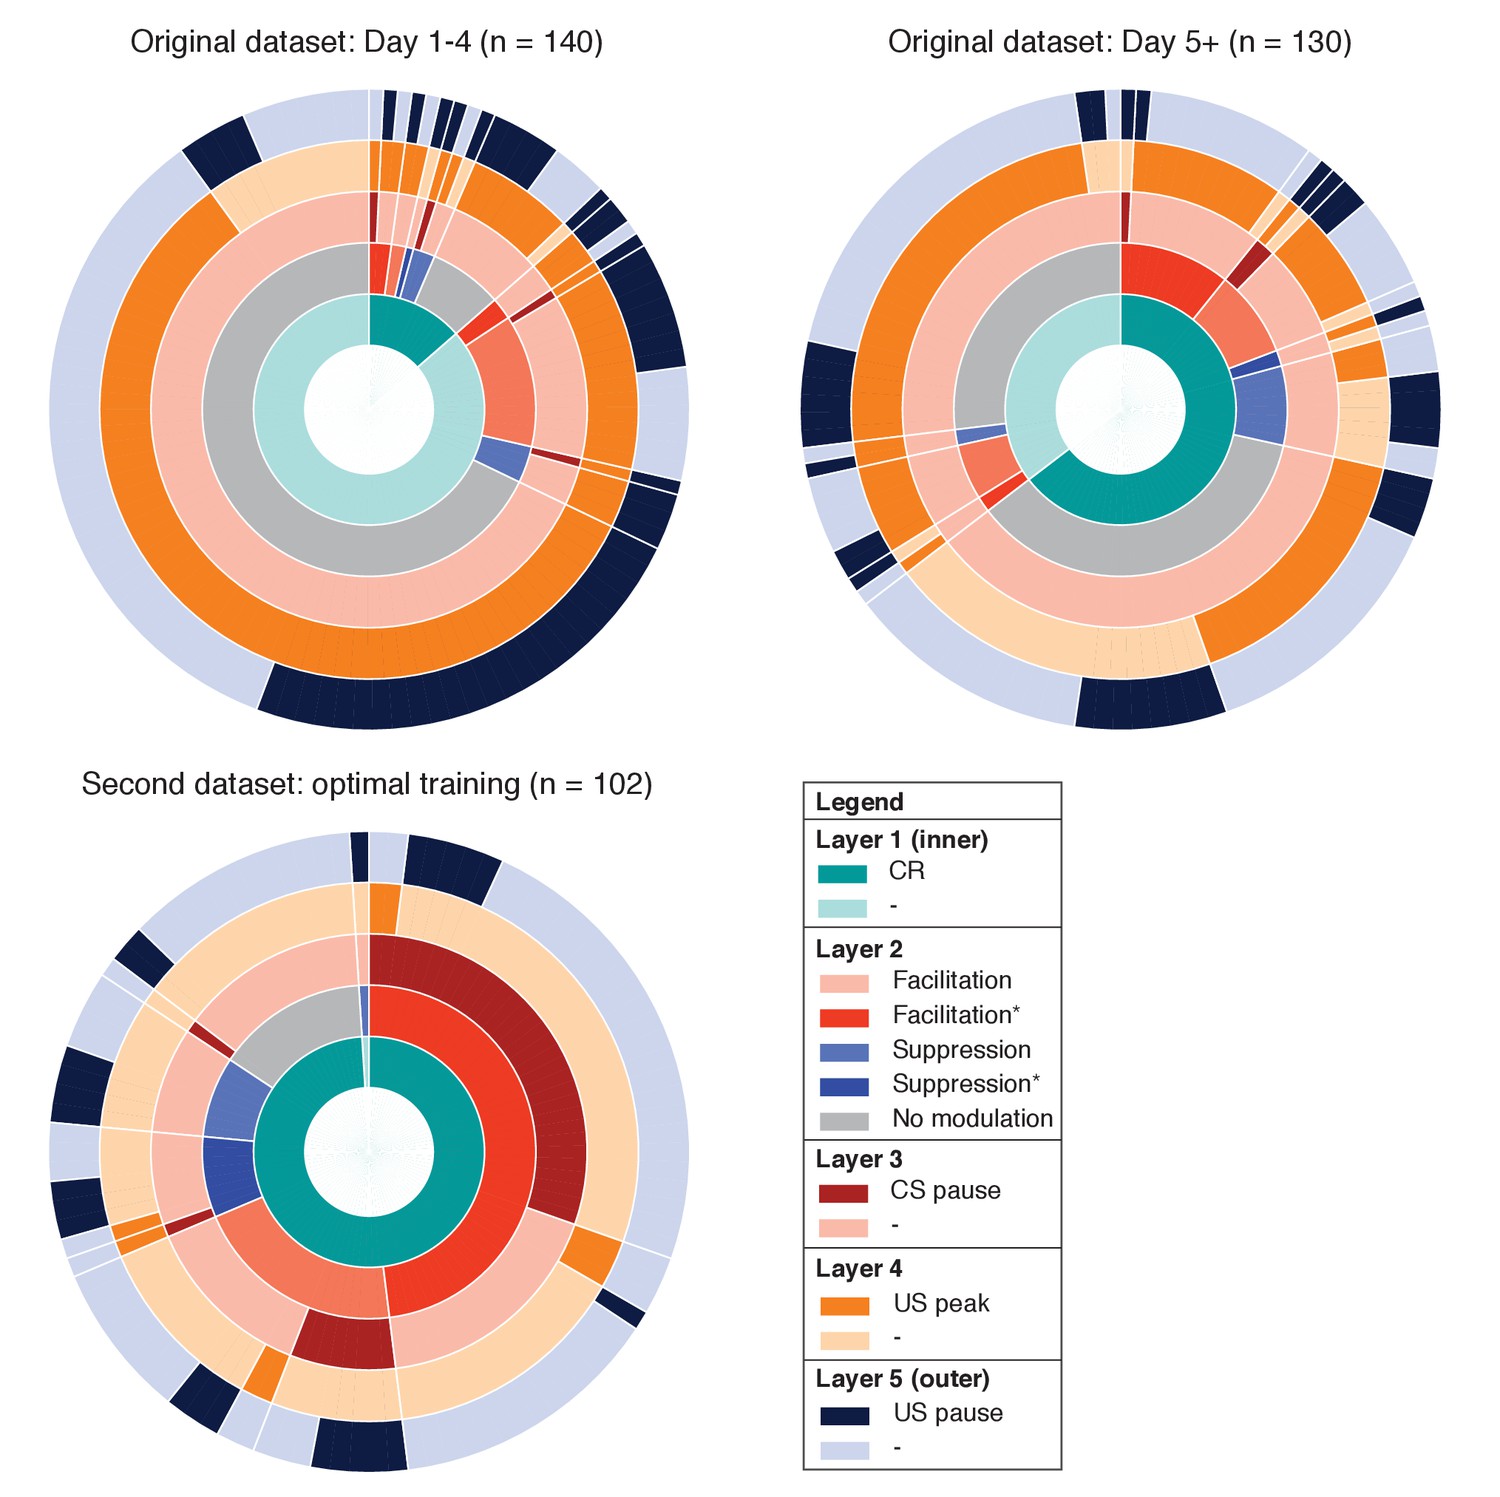
Overview of IpN recording datasets.
The proportional prevalence of recordings with and without conditioned behavior (inner layer 1), modulation and/or significant spike-eyelid correlations (layer 2; see Figure 2), a CS pause (layer 3; see Figure 4), a US peak (layer 4; see Figure 6), and a US pause (layer 5; see Figure 6).
Figure 2 with 1 supplement
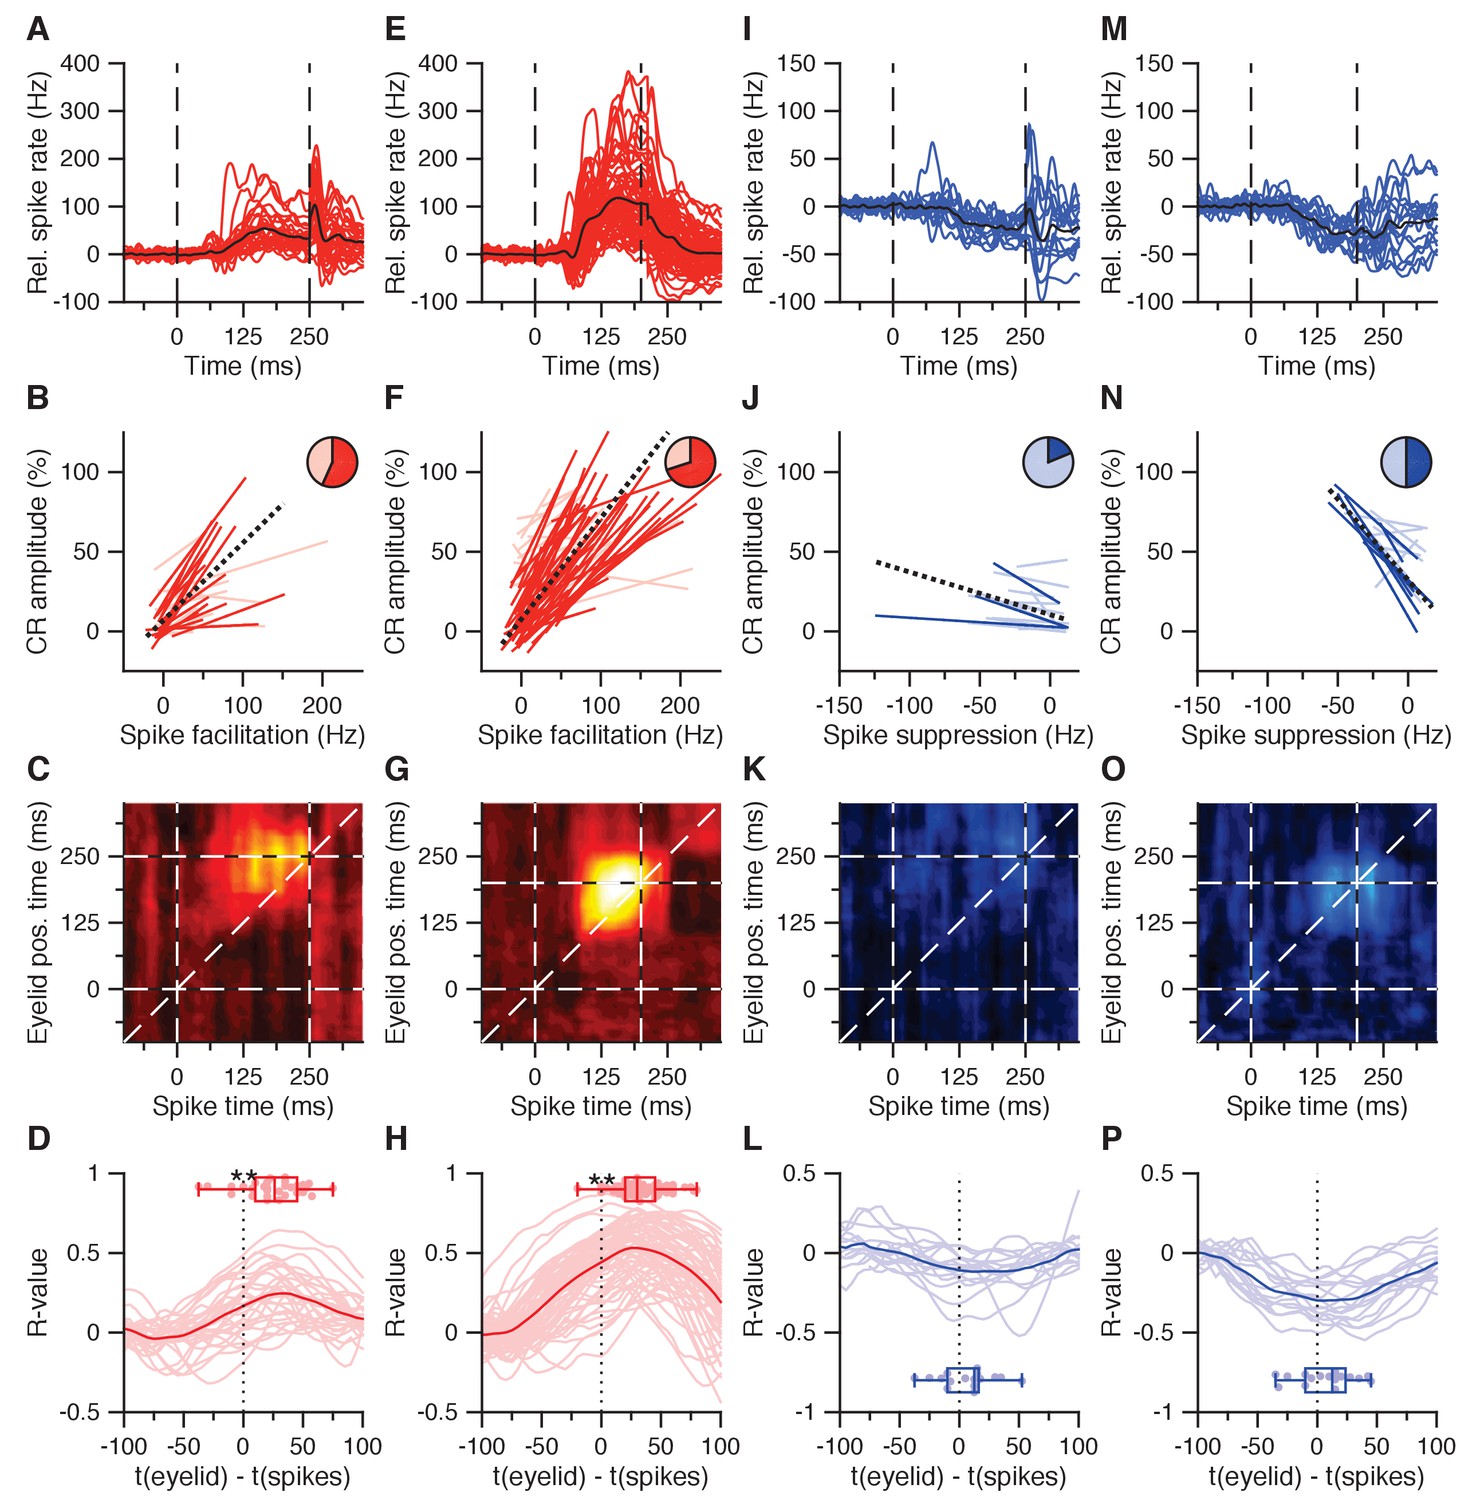
CS-US interval IpN modulation relates to eyelid behavior.
(A) Average spike traces of 30 facilitatory neurons in the first dataset recorded with conditioned behavior. Black trace denotes average. Time is shown relative to CS onset. (B) Trial-by-trial spike-eyelid correlation lines for the cells in A, with plain red lines showing significant correlations, light red lines showing the non-significant ones, and the pie chart showing their proportionality. (C) Average correlation matrix showing the average temporal distribution of the spike-eyelid position correlations of the cells in A. R-values counter to the correlational direction of interest were nullified before averaging. (D) Temporal cross-correlations for the cells in A (light red) and their mean (plain red). Box plot shows the time of maximum correlation for all cells. (E-H) Same as in (A-D), here for 70 facilitation cells with conditioned behavior from the independent second dataset. (I-L) Same as in (A-D), here for 16 suppression cells recorded with conditioned behavior from the first dataset. (M-P) Same as in (I-L), here for 16 suppression cells recorded with conditioned behavior from the second dataset.
Figure 2—figure supplement 1
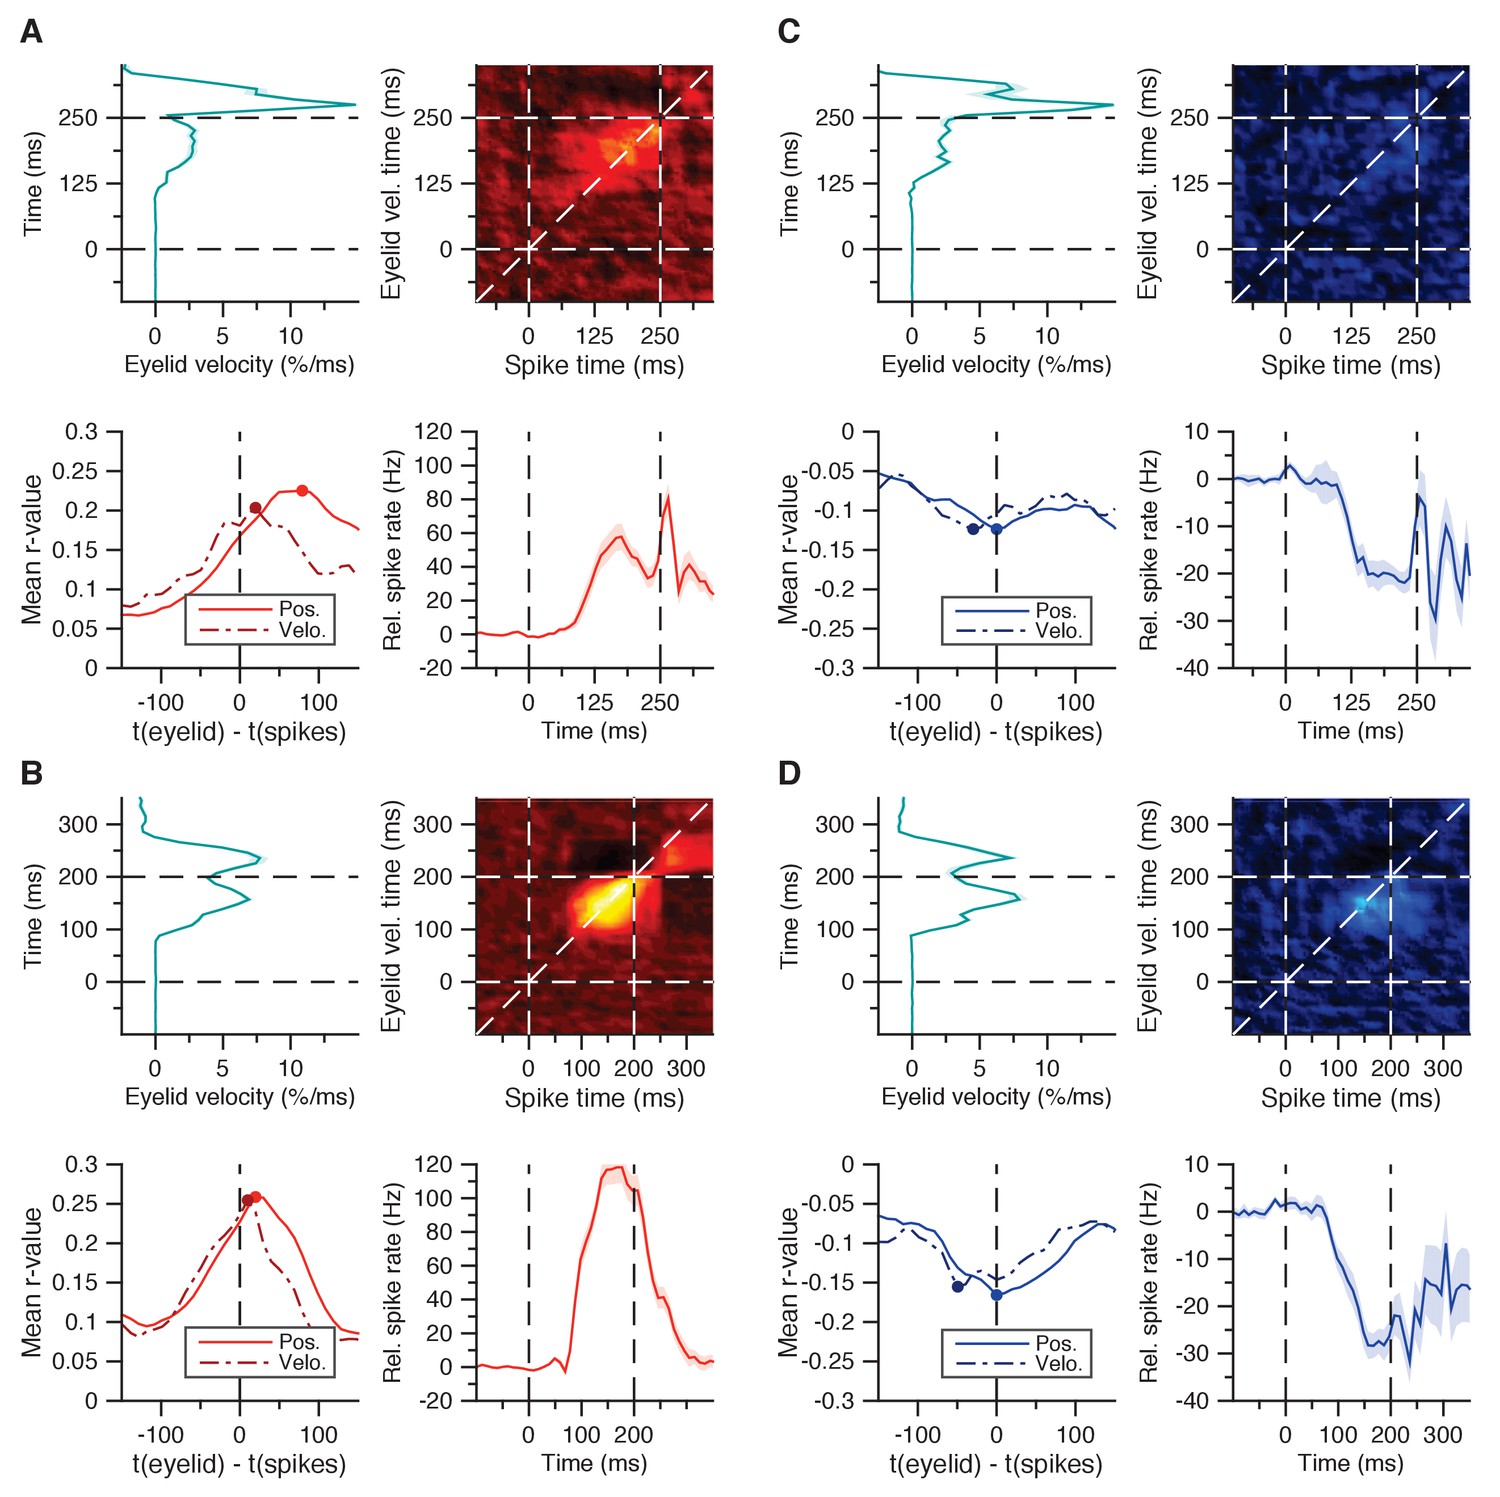
Spike-eyelid velocity correlation matrices.
(A) Average spike-eyelid correlation matrix for the 30 facilitation cells in Figure 2A, here using eyelid velocity instead of position (top right panel); mean eyelid velocity trace with SEM corresponding to the matrix’s y-axis (top left panel); mean spike trace with SEM corresponding to the matrix’s x-axis (bottom right panel); and average r-values with SEM for matrix correlations with similar temporal offset in the last 200 ms of the CS-US interval (bottom left panel). From this approach, the optimal temporal offset between spikes and eyelid position was 80 ms, and the one between spikes and eyelid velocity was 20 ms. (B) Same as in A, here for the 70 facilitation cells from the second dataset in Figure 2E. The stronger correlations lie more tightly to the diagonal, as reflected in an optimal temporal offset of 20 ms for eyelid position, and 10 ms for eyelid velocity (bottom left panel). (C) Same as in A, but for the 16 suppression cells in Figure 2I. As with the temporal cross-correlations in Figure 2L, here too the optimal temporal offset suggests spikes reflecting eyelid behavior, rather than predicting it: 0 ms for eyelid position, −30 ms for velocity. (D) Same as in (C), but for the 16 suppression cells in Figure 2M. Again, in contrast to the facilitation cells, the optimal temporal offset reflected rather than predicted eyelid behavior: 0 ms for eyelid position, −50 ms for eyelid velocity.
Figure 3
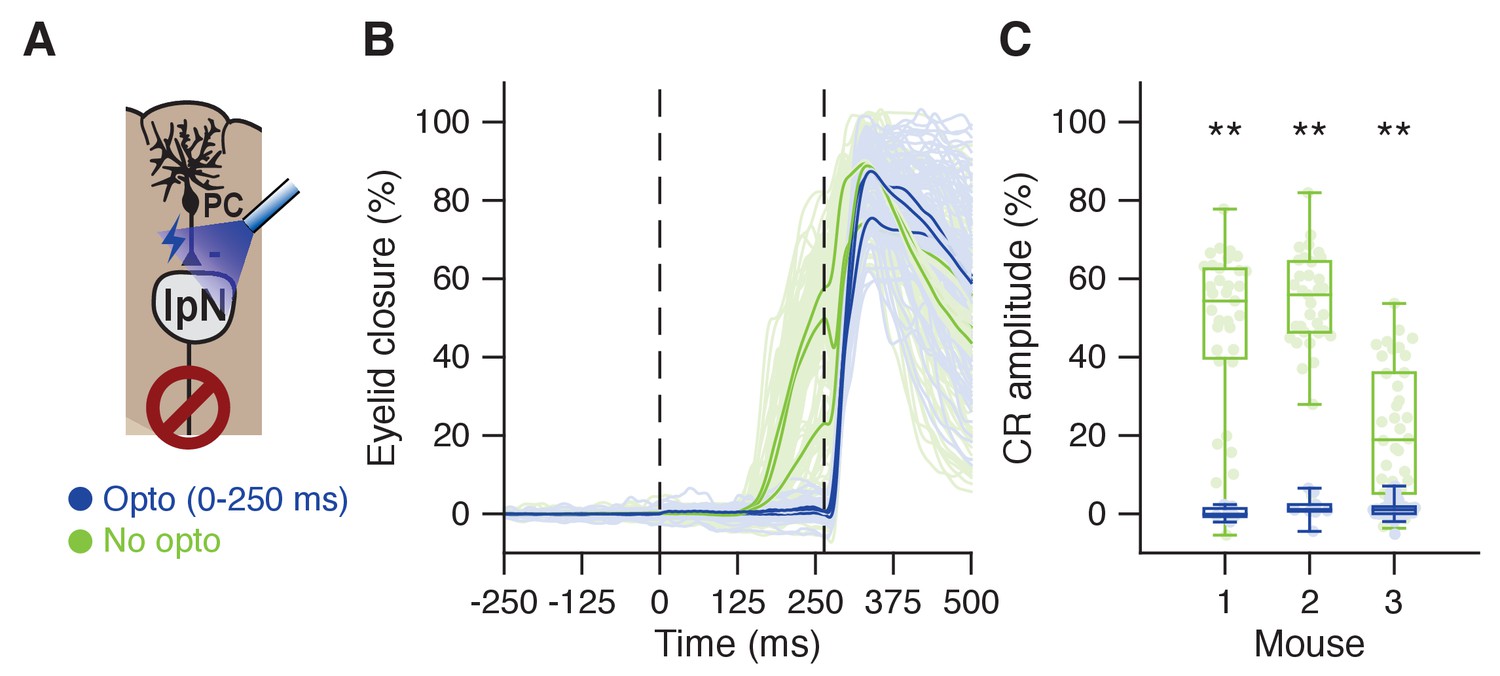
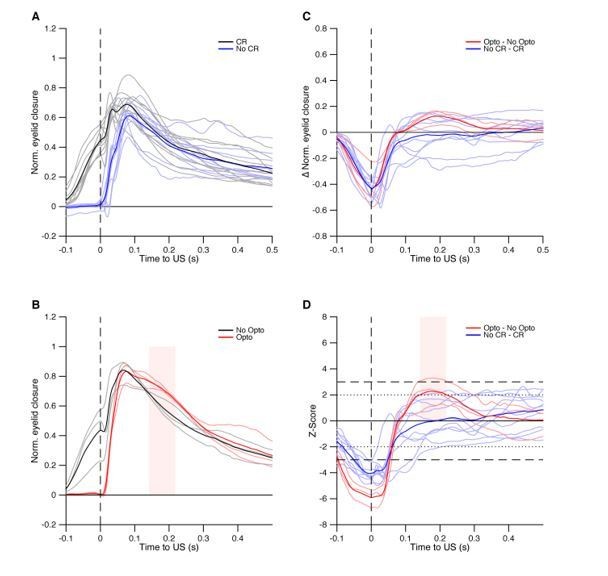
Optogenetic prevention of IpN facilitation eliminates CRs.
(A) In L7cre-Ai27 mice, Purkinje cells in the simplex lobule that express ChR2 exert a powerful inhibitory influence on the IpN upon optogenetic stimulation (see Witter et al., 2013; Canto et al., 2016). (B) Average eyelid traces for trials with (dark blue) or without (green) optogenetic stimulation throughout the CS-US interval, for three mice. C Eyelid closure at US onset for the data shown in B, separated by mouse.
Figure 4 with 1 supplement
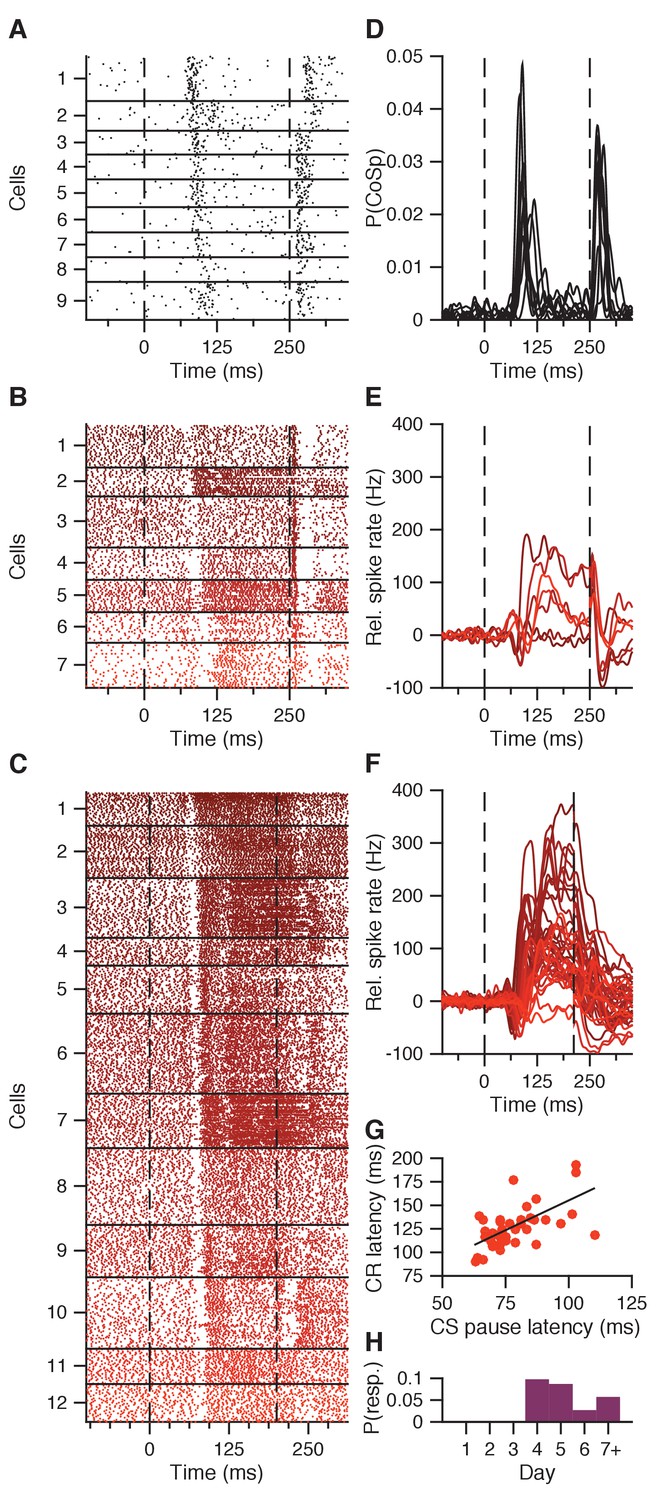
CS pause response reflecting CS-related Purkinje cell complex spike.
(A) Combined complex spike raster plot for 9 Purkinje cells ordered by the latency of their clear CS-related complex spike response in addition to the US-related complex spike (data from ten Brinke et al., 2015). (B) Combined raster plot for 7 IpN neurons, ordered by the latency of their CS pause in spike activity. (C) Same as in B, but for 12 of the 41 IpN neurons in the second dataset that showed a CS pause. (D-F) Average spike traces corresponding to the cells shown in (A-C), with (D) showing the probability of a complex spike instead of relative spike rate. (G) CS pause latency plotted against the latency at which the CR passes 5% eyelid closure, for all 45 cells showing both properties across the original and the second dataset. (H) Probability across days of finding a transient spike response at CS-complex spike latency, inhibitory (this figure) or excitatory (Figure 4—figure supplement 1), in the first dataset.
Figure 4—figure supplement 1
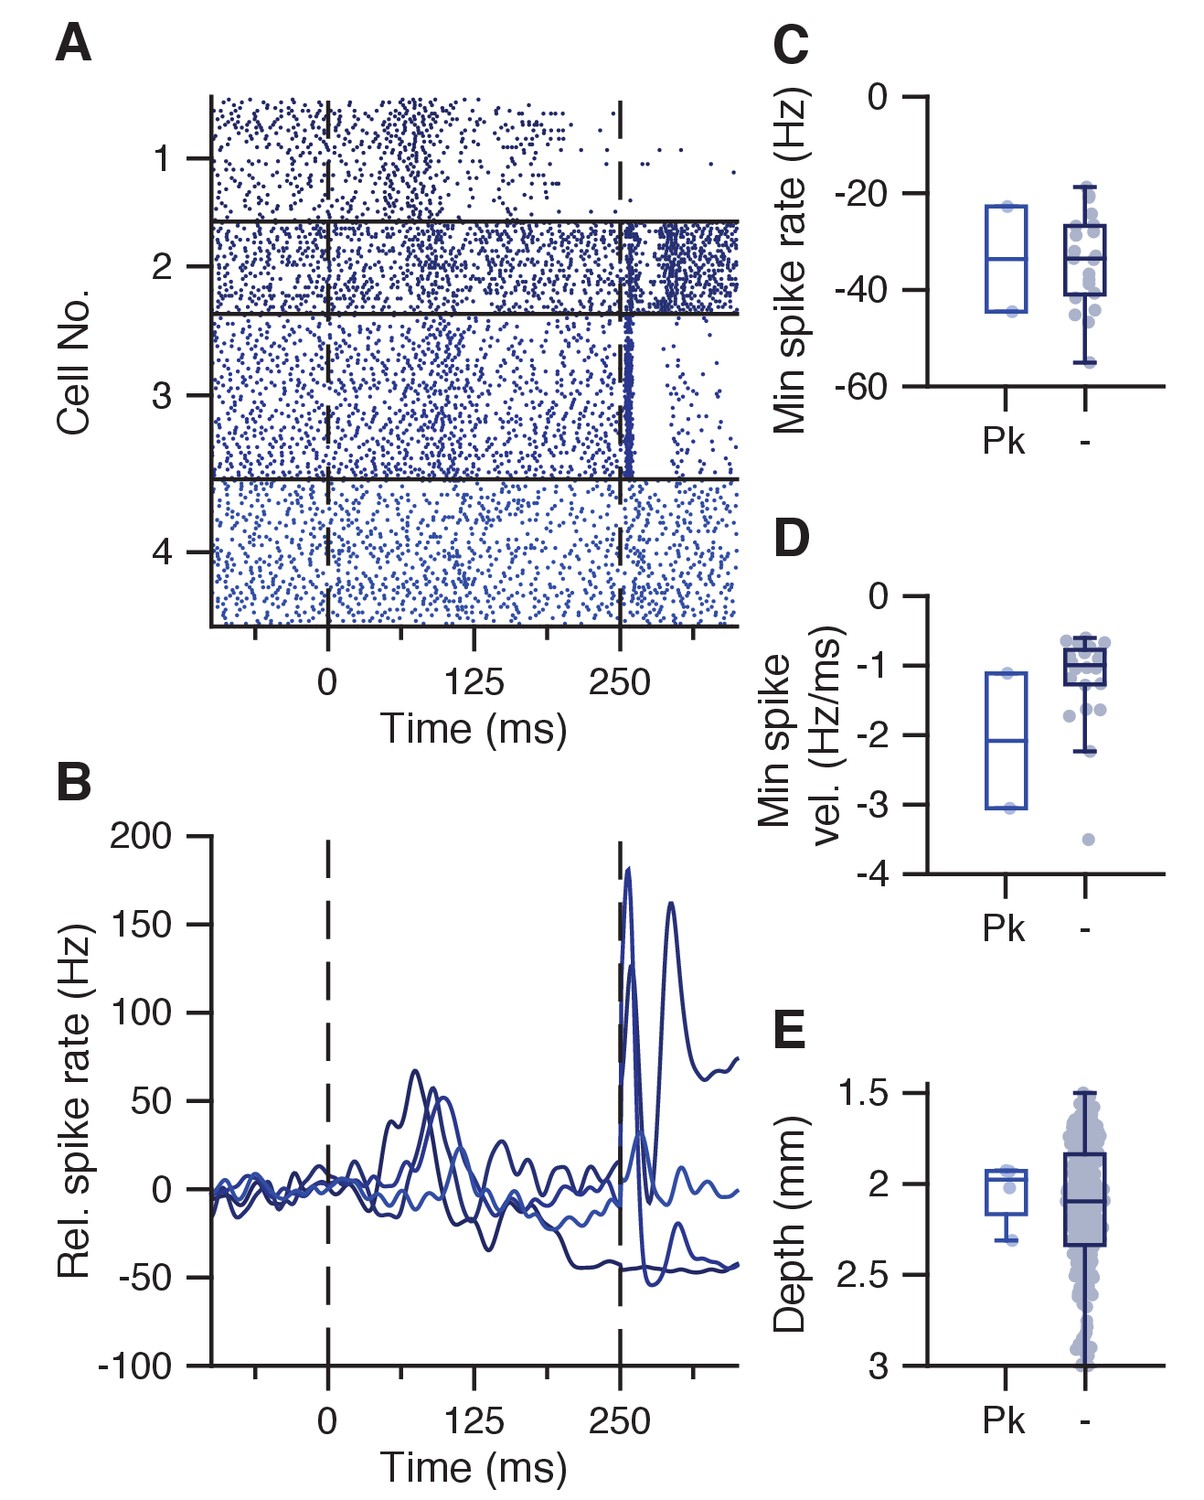
Transient spike increase at CS-complex spike latency.
(A) Raster plot showing IpN spikes during paired trials in 4 cells that show a blunted peak response around the CS-complex spike latency. (B) Average spike traces for the cells in A. (C) Minimum spike rate in the CS-US interval did not seem more or less pronounced in suppressive cells with this blunted peak (Pk, −33.6 ± 15.4 Hz) compared to those without (−34 ± 9.6 Hz, p=1, MWU). (D) Same as C, here showing no difference in spike rate velocity (−2.1 ± 1.4 vs −1.2 ± 0.7 Hz/ms, p=0.2096, MWU). (E) Same as C, here showing no difference in recording depth (2048 ± 181 vs 2120 ± 36 um, p=0.7348, MWU).
Figure 5 with 1 supplement

CS-US facilitation in IpN cells with and without CS pause.
(A) Average spike traces for 5 IpN cells showing CS-US facilitation and a CS pause. Grand average shown in red, with SEM. (B) Same as in A, here showing 55 IpN cells with CS-US facilitation but without a CS pause. (C) Maximum spike rate in the CS-US interval for facilitation cells with CS pause (P) and without CS pause (-), for the data in A and B. (D) Same as C, here showing maximum spike rate velocity. (E) Same as in C, here showing recording depth. (F-J) Same as in (A-E), here showing data from the second dataset; 39 IpN cells showed CS-US facilitation and a CS pause, and 31 cells showed CS-US facilitation but not a CS pause.
-
Figure 5—source data 1
DCN model properties.
- https://doi.org/10.7554/eLife.28132.011
Figure 5—figure supplement 1

Modeled IpN modulation.
(A) Average simple spike traces (light gray) in eyelid-related Purkinje cells that showed conditioned suppression; grand average is shown in black, with SEM. Blue trace shows the Purkinje cell with the deepest suppression. (B) Average traces of modeled IpN activity, with each cell containing 30 trials based on a simple spike suppression profile from the dataset in A. Blue trace shows the modeled IpN activity corresponding to the blue Purkinje cell trace in A. (C) Average traces of actual recordings of facilitation cells that did not show a CS pause. Purple trace denotes the average of the modeled IpN neurons in B. (D) Same as in C, here showing facilitation cells that did show a CS pause. Blue trace is the same as in B. (E) Timing of modeled (M) IpN facilitation, compared to that of real IpN neurons that did not (R-) or did (Rc) show a CS pause. The first three bars denote facilitation onset times, and the second set of bars shows peak time. The modeled IpN neurons seem to align particularly with the earlier facilitation profiles of the non-CS pause cells in terms of both onset (M: 73 ± 19 ms; R-: 88 ± 25 ms, p=0.0098, MWU) and peak times (M: 144 ± 55 vs R-: 171 ± 43 ms, p=0.0221, MWU). (F) Facilitation peak amplitude was higher in CS pause cells (Rc, 17 ± 6.3) than both modeled IpN neurons (M, 8 ± 2.8, p=0.0039, MWU) and non-CS pause cells (R-, 9.3 ± 6, p=0.0064, MWU). (G) Whereas R- cells showed slightly higher spike rate velocities than M cells (0.5 ± 0.1 vs. 0.4 ± 0.2 z/ms, 0.0198, MWU), Rc cells showed particularly high velocities (1.2 ± 0.6 z/ms) compared to both R- (p=0.0006, MWU) and M cells (p=0.0013, MWU). (H) The drop in amplitude from peak to US onset was significantly great for Rc cells compared to R- cells (9.4 ± 4.1 vs 5.3 ± 4.3, p=0.0283, MWU), but the comparison with M cells (6 ± 4.8, p=0.11, MWU) failed to reach significance.
Figure 6 with 1 supplement
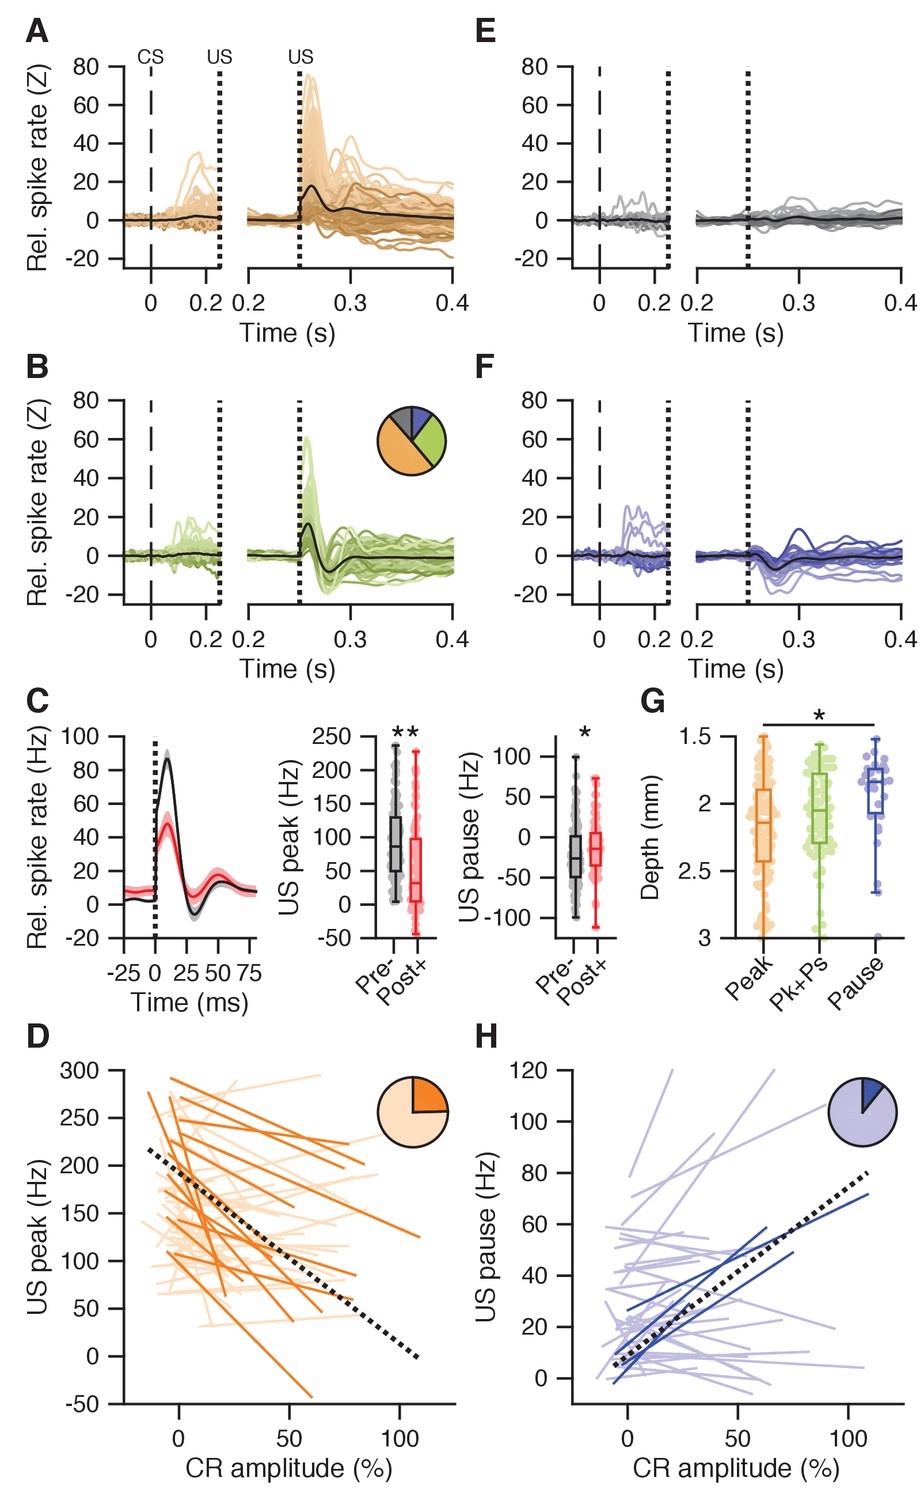
US peak and pause responses.
(A) Average spike traces for cells showing a US peak but not a US pause response (n = 134); left panel shows activity in the CS-US interval aligned to baseline, right panel shows post-US activity aligned to the last 50 ms of the CS-US interval. (B) Same as in A, but for cells showing both a US peak and a US pause (n = 77). The pie chart shows the proportion of cells with a US peak (yellow), a US pause (blue), both (green), or neither (gray). (C) Left panel: average traces with SEM of spike activity relative to baseline for all cells recorded without conditioned behavior on days 1–4 (black), and all cells recorded after day four and with conditioned behavior (red). Middle panel: US peak amplitude relative to baseline was significantly higher in early recordings without conditioned behavior (pre-) than in later recordings with behavior (post+; p<0.0001). Right panel: same as the middle panel, here showing minimum firing rate in the US pause window relative to the last 50 ms in the CS-US interval; early recordings without CR behavior show lower values than later recordings with behavior (p=0.0312). (D) Significant (plain orange) and non-significant (light orange) trial-by-trial correlation lines for all cells showing conditioned behavior and a US peak (n = 62). Black dotted line shows a fit from a linear mixed model incorporating the significant cells. The pie chart inset shows the proportion of cells that were significant. (E) Same as in A, but for cells without a clear post-US response (n = 31). (F) Same as in A, but for cells with only a US pause response (n = 28). (G) Recording depth was different between cells separated on US responses, getting progressively less deep from cells with only a US peak (yellow, 2182 ± 373 μm), through cells showing both US peak and pause (green, 2075 ± 322 μm), to cells showing only a US pause (blue, 1939 ± 299 μm; p=0.0025). (H) Similar to D, but for all cells showing conditioned behavior and a US pause (n = 37). Note that the y-axis shows the firing rate during the US pause period, with higher values implying less pronounced pauses.
Figure 6—figure supplement 1
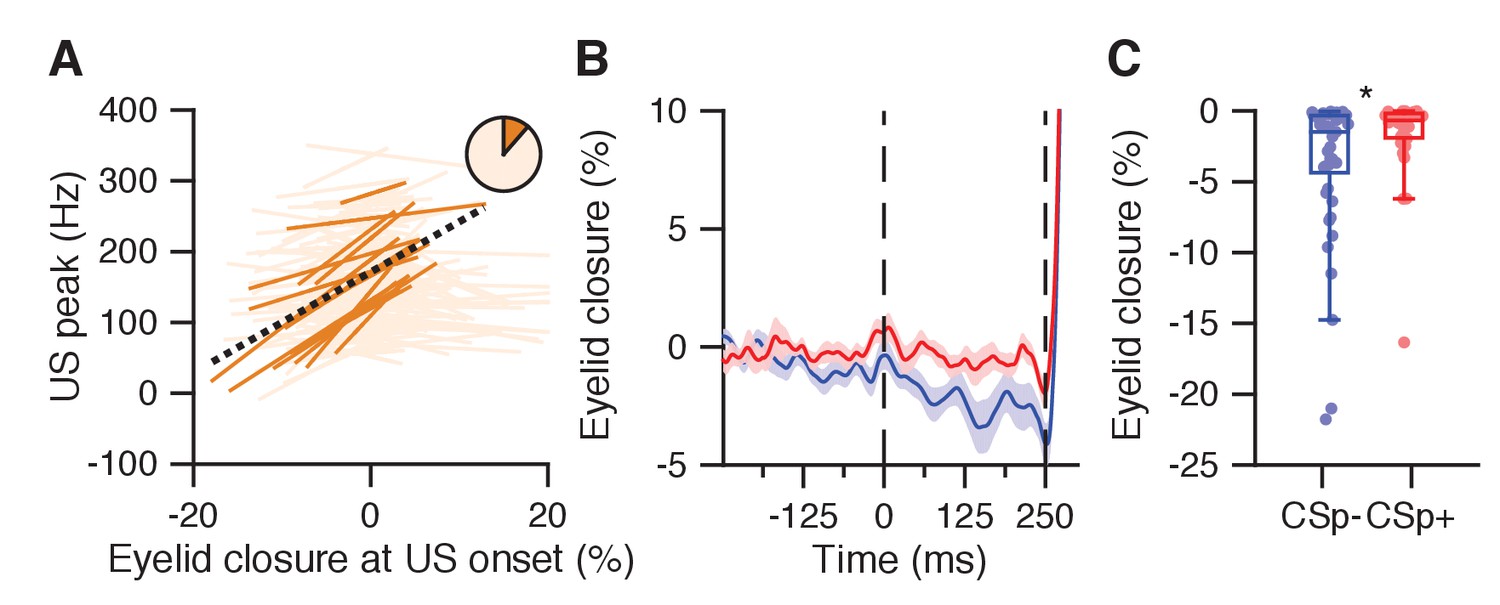
Eyelid opening in the CS-US interval relates to reduced US peak and absence of US-complex spike.
(A) Significant (plain orange) and non-significant (light orange) trial-by-trial correlation lines for cells with a US peak and without conditioned behavior (n = 149). Pie chart shows the proporition of significantly correlating cells. Black dashed line: fit line from a linear mixed model of the significant cells (Supplementary file 1). (B) Average eyelid traces with SEM for trials with eyelid opening responses, with (red) and without (blue) a US-related complex spike, from the Purkinje cell dataset reported in ten Brinke et al. (2015). (C) The eyelid was further opened at US onset in trials without a US-related complex spike (blue) than in trials with US-complex spike (red, p=0.0218, MWU).
Figure 7 with 2 supplements
Second US peak response akin to rapid post-CS pause excitation.
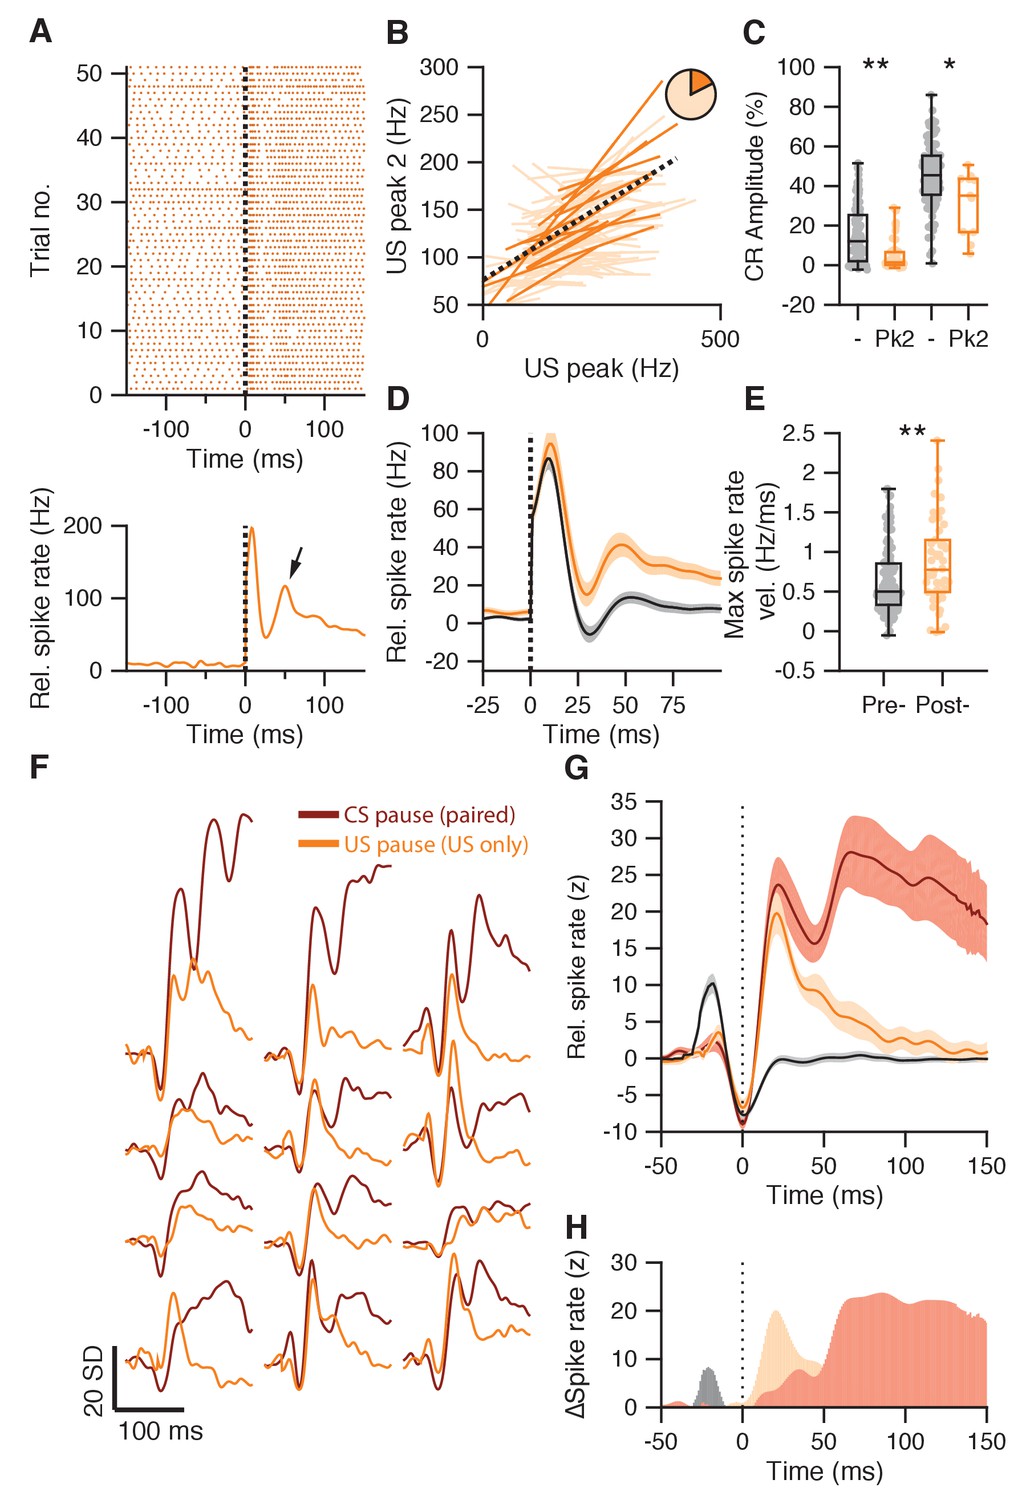
(A) Raster plot (upper panel) and average spike trace (lower panel) of an example IpN cell showing a second US peak (arrow). (B) Significant (plain orange) and non-significant (light orange) trial-by-trial correlation lines for cells showing both a first and a second US peak (n = 83). Pie chart shows the proportion of significant cells, black dotted line shows fit from a linear mixed model, integrating significant cells. (C) IpNs with a second US peak (Pk2) show lower average CR amplitudes at US onset than IpNs without (-), in both the first dataset (left boxplot pair; p<0.0001), as well as in the second dataset (right boxplot pair; p=0.021). (D) Average traces with SEM of spike activity relative to baseline for IpNs recorded without conditioned behavior on days 1–4 (black), and those recorded without conditioned behavior after day 4 (yellow). (E) Maximum spike rate velocity of the second US peak was significantly higher in recordings without CR behavior on day five and over (post-) compared to earlier recordings without behavior (pre-; p=0.0072). (F) Average spike traces of paired trials, aligned by CS pause minima (brown), and of US-only trials from the corresponding IpN cell, aligned by US pause (yellow) minima, for 12 recordings from the second dataset. The traces were standardized by the activity −150 to −50 ms relative to the pause minima. (G) Averages of the CS pause (brown) and US pause (yellow) traces in F, with SEM. For reference, US pause-aligned traces from paired trials of IpNs from the first dataset, with US pauses, without CR behavior, and from day 1–4, are shown in black. (H) The difference between US-responses in US-only trials after training (yellow) and US-responses in paired trials early in training before CR behavior is acquired (gray) highlight the absence of the first US peak and the substantial presence of a second peak after the US pause, in well-trained animals. Additionally, the difference between the CS pause-aligned traces from paired trials (brown) and the US-pause aligned traces from US-only trials of the same IpN set (yellow) suggests the two profiles only start to diverge substantially approx. 50 ms after the pause response.
Figure 7—figure supplement 1
IpN responses in paired trials and US-only trials, after optimal conditioning.
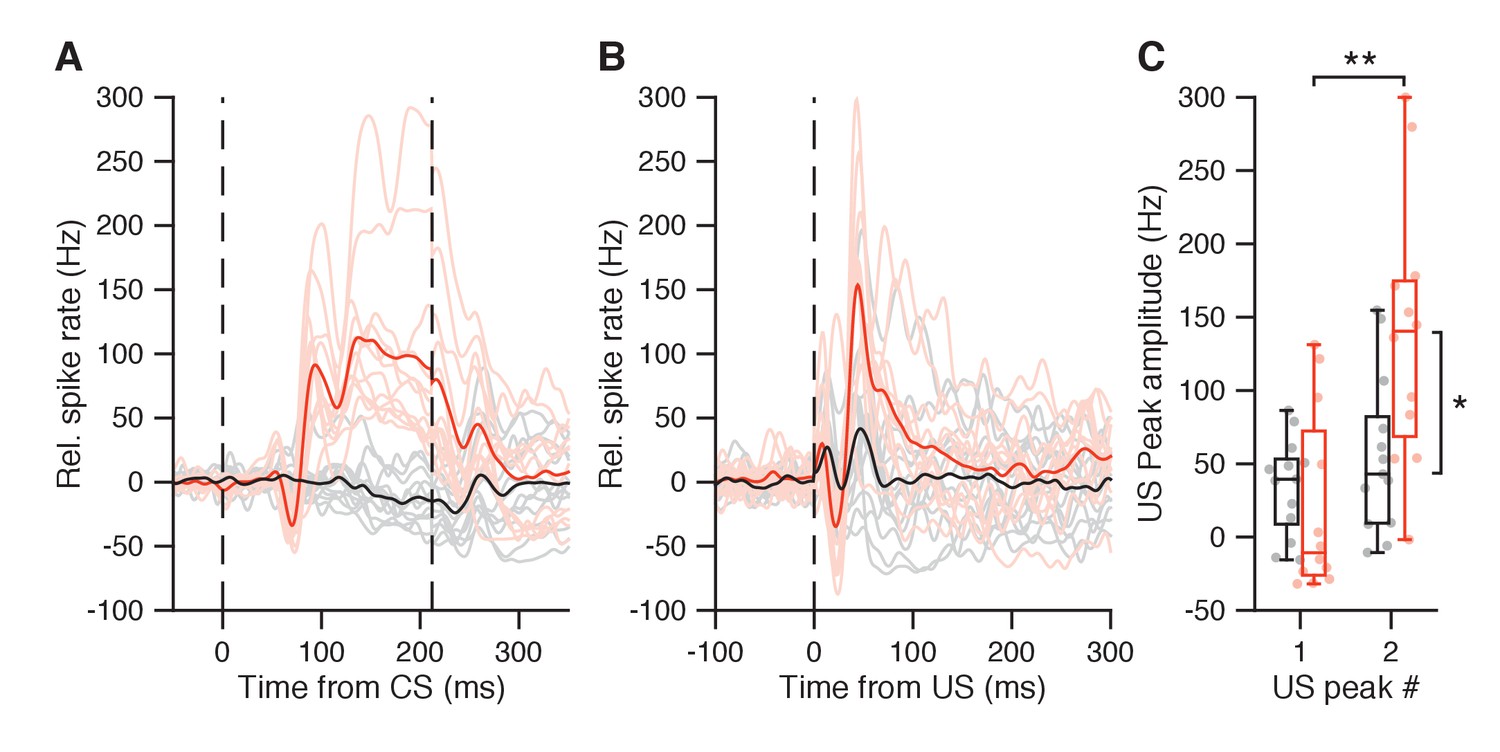
(A) Average spike traces during paired trials for 12 IpN cells with CS pause and CS-US facilitation (light red; average in plain red), and for 13 IpN cells that did not show both responses (gray; average in black). (B) Average spike traces for the same IpN cells in A, but during US-only trials. (C) The IpNs with CS pause and CS-US facilitation (red) showed substantially stronger post-US pause peak amplitudes (137.3 ± 89.4 Hz) than the IpNs without (black; 55 ± 53.9 Hz, p=0.0133, MWU). The second US peak was also stronger than the first US peak within the red IpN group (137.3 ± 89.4 vs 20.3 ± 62.3 Hz; p=0.0014, MWU), but not within the black IpN group (34.8 ± 32.8 vs 55.1 ± 53.9 Hz, p=0.4728, MWU).
Figure 7—figure supplement 2
Rapid post-CS pause excitation relates to broader subsequent excitation and to CR behavior.
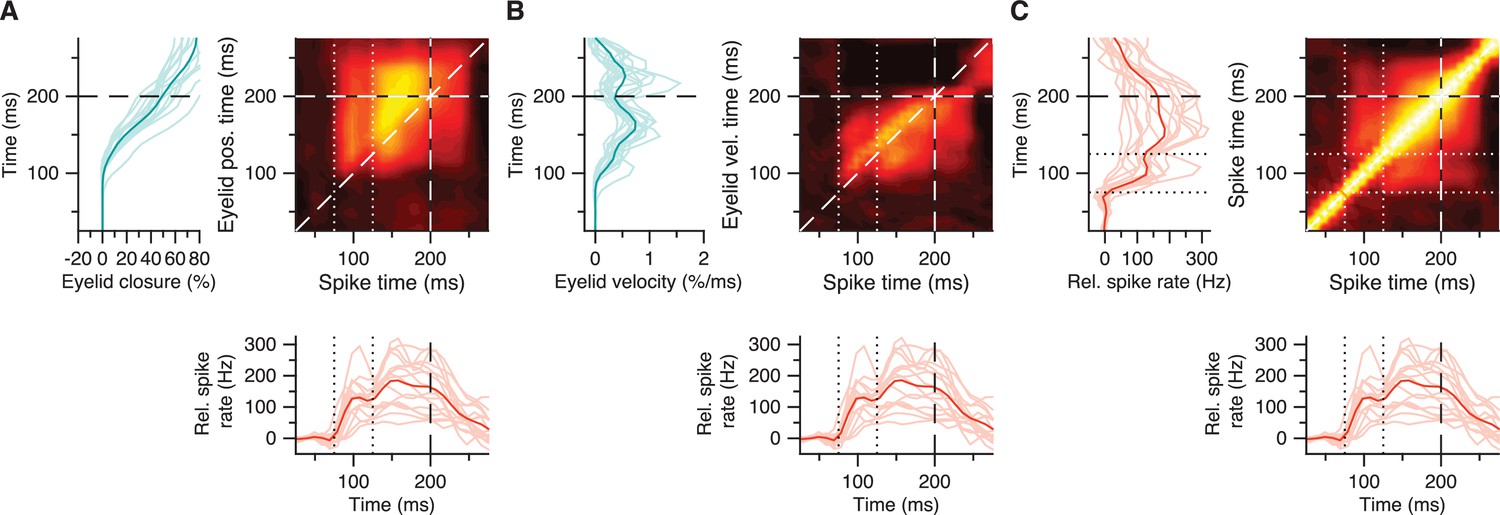
(A) Average trial-by-trial correlation matrix (right panel) showing positive spike-eyelid position correlations for 16 IpN neurons with a CS pause, where a hotspot of positive correlations corresponding to rapid post-CS pause excitation (straddled by dotted white lines) shows a degree of separation from the hotspot corresponding to broader subsequent excitation. Average eyelid responses (left panel) correspond to the y-axis in the matrix; average spike traces (bottom panel) correspond to its x-axis. (B) Same as in A, here showing spike-eyelid velocity correlations. (C) Same as in A, here showing the auto-correlations among spike activity, which suggest a positive relation between the rapid post-CS pause excitation and broader subsequent excitation.
Figure 8
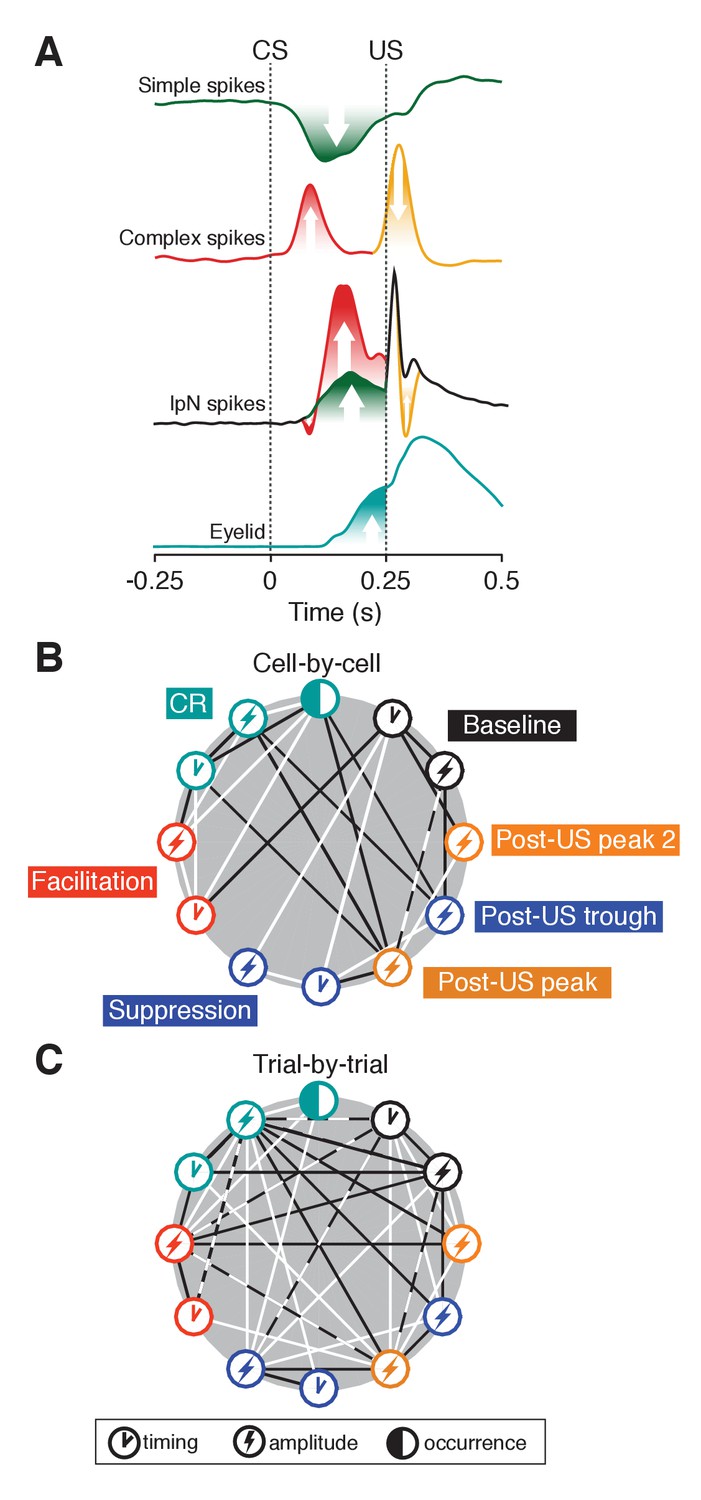
Eyelid-related modulation in cerebellar cortex and nuclei.
(A) Mean spike traces for simple and complex spikes in Purkinje cells and IpN spike show how eyelid-related cerebellar cortical and nuclear modulation relate after training. On the one hand, simple spike suppression translates relatively straightforwardly to facilitation in the IpN. Stimulus-related complex spike input leaves a transient spike trough, with the well-timed CS-related complex spike input showing a tendency to be followed by strong rebound-like excitation. Extra-cortical afferents underlie the oft observed transient post-US excitatory response, and presumably interact with the other modulatory components. The timing component in the baseline represents the coefficient of variation (CV). (B) Cell-by-cell correlations between occurrence, amplitude, and timing of the different eyelid behavior and IpN spiking components. Black lines indicate negative correlations, white lines indicate positive ones. (C) Trial-by-trial correlations between the components also labeled in B, with lines indicating the presence of a significant number of cells showing significant correlations of the corresponding direction. For each parameter pair, recordings were included only if they were considered to show the associated phenomena. Dashed white and black lines indicate that both positive and negative correlations were significantly present among cells.
Author response image 1
Author response image 2
Author response image 3

Additional files
-
Source data 1
Source data for IpN datasets.
For 51 variables relevant to the analyses in this paper, the values for each trial for each cell are contained in a data structure in the attached MATLAB. mat-file. The structure is named ‘ipn’, and contains 51 instances; for each variable instance, there is a ‘name’ field, describing the variable, and a ‘values’ field, containing the data. The ‘values’ field contains a cell array, with each cell containing the values of the selected variable for all trials of an actual cell. The two IpN datasets central to this study are combined, with the first 270 cells denoting the first dataset, and the remaining 102 cells denoting the second dataset.
- https://doi.org/10.7554/eLife.28132.018
-
Supplementary file 1
Summary statistics of the linear mixed model analyses in Figures 2, 6 and 7.
- https://doi.org/10.7554/eLife.28132.019
-
Transparent reporting form
- https://doi.org/10.7554/eLife.28132.020
Download links
A two-part list of links to download the article, or parts of the article, in various formats.
Downloads (link to download the article as PDF)
Open citations (links to open the citations from this article in various online reference manager services)
Cite this article (links to download the citations from this article in formats compatible with various reference manager tools)
Dynamic modulation of activity in cerebellar nuclei neurons during pavlovian eyeblink conditioning in mice
eLife 6:e28132.
https://doi.org/10.7554/eLife.28132


