Medial thalamic stroke and its impact on familiarity and recollection
- Université de Toulouse, Inserm, France
- CNRS, University of Toulouse Paul Sabatier, France
- CHU Toulouse Purpan, France
- University of Bordeaux, Bordeaux University Hospital, France
Figures
Figure 1 with 1 supplement
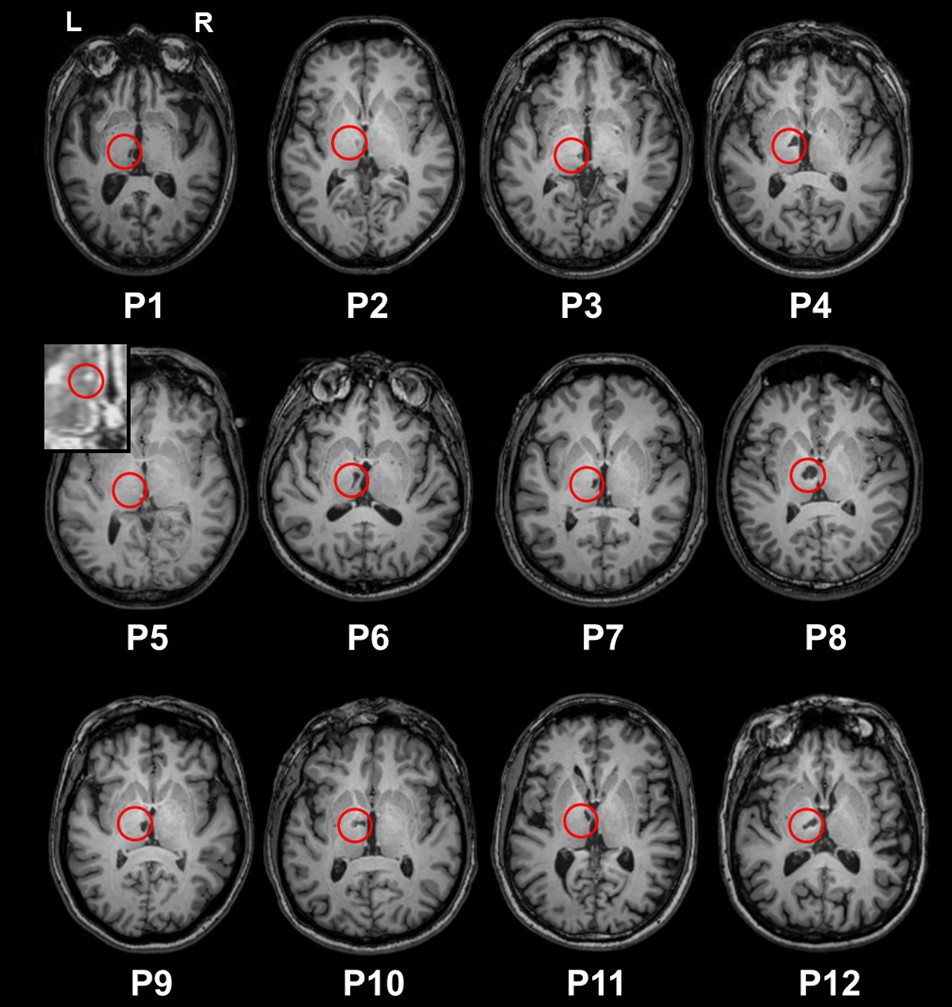
T1 axial sections of the patients’ native brains.
The red circles indicate infarcts. P5’s lesion is hardly visible on the picture (lesion volume = 5 mm3). We therefore provide a zoom on the Flair image, where the lesion is easier to see.
Figure 1—figure supplement 1
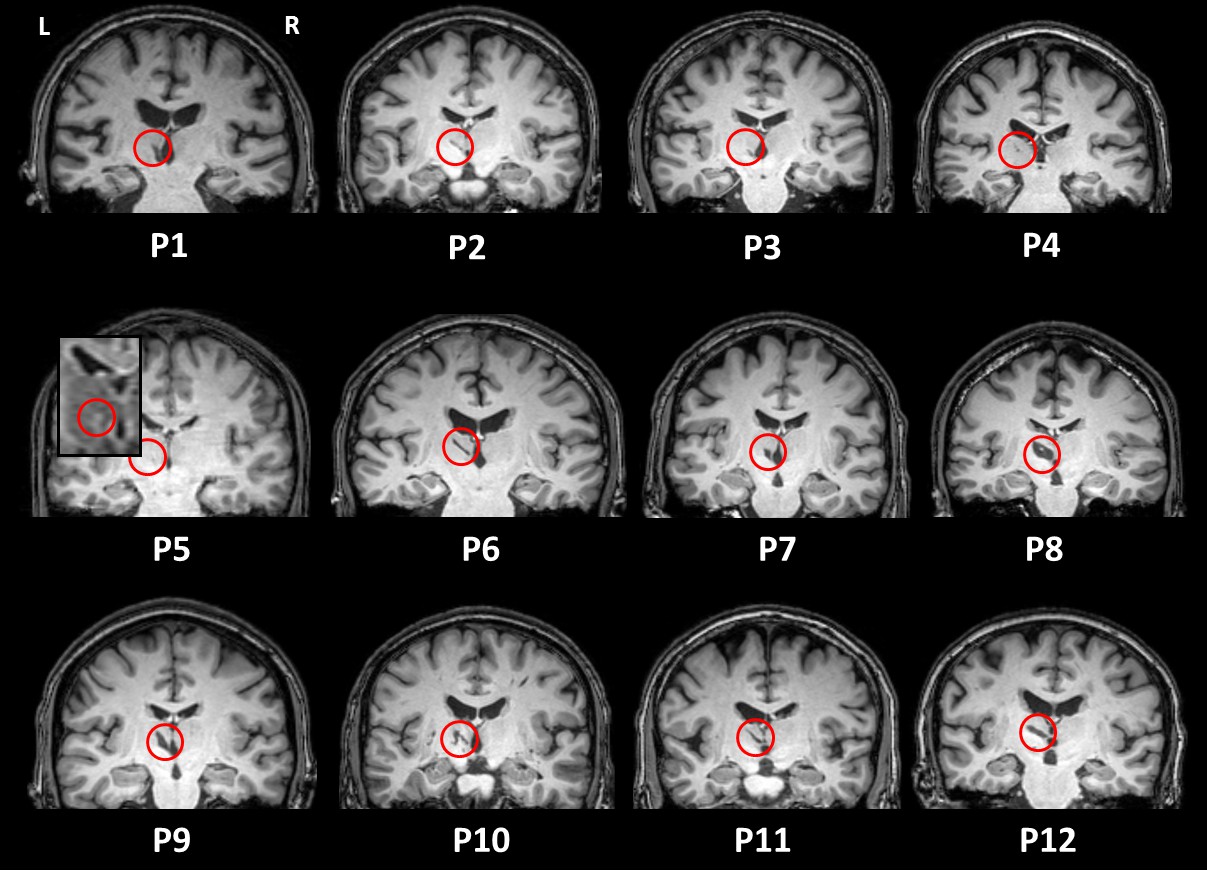
T1 coronal sections of the patients’ native brains.
The red circles indicate infarcts. P5’s lesion is hardly visible on the picture (lesion volume = 5 mm3). We therefore provide a zoom on the Flair image, where the lesion is easier to see.
Figure 2
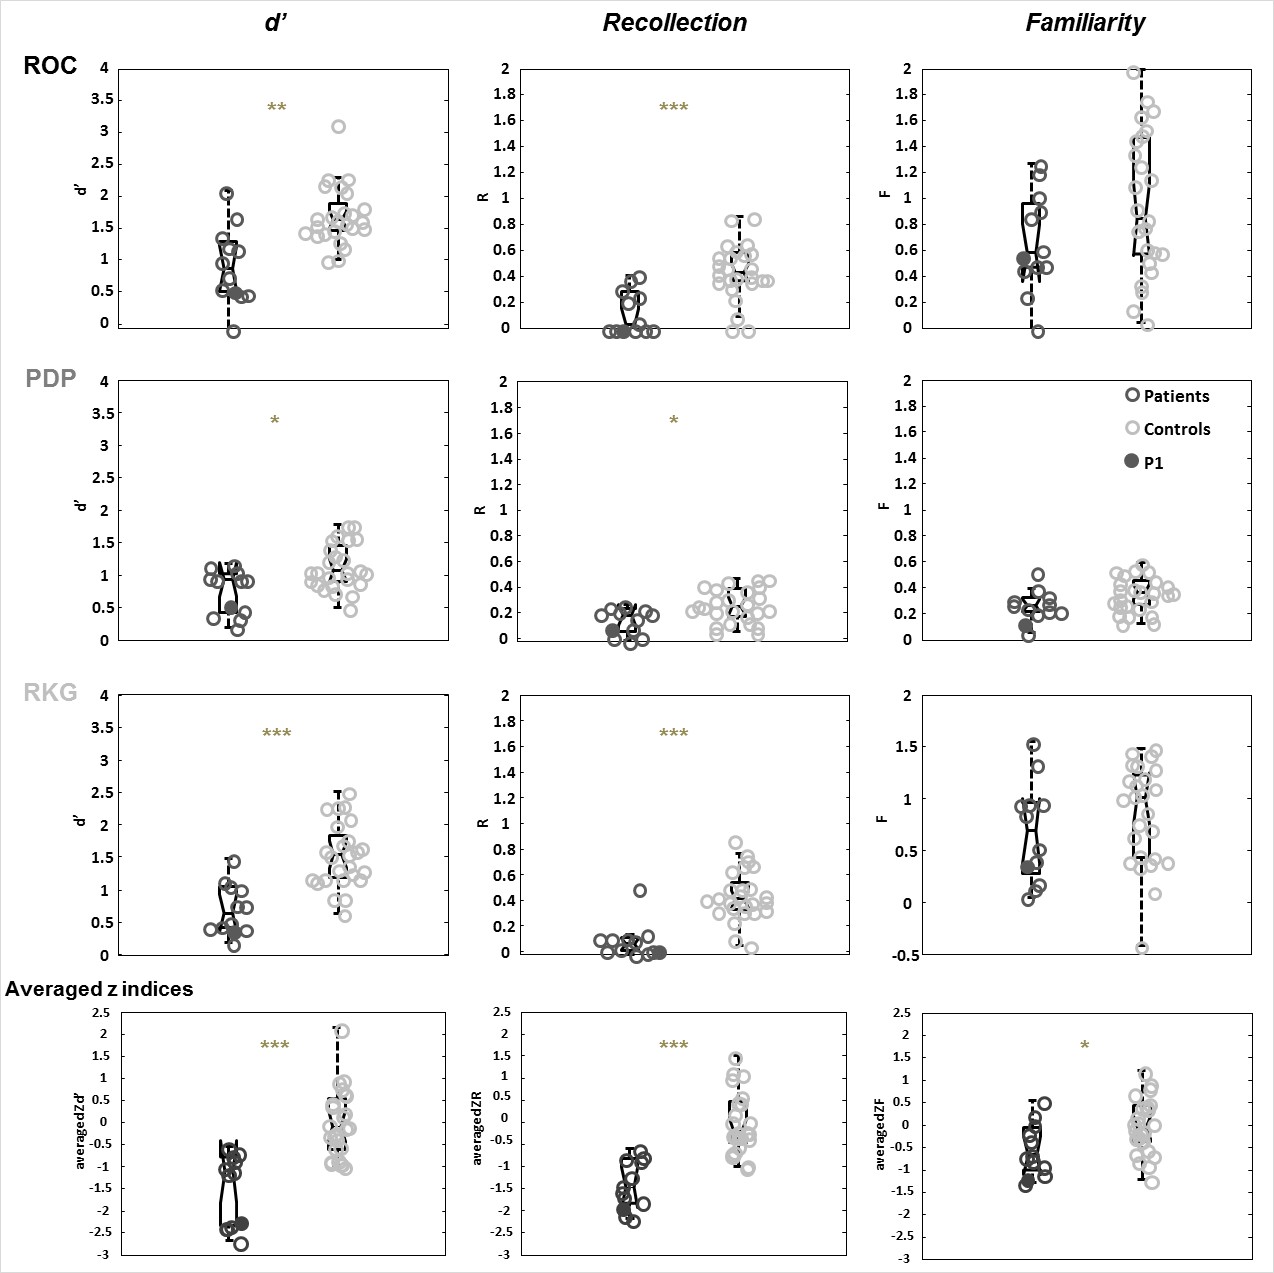
Comparison of patients and controls on the recognition memory tasks.
Box plots represent the distribution in quartiles of the d’, R and F indices for the ROC, PDP, RKG tasks, and for the summary scores across the three tasks (averaged z indices). Boxes represent the 25th and 75th percentiles, the lines in the boxes the medians. Notches display the variability of the median between samples. Boxplots whose notches do not overlap have different medians at the 5% significance level based on a normal distribution assumption. Comparisons are reasonably robust for other distributions, however, and statistical comparisons reported in the text were carried out independently of this graphical representation. Upper and lower lines of whiskers represent minimum and maximum performance. Outliers (i.e., subjects whose performance fall outside minimum or maximum values of 1.5 the difference between the 25th and 75th percentile) would be represented by circles outside the minimum and maximum values. Filled dark dots represent the case P1 whose MTT is intact according to the Morel atlas and damaged as stated in the volume analysis.
Figure 3

Correlation between patients’ averaged zR and zF indices.
Dark dots represent patients with a damaged MTT, and light dots patients with an intact MTT. The patient labels next to the dots correspond to those in Supplementary file 2, which details damage to the thalamic nuclei.
Figure 4
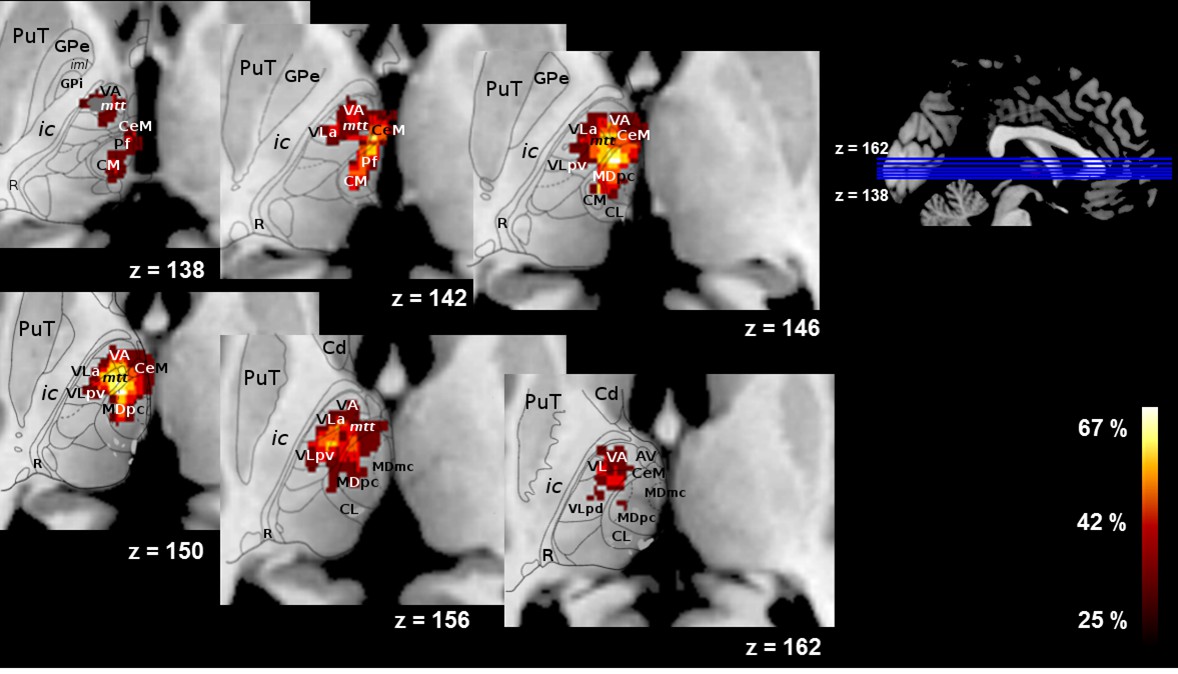
Overlap of the lesions across patients (% of patients, N = 12) on an axial view on the automated Morel atlas.
PuT = putamen; GPe = external globus pallidus; ic = internal capsule; R = reticular nucleus; VA = ventral anterior; mtt = mammillothalamic tract; CeM = central medial; CM = central median; CL = central lateral; Hb = habenula = MD=mediodorsal.
Figure 5
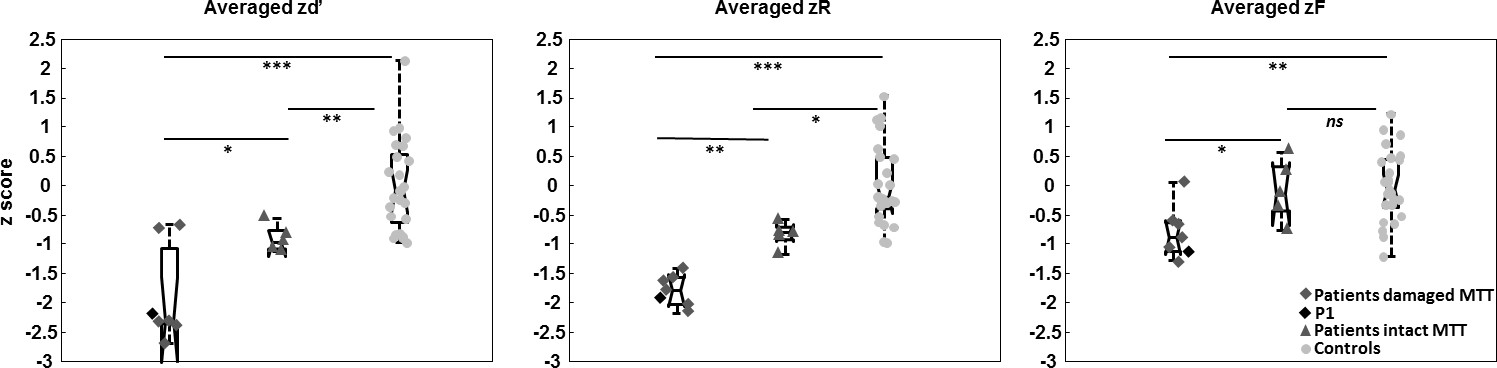
Comparisons of averaged z recognition indices (d’, R, F) between the damaged MTT and intact MTT subgroups and controls, using permutation tests.
*p<0.05. **p<0.01. ***p<0.001. ns = non significant. Boxes represent the 25th and 75th percentiles, the lines in the boxes the medians. Notches display the variability of the median between samples (Same details than described in the legend of the Figure 2). The black diamond represents the case P1, whose MTT is intact according to the Morel atlas but damaged as found in the volume analysis.
Figure 6
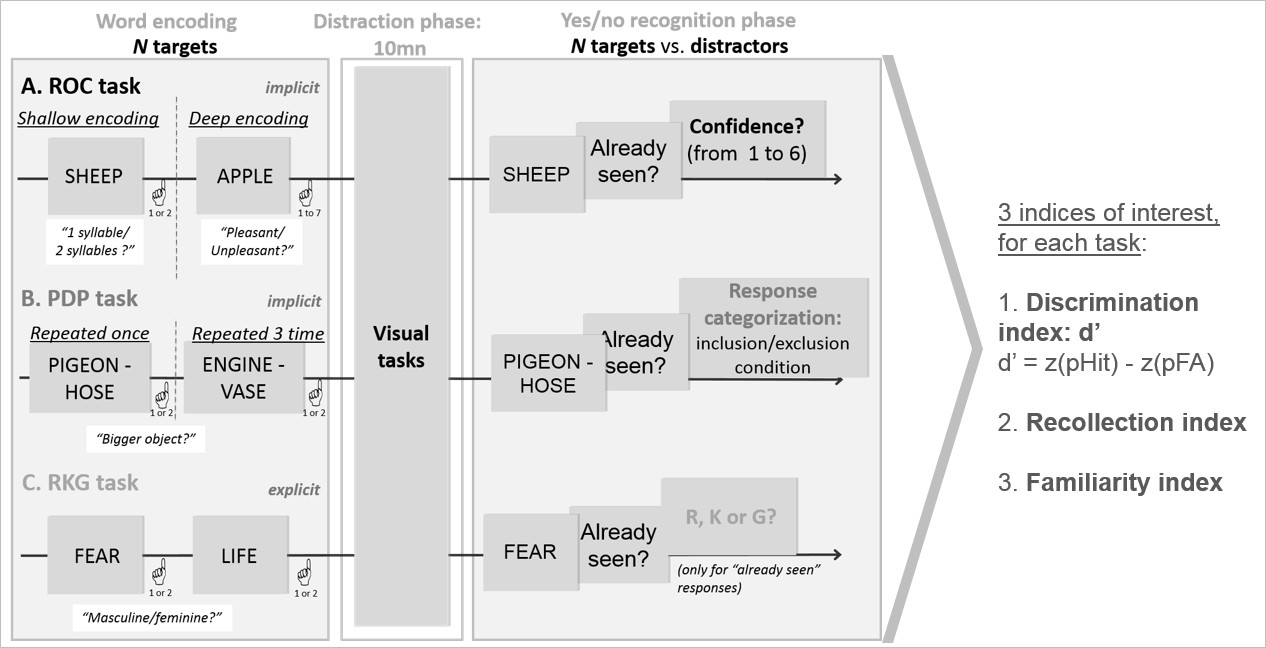
Experimental design of the three tasks (ROC, PDP, RKG).
All verbal tasks consisted of an encoding phase, a distractive phase and a yes/no recognition phase. Supplementary questions in the ROC and RKG tasks allowed for the calculation of an index of global performance (d’), recollection and familiarity.
Tables
Table 1
Mean (standard deviation) [min, max] demographic data of patients and controls, and patients in the dMTT and iMTT subgroups.
MannWhitney and χ2 tests were used to compare patients and controls, and permutations tests and χ2 to compare dMTT and iMTT.
| Left thalamic infarct patients (n = 12) | Healthy control participants (n = 25) | P value | dMTT subgroup (n = 7) | iMTT subgroup (n = 5) | P value | |
|---|---|---|---|---|---|---|
| Age (years) | 53.2 (14.6) [25, 75] | 52.6 (11.6) [25, 69] | 0.86 | 58.9 (16.6) [25, 75] | 45.2 (6.3) [38, 52] | 0.12 |
| Sex (female (F)/male (M)) | 3F/9M | 15F/10M | 0.05 | 1F/6M | 2F/3M | 0.31 |
| Education level (years) | 12.8 (4.1) [5, 17] | 13.6 (4.1) [5, 21] | 0.25 | 12.3 (4.2) [5, 17] | 11 (4.2) [5, 17] | 0.69 |
| Handedness (right (R)/left (L)/ambidextrous (A)) | 11 R/1A | 22R/3L | 0.17 | 6 R/1A | 5 R | 0.38 |
| Time since onset | 589 (588.9) days [3 months, 4 years 11 months] | – | – | 527 (647.2) days [3 months, 4 years 11 months] | 675 (556.1) days [3 months, 3 years 8 months] | 0.69 |
| Normalized volume of overall lesions (mm3) | 516.8 (265.2) [30, 982] | – | – | 679.6 (160.7) [538, 982] | 289 (208.5) [30, 605] | 0.005 |
Table 2
Median [min, max] results of the standard neuropsychological assessment.
MannWhitney tests were used to compare the groups.
| Tasks | Subtests | Patients N = 12 | Controls N = 25 | P value |
|---|---|---|---|---|
| MEMORY | ||||
| FCSRT - verbal | - Delayed total recall/16 - Recognition/48 | 10.0 (1, 16) 44.5 (5, 48) | 16.0 (15, 16) 48.0 (47, 48) | <0.01 <0.01 |
| Logical memory - verbal | - Delayed recall (30 min)/50 - Recognition/30 | 16.5 (3, 37) 24.0 (16, 28) | 38.0 (24, 46) 28.0 (23, 30) | <0.0001 <0.01 |
| Rey figure - visual | - Delayed recall (2 min)/36 | 19.8 (3, 32) | 27.0 (17, 34) | 0.053 |
| DMS 48 - visual | -Delayed forced-choice recognition (60 min)/48 | 47.5 (44, 48) | 47.0 (38, 48) | 0.36 |
| EXECUTIVE FUNCTIONS | ||||
| Auditory-verbal span - Ss | 8.0 (4, 14) | 13.0 (9, 18) | <0.01 | |
| Visuospatial span (n = 11) - Ss | 11.0 (5, 16) | 13.0 (9, 19) | <0.05 | |
| Digit symbol - Ss | 9.5 (5, 12) | 12.0 (8, 18) | <0.01 | |
| Stroop | - Errors | 0 [0, 6] | 0 [0, 4] | 0.33 |
| Literal fluency (p) | - Number of words in 2 min | 15.5 (8, 23) | 26.0 (11, 42) | <0.0001 |
| Semantic fluency (animals) | - Number of words in 2 min | 22.5 (16, 40) | 42.0 (32, 61) | <0.0001 |
| LANGUAGE | ||||
| Confrontation naming/36 | 33.5 (26, 36) | 36.0 (35, 36) | <0.001 | |
| BEHAVIOUR | ||||
| Starkstein Apathy Scale/42 | 9.5 [0, 18] | 8.0 (1, 19) | 0.33 | |
| Beck Depression Inventory | 3.0 [0, 8] | 2.0 [0, 13] | 0.55 | |
| State-trait anxiety/80 (n = 11) | 38.0 (28, 51) | 40.0 (23, 57) | 0.69 | |
-
Note. Ss = scaled score. n = 11 indicates that one of the patient did not undergo this task.
Additional files
-
Supplementary file 1
Raw data (recognition tasks and neuropsychological assessment) for all the patients and healthy controls.
- https://doi.org/10.7554/eLife.28141.011
-
Supplementary file 2
Patterns of lesions for both intact and damaged subgroups.
The normalized volumes of the lesions are expressed in mm3. The extent of the lesions within the main thalamic nucleus groups (medial, lateral, anterior, posterior), subgroups (mediodorsal, intralaminar, midline) and individual nuclei (magnocellular MD, MDpc) is expressed as a percentage of volume loss according to Morel’s atlas. MTT volume loss is expressed as a percentage, according to Morel’s atlas. MTT volume is expressed as a z score compared with control participants.
- https://doi.org/10.7554/eLife.28141.012
-
Transparent reporting form
- https://doi.org/10.7554/eLife.28141.013
Download links
A two-part list of links to download the article, or parts of the article, in various formats.
Downloads (link to download the article as PDF)
Open citations (links to open the citations from this article in various online reference manager services)
Cite this article (links to download the citations from this article in formats compatible with various reference manager tools)
Medial thalamic stroke and its impact on familiarity and recollection
eLife 6:e28141.
https://doi.org/10.7554/eLife.28141


