Infants are superior in implicit crossmodal learning and use other learning mechanisms than adults
- University of Hamburg, Germany
- University of Bielefeld, Germany
Figures
Figure 1
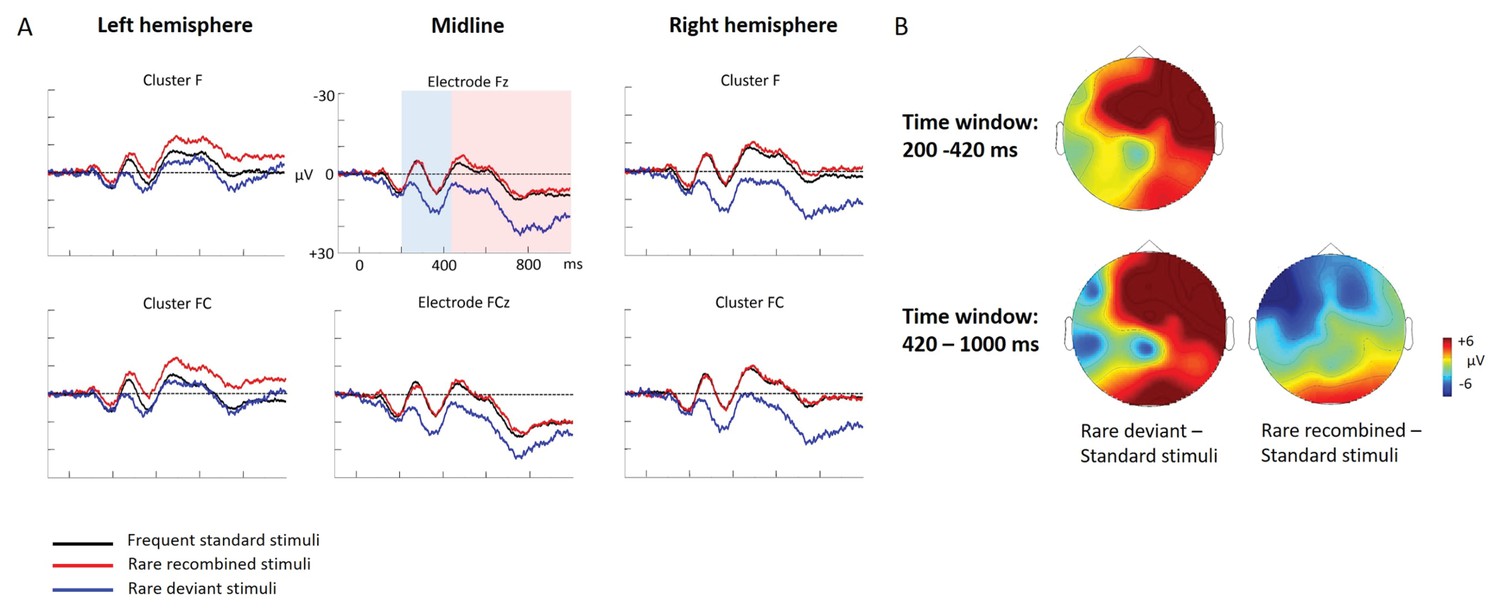
Grand average ERPs of Experiment 1a.
(A) ERPs to the three conditions (‘Frequent standard stimuli’, ‘Rare recombined stimuli’, ‘Rare deviant stimuli’) are superimposed for the electrode clusters F and FC, and the electrodes Fz and FCZ. The analyzed time epochs are marked in blue (200–420 ms) and red (420–1000 ms). (B) The topographical distribution of the difference between ‘Rare deviant stimuli’ minus ‘Frequent standard stimuli’ and ‘Rare recombined stimuli’ minus ‘Frequent standard stimuli’ for the first and second time window.
Figure 2
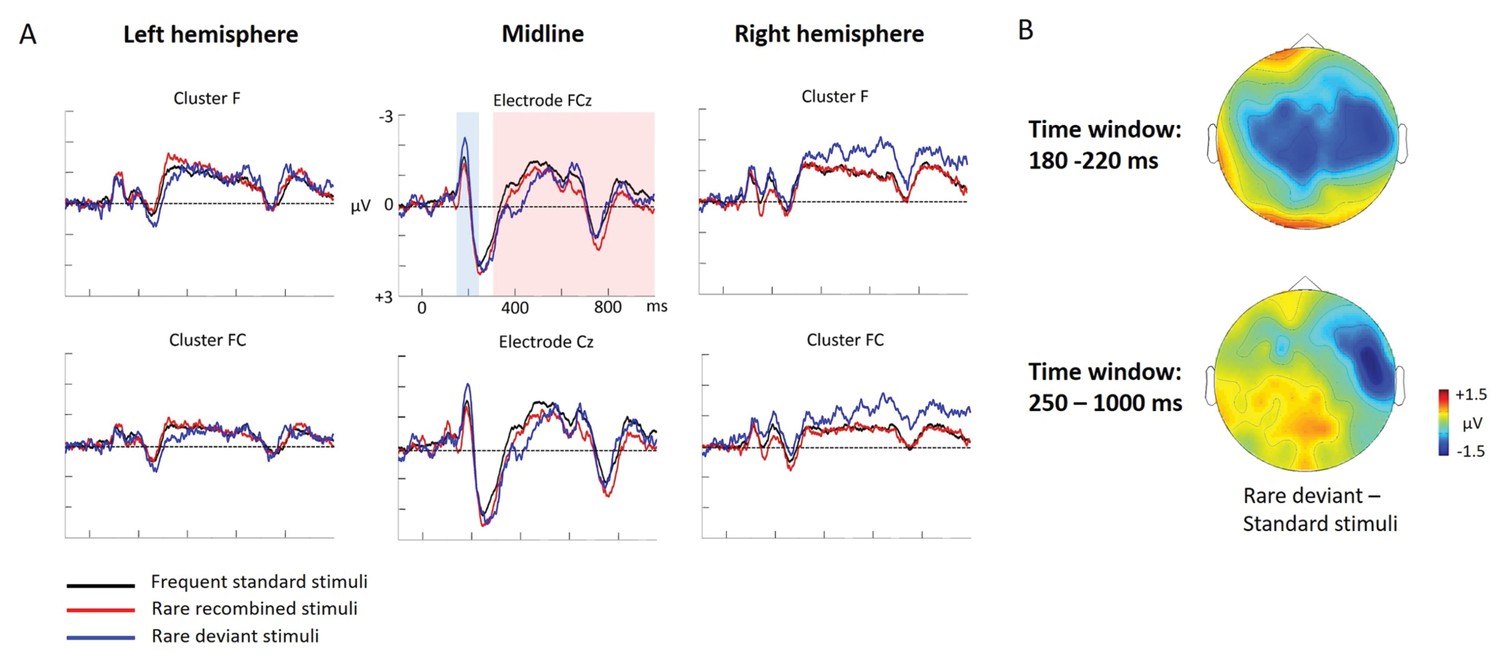
Grand average ERPs of Experiment 1b.
(A) ERPs to the three conditions (‘Frequent standard stimuli’, ‘Rare recombined stimuli’, ‘Rare deviant stimuli’) are superimposed for the electrode clusters F and FC, and the electrodes FCz and Cz. The analyzed time epochs are marked in blue (180–220 ms) and red (420–1000 ms). (B) The topographical distribution of the difference between ‘Rare deviant stimuli’ minus ‘Frequent standard stimuli’ for the first and second time window.
Figure 3
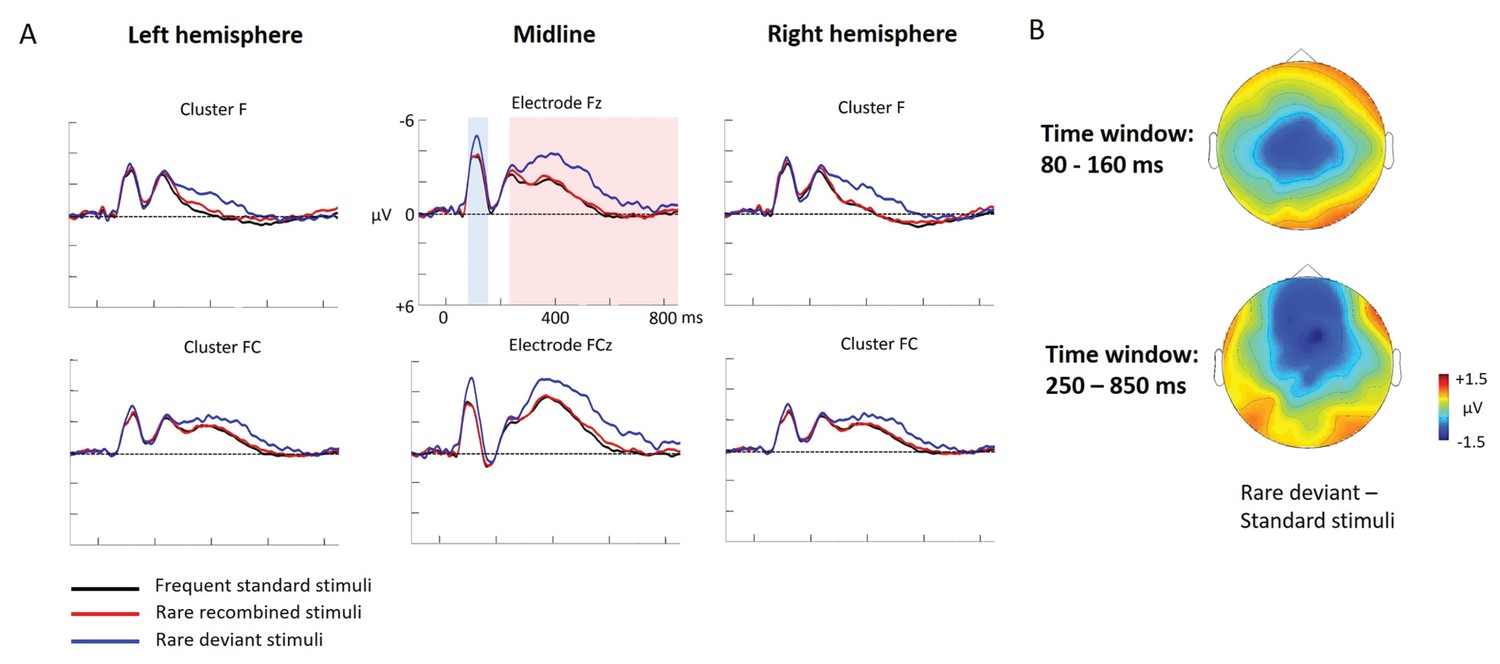
Grand average ERPs of Experiment 2a.
(A) ERPs to the three conditions (‘Frequent standard stimuli’, ‘Rare recombined stimuli’, ‘Rare deviant stimuli’) are superimposed for the electrode clusters F and FC, and the electrodes Fz and FCZ. The analyzed time epochs are marked in blue (80–160 ms) and red (250–850 ms). (B) The topographical distribution of the difference between ‘Rare deviant stimuli’ minus ‘Frequent standard stimuli’ for the first and second time window.
Figure 4
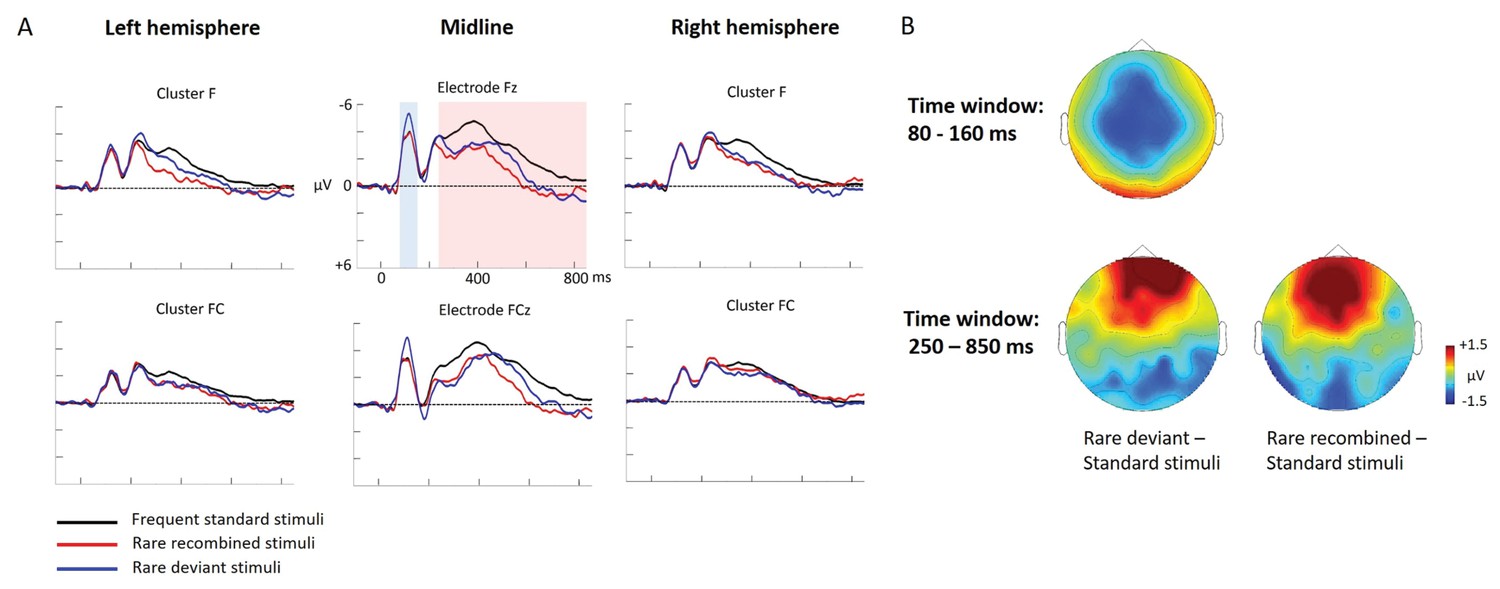
Grand average ERPs of Experiment 2b.
(A) ERPs to the three conditions (‘Frequent standard stimuli’, ‘Rare recombined stimuli’, ‘Rare deviant stimuli’) are superimposed for the electrode clusters F and FC, and the electrodes Fz and FCZ. The analyzed time epochs are marked in blue (80–160 ms) and red (250–850 ms). (B) The topographical distribution of the difference ‘Rare deviant stimuli’ minus ‘Frequent standard stimuli’ and ‘Rare recombined stimuli’ minus ‘Frequent standard stimuli’ for the first and second time window.
Figure 5
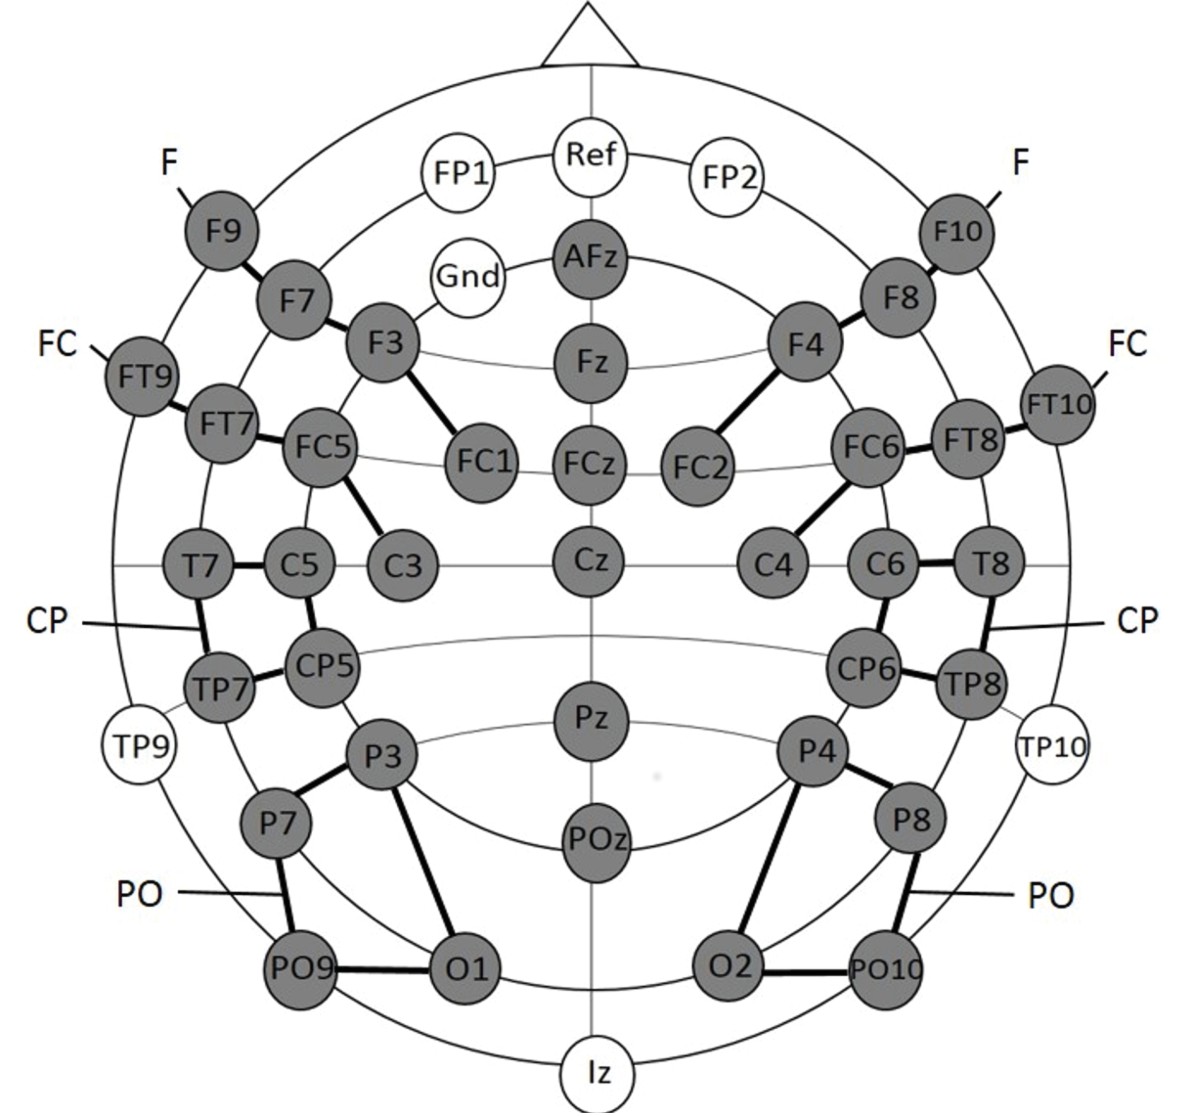
Electrode placement for experiment 1a.
The grey electrodes were included in the statistical analyses. Clusters are indicated by black connecting lines and were named according to their location along the anterior-posterior axis.
Figure 6
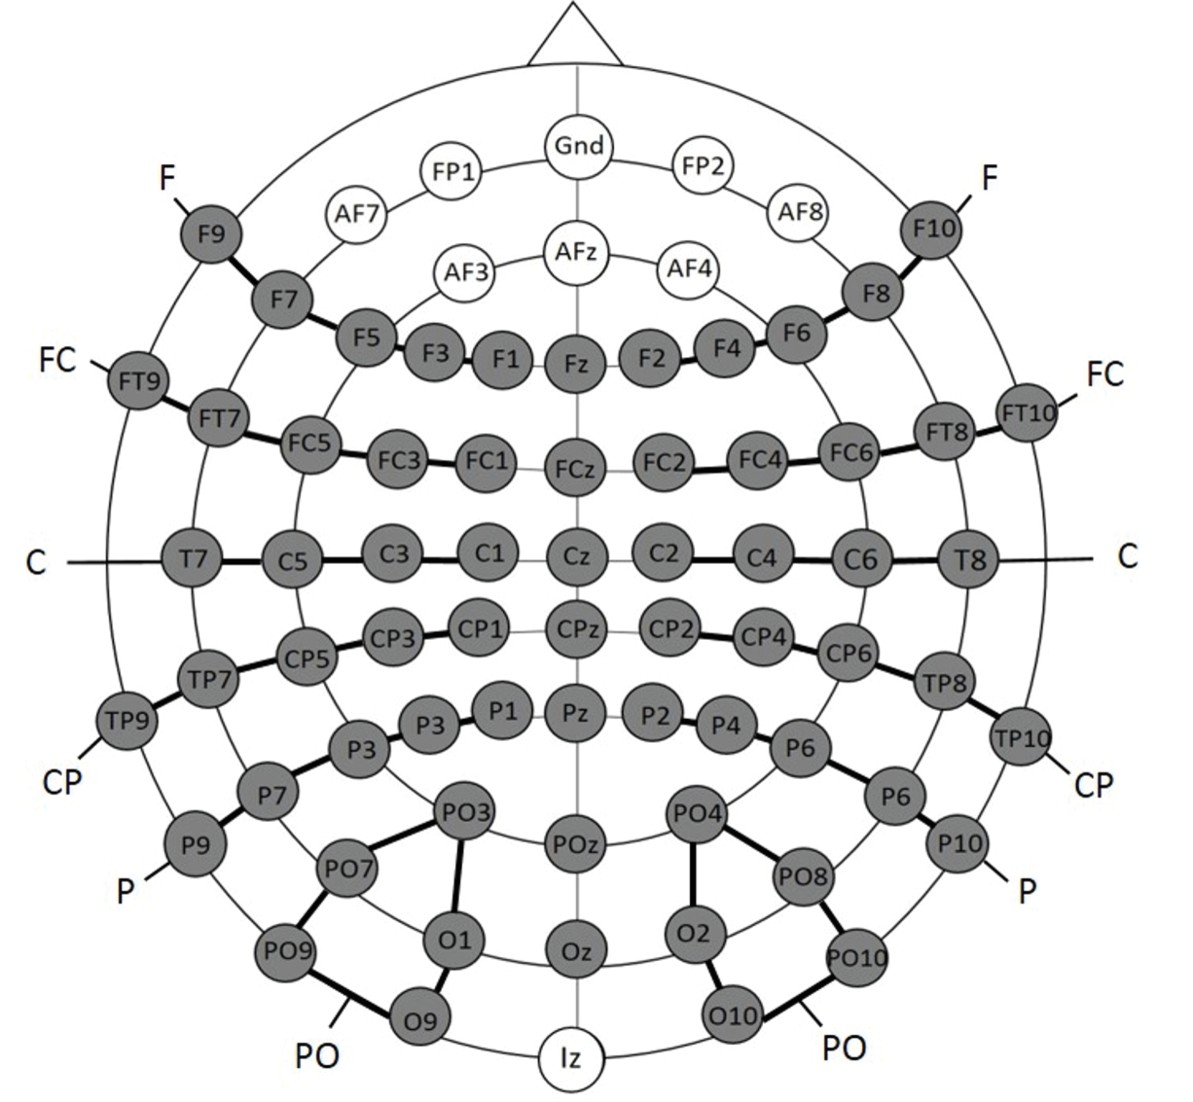
Electrode placement for Experiment 2a and 2b; the grey electrodes were included in the statistical analyses.
Clusters are indicated by black connecting lines and were named according to their location along the anterior-posterior axis.
Tables
Table 1
Mean (±SEM) of reaction times (in ms), hit rates (in %), misses (in %), and false alarms (in %) to the target stimuli of Experiment 2a and Experiment 2b.
https://doi.org/10.7554/eLife.28166.005| RT (ms) | Hits (%) | Misses (%) | False alarms (%) | |
|---|---|---|---|---|
| Experiment 2a | 391 ± 17.5 | 99.4 ± 0.3 | 0.34 ± 0.18 | 0.63 ± 0.25 |
| Experiment 2b | 535 ± 27.5 | 96.6 ± 1.6 | 3.4 ± 1.6 | 15.55 ± 6.95 |
Table 2
Summary of the main results and topographical distributions of the two effects of interest.
(a) ‘Rare deviant stimuli’ minus ‘Frequent standard stimuli’ and (b) ‘Rare recombined stimuli’ minus ‘Frequent Standard stimuli’) in Experiment 1a, 1b, 2a and 2b. Electrodes and electrode clusters with significant differences between the experimental conditions are marked with black asterisks, comparisons with no significant differences are indicated by n.s..
| Early time window | Late time window | |||
|---|---|---|---|---|
| Rare deviant - Standard stimuli | Rare recombined - Standard stimuli | Rare deviant - Standard stimuli | Rare recombined- Standard stimuli | |
Experiment 1a (Infants)  | 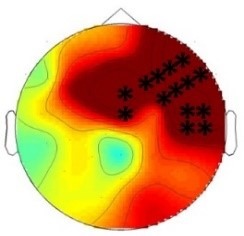 200 – 420 ms | n.s. | 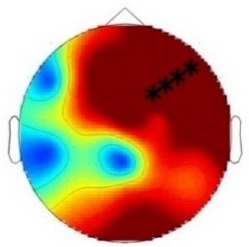 420 – 1000 ms | 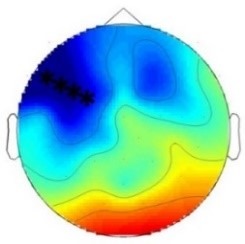 420 – 1000 ms |
Experiment 1b (Adults) 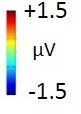 | 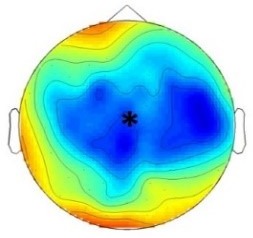 180 – 220 ms | n.s. |  250 – 1000 ms | n.s. |
Experiment 2a (Adults)  | 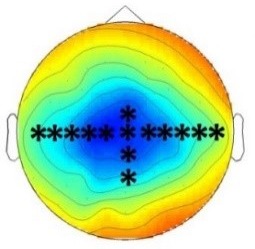 80 – 160 ms | n.s. | 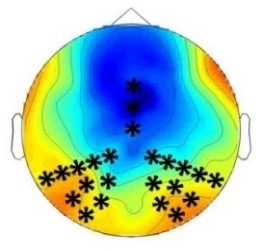 250 – 850 ms | n.s. |
Experiment 2b (Adults)  | 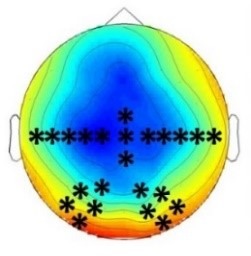 80 – 160 ms | n.s. | 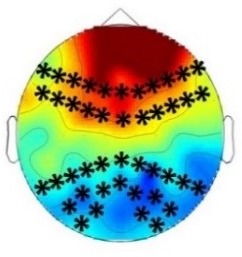 250 – 850 ms | 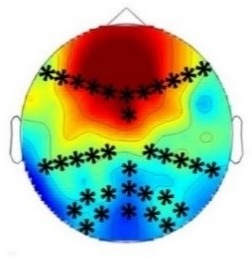 250 – 850 ms |
Table 3
Experimental design of Experiment 1a and Experiment 1b.
https://doi.org/10.7554/eLife.28166.009| Stimuli | Proportion | Condition (number of trials) |
|---|---|---|
| Auditory 1 – Visual 1 (A1V1) Auditory 2 – Visual 2 (A2V2) | Frequent standard stimuli (210) | |
| Auditory 1 – Visual 2 (A1V2) Auditory 2 – Visual 1 (A2V2) | Rare recombined stimuli (60) | |
| Auditory 3 – Visual 3 (A3V3) | Rare deviant stimuli (30) |
Table 4
Experimental design of (A) Experiment 2a and (B) Experiment 2b.
https://doi.org/10.7554/eLife.28166.011| A | Stimuli | Proportion | Condition (number of trials) |
|---|---|---|---|
| Auditory 1 – Visual 1 (A1V1) Auditory 2 – Visual 2 (A2V2) | Frequent standard stimuli (720) | ||
| Auditory 1 – Visual 2 (A1V2) Auditory 2 – Visual 1 (A2V2 | Rare recombined stimuli (240) | ||
| Auditory 3 – Visual 3 (A3V3) | Rare deviant stimuli (120) | ||
| Visual 4 | Unimodal target stimuli (120) |
| B | Stimuli | Proportion | Condition (number of trials) |
|---|---|---|---|
| Auditory 1 – Visual 1 (A1V1) Auditory 2 – Visual 2 (A2V2) | Frequent standard stimuli (840) | ||
| Auditory 1 – Visual 2 (A1V2) Auditory 2 – Visual 1 (A2V2 | Rare recombined stimuli (120)/ Target stimuli (120) | ||
| Auditory 3 – Visual 3 (A3V3) | Rare deviant stimuli (120) |
Additional files
-
Transparent reporting form
- https://doi.org/10.7554/eLife.28166.013
Download links
A two-part list of links to download the article, or parts of the article, in various formats.
Downloads (link to download the article as PDF)
Open citations (links to open the citations from this article in various online reference manager services)
Cite this article (links to download the citations from this article in formats compatible with various reference manager tools)
Infants are superior in implicit crossmodal learning and use other learning mechanisms than adults
eLife 6:e28166.
https://doi.org/10.7554/eLife.28166


