E3 ubiquitin ligase Bre1 couples sister chromatid cohesion establishment to DNA replication in Saccharomyces cerevisiae
- The University of Hong Kong, China
Figures
Figure 1
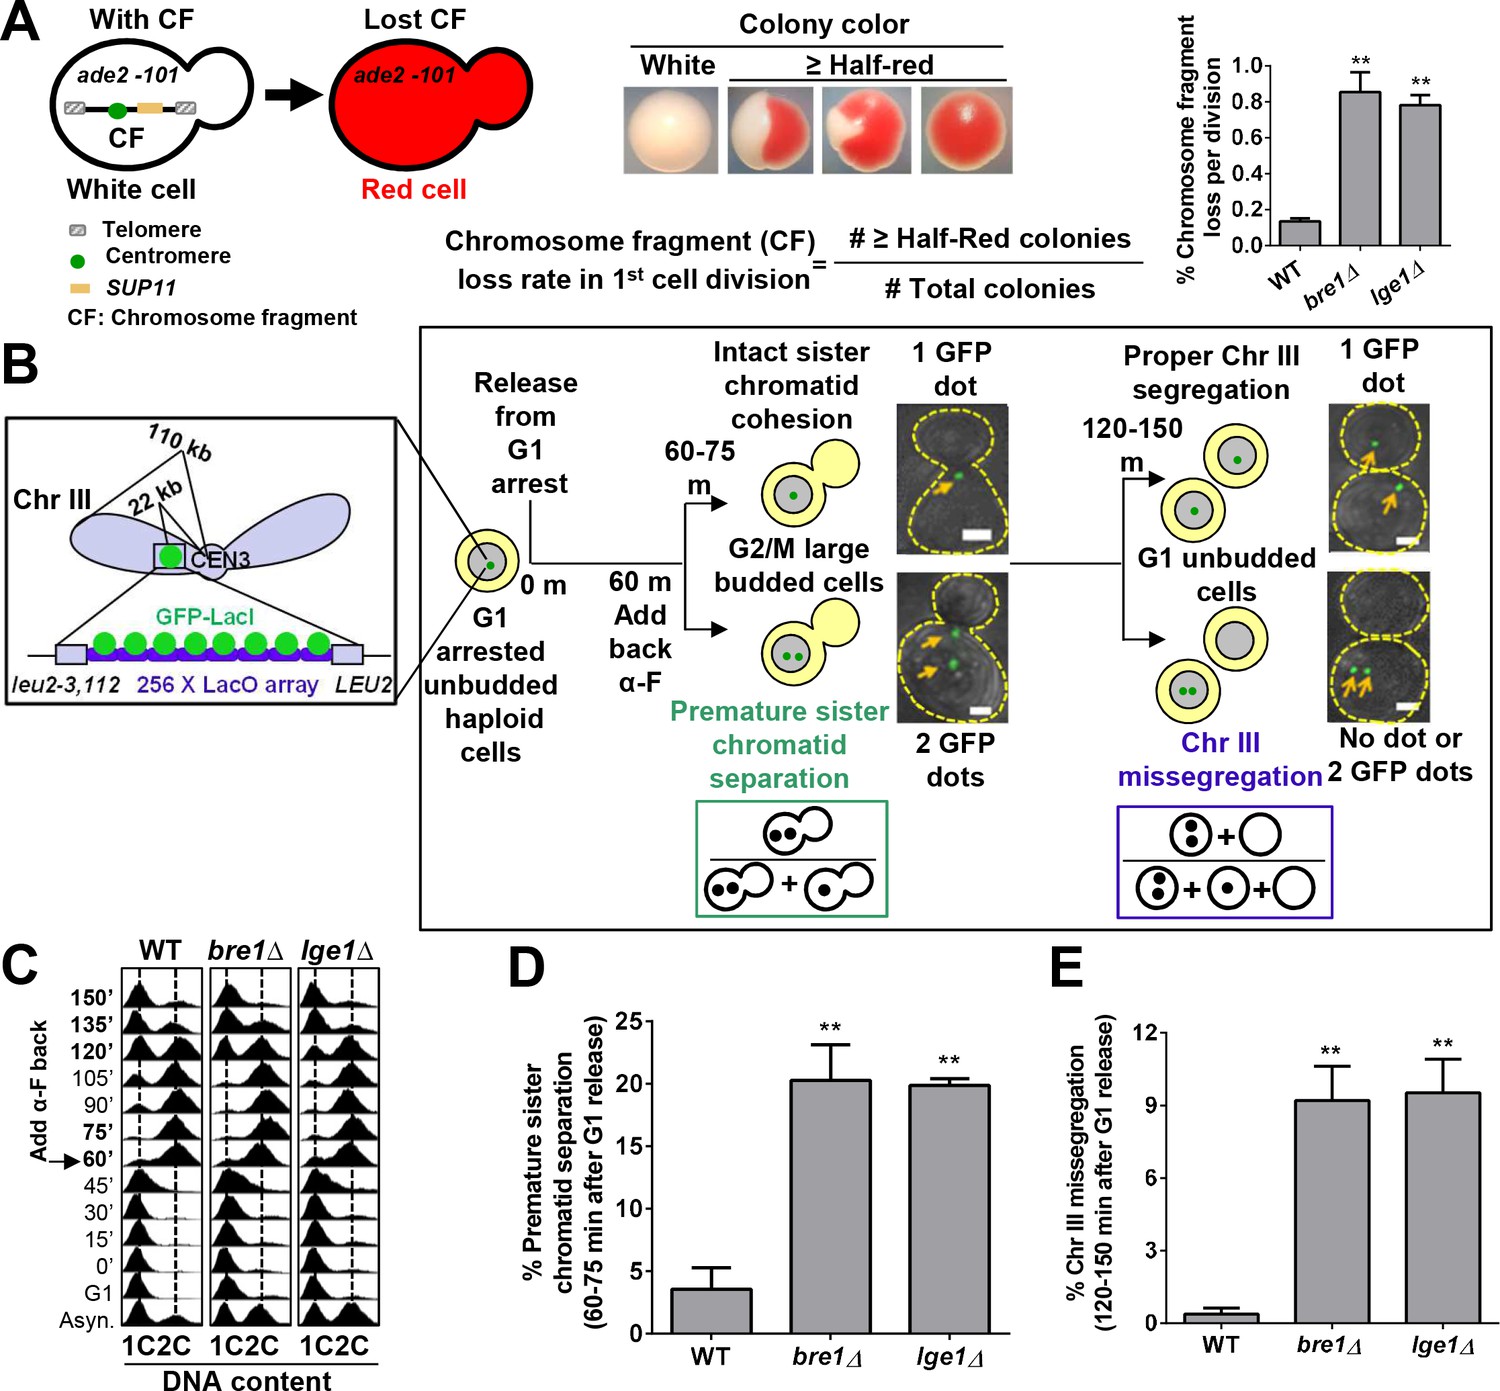
The E3 ubiquitin ligase Bre1 and its interacting protein Lge1 are required for accurate chromosome segregation and sister chromatid cohesion.
(A) Chromosome transmission fidelity (CTF) phenotype was evaluated by the colony color-sectoring assay. Chromosome fragment (CF) loss rates in the first cell division in wild-type (WT), bre1Δ and lge1Δ were quantified by the number of half-red and more than half-red colonies divided by the total number of colonies. At least 2000 cells were scored in each experiment. The data shown represent the average of three independent experiments. Error bars, standard errors of the mean (SEM). Statistical significance was calculated by Student's t-test. Significant differences with WT are indicated by asterisks (**p<0.01). (B) Schematic diagram and flowchart of the sister chromatid cohesion assay and chromosome segregation assay examining GFP–Lac repressor (GFP–LacI) binding to Lac operator (LacO) integrated at 22 kb from centromere 3 (CEN3). MATa haploid yeast cells containing LacO and GFP–LacI in early log phase were arrested in G1 with alpha factor (α-F) and then released into YPD medium. α-F was added back at 60 min after release from G1 arrest to re-arrest cells at G1 phase in the next cell cycle. Samples were collected every 15 min for fluorescence-activated cell-sorting (FACS) analysis of DNA content and GFP fluorescence imaging. Representative fluorescent and bright field images were superimposed. Scale bar, 1 µm. Cells at 60–75 min after release from G1 arrest had large buds, and FACS showed that they were at G2/M phase. Sister chromatid cohesion was assessed. If sister chromatids had cohesion, only one GFP focus was observed. If they prematurely separated, two GFP foci were observed. The frequency of sister chromatid premature separation was calculated by the number of G2/M cells containing two GFP foci divided by the total number of G2/M cells. Most of the cells at 120–150 min after release from G1 arrest had no bud, suggesting that they had completed cytokinesis. They were assessed for chromosome segregation. Cells with more or less than one GFP focus had missegregated Chromosome III (ChrIII). The ratio of ChrIII missegregation was calculated by the number of G1 cells containing no GFP focus and two GFP foci divided by the total number of unbudded G1 cells. (C) Cell cycle progression of WT, bre1Δ and lge1Δ used in Figure 1B. Cells were arrested in G1 by alpha-factor (α-F) for 3 hr. Cells were washed and released into YPD medium. α-F was added back to the culture at 60 min post G1 release to restrict cells at G1 in the next cell cycle. Samples were collected every 15 min, and stained with propidium iodide for FACS analyses. (D) Frequency of sister chromatid premature separation in large budded cells at 60–75 min after release from G1 arrest in WT, bre1Δ and lge1Δ strains. At least 100 cells were scored for each sample. The data shown represent the average of three independent experiments. Error bars, SEM. Statistical analysis was performed using Student's t-test. Asterisks indicate significant differences from WT (**p<0.01). (E) Frequency of ChrIII missegregation in unbudded cells at 120–150 min after release from G1 arrest in WT, bre1Δ and lge1Δ strains. At least 100 cells were scored for each sample. The data shown represent the average of three independent experiments. Error bars, SEM. Statistical analysis was performed using Student's t-test. Asterisks indicate significant differences from WT (**p<0.01).
Figure 2 with 1 supplement
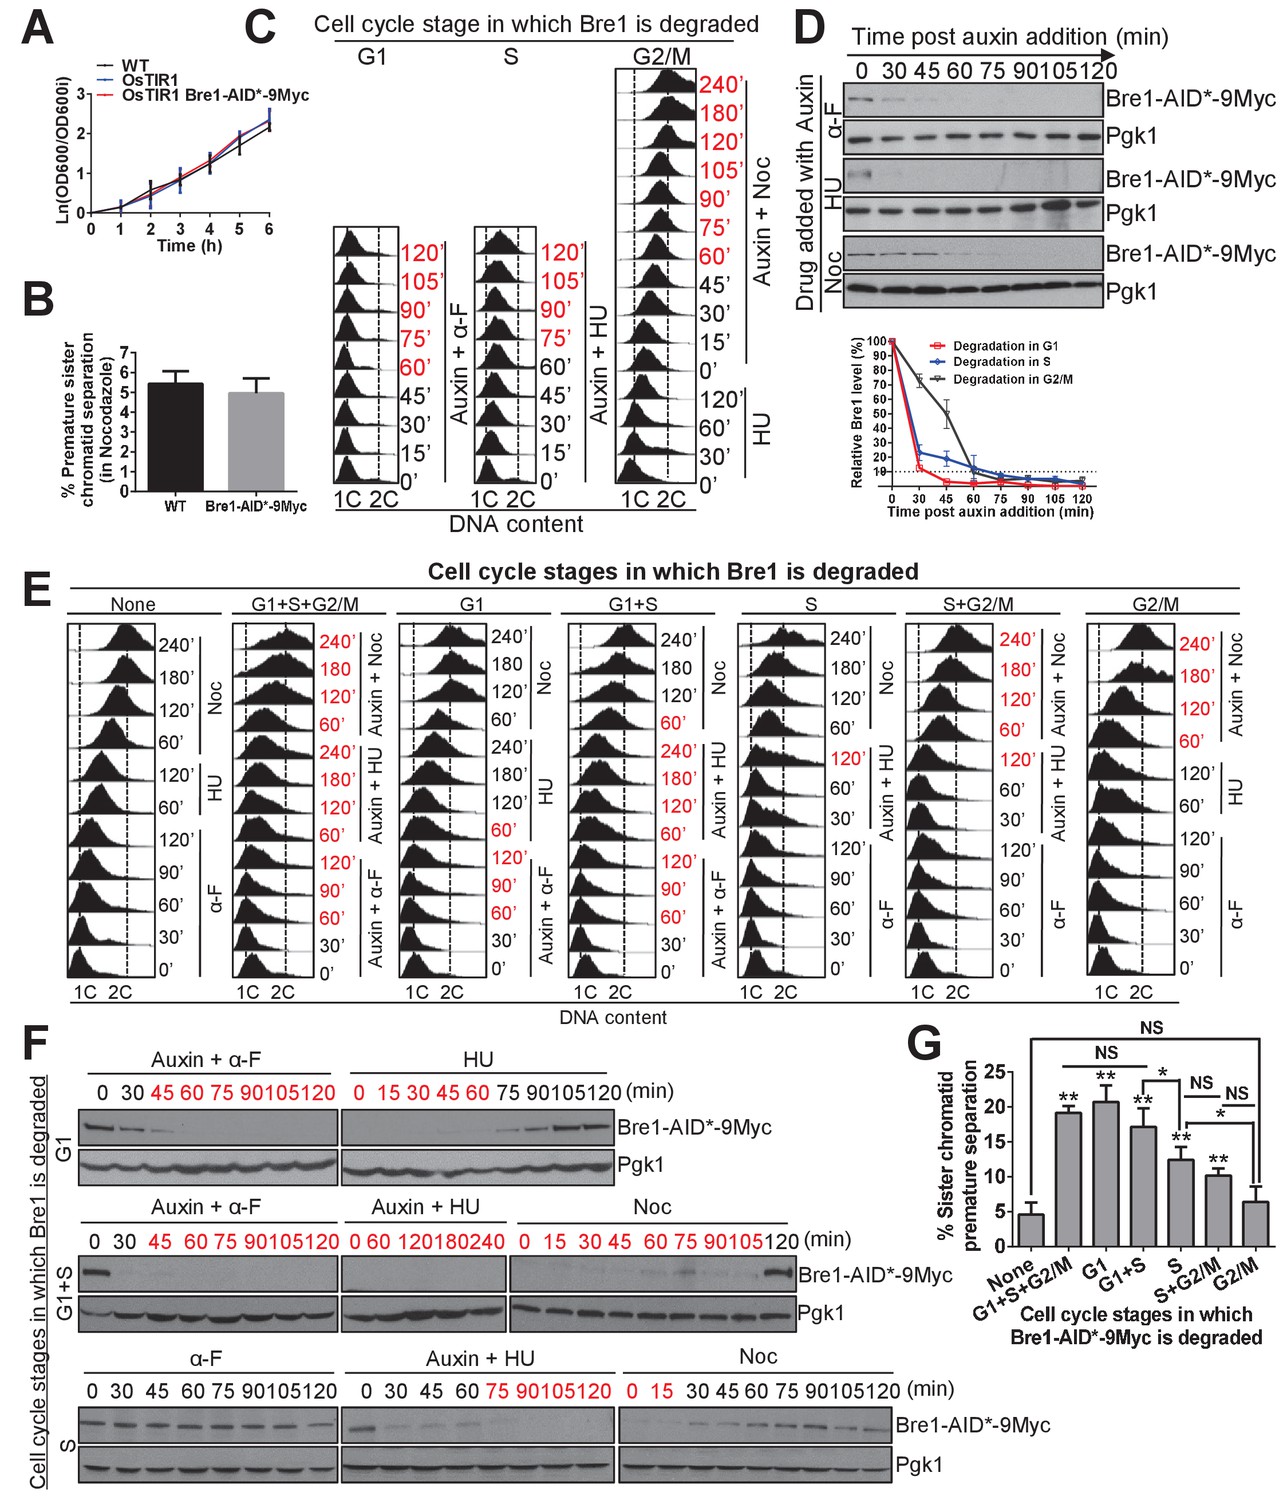
The function of Bre1 in G1 and S phase is important for sister chromatid cohesion.
(A) Growth curve for the untagged wild-type (WT), OsTIR1 and OsTIR1 Bre1-AID*−9Myc strains. Early log phase cells were diluted to OD600 = 0.1. The OD600 was measured every 1 hr for 6 hr. The ln of the OD600/OD600i (OD600i = OD600 at ‘0’ h) was calculated and plotted in the graph. (B) Frequency of sister chromatid premature separation in G2/M phase in WT and Bre1-AID*−9Myc cells. At least 100 cells were scored for each sample. Error bar represents SEM from three independent experiments. Statistical significance was analyzed by Student’s t-test between WT and Bre1-AID*−9Myc. (C) Depletion of Bre1 in G1-, S- and G2/M-arrested cells through auxin-dependent degradation. Cells containing Bre1-AID*−9Myc were first arrested in G1 with α-F for 3 hr and washed with water and release. Next, to induce Bre1 degradation in G1 or S phase, 1 mM auxin was added to medium containing α-F or HU for 2 hr, respectively. To induce Bre1 degradation in G2/M phase, cells from G1 arrest was released into HU-containing medium for 2 hr, and then released into Noc-containing media with the addition of 1 mM auxin for 4 hr. Samples were collected every 15 min for FACS analyses and western blotting analyses (D). The time point at which > 90% Bre1 protein is degraded (from [D]) is highlighted in red. (D) Western blotting analysis of the protein level of Bre1-AID*−9Myc after auxin induction in different cell-cycle-arrested stages using anti-Myc antibody. Pgk1 served as the loading control. Quantitative analysis of the relative levels of Bre1-AID*−9Myc levels over time (normalized to loading control) at the indicated time points (100% at time 0 min post auxin addition) from three independent experiments were analyzed using Image J software and plotted. Error bars represent SEM of the mean. The dashed line indicates when 90% of the Bre1 protein is degraded. (E) FACS analysis of DNA contents at the indicated time points in the cell-cycle-specific auxin-induced Bre1 degradation and cohesion experiment in (G). According to (D), the time points after the initiation of auxin treatment at which > 90% of the Bre1 protein is degraded, and according to (F), the samples that are in recovery (>90% Bre1 protein is degraded) are highlighted in red. (F) Degradation and recovery of Bre1-AID*−9Myc in which Bre1 is degraded in G1 only, in G1 and S, or in S only. Western blotting analyses of the protein level of Bre1-AID*−9Myc after auxin induction in different cell cycle-arrested stages, and after auxin removal, using anti-Myc antibody. Pgk1 served as the loading control. The time points in degradation or recovery at which > 90% Bre1 protein is degraded are highlighted in red. (G) Frequency of sister chromatid premature separation in G2/M phase after Bre1 is degraded during the indicated cell-cycle stages. At least 100 cells were scored for each sample. Error bars represents SEM from three independent experiments. Statistical significance was analyzed by Student’s t-test between no degradation control and degradation at different stages, or between each of the indicated degradation stages. **p<0.01; * p<0.05; NS, no significant difference among the indicated degradation stages.
Figure 2—figure supplement 1
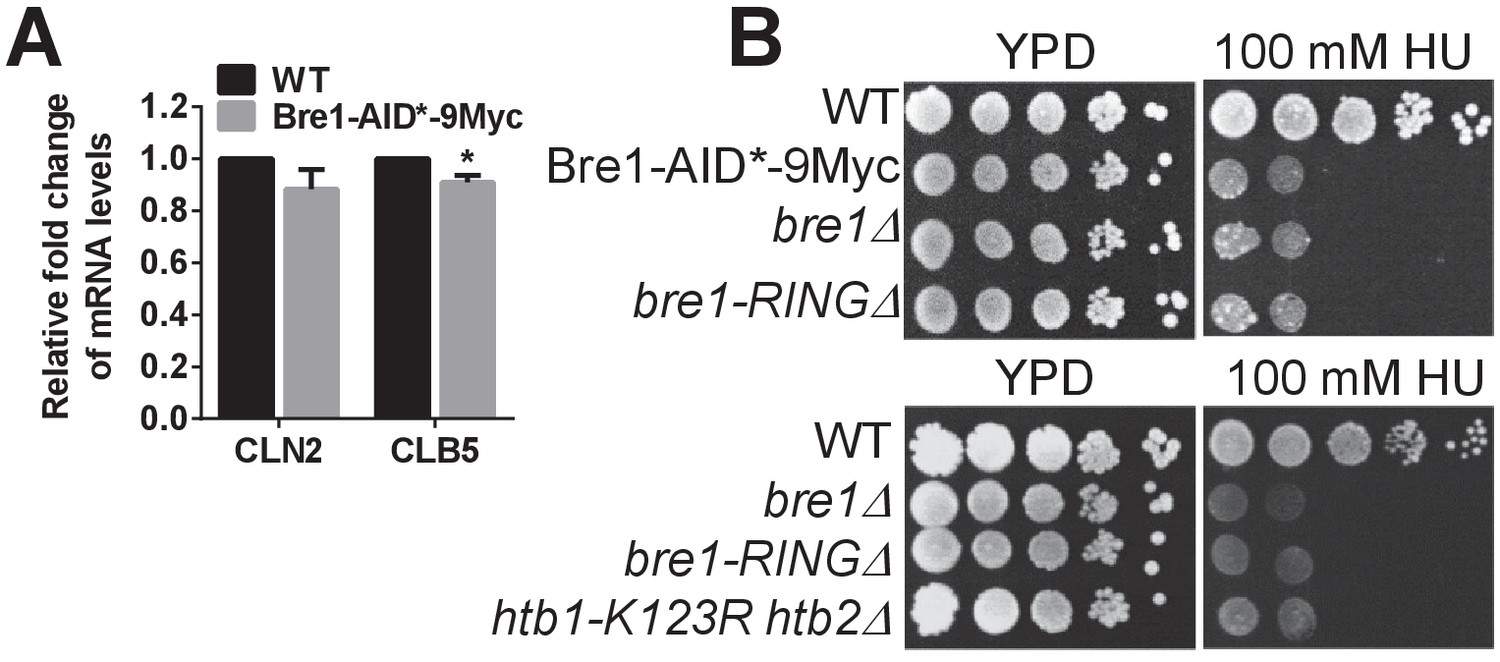
Characterization of Bre1-AID*−9Myc function.
(A) Quantification of the mRNA levels of G1-S transition-specific transcripts CLN2 and CLB5 (Zimmermann et al., 2011) in wild-type (WT) and Bre1-AID*−9Myc strains by q-PCR. Three experiments were performed. Error bars represents SEM from three independent experiments. Statistical significance was analyzed by Student’s t-test. *p<0.05. (B) Hydroxyurea (HU) sensitivity of WT, Bre1-AID*−9Myc, bre1Δ, bre1-RINGΔ and htb1-K123R htb2∆ mutant strains at 100 mM HU. Bre1-AID*−9Myc is as sensitive as bre1Δ, and bre1-RINGΔ, suggesting that the -terminal AID*−9Myc tag may disrupt some of Bre1’s function in responding to replicative stress.
Figure 3 with 2 supplements
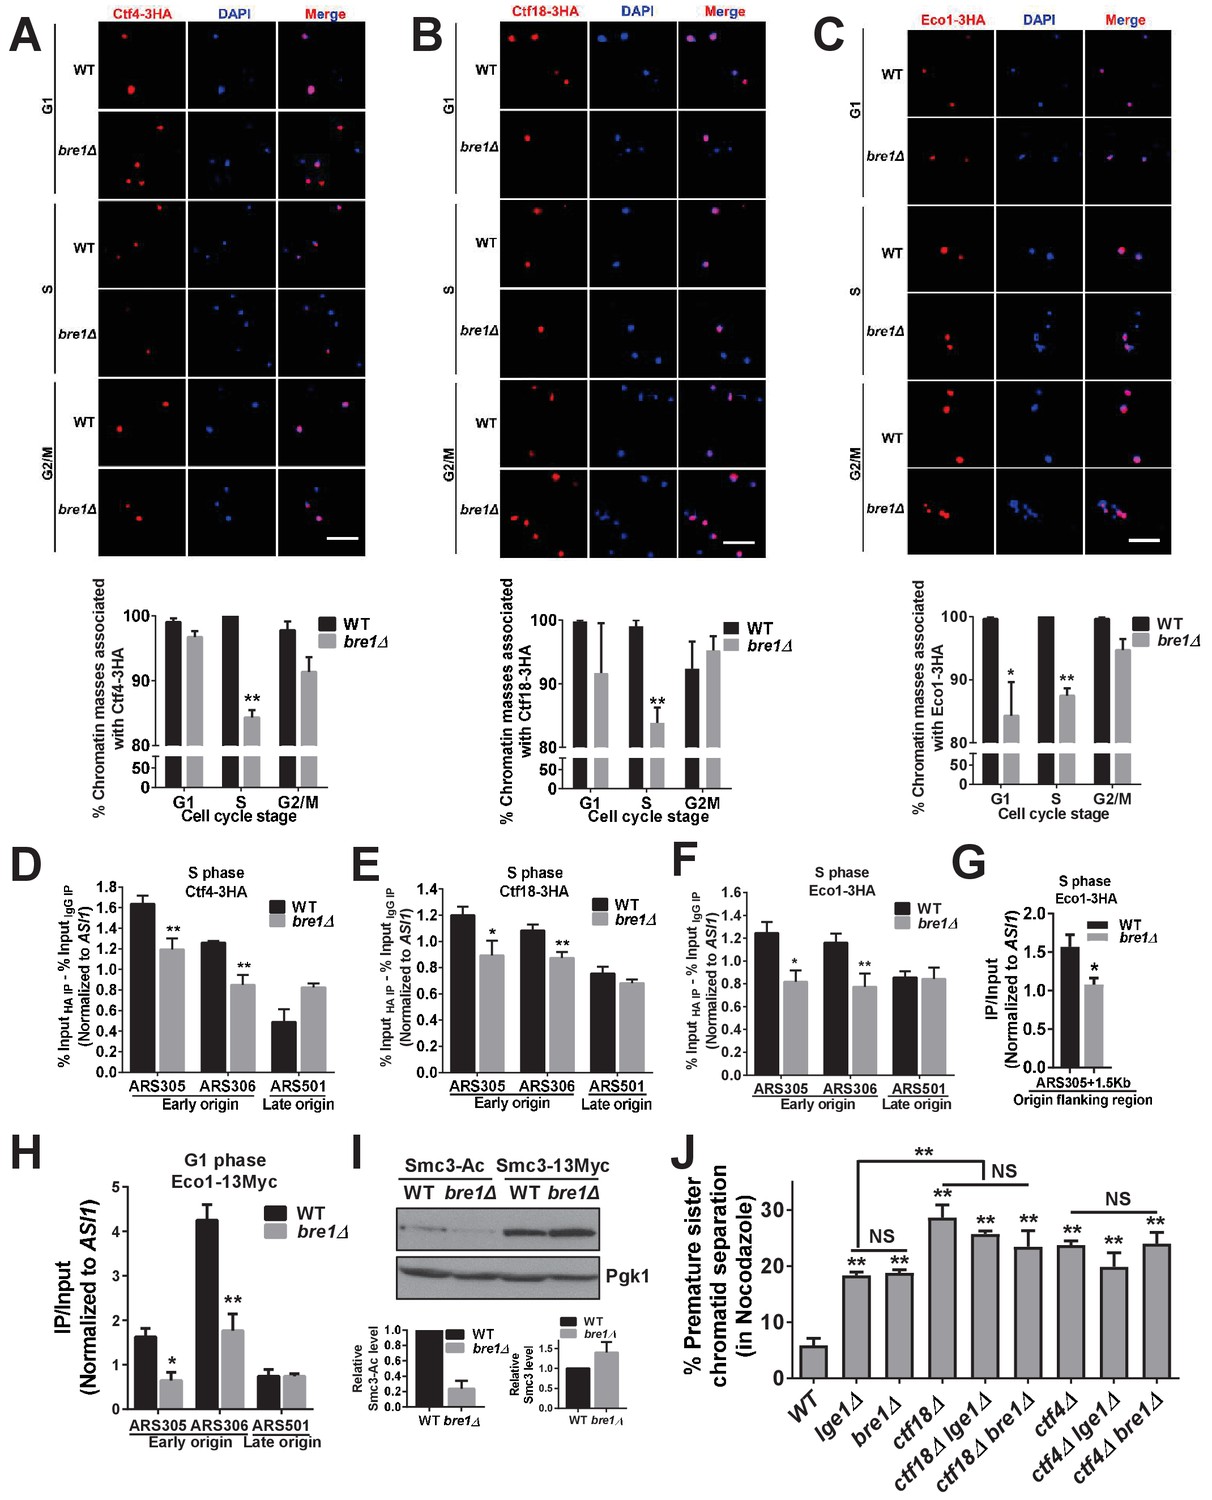
Bre1 recruits cohesion establishment factors Ctf4, Ctf18 and Eco1 to chromatin and replication early origins, and promotes the acetylation of Smc3.
(A–C) Chromatin spreads analysis of the association of Ctf4-3HA (A), Ctf18-3HA (B) and Eco1-3HA (C) with chromatin in G1-, S- and G2/M-arrested cells. The frequencies of chromatin-associated Ctf4-3HA, Ctf18-3HA and Eco1-3HA were quantified. At least 100 chromatin masses were scored. Error bars represent the SEM from three independent experiments. * and ** indicate p<0.05 and p<0.01, respectively, as determined by Student’s t-test. Scale bar, 1 µm. (D–G) Chromatin immunoprecipitation analysis of the occupancy of Ctf18-3HA (D), Ctf4-3HA (E) and Eco1-3HA (F and G) in wild-type (WT) and bre1Δ cells at replication early origins ARS305 and ARS306, late origin ARS501 (D–F) and origin flanking region ARS305 +1.5 kb (G) after arrest of cells in HU for 3 hr. Immunoprecipitation (IP) signals at ARS sequences were normalized to input DNA, and then normalized to that at the non-enriched ASI1 locus. Error bars indicate the SEM from at least three independent experiments. Statistical significance was analyzed by Student’s t-test between WT and mutants. **p<0.01. *p<0.05. (H) Chromatin IP analysis of the occupancy of cohesion factor Eco1-13Myc at replication early origins ARS305 and ARS306 and at late origin ARS501 in α-F-arrested G1-phase WT and bre1Δ cells. IP signals at each ARS were normalized to input DNA, and then normalized to that at the non-enriched ASI1 locus. Error bars represent the SEM from at least three independent experiments. *p<0.05, **p<0.01 by Student’s t-test. (I) Western blotting analysis of whole-cell extract from log phase culture of WT and bre1Δ using anti-acetyl-Smc3 and Smc3-13Myc polyclonal antibody. Smc3-Ac and Smc3 levels were quantified by normalizing to Pgk1, the loading control. (J) Analysis of sister chromatid cohesion in WT, lge1Δ, bre1Δ, ctf4Δ, ctf18Δ, ctf18Δ lge1Δ, ctf18Δ bre1Δ, ctf4Δ lge1Δ and ctf4Δ bre1Δ cells after arrest in G2/M by Noc for 3 hr. The percentage of cells with two GFP signals is shown. At least 100 cells were scored. The results of three independent assays were averaged. The data for WT, lge1Δ and bre1Δ are the same as in Figure 1F, and are shown here for comparison with double mutants. The error bars correspond to the SEM from the mean value. **p<0.01 between WT and corresponding mutant by Student’s t-test. NS stands for no significant difference among the indicated single and double mutants.
Figure 3—figure supplement 1
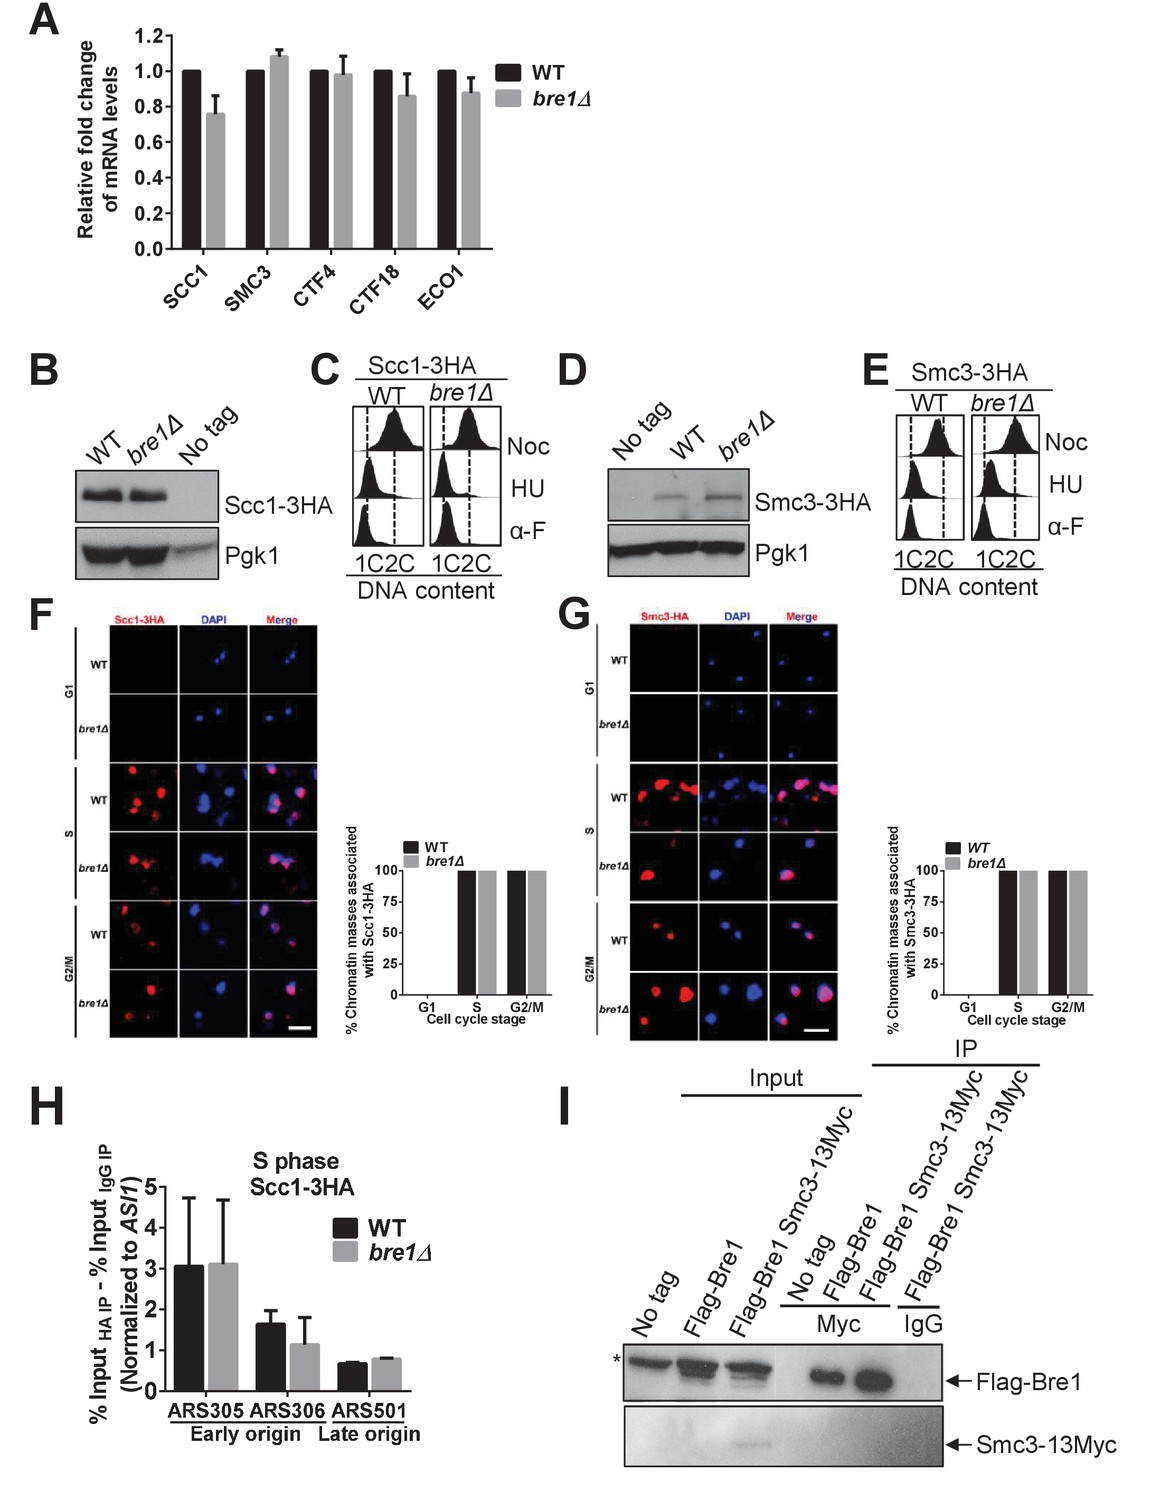
Bre1 is dispensable for cohesin loading.
(A) Quantification of mRNA levels of SCC1, SMC3, CTF4, CTF18 and ECO1 in asynchronous log phase wild-type (WT) and bre1Δ mutants by RT-qPCR. Three experiments were performed. Error bars represent SEM from three independent experiments. Statistical significance was analyzed by Student’s t-test. (B and D) Western blotting analysis of the protein level of Scc1-3HA (B) and Smc3-3HA (D). Whole-cell extracts from early log phase WT and bre1Δ cells expressing 3HA-tagged protein and an untagged WT strain were probed with anti-HA antibody. Pgk1 served as the loading control. (C and E) Fluorescence-activated cell sorter (FACS) analysis of DNA content in WT and bre1Δ cells in Figure 3A & B, expressing Scc1-3HA (C) and Smc3-3HA (E) cells arrested in G1, S and G2/M phases, respectively. (F and G) Scc1-3HA (F) and Smc3-3HA (G) detected by chromatin spread in WT and bre1Δ in the indicated cell-cycle arrest (G1, S and G2/M phase imposed by α-F, HU and Noc for 3 hr, respectively). Scale bar, 1 μm. The frequencies of chromatin-associated Scc1-3HA were quantified. At least 100 chroamtin masses were scored for each sample. Error bars represent the SEM from three independent experiments. (H) Chromatin immunoprecipitation (IP) analysis of Scc1-3HA occupancy in WT and bre1Δ at two early origins (ARS305 and ARS306) and one late origin (ARS501) after HU arrest for 3 hr using anti-HA antibody. IP signals at ARS sequences were normalized to input DNA, and then normalized to signals at the non-enriched ASI1 locus. Error bars indicate the SEM from at least three independent experiments. (I) Co-immunoprecipitation analysis of the interaction between Bre1 and Smc3 in WT cells. Whole-cell extracts prepared from Flag-Bre1 or Flag-Bre1 Smc3-13Myc log phase cells were precipitated with anti-Myc and anti-IgG antibodies. Immunoprecipitates were probed with anti-Myc and anti-Flag antibodies, respectively. *: non-specific band.
Figure 3—figure supplement 2
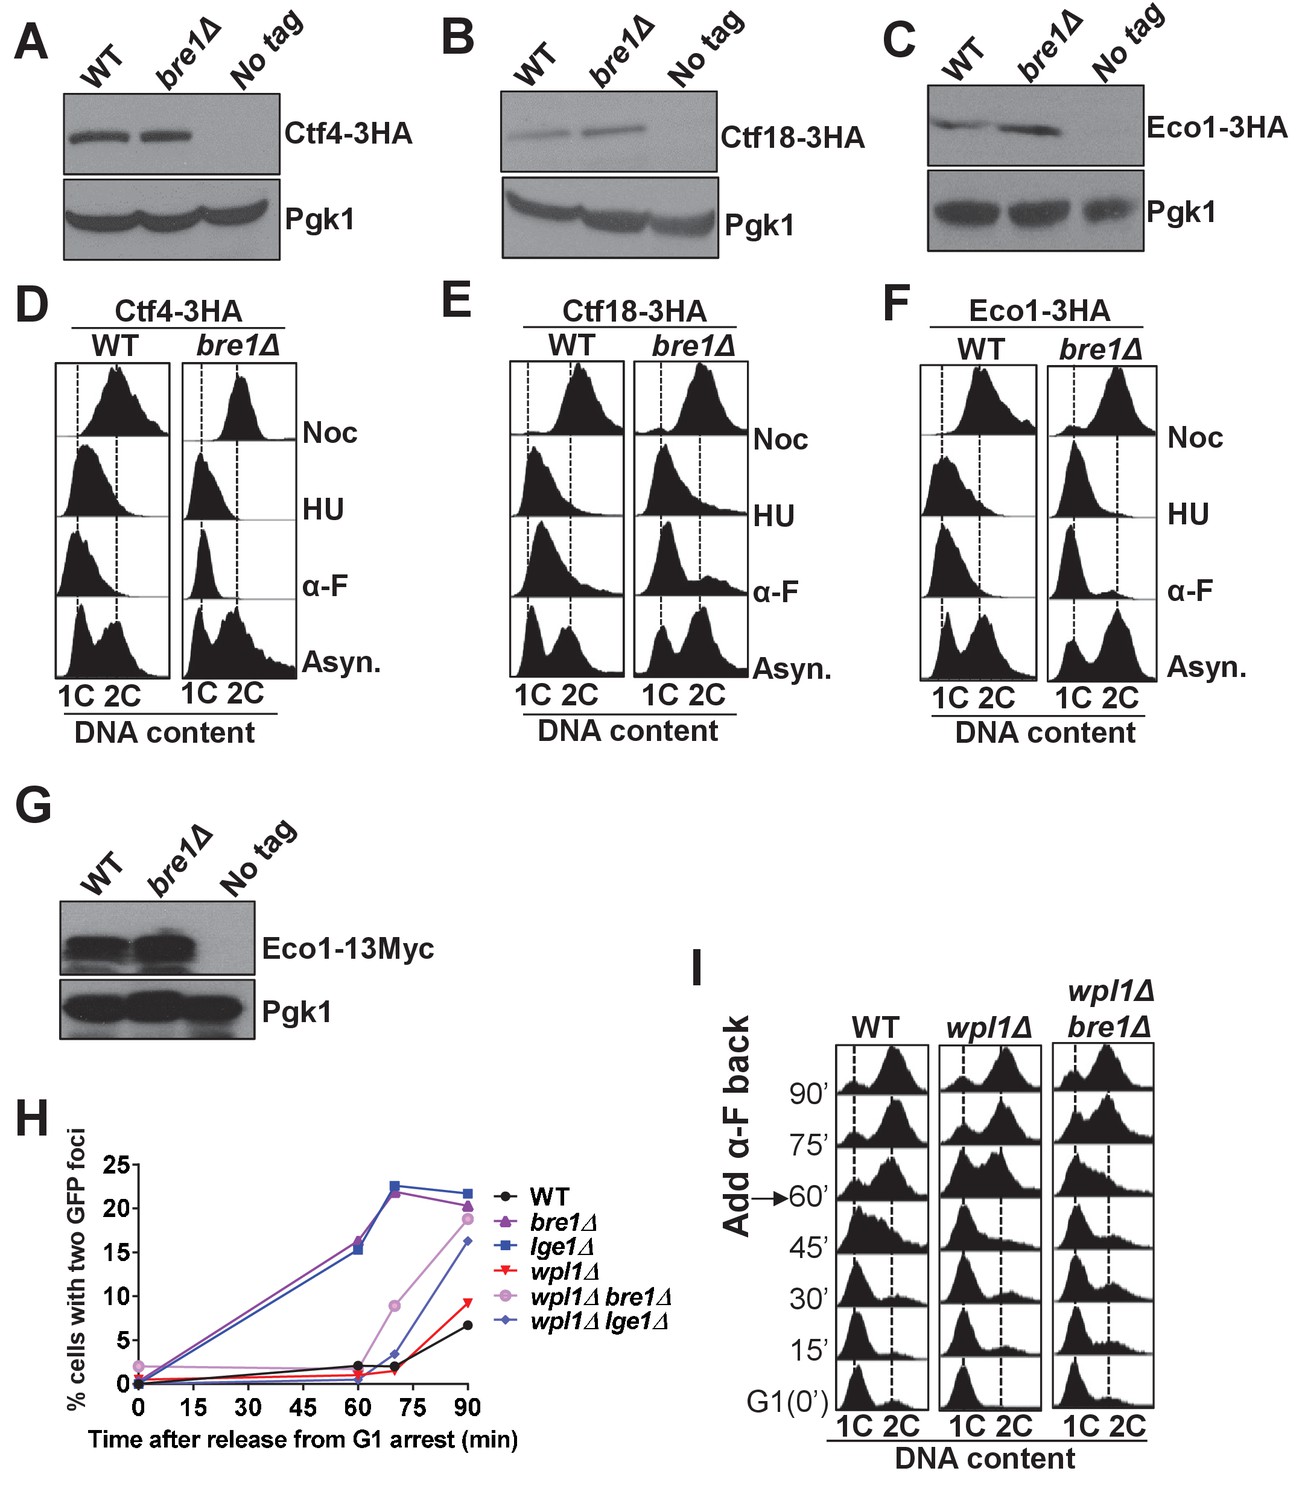
Bre1 is important for recruiting cohesion factors to replication origins.
(A–C) Western blotting analysis of the protein level of Ctf4-3HA (A), Ctf18-3HA (B) and Eco1-3HA (C). Whole-cell extracts from early log phase WT and bre1Δ cells expressing the 3HA-tagged protein, and from the untagged WT strain were probed with anti-HA antibody. Pgk1 served as loading control. (D–F) Fluorescence-activated cell sorting (FACS) analysis of DNA content in WT and bre1Δ cells in Figure 3A & B, expressing Ctf4-3HA (D), Ctf18-3HA (E) and Eco1-3HA (F) arrested in G1, S and G2/M phases, respectively. (G) Western blotting analysis of the protein level of Eco1-13Myc. Whole-cell extracts from early log phase WT and bre1Δ cells expressing the 13Myc-tagged protein, and untagged WT strain were probed with anti-HA antibody. Pgk1 served as the loading control. (H) Analysis of sister chromatid cohesion in WT, bre1Δ, lge1Δ, wpl1Δ, and double-mutant strains wpl1Δ bre1Δ and wplΔ lge1Δ, by G1 arrest and release time-course assay. wpl1Δ have relatively low percentages of premature sister chromatid separation at 60, 75 and 90 min after release from G1, consistent with the study by Borges et al. (2013). bre1Δ and lge1Δ have elevated premature sister chromatid separation from 60 min onwards, consistent with Figure 1D and Figure 5C. Surprisingly, wpl1Δ partially rescues the bre1Δ or lge1Δ cohesion defect at 60 and 75 min, but not at 90 min. (I) Cell-cycle progression of WT, wpl1Δ and wpl1Δ bre1Δ used in Figure 3—figure supplement 2H. Cells were arrested in G1 by alpha-factor (α-F) for 3 hr. Cells were washed and released into YPD medium. α-F was added back to the culture at 60 min post G1 release to restrict cells in the next cell cycle at G1. Samples were collected every 15 min, and stained with propidium iodide for FACS analyses.
Figure 4 with 1 supplement
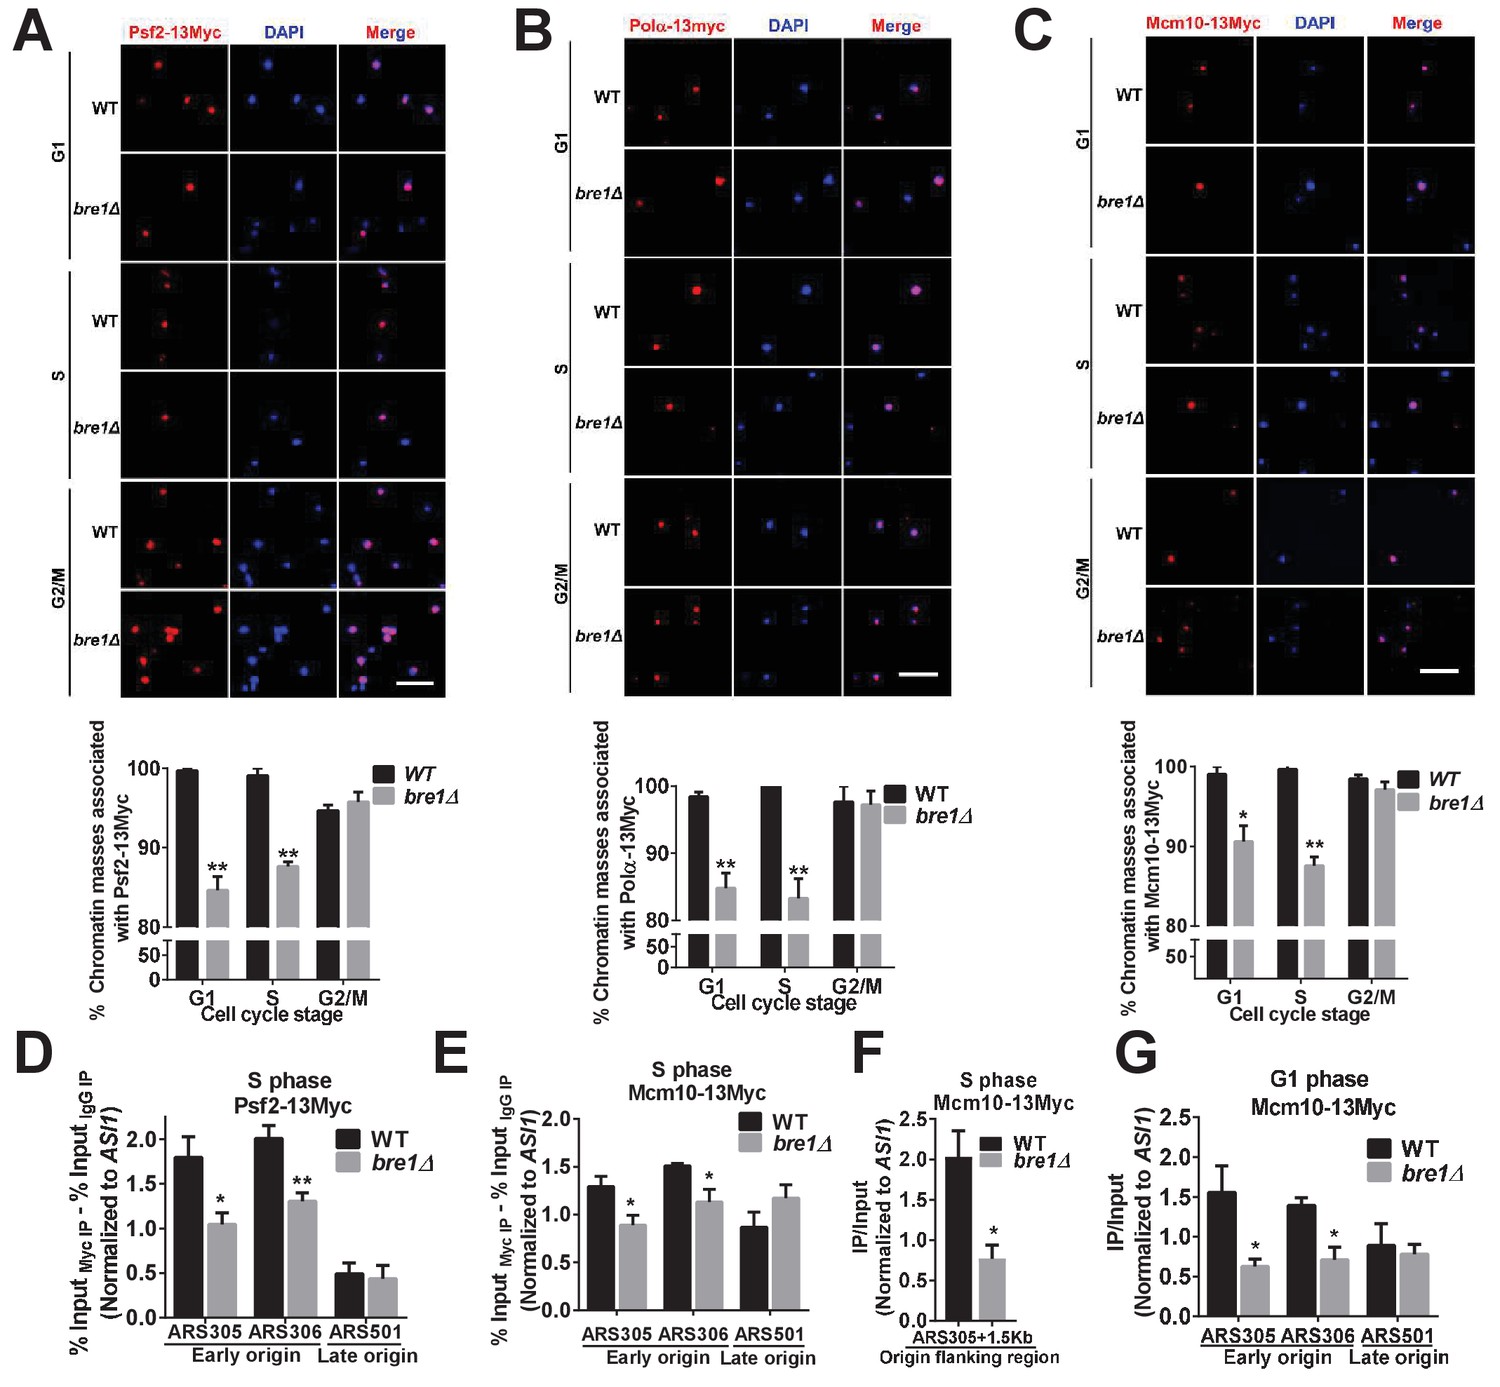
Bre1 recruits replication factors Psf2, Polα, and Mcm10 to chromatin and early replication origins.
(A–C) Psf2-13Myc (A), Polα−13Myc (B) and Mcm10-13Myc (C) detected in chromatin spreads in wild-type (WT) and bre1Δ cells at indicated cell-cycle-arrested stages (G1, S or G2/M phase arrested with α-F, HU or Noc for 3 hr, respectively). The frequencies of chromatin-associated Psf2-13Myc, Polα−13Myc and Mcm10-13Myc were quantified. At least 100 chromatin masses were scored for each sample in each experiment. Error bars indicate SEM from at least three independent experiments. **p<0.01, *p<0.05 by Student’s t-test. Scale bar: 1 μm. (D–F) Chromatin immunoprecipitation analysis of the occupancy of replication factors Psf2-13Myc (D) and Mcm10-13Myc (E and F) at replication early origins ARS305 and ARS306, late origin ARS501 (D and E) and origin flanking region ARS305 + 1.5 kb (F) in HU-arrested S-phase WT and bre1Δ cells. Immunopreciptiation (IP) signals at each ARS were normalized to input DNA, and then normalized to the signal at the non-enriched ASI1 locus. Error bars represent the SEM from at least three independent experiments. **p<0.01, *p<0.05 by Student’s t test. (G) Chromatin immunoprecipitation analysis of the occupancy of replication factor Mcm10-13Myc at replication early origins ARS305, ARS306 and late origin ARS501 in α-F-arrested G1 phase WT and bre1Δ cells. IP signals at each ARS were normalized to input DNA, and then normalized to the signal at the non-enriched ASI1 locus. Error bars represent the SEM from at least three independent experiments. *p<0.05 by Student’s t test.
Figure 4—figure supplement 1
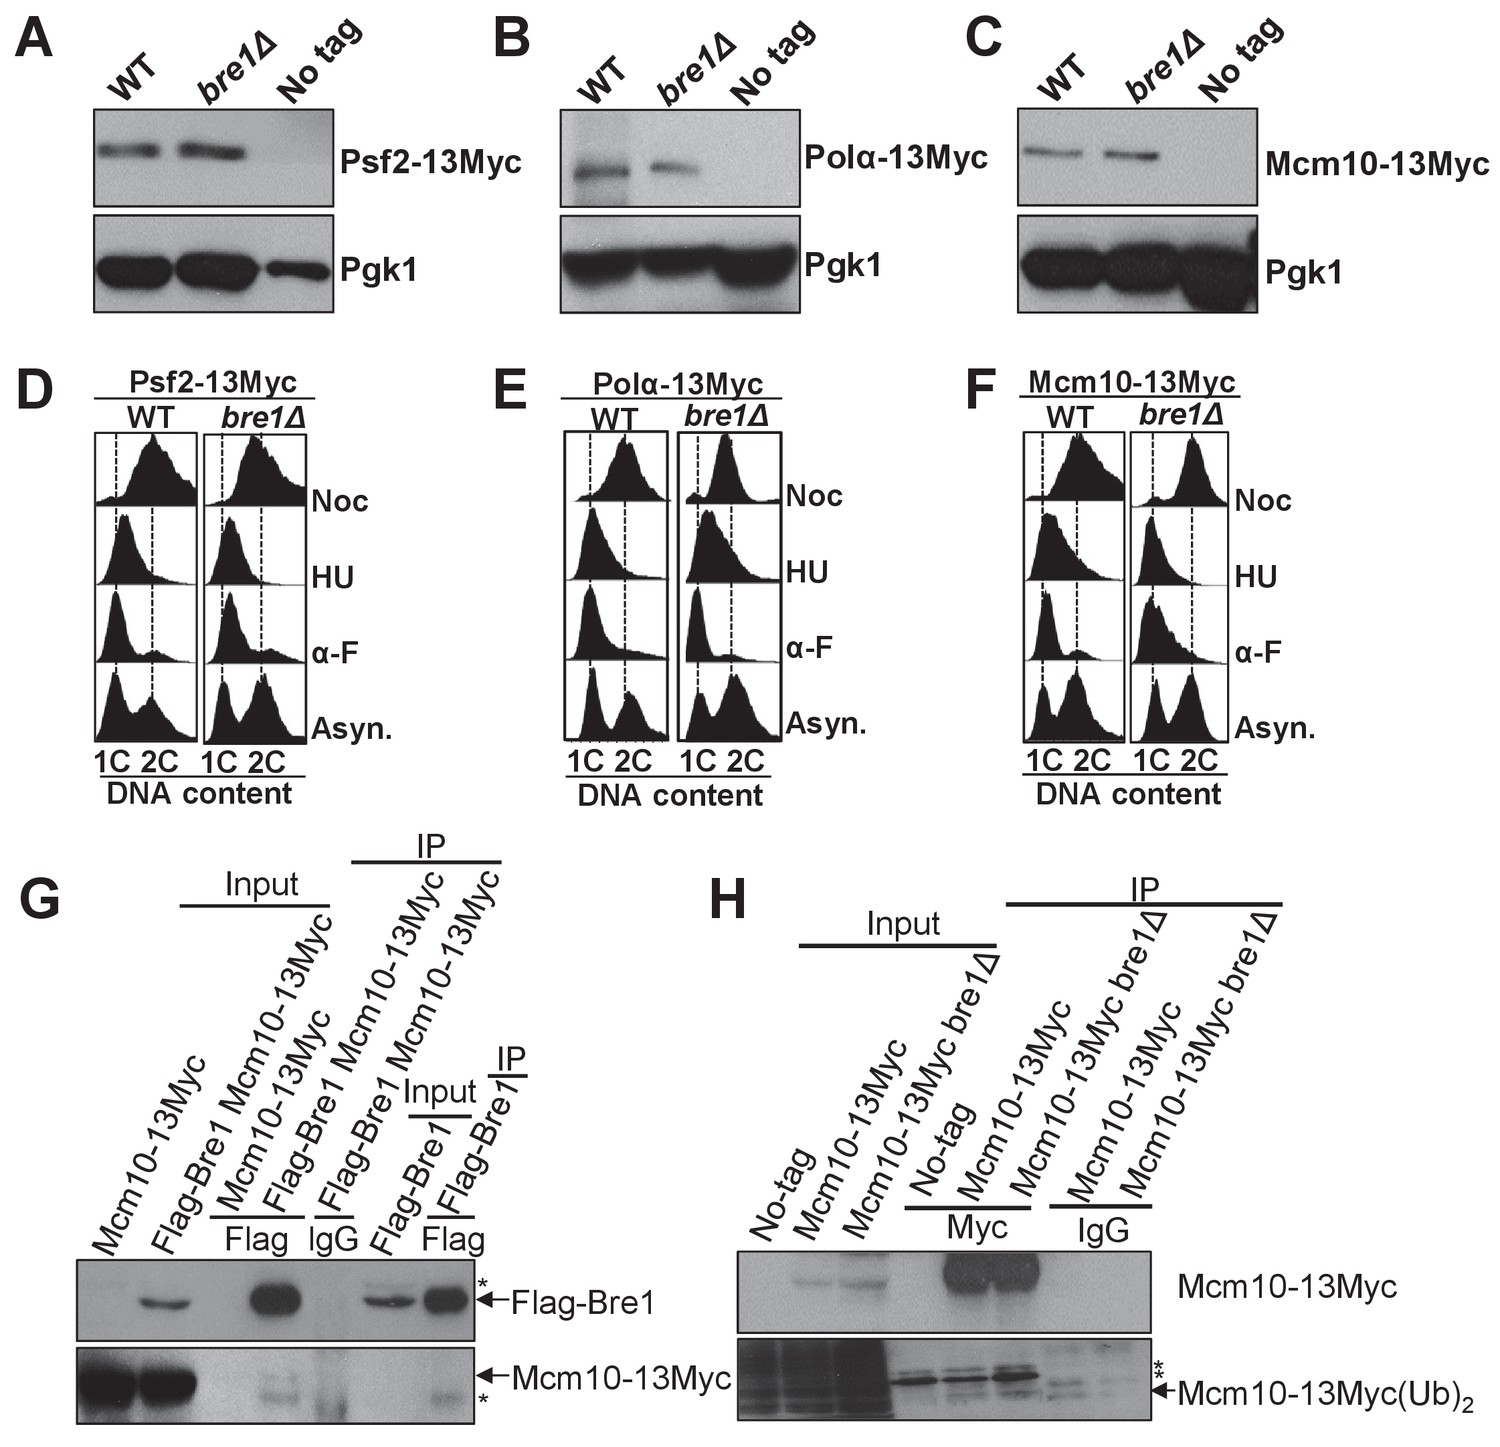
Bre1 does not affect the expression of replication factors Psf2, Polα and Mcm10.
(A–C) Western blotting analysis of the expression of Psf2-13Myc (A), Polα−13Myc (B) and Mcm10-13Myc (C) inWT, bre1Δ and untagged WT strains used in Figure 4. Whole-cell extracts from log phase cells were isolated and probed with anti-Myc antibody. Pgk1 served as loading control. (D–F) Flow cytometry analysis of DNA content in WT and bre1Δ cells from Figure 4A–C expressing Psf2-13Myc (D), Polα−13Myc (E) and Mcm10-13Myc (F) arrested in G1, S and G2/M phases, respectively. (G) Co-immunoprecipitation of Mcm10-13Myc, Flag-Bre1, or Flag-Bre1 and Mcm10-13Myc log phase cells at 100 mM NaCl concentration by anti-Flag and anti-IgG antibody, and probed with anti-Myc or anti-Flag antibody, respectively. *: non-specific band. (H) Mcm10-13Myc-expressing strains in WT or bre1Δ are immunoprecipitated using anti-Myc antibody and probed with anti-ubiquitin antibody.
Figure 5 with 2 supplements
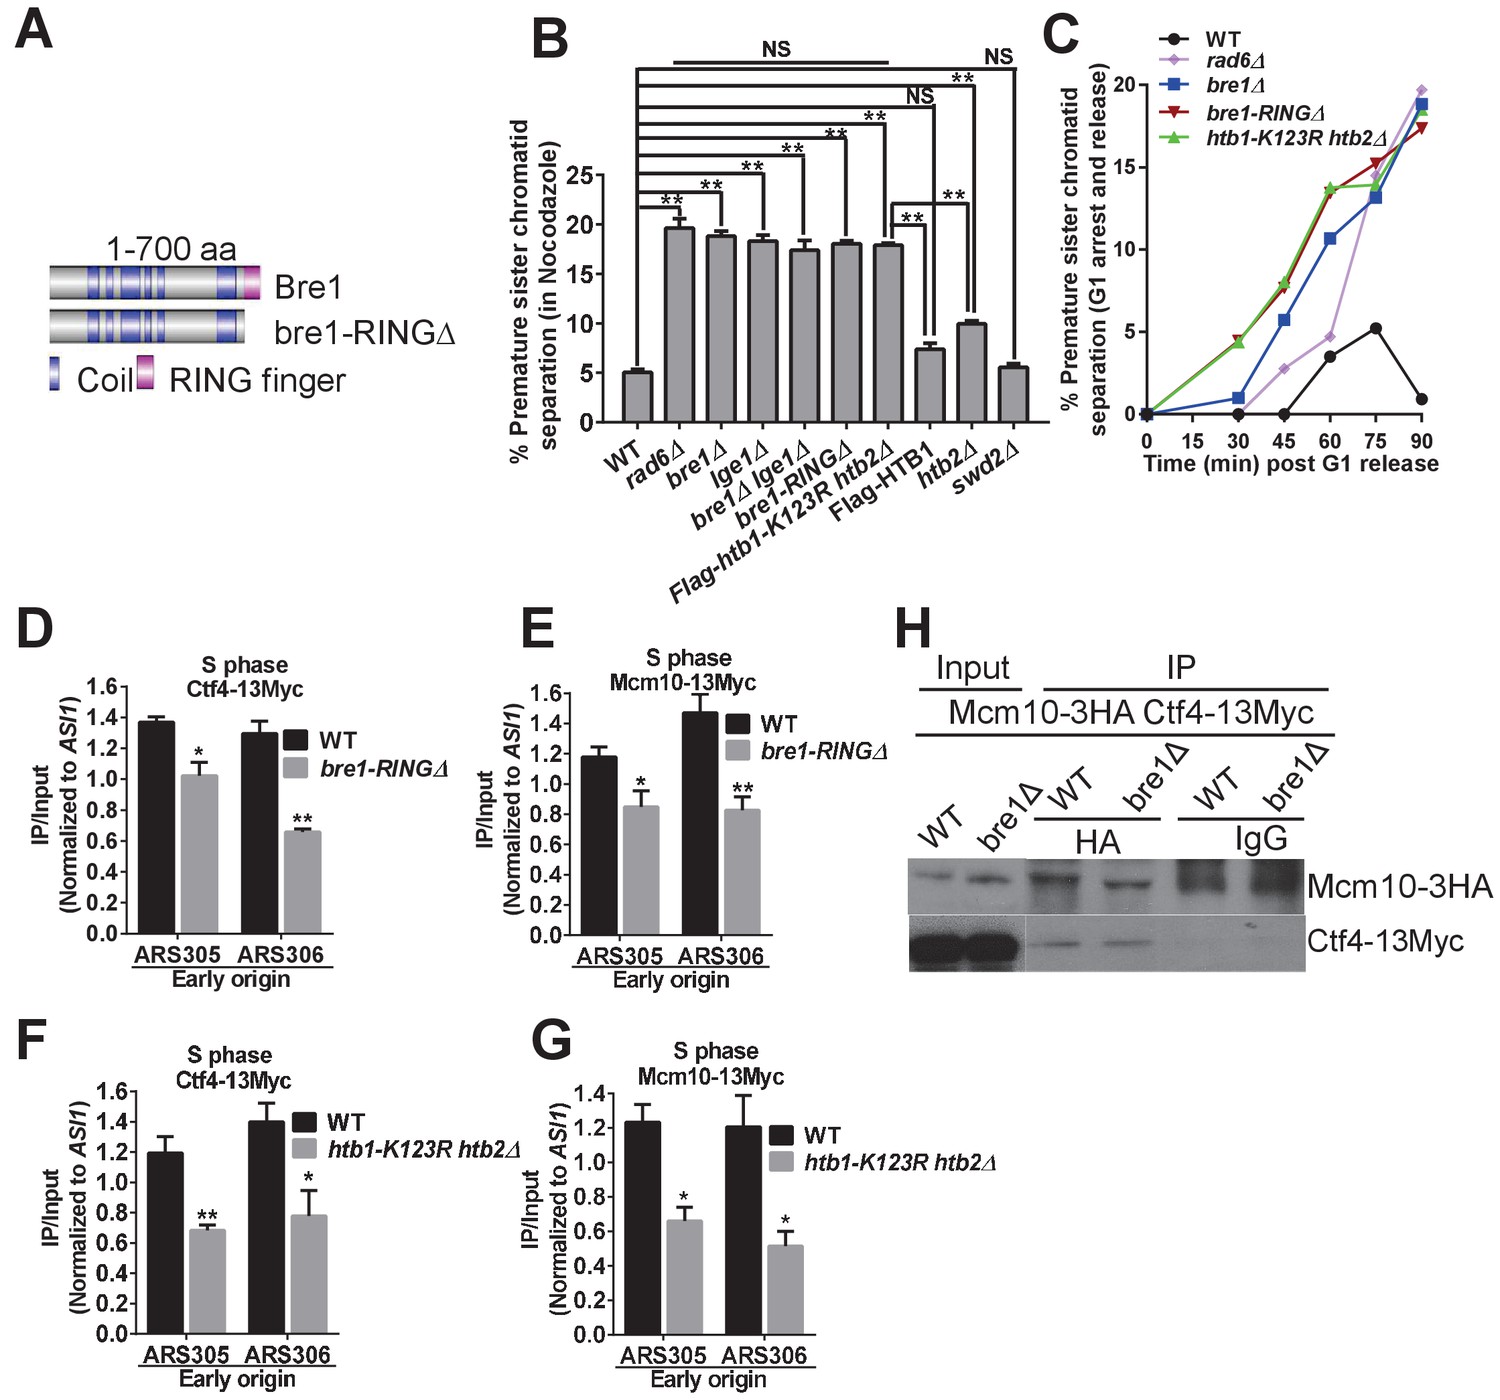
Bre1 RING domain and H2B monoubiquitination are important for cohesion establishment and the recruitment of replication and cohesion factors to early origins.
(A) Schematic diagram of full-length Bre1 protein (700 amino acids) and the Bre1 mutant protein without the C-terminal RING domain (54 amino acids), bre1-RINGΔ, which is defective in H2B ubiquitination. (B) Analysis of sister chromatid cohesion in wild-type (WT) and mutant strains in nocodazole-arrested cells. WT, rad6Δ, bre1Δ, lge1Δ, bre1Δ lge1Δ, bre1-RINGΔ, htb1-K123R htb2∆, Flag-HTB1, htb2Δ, and swd2Δ mutants were arrested in G2/M phase by nocodazole for 3 hr before being assessed by cohesion assay. At least 100 were scored for each strain in three independent experiments. Error bars represent SEM. Statistical significance was analyzed by Student's t-test between WT and mutants (**p<0.01). NS represents no significant difference between WT and swd2Δ or Flag-tagged HTB1 control, or among rad6Δ, bre1Δ, lge1Δ, bre1Δ lge1Δ, bre1-RINGΔ, and htb1-K123R htb2∆ mutants. (C) Analysis of sister chromatid cohesion in WT and rad6Δ, bre1Δ, bre1-RINGΔ, and htb1-K123R htb2∆ mutant strains by G1 arrest and release time-course assay. The WT strain has a low percentage of cells with premature sister chromatid separation from 0 to 90 min after release from G1, whereas rad6Δ, bre1Δ, bre1-RINGΔ, and htb1-K123R htb2∆ have progressively elevated occurences of premature sister chromatid separation from 30 min after release from G1. At least 100 cells were scored for each sample. (D and E) Chromatin immunoprecipitation analysis of the occupancy of replication factors Ctf4-13Myc (D) and Mcm10-13Myc (E) in WT and the bre1-RINGΔ mutant at replication early origins ARS305 and ARS306 in HU-arrested S phase. Immunoprecipitation (IP) signals at each ARS were normalized to input DNA, and then normalized to signals at the non-enriched ASI1 locus. Error bars represent the SEM from at least three independent experiments. **p<0.01, *p<0.05 by Student’s t-test. (F and G) Chromatin IP analysis of the occupancy of replication factors Ctf4-13Myc (F) and Mcm10-13Myc (G) in WT and the htb1-K123R htb2∆ mutant at replication early origins ARS305 and ARS306 in HU-arrested S phase. IP signals at each ARS were normalized to input DNA, and then normalized to that at the non-enriched ASI1 locus. Error bars represent the SEM from at least three independent experiments. **p<0.01, *p<0.05 by Student’s t-test. (H) Co-immunoprecipitation analysis of the interaction between Ctf4 and Mcm10 in wild-type and bre1Δ cells. Whole cell extracts prepared from Mcm10-3HA Ctf4-13Myc WT and bre1Δ cells were precipitated with anti-HA and anti-IgG antibodies. Immunoprecipitates were probed with anti-HA or anti-Myc antibody, respectively.
Figure 5—figure supplement 1
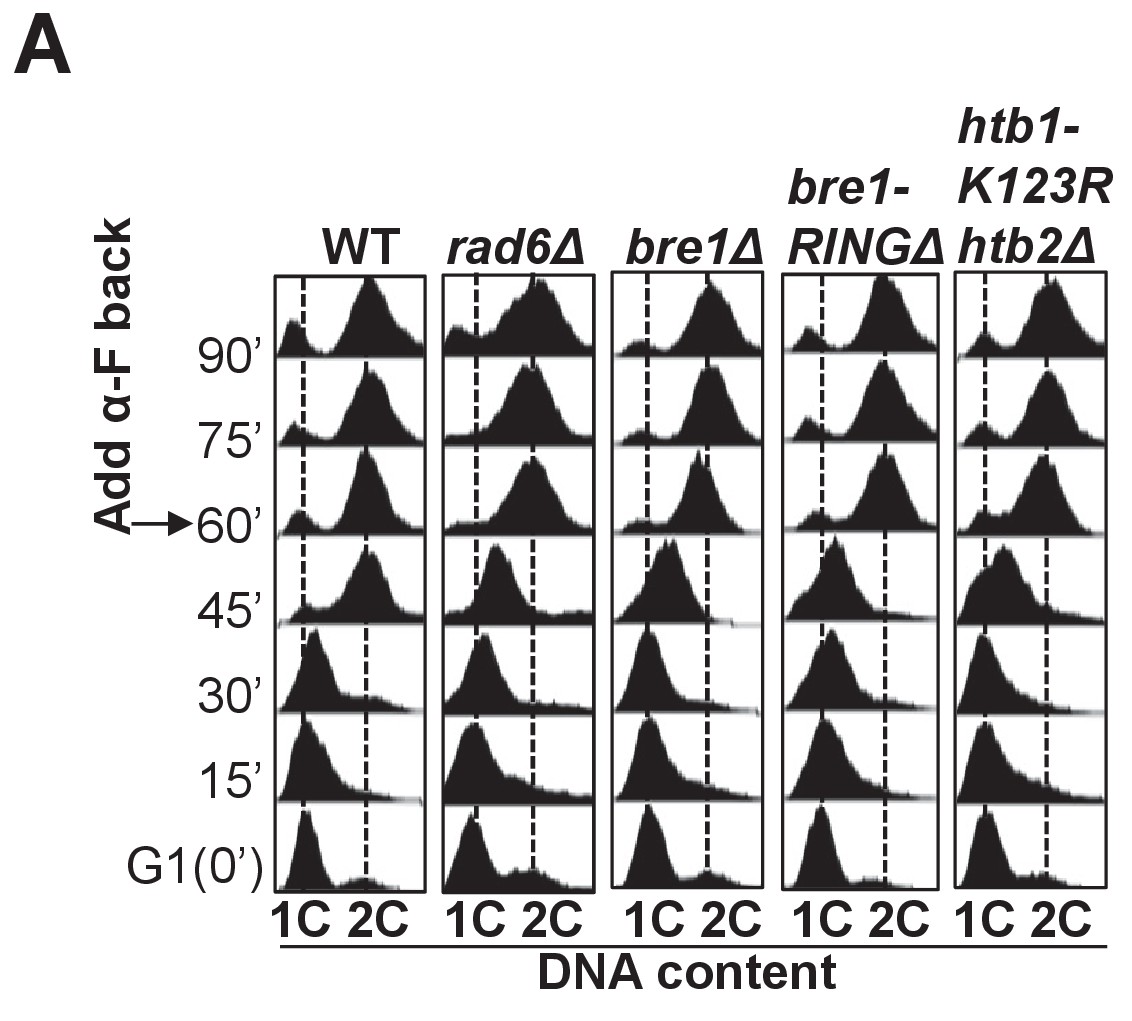
Cell cycle progression in wild-type, rad6Δ, bre1Δ, bre1-RINGΔ and htb1-K123R htb2Δ.
(A) Cell cycle progression of wild-type (WT), rad6Δ, bre1Δ, bre1-RINGΔ and htb1-K123R htb2Δ used in Figure 5C. Cells were arrested in G1 by alpha-factor (α-F) for 3 hr. Cells were washed and released into YPD medium. α-F was added back to the culture at 60 min post G1 release to restrict cells in the next cell cycle at G1. Samples were collected every 15 min, and stained with propidium iodide for FACS analyses.
Figure 5—figure supplement 2
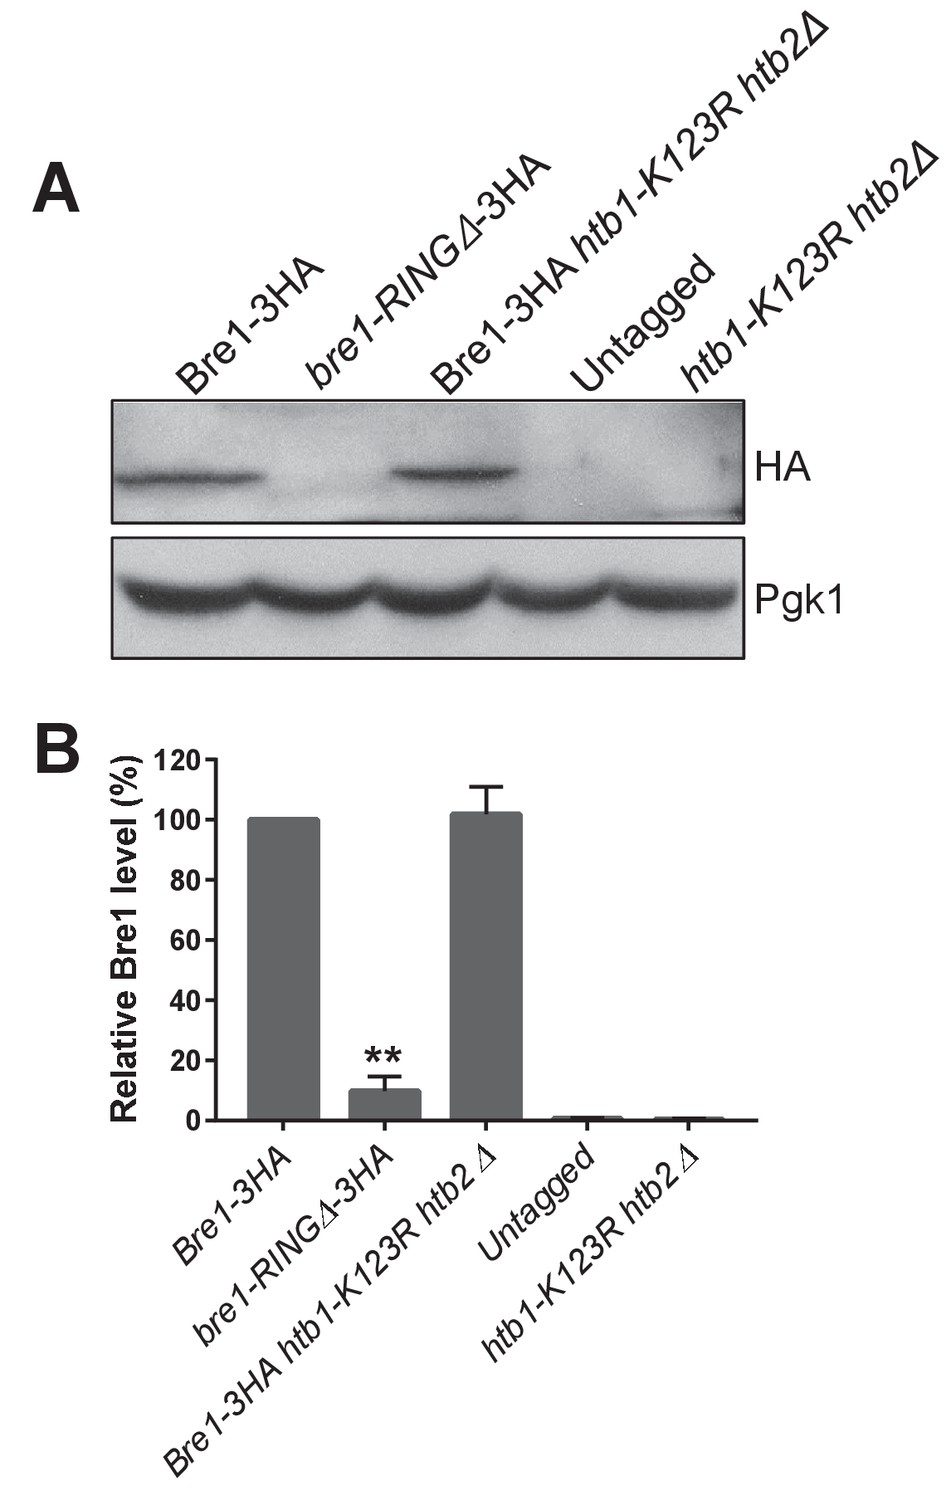
Bre1 protein levels in bre1-RINGΔ and htb1-K123R htb2Δ mutants.
(A) C-terminal endogenously tagged full-length Bre1-3HA in wild-type (WT) , in the htb1-K123R htb2Δ mutant and in the Bre1 RING-finger domain deletion mutant (bre1-RINGΔ−3HA) were analyzed by western blot analysis. Untagged WT and htb1-K123R htb2Δ were shown as controls. Pgk1 served as loading control. (B) Bre1 levels in WT, bre1-RINGΔ, htb1-K123R htb2Δ mutants and untagged strains in (A) were quantified by normalizing to Pgk1, the loading control. Three independent experiments were performed. Error bar represents SEM from three experiments. Statistical significance was analyzed by Student’s t-test. **p<0.01.
Figure 6
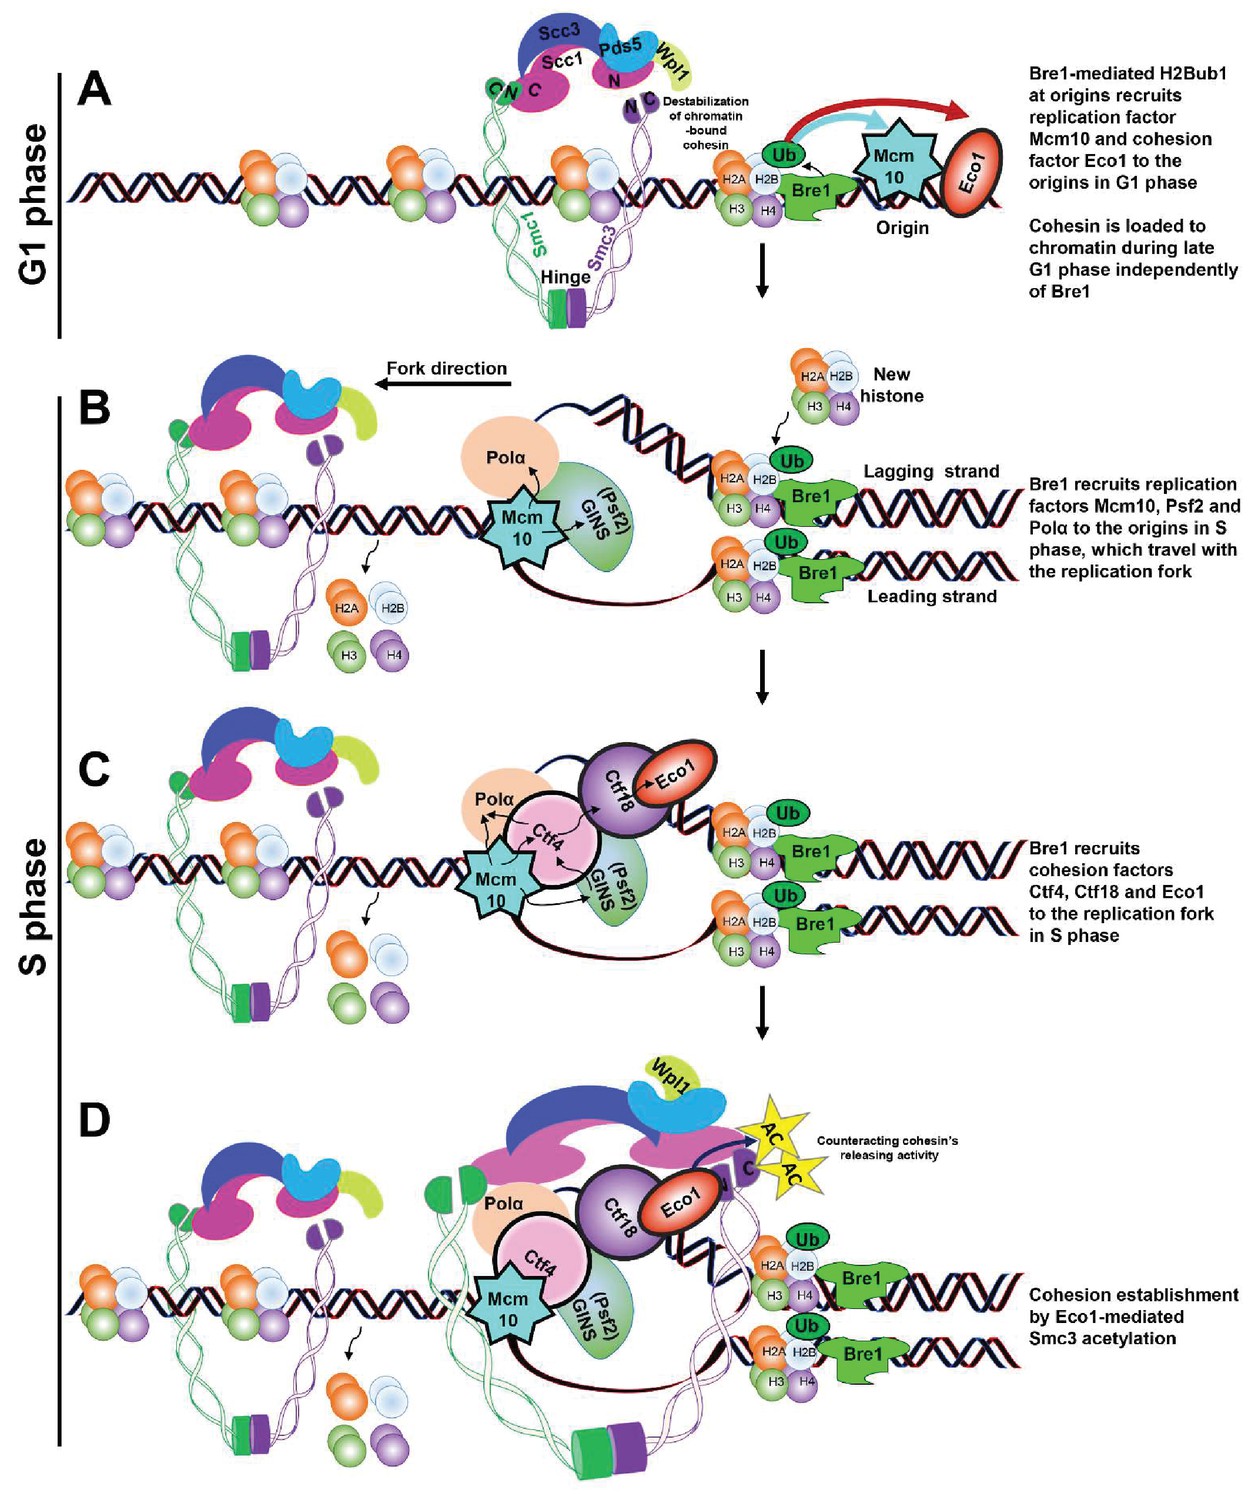
Schematic model of Bre1’s role in replication-coupled cohesion establishment.
(A) A Bre1- and H2Bub1-marked origin (Trujillo and Osley, 2012) partially facilitates the occupancy of replication factor Mcm10 and cohesion factor Eco1 at the origins in G1 phase (as indicated by the blue and red arrows). Cohesin complexes are loaded onto chromatin before the onset of DNA replication (Ciosk et al., 2000) independently of Bre1, but the cohesin association on chromatin is destabilized by Wpl1. (B) In S phase, the Bre1- and H2Bub1-marked origin partially facilitates the recruitment of replication factors Mcm10, Psf2 and Polα to the origins, which travel with the replication fork (Trujillo and Osley, 2012). (C) Through these replication factors, the Bre1- and H2Bub1-marked origin partially facilitates the recruitment of cohesion factors Ctf4, Ctf18 and Eco1 to the origins and replication forks. (D) Bre1 promotes Eco1-mediated Smc3 acetylation (as indicated by the yellow stars and black arrows) at the replication fork to facilitate and stabilize cohesion establishment by counteracting Wapl1’s activity in releasing cohesin.
Additional files
-
Supplementary file 1
Yeast strains used in this study.
- https://doi.org/10.7554/eLife.28231.015
-
Supplementary file 2
Yeast plasmids used in this study.
- https://doi.org/10.7554/eLife.28231.016
-
Supplementary file 3
Sequences of primers used in RT-qPCR experiments in this study.
- https://doi.org/10.7554/eLife.28231.017
-
Transparent reporting form
- https://doi.org/10.7554/eLife.28231.018
Download links
A two-part list of links to download the article, or parts of the article, in various formats.
Downloads (link to download the article as PDF)
Open citations (links to open the citations from this article in various online reference manager services)
Cite this article (links to download the citations from this article in formats compatible with various reference manager tools)
E3 ubiquitin ligase Bre1 couples sister chromatid cohesion establishment to DNA replication in Saccharomyces cerevisiae
eLife 6:e28231.
https://doi.org/10.7554/eLife.28231


