The human cytoplasmic dynein interactome reveals novel activators of motility
- University of California, United States
- Harvard Medical School, United States
- Stowers Institute for Medical Research, United States
- The University of Kansas Medical Center, United States
Figures
Figure 1 with 1 supplement
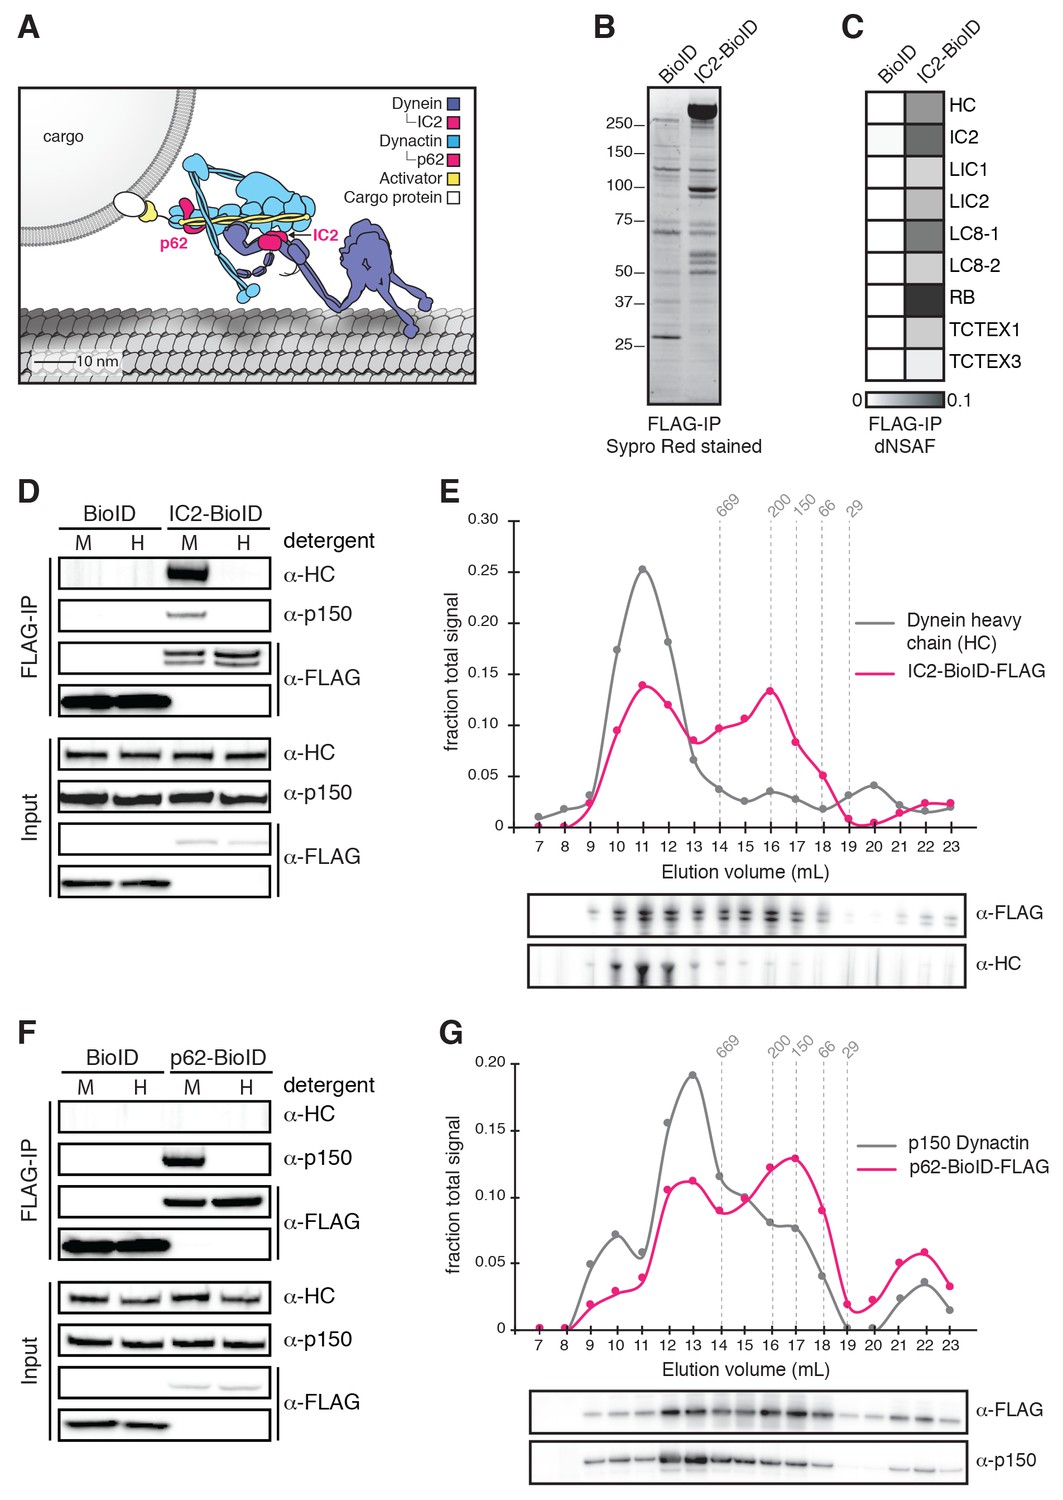
Validation of BioID-tagged dynein and dynactin subunits.
(A) A cartoon of the dynein/dynactin/activator complex based on cryo-EM structural studies (Chowdhury et al., 2015; Urnavicius et al., 2015) with proteins drawn to scale. (B) BioID-3×FLAG or IC2-BioID-3×FLAG were immunoprecipitated from stable HEK-293 cell lines using α-FLAG antibodies and eluted using FLAG peptide. A Sypro Red stained SDS-PAGE gel of the immunoprecipitates is shown. (C) MS/MS analysis of the immunoprecipitates from (B). Core dynein subunit dNSAF (distributed normalized spectral abundance factor) (Zhang et al., 2015) values are displayed as a gray scale heat map. (D) Immunoprecipitations were performed as in (B) with mild (M) or harsh (H) detergent conditions (see Materials and methods). Harsh detergent conditions disrupt IC2 incorporation into the dynein/dynactin complex as shown by Western blots with α-HC and α-p150 (dynactin subunit) antibodies. (E) IC2-BioID-3×FLAG was immunoprecipitated from a stable HEK-293 cell line using α-FLAG antibodies and fractionated by gel filtration FPLC chromatography. Fractions were analyzed by Western blotting with α-FLAG and α-HC antibodies. The signal intensity for IC2-BioID-3×FLAG (magenta) and HC (gray) in each fraction is plotted as a fraction of the summed intensity of all fractions. The elution volumes of molecular weight standards are indicated (dashed lines). (F) BioID-3×FLAG or p62-BioID-3×FLAG were immunoprecipitated from stable HEK-293 cell lines using α-FLAG antibodies. Immunoprecipitations were performed with mild (M) or harsh (H) detergent concentrations. Harsh detergent conditions disrupt p62 incorporation into the dynein/dynactin complex. (G) p62-BioID-3×FLAG was immunoprecipitated from a stable HEK-293 cell line using α-FLAG antibodies and analyzed as described in (E) with α-FLAG and α-p150 antibodies. The signal intensities for p62-BioID-3×FLAG (magenta) and p150 (gray) are plotted as a fraction of the summed intensity of all fractions. The elution volumes of molecular weight standards are indicated (dashed lines).
Figure 1—figure supplement 1
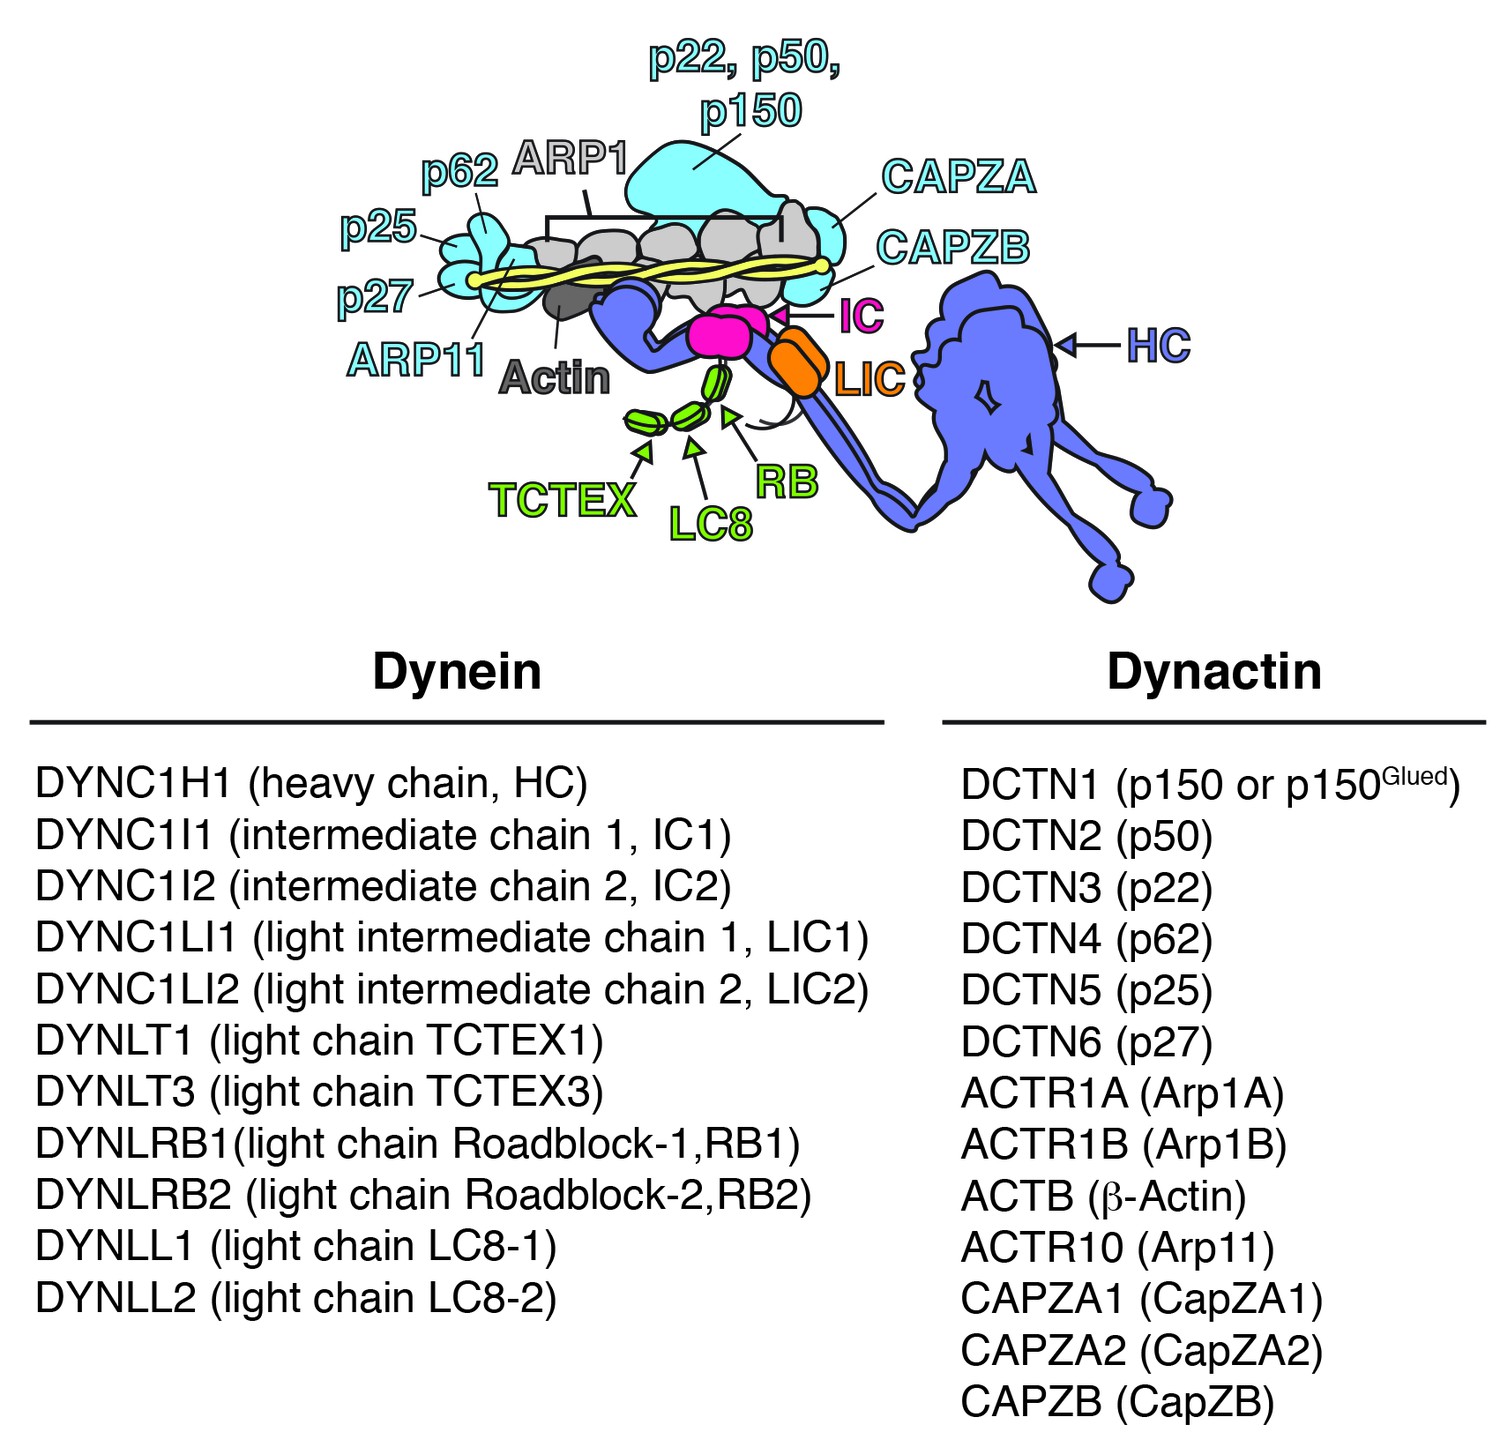
Schematic of the dynein/dynactin/activator complex.
Dynein subunits are uniquely colored except for the light chains (green). Dynactin subunits other than Arp1 (light gray) and actin (dark gray) are colored light blue. The dynactin Arp1 filament (light gray) is indicated with a single label. A coiled coil activator (e.g. BICD2) is depicted and colored yellow. The corresponding gene names, common names, and abbreviations are listed below.
Figure 2
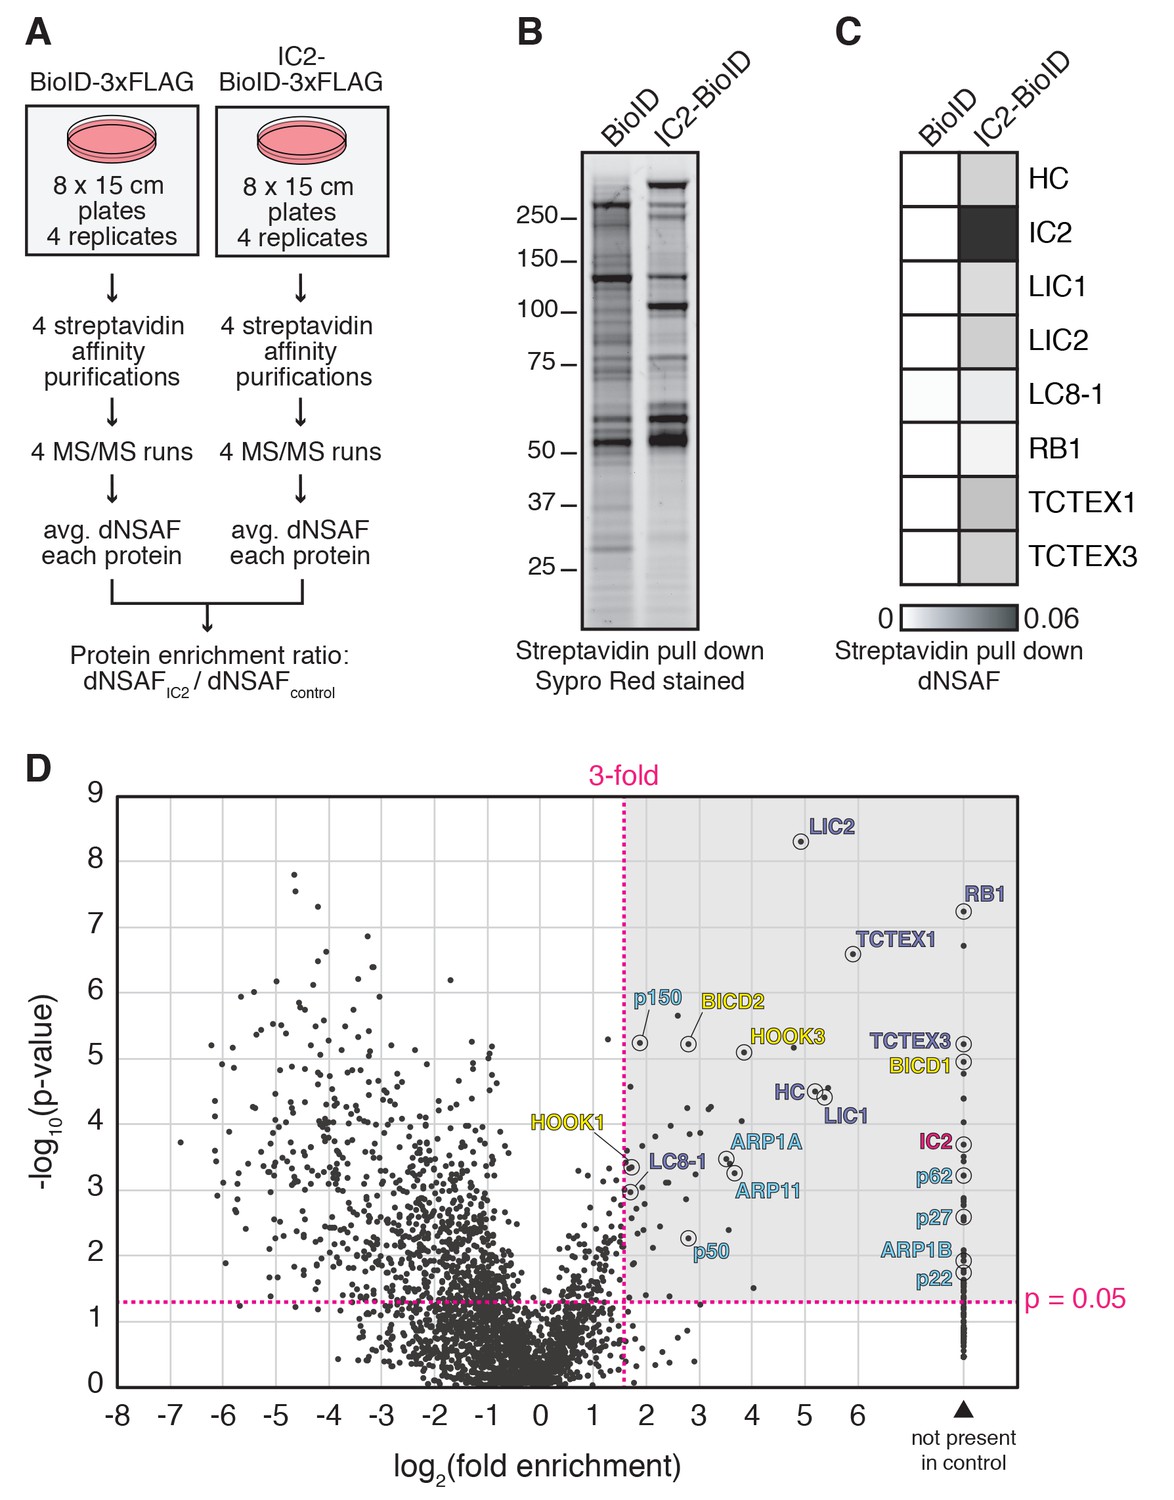
BioID with the dynein IC reports on activated dynein/dynactin/activator complexes in living human cells.
(A) BioID experimental design. For each stably expressed BioID-tagged subunit reported in this study, quadruplicate samples were prepared, analyzed, and compared to a quadruplicate BioID only control. Fold enrichment was calculated as the ratio of dNSAF between the BioID-tagged subunit and the BioID control. (B) Biotinylated proteins were isolated from cells stably expressing either IC2-BioID or BioID by streptavidin affinity purification. A Sypro Red stained SDS-PAGE gel is shown. (C) MS/MS analysis of the immunoprecipitates from (B). Core dynein subunit dNSAF (Zhang et al., 2015) values are displayed as a heat map. (D) A volcano plot showing enrichment versus significance of proteins identified in IC2-BioID experiments relative to control (BioID alone) experiments. A quadrant (dashed magenta line) bounded by a p-value of 0.05 and 3-fold enrichment contained dynein (dark blue) and dynactin (light blue) subunits, as well as the known activators BICD2, HOOK1, and HOOK3, and the candidate activator BICD1 (yellow).
Figure 3 with 1 supplement

BioID reports on the spatial organization of the dynein/dynactin/activator complex.
(A and B) Dynein (IC1, IC2, LIC1, LIC2, RB1, TCTEX1) and dynactin (p62) subunits tagged with BioID-3×FLAG were immunoprecipitated (for 16 hr in A or 2 hr in B) from stable HEK-293 cell lines using α-FLAG antibodies. All subunits incorporated into the dynein/dynactin complex based on Western blots with α-HC and α-p150 antibodies. (C) BioID experiments were performed with cells expressing the indicated dynein and dynactin subunits (magenta and magenta arrows). Other dynein and dynactin subunits enriched in the BioID experiments are shaded light gray (2–3 fold) or dark gray (≥3 fold), p<0.05 (Student’s two-tailed t-test).
Figure 3—figure supplement 1
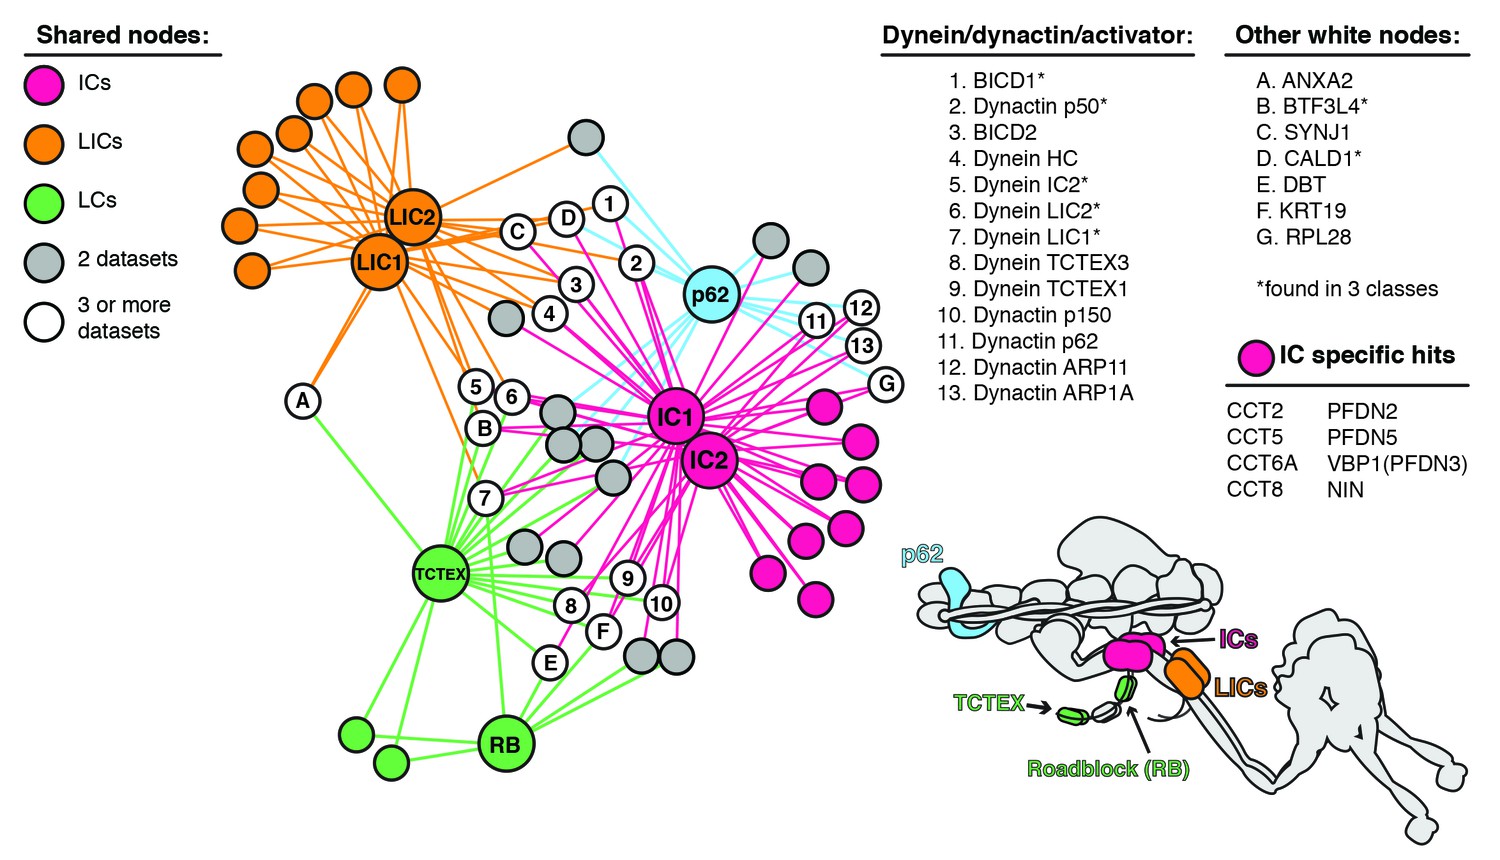
Enriched and significant hits from dynein and dynactin BioID datasets were used to construct a protein-protein interaction network.
Large spheres represent BioID-tagged subunits (color coded according to a schematic of the dynein/dynactin complex, bottom right). Hits (small spheres) specific to a subunit family, color-coded according to their respective subunits: LCs (green), ICs (magenta) and LICs (orange). Gray spheres (‘two datasets’) and white spheres (‘three or more datasets’) represent hits enriched in two or three separate datasets, respectively. The protein names corresponding to white spheres are listed, right. Dynein and dynactin subunits, and activators are numbered; other hits are indicated with letters. Asterisk denotes hits detected in three different subunit classes (e.g. LICs/ICs/p62). Lines connecting spheres (edges) are color coded according to their respective datasets. For this figure enrichment is ≥3 fold, significance is p<0.05, Student’s two-tailed t-test; and average spectral counts are ≥2.
Figure 4 with 2 supplements

A secondary screen identifies candidate activators of dynein/dynactin motility.
(A) A schematic of our secondary screen. (B) Location of predicted coiled coils (rectangles) in known and candidate dynein/dynactin activators. (C, D) Candidate and known (BICD2 and HOOK3) activators tagged with 3×FLAG were immunoprecipitated with α-FLAG antibodies from HEK-293 cells. Western blots with α-HC and α-p150 antibodies were used to determine which proteins co-immunoprecipitated dynein and dynactin. (E—H) The candidate NIN (1-693) and NINL (1-702) activators, as well as the known BICD2 (1–422) and HOOK3 (1–552) activators were tagged with GFP and 3×FLAG and were immunoprecipitated with α-FLAG antibodies from HEK-293 cells. The motility of immunoprecipitated dynein/dynactin/activator complexes was monitored by GFP fluorescence using TIRF microscopy. Kymographs (left) and velocity histograms (right) with mean velocity (± S.D.) shown, n is greater than 102. Data shown is analyzed from one technical replicate, although two technical replicates were collected for each activator and displayed similar trends.
Figure 4—figure supplement 1
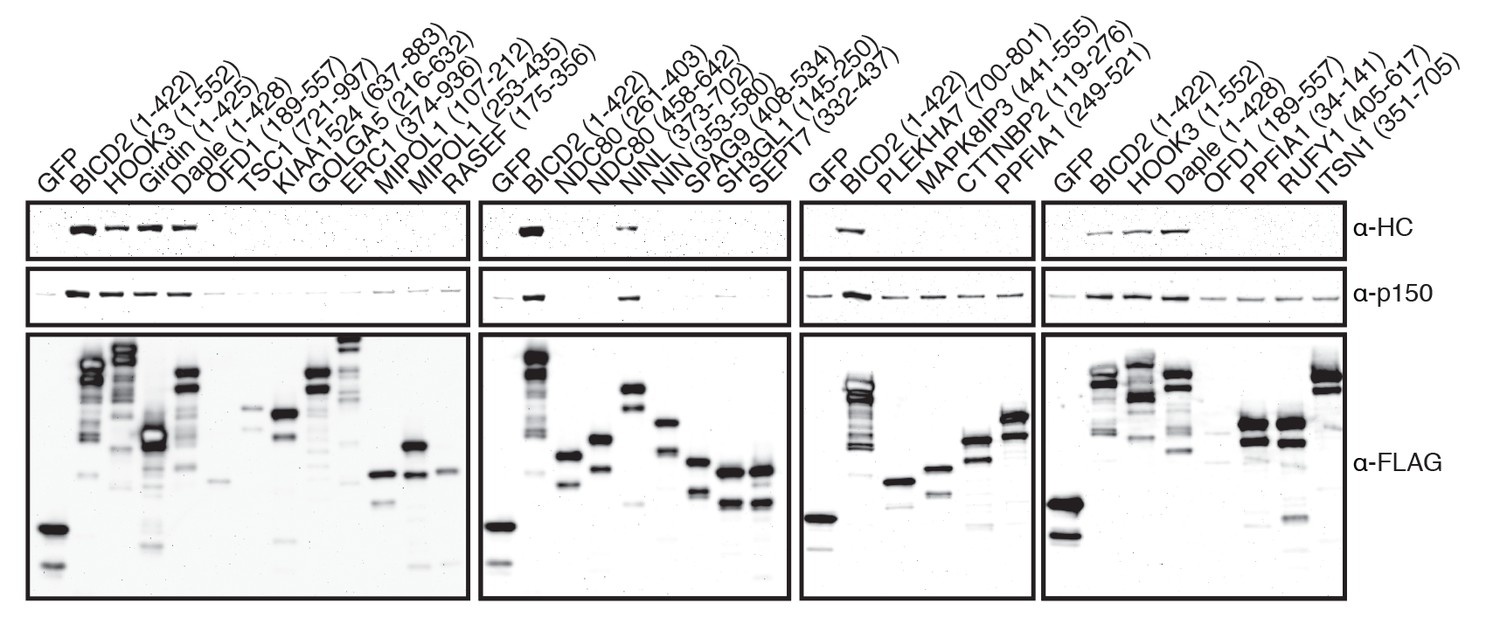
Candidate and known (BICD2 and HOOK3) activators were tagged with 3×FLAG and immunoprecipitated with α-FLAG antibodies from HEK-293 cells.
Western blots with α-HC and α-p150 antibodies were used to determine which proteins co-immunoprecipitated dynein and dynactin.
Figure 4—figure supplement 2
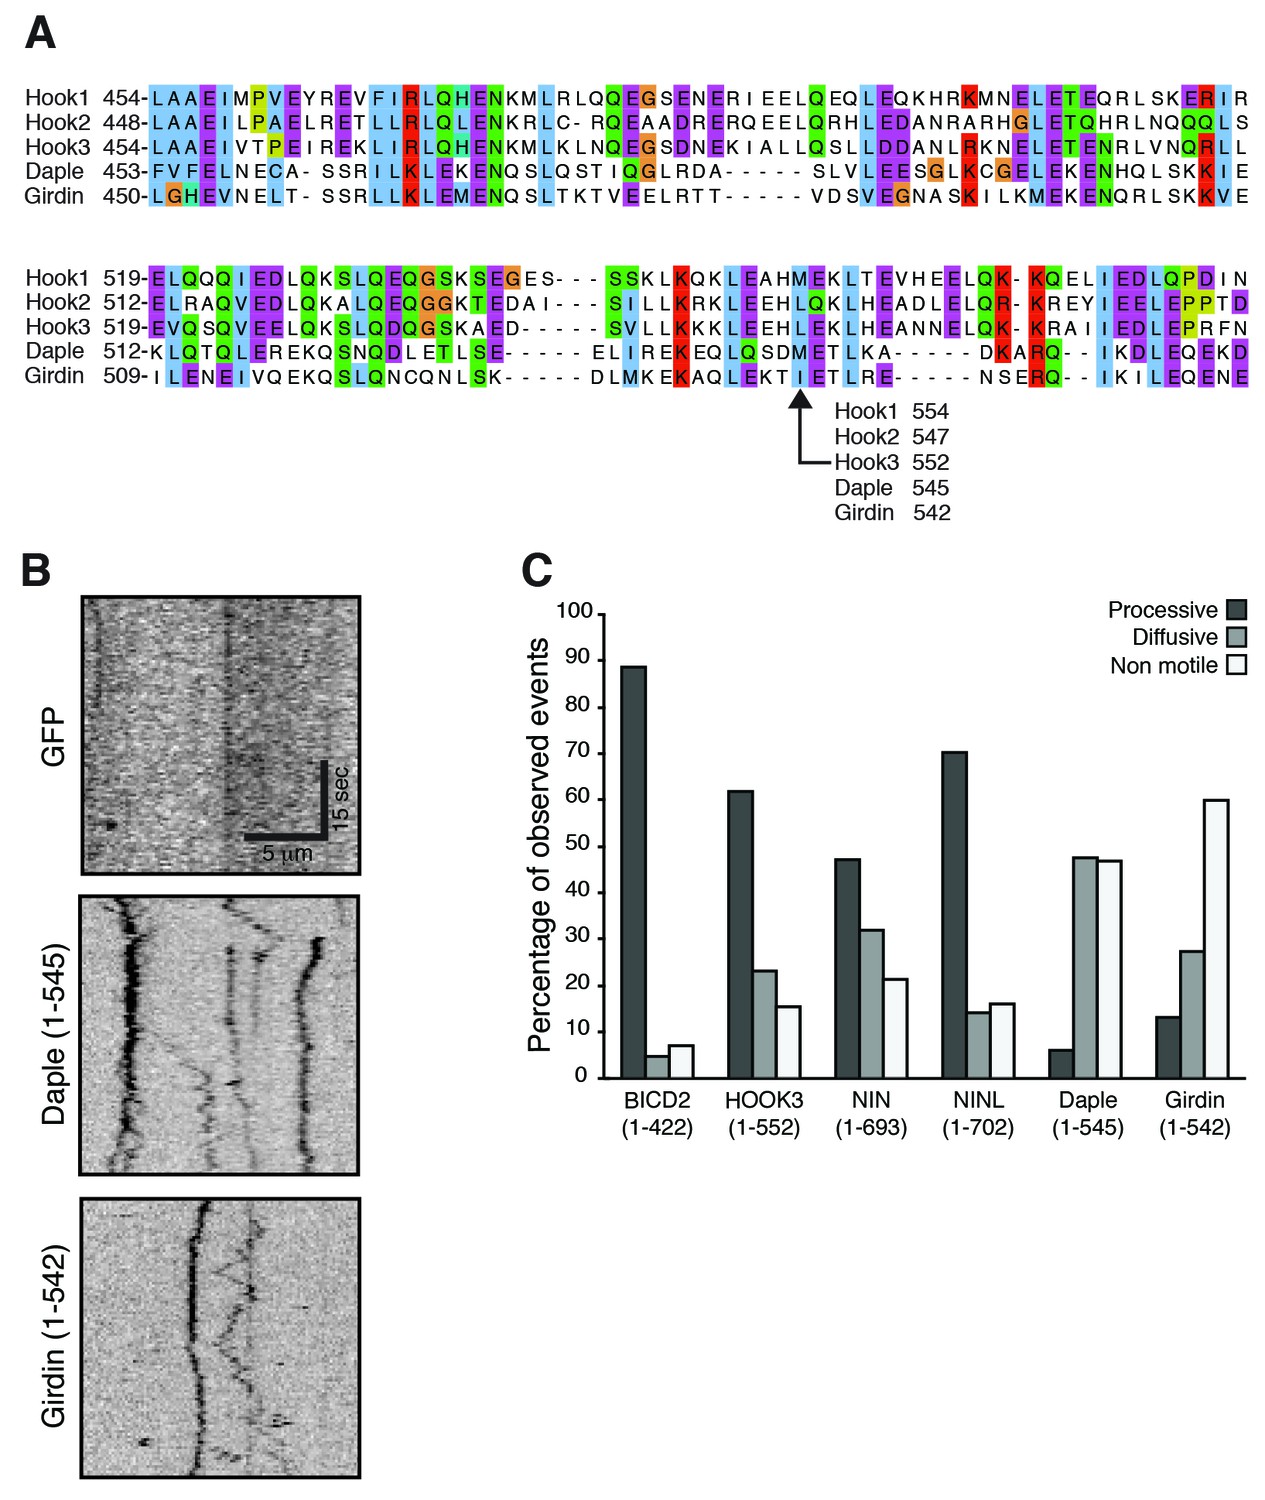
(A) The amino acid sequences for HOOK1, HOOK2, HOOK3 and two HOOK-related proteins (daple and girdin) were downloaded from Uniprot and aligned using Clustal Omega.
A region containing the HOOK3 (1–552) C-terminal truncation point is displayed and the residue in each protein equivalent to HOOK3 (1–552) is indicated. (B) As a control for the experiments in Figure 4E—H, GFP-3×FLAG was immunoprecipitated with an α-FLAG antibody from HEK-293 cells. No moving GFP signal was detected on microtubules. (C) The percentage of processive, diffusive and non-motile runs (see Materials and methods) in single-molecule motility assays (as described in Figure 4E–H) was analyzed for NIN (1-693), NINL (1-702), girdin (1-542) and daple (1-545) and compared to the known activators BICD2 (1–422) and HOOK3 (1–552).
Figure 5 with 1 supplement
NIN and NINL are novel activators of dynein/dynactin motility.
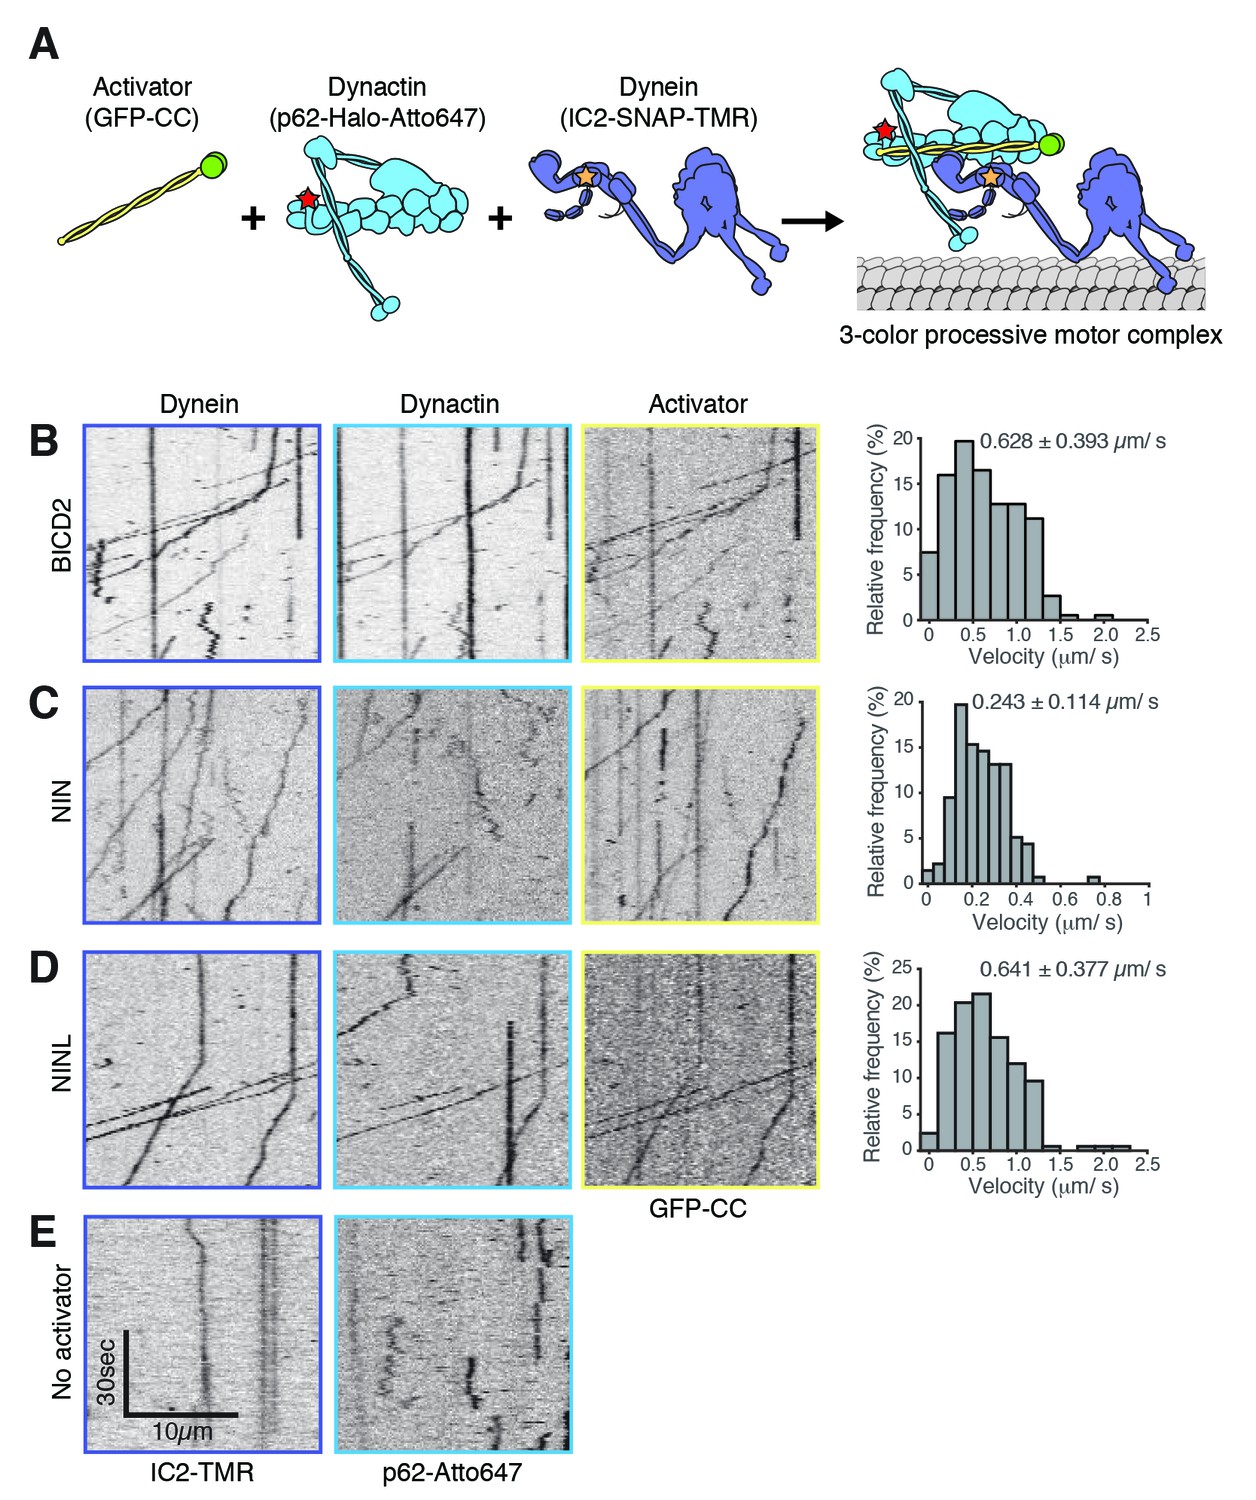
(A) A schematic of the components added to the single-molecule motility assay. Dynein (IC2-TMR; yellow star), dynactin (p62-Atto647; red star) and GFP-tagged (green spheres) activators (BICD2) or candidate activators (NIN and NINL) were purified separately, mixed, and the motility of the complex along microtubules was monitored by nearly simultaneous three-color TIRF microscopy. (B-E).ymographs of each imaging channel (left) and velocity histograms (right) with mean velocity (± S.D.) are shown, n is greater than 146. NIN had a slower velocity in this assay compared to Figure 4G. This could be due to the lack of post-translational modifications in proteins expressed in E. coli; future work will be required to understand this. Data shown is analyzed from one technical replicate, although two technical replicates were collected for each activator and displayed similar trends.
Figure 5—figure supplement 1
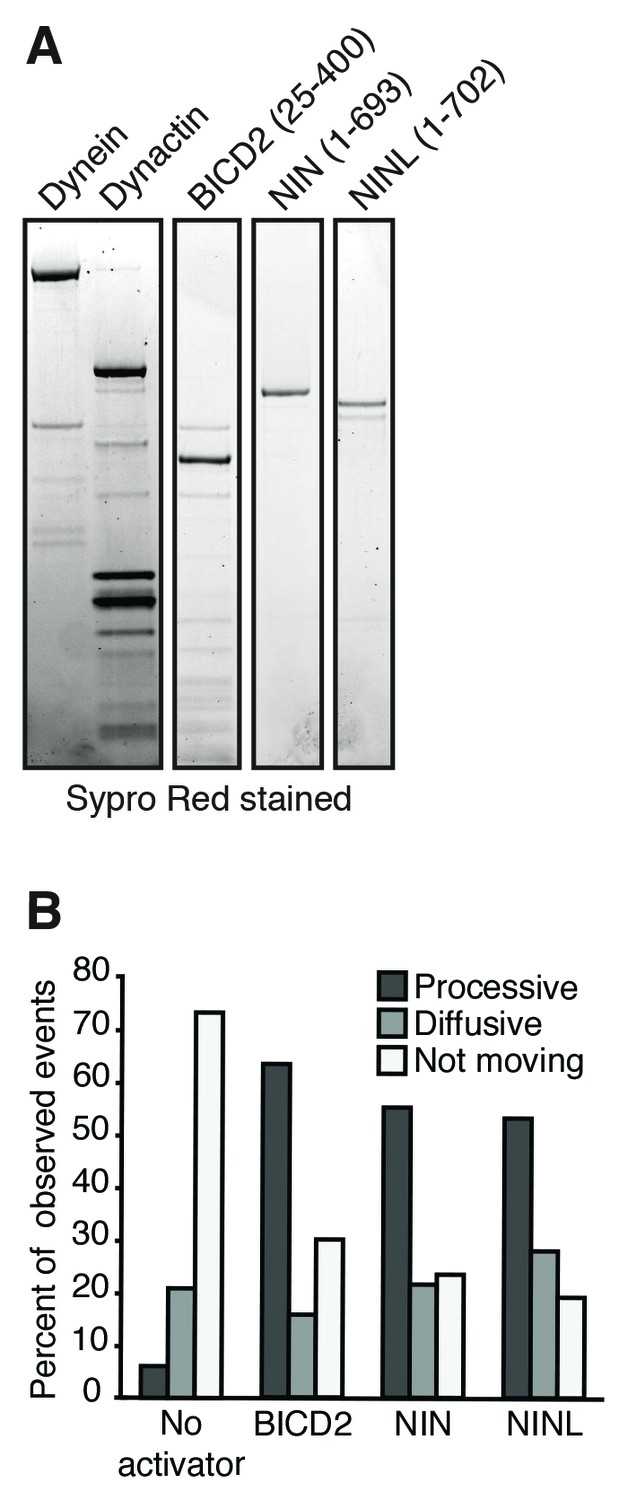
Purification of dynein, dynactin and activators.
(A) Dynein (IC2-SNAP-3×FLAG), dynactin (p62-Halo-3×FLAG) and the activators BICD2 (25–400), NIN (1-693) and NINL (1-702) (GFP-activator-Strep tag) were separately purified and used for the motility assays shown in Figure 5. An SDS-PAGE gel stained with Sypro Red shows the purification of each component. (B) The percentage of processive, diffusive and non-motile events in single-molecule motility assays (as described in E–G) was analyzed.
Figure 6 with 2 supplements
Dynein activators have distinct proteomes.
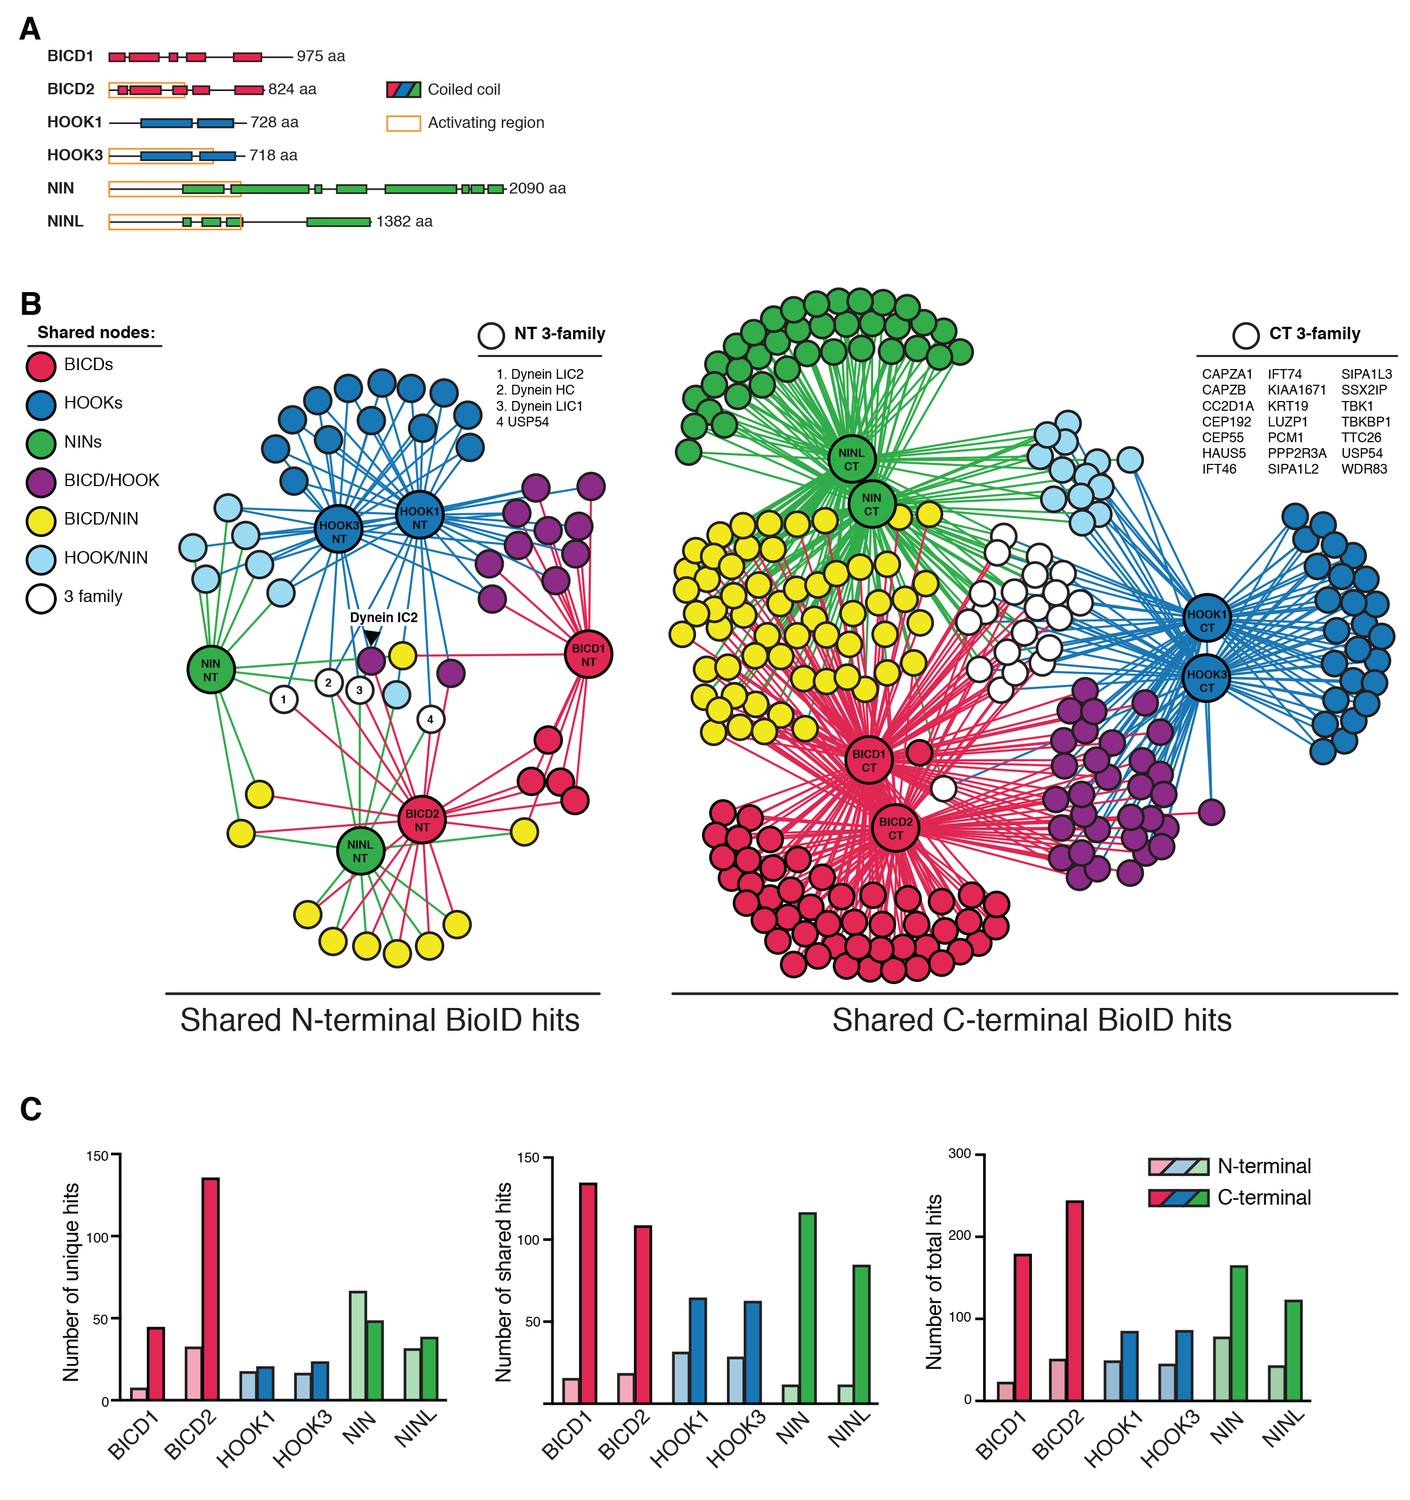
(A) Location of predicted coiled coils in dynein activators, with minimal activating regions shown (orange rectangles). (B) Enriched and significant hits from N- and C-terminal datasets of six activators were used to construct two separate protein-protein interaction networks. Hits specific to an activator family (color-coded according to their respective activators), and hits shared between activator families (HOOK/BICD, purple; BICD/NIN, yellow; NIN/HOOK, cyan) are shown. White spheres (‘3-family’) represent hits enriched in at least one activator from each family. For this figure enrichment is ≥3 fold, significance is p<0.05, Student’s two-tailed t-test; and average spectral counts are ≥2. The location of dynein and dynactin subunits and select hits discussed in the text are indicated. We note that we identified BICD1 in our BICD2 datasets and vice versa (Supplementary files 1 and 4). The same was true for HOOK1 and HOOK3, but not for NIN and NINL (Supplementary files 1 and 4). HOOK proteins have been shown to heterodimerize (Xu et al., 2008), whereas heterodimerization between BICD proteins has not been reported. (C) The number of total, unique (occurring in a single activator N- or C-terminal dataset), and shared (occurring in multiple activator N- or C-terminal datasets) hits for individual activator N- and C-termini are shown.
Figure 6—figure supplement 1
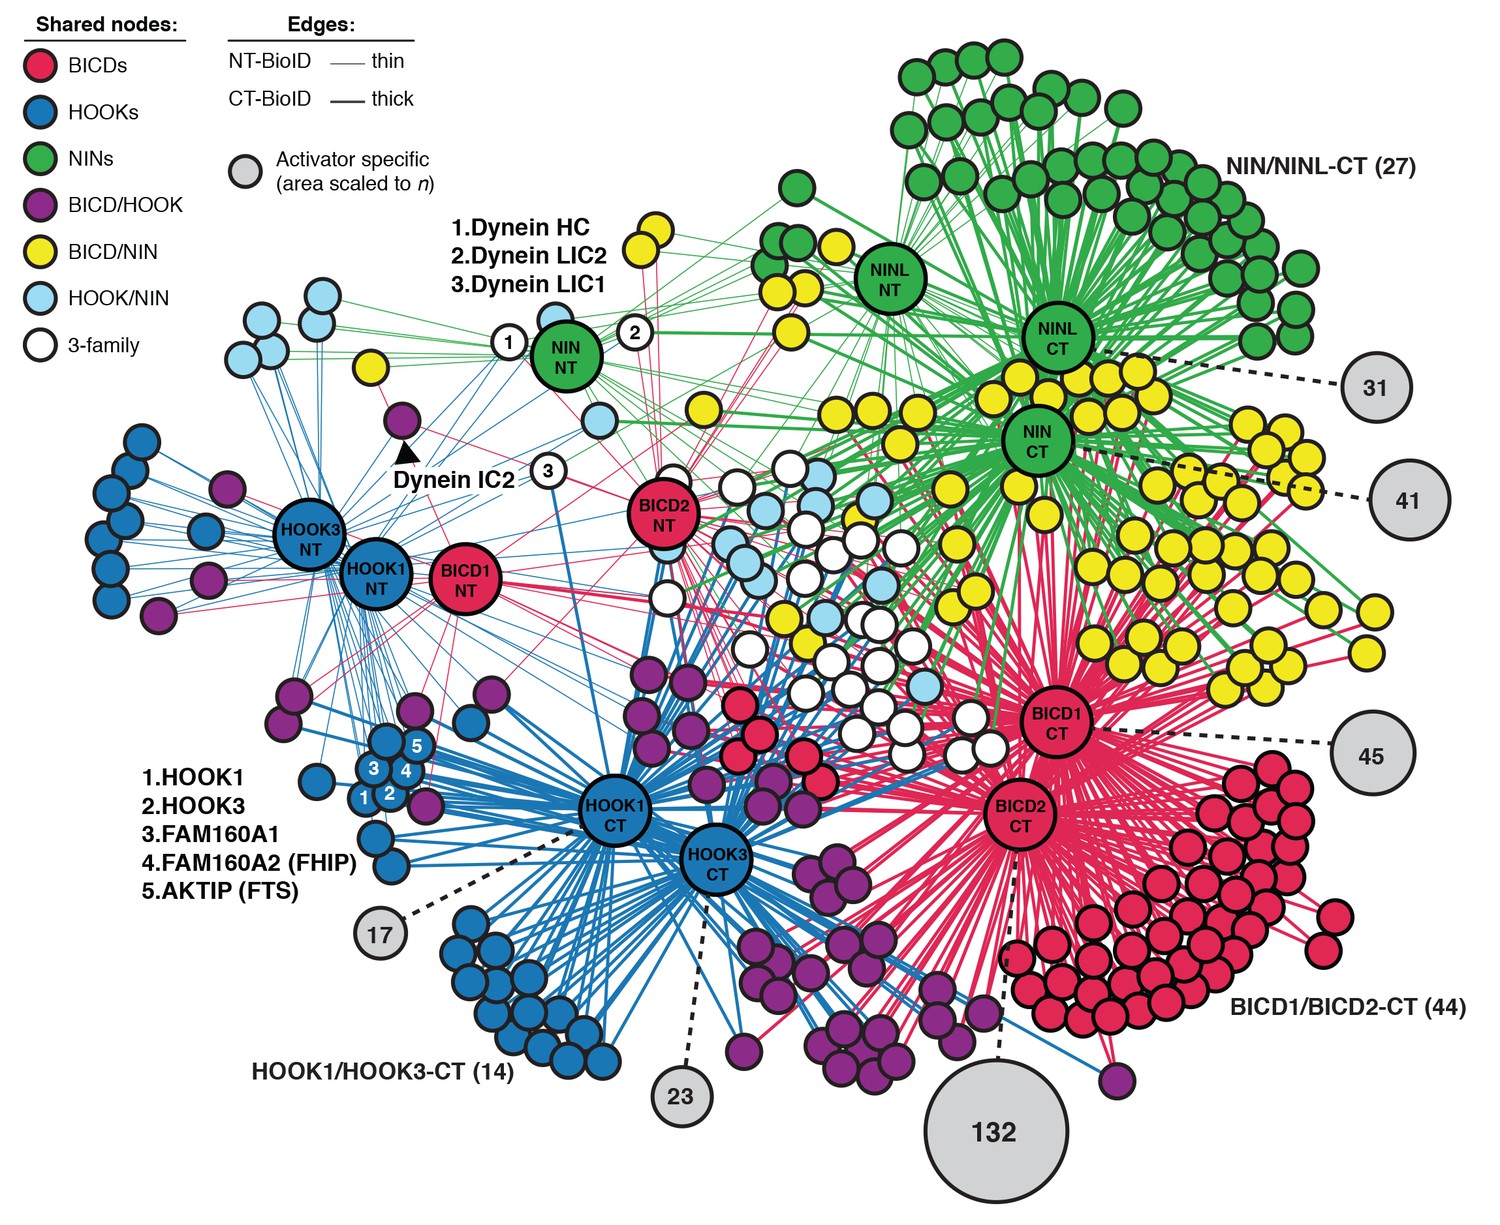
An interaction map of the N- and C-terminal activator datasets combined.
Enriched and significant hits from the combined N- and C-terminal datasets of six activators were used to construct a single protein-protein interaction network. Hits (small spheres) specific to an activator family (color-coded according to their respective activators), and hits shared between activator families (HOOK/BICD, purple; BICD/NIN, yellow; NIN/HOOK, cyan) are shown. White spheres (‘3-family’) represent hits enriched in at least one activator (NT or CT) from each family. Lines connecting spheres (edges) are color coded according to activator family and termini (NT = thin, CT = thick). The regions encompassing activator family CT-specific overlap are indicated with their respective n. The number of unique hits for each dataset is represented as a gray circle that is scaled according to the number of hits and the number of hits is shown. For this figure enrichment is ≥3 fold, significance is p<0.05, Student’s two-tailed t-test; and average spectral counts are ≥2. The location of dynein and dynactin subunits and select hits discussed in the text are indicated.
Figure 6—figure supplement 2
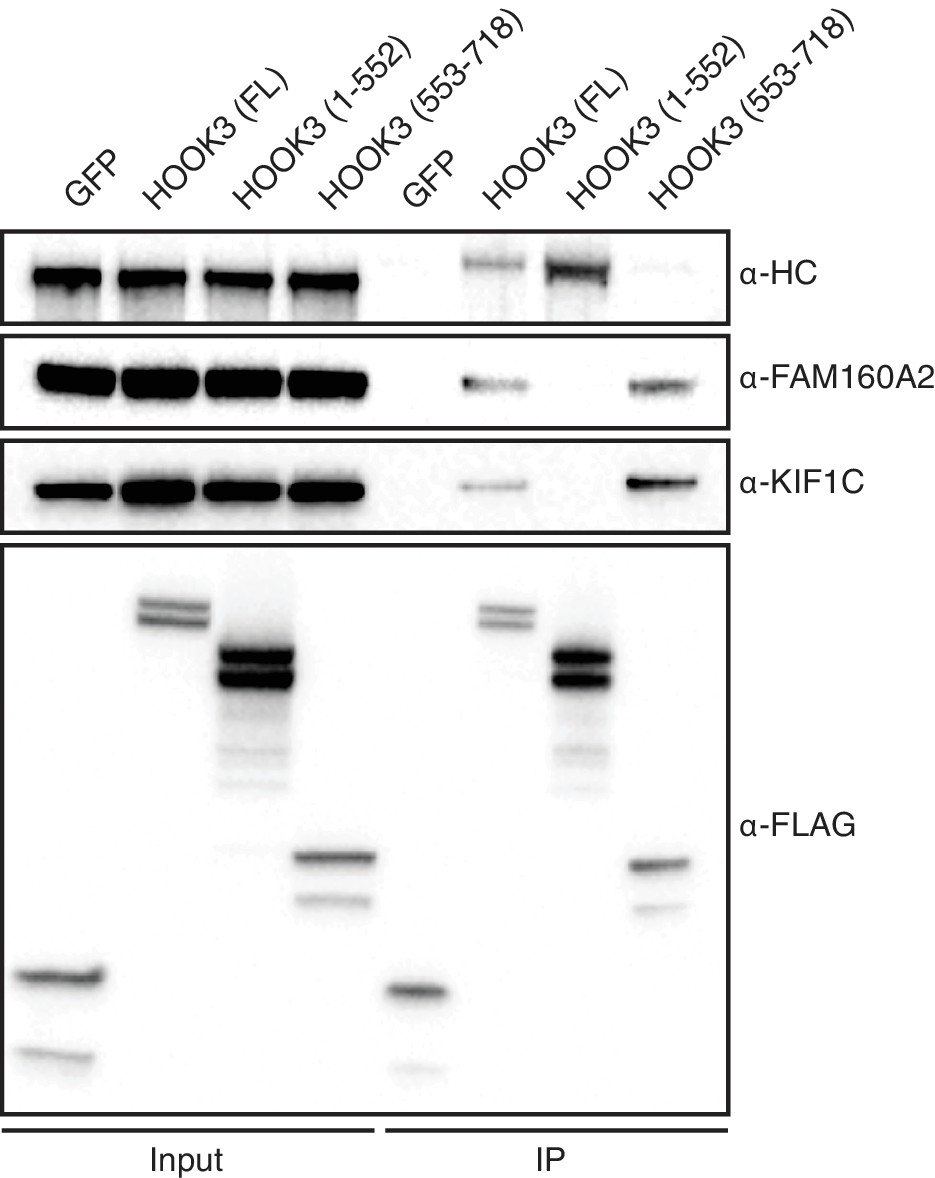
KIF1C is a novel HOOK3-interacting protein.
sfGFP-3×FLAG and full length (FL) HOOK3, HOOK3 (1–552), and HOOK3 (553–718) all tagged with sfGFP and 3×FLAG were immunoprecipitated with α-FLAG antibodies from transiently transfected HEK-293T cells. Western blots with α-HC, α-FAM160A2, α-KIF1C, and α-FLAG antibodies were used to determine which proteins co-immunoprecipitated with each HOOK3 construct.
Tables
Table 1
Total protein expression levels of dynein and dynactin subunits, and activators or candidate activators or adaptors in HEK-293T cells. The number of peptides or phosphopeptides from HEK-293T cells (Huttlin et al., 2015) is shown. Activators or candidate activators identified in our secondary screen are highlighted in bold.
| Protein | Peptides | Phospho-peptides |
|---|---|---|
| Dynein subunits | ||
| DYNC1H1 | 3395 | 9 |
| DYNC1I1 | 5 | 1 |
| DYNC1I2 | 281 | 76 |
| DYNC1LI1 | 499 | 179 |
| DYNC1LI2 | 130 | 29 |
| DYNLT1 | 44 | 0 |
| DYNLT3 | 15 | 0 |
| DYNLRB1 | 94 | 0 |
| DYNLRB2 | Not present | |
| DYNLL1 | 248 | 0 |
| DYNLL2 | 168 | 0 |
| Dynactin subunits | ||
| DCTN1 (p150) | 538 | 0 |
| DCTN2 (p50) | 338 | 13 |
| DCTN3 (p22) | 67 | 0 |
| DCTN4 (p62) | 152 | 0 |
| DCTN5 (p25) | 28 | 0 |
| DCTN6 (p27) | 29 | 0 |
| ACTR1A (Arp1) | 354 | 0 |
| ACTR1B (Arp1) | 222 | 0 |
| ACTR10 (Arp11) | 118 | 2 |
| CAPZA1 | 423 | 1 |
| CAPZA2 | 194 | 0 |
| CAPZB | 387 | 0 |
| Activators or candidate activators | ||
| BICD1 | 35 | 0 |
| BICD2 | 151 | 6 |
| BICDL1 | not present | |
| BICDL2 | not present | |
| HOOK1 | 183 | 13 |
| HOOK2 | 57 | 2 |
| HOOK3 | 130 | 0 |
| CCDC88A (girdin) | 247 | 51 |
| CCDC88B (gipie) | not present | |
| CCDC88C (daple) | 55 | 17 |
| SPDL1 (CCDC99) | 107 | 0 |
| RAB11FIP3 | 4 | 2 |
| NIN | 114 | 20 |
| NINL | 8 | 5 |
| TRAK1 | 17 | 8 |
| TRAK2 | 3 | 1 |
| HAP1 | not present | |
| RILP | not present |
Table 2
Specific pairwise overlap between activator C-terminal BioID datasets. Twelve activator BioID datasets were contrasted (6 N-terminal and 6 C-terminal) to determine for each activator which of its C-terminal hits were specifically shared with other datasets. Those shared with N-terminal datasets were removed. The specific pairwise overlap of the remaining hits with each activator is reported (n and %). Input n = BICD1 (92), BICD2 (87), HOOK1 (39), HOOK3 (37), NIN (74), NINL (53). Only pairwise overlap is represented in this analysis; overlap with multiple activators (e.g. BICD1 overlap with both BICD2 and HOOK1) is not shown.
| BICD1 | BICD2 | HOOK1 | HOOK3 | NIN | NINL | |||||||
|---|---|---|---|---|---|---|---|---|---|---|---|---|
| N | % | N | % | N | % | N | % | N | % | N | % | |
| BICD1 | 44 | 50.6 | 4 | 10.3 | 0 | 0 | 5 | 6.8 | 5 | 9.4 | ||
| BICD2 | 44 | 47.8 | 4 | 10.3 | 7 | 18.9 | 6 | 8.1 | 0 | 0 | ||
| HOOK1 | 4 | 4.3 | 4 | 4.6 | 14 | 37.8 | 3 | 4.1 | 1 | 1.9 | ||
| HOOK3 | 0 | 0 | 7 | 8.0 | 14 | 35.9 | 2 | 2.7 | 1 | 1.9 | ||
| NIN | 5 | 5.4 | 6 | 6.9 | 3 | 7.7 | 2 | 5.4 | 27 | 50.9 | ||
| NINL | 5 | 5.4 | 0 | 0 | 1 | 2.6 | 1 | 2.7 | 27 | 36.5 | ||
Additional files
-
Supplementary file 1
Master file of mass spectrometry data related to Figures 1, 2, 3 and 6.
This excel file contains all of the mass spectrometry data referenced in the manuscript. The first blue tab corresponds to the Flag immunoprecipitation experiment in Figure 1B. The second blue tab contains the dynein core subunits detected in the Flag immunoprecipitation experiment, corresponding to Figure 1C. The purple tab contains all mass spectrometry data related to Figure 2. The pink tabs contain all of the dynein/dynactin interactome mass spectrometry data. This data was used to generate Figure 3C. The green tabs contain all of the activator interactome mass spectrometry data. This data was used to generate Figure 6 and Figure 6—figure supplement 1. ‘NT’ and ‘CT’ indicate that the BioID tag was on the N-terminus or C-terminus of the full-length protein, respectively.
- https://doi.org/10.7554/eLife.28257.017
-
Supplementary file 2
Mass spectrometry data related to Figure 2.
This excel file contains the mass spectrometry data that was used to generate Figure 2C (second tab) and 2D (first tab).
- https://doi.org/10.7554/eLife.28257.018
-
Supplementary file 3
Mass spectrometry data related to Figure 3C and Figure 3—figure supplement 1.
The blue tabs contain the BioID interactome data for IC1, IC2, LIC1, LIC2, TcTex, RB, and p62. Only the data for dynein and dynactin subunits and known (BICD2, HOOK1 and HOOK3) and suspected (BICD1) activators are shown. The blue tab titled ‘mapping color code’ lists the dynein and dynactin subunits enriched in the BioID experiments and graphically displayed in Figure 3C. Shading indicates enrichment value: light gray (2–3 fold) or dark gray (≥3 fold), p<0.05 (Student’s two-tailed t-test). The entire datasets can be found in Supplementary file 1 (pink tabs in Supplementary file 1). The pink tabs in this excel file contain all of the significant hits from each BioID tagged dynein and dynactin subunit. Significance was defined as >3 fold enrichment, p-values<0.05 (Students two-tailed t-test), and average spectral counts > 2. This data was used to generate the network shown in Figure 3—figure supplement 1. The pink tab titled ‘core hits’ lists the gene names for all hits, specific hits (unique to each tagged subunit), and hits shared by at least two datasets, for the dynein and dynactin BioID tagged subunits. The pink tab titled ‘core Venn’ contains the output from the Venn analysis (http://bioinformatics.psb.ugent.be/webtools/Venn/) of the dynein and dynactin core subunit interactomes used to generate the network shown in Figure 3—figure supplement 1. Proteins found in only one dataset are listed in the excel file, but not shown in the network.
- https://doi.org/10.7554/eLife.28257.019
-
Supplementary file 4
Mass spectrometry data related to Figure 6 and Figure 6—figure supplement 1.
The green tabs contain all significant hits from the NT and CT BioID tagged activator datasets. Significance was defined as >3 fold enrichment, p-values<0.05 (Students two-tailed t-test), and average spectral counts > 2. The blue tab titled ‘NT hits’ lists the gene names for all hits, specific hits (unique to each tagged activator), and hits shared by at least two datasets, for the NT-activator BioID tagged subunits. The blue tab titled ‘NT Venn’ contains the output from the Venn analysis (http://bioinformatics.psb.ugent.be/webtools/Venn/) of the NT activator interactomes used to generate the network shown in Figure 6B. Proteins found in only one dataset are listed in the excel file, but not shown in the network. The blue tab titled ‘white spheres NT’ highlights (in grey) the four hits that were shared by an activator from each activator family (i.e. BICD, HOOK, and NIN). The orange tab titled ‘CT hits’ lists the gene names for all hits, specific hits (unique to each tagged activator), and hits shared by at least two datasets, for the CT-activator BioID tagged subunits. The orange tab titled ‘CT Venn’ contains the output from the Venn analysis (http://bioinformatics.psb.ugent.be/webtools/Venn/) of the CT activator interactomes used to generate the network shown in Figure 6B. Proteins found in only one dataset are listed in the excel file, but not shown in the network. The orange tab titled ‘white spheres CT’ highlights (in grey) the 21 hits that were shared by an activator from each activator family (i.e. BICD, HOOK, and NIN). The pink tabs contain data that contrast all of the activator hits, combining the NT and CT datasets. The pink tab titled ‘NT-CT combined hits’ contains the gene names that are specific for each termini of each activator or shared between any dataset. The pink tab titled ‘NT-CT combined Venn’ contains the output from the Venn analysis (http://bioinformatics.psb.ugent.be/webtools/Venn/) of all activator interactomes used to generate the network shown in Figure 6—figure supplement 1.
- https://doi.org/10.7554/eLife.28257.020
-
Supplementary file 5
GO analysis of dynein activator C-terminal BioID datasets.
This excel file contains gene ontology analyses using the ‘cellular component’ option (GO, geneontology.org). The GO terms with p-values<0.05 are shown for hits that were shared in at least three C-terminal BioID datasets; C-terminal hits that were specific to BICD2, HOOK1, HOOK3, NIN, and NINL; and C-terminal hits that were shared by activator family members BICD1 and BICD2, HOOK1 and HOOK3, and NIN and NINL.
- https://doi.org/10.7554/eLife.28257.021
Download links
A two-part list of links to download the article, or parts of the article, in various formats.
Downloads (link to download the article as PDF)
Open citations (links to open the citations from this article in various online reference manager services)
Cite this article (links to download the citations from this article in formats compatible with various reference manager tools)
The human cytoplasmic dynein interactome reveals novel activators of motility
eLife 6:e28257.
https://doi.org/10.7554/eLife.28257


