Concentration dependent chromatin states induced by the bicoid morphogen gradient
- Howard Hughes Medical Institute, Princeton University, United States
Figures
Figure 1 with 1 supplement
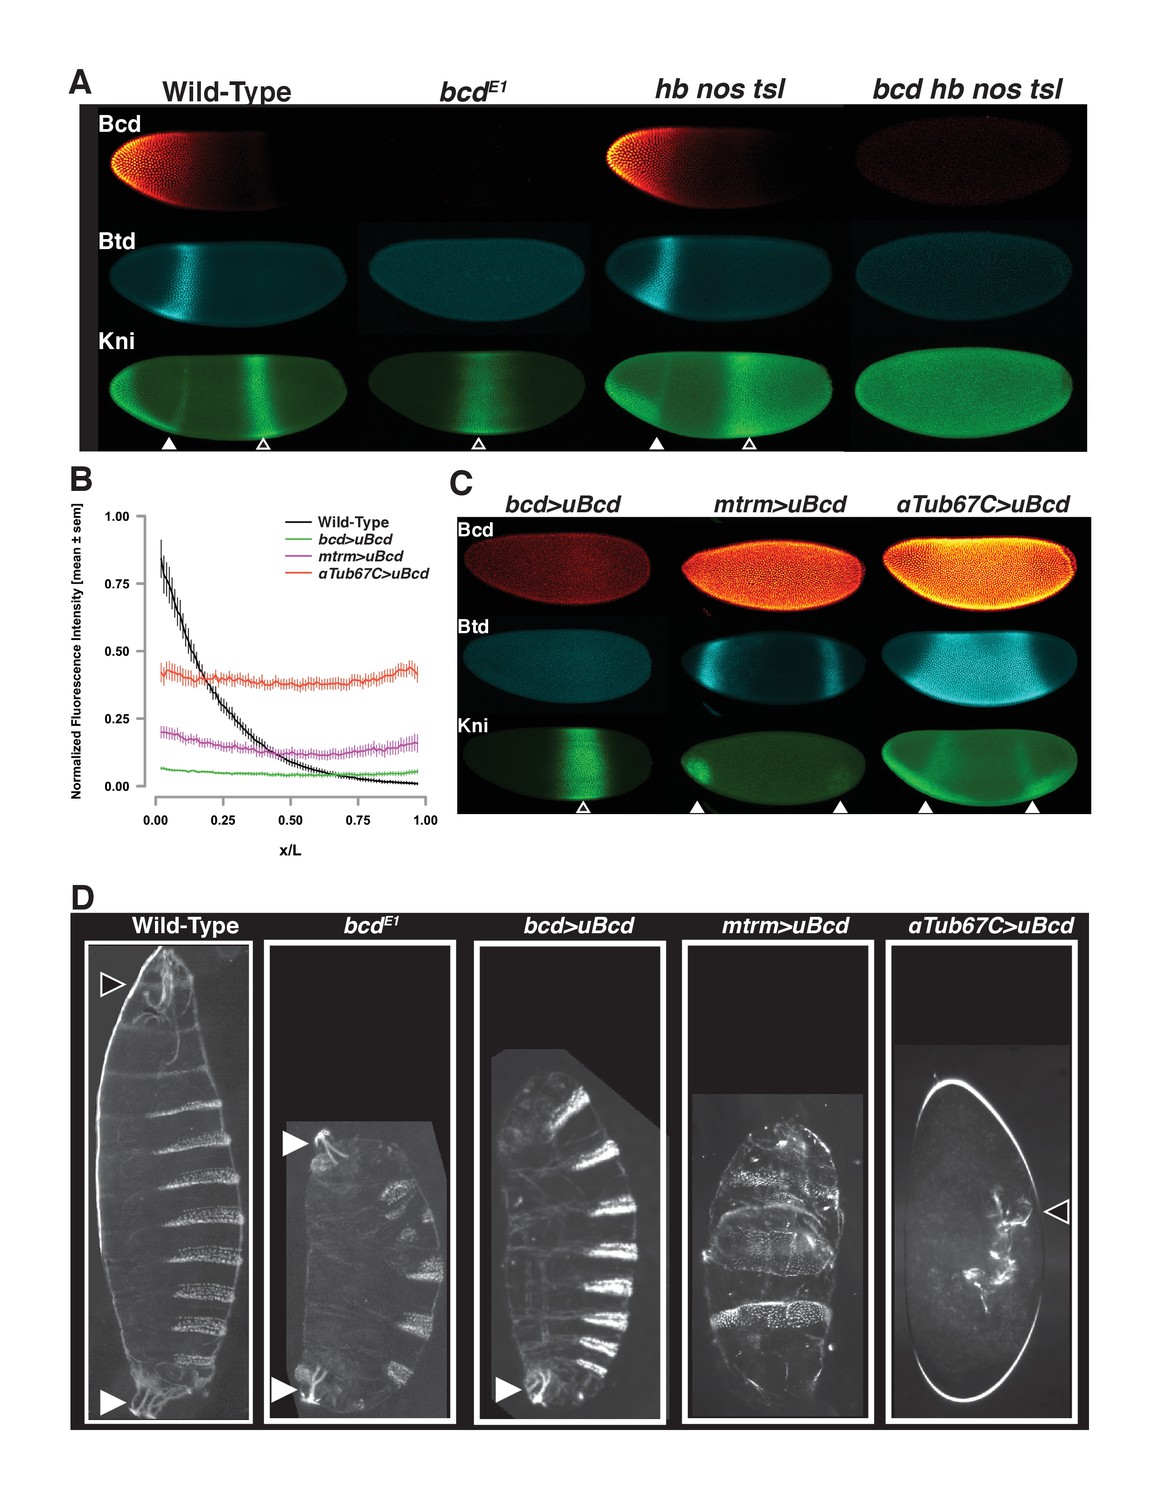
Uniform Bcd expression specifies cell fates corresponding to levels of expression.
(A) Wild-type, bcd null mutant (bcdE1), and maternal hunchback, nanos, torso-like (hb nos tsl) triple mutant and bcd hb nos tsl mutant embryos at NC14 immunostained with antibodies against Bcd, Btd, and Kni. Embryos are oriented with anterior to the left. The anterior Kni domain (filled arrow) is absent in bcd but restored in hb nos tsl embryos, while the posterior stripe (open arrow) shifts anteriorly in in bcd but expands posteriorly in hb nos tsl. Neither Btd nor Kni exhibit patterned expression in bcd hb nos tsl. Images are maximum z-projections and image contrast was adjusted uniformly across the entire image for display. See Figure 1—figure supplement 1A for quantification of Kni intensity between genotypes. (B) Expression levels of uniform GFP-Bcd transgenic constructs relative to wild-type Bcd expression. Live embryos were imaged in during NC14, and dorsal profiles were plotted. Error bars are standard error of the mean. For wild-type, n = 23 embryos; bcd-uBcd n = 13; mtrm-uBcd n = 7; and αTub67C-uBcd n = 14. See also Figure 1—figure supplement 1D and Table 6. (C) Immunostaining as (A), for each level of uniform Bcd. Anterior target gene expression is absent at the lowest level. At intermediate (mtrm) and high (αTub67C) levels of uBcd, anterior expression patterns are expanded and/or duplicated in the posterior, and posterior expression of Kni is absent. (D) Larval cuticle preparations for the indicated genotypes. Embryos are oriented with anterior at the top. Head structures are indicated with open arrows and tail structures with filled arrows. αTub67C >uBcd embryos develop essentially no cuticle tissue, but form only what appear to be anteriorly-derived mouth structures. mtrm >uBcd results in a duplication of the anterior-most abdominal denticles in the anterior and posterior of the embryo, with no clear terminal structures forming at either end. bcd >uBcd embryos have a normal posterior and all abdominal segments, but no thoracic or head structures. Images of individual embryos were rotated and cropped to exclude nearby embryos and air bubbles.
Figure 1—figure supplement 1
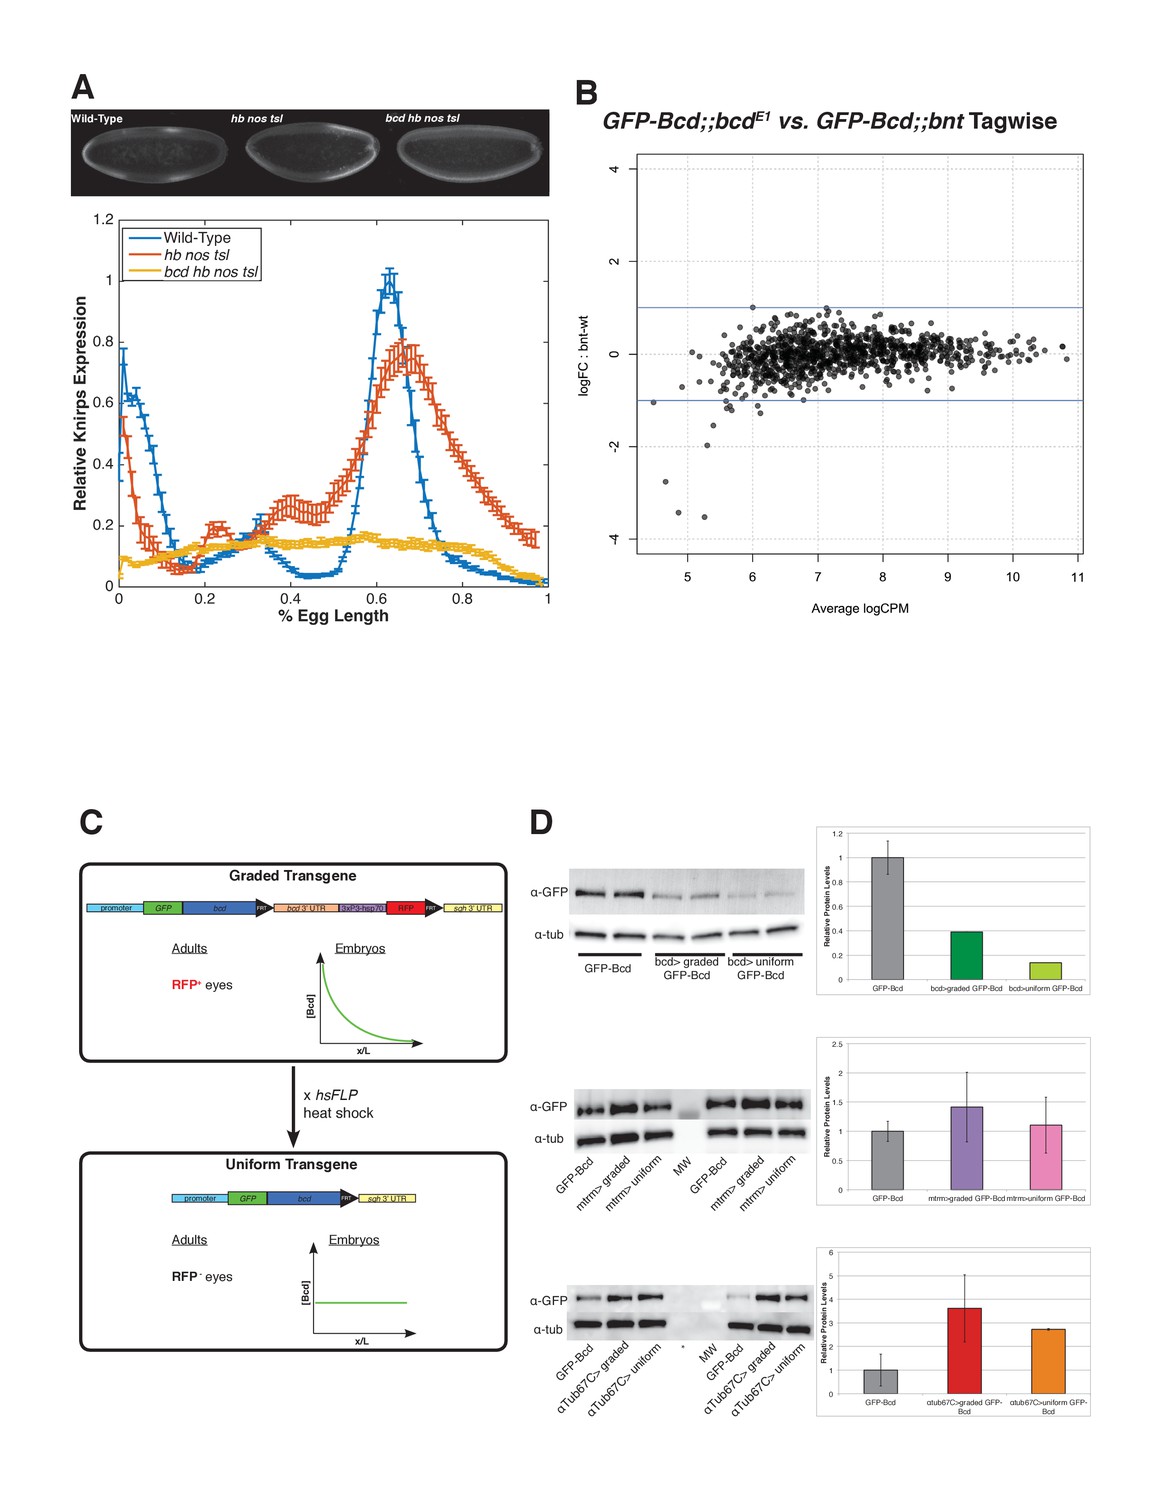
Target gene expression and Bcd binding in maternal matterning mutants and features the uniform Bcd transgene.
(A) Quanitification of Knirps intensity in wild-type, triple mutant (hb nos tsl) and quadruple mutant (bcd hb nos tsl). Bicoid activates patterned expression of Knirps. In embryos in which Bicoid is the only source of maternal patterning information (hb nos tsl), a broad domain of Kni is expressed in the posterior of the embryo. In quadruple mutant embryos, a low level of uniform Knirps is expressed ubiquitously, suggesting that Bcd is required for activating expression of knirps above a background level. Heat-fixed embryos from wild-type (Oregon-R) mothers, hunchback nanos torso-like germline clones and bicoid hunchback nanos torso-like germline clones were pooled and immunostained in a single tube with a rat anti-Knirps primary antibody and Alexa-647 rat antibody. Embryos were mounted on a single slide and imaged by confocal microscopy. Representative embryos for each genotype are shown. Fluorescence intensity of Knirps was extracted from dorsal profiles of midsagittal sections of embryos and plotted using MATLAB. Data are fluorescence intensity minus background, and error bars are standard error of the mean for n = 5 wild-type, n = 8 hb nos tsl, and n = 6 bcd hb nos tsl embryos. (B) Smear plot generated in EdgeR (Robinson et al., 2010) showing the log transformed fold-change in Bcd binding between mutant and wild-type embryos for each Bcd peak, vs. the average log transformed sequencing read counts per million (CPM). Bcd binding shows no significant changes between wild-type and nos tsl mutant embryos. Significance was determined using EdgeR to perform a pairwise exact test with a cutoff of FDR ≤ 0.05, comparing binding between eGFP-Bcd;;bcdE1 and eGFP-Bcd;; bcdE1 hbFB nosL7 tsl4 in the 1,027 Bcd peaks. (C) Schematic of the uniform Bcd transgene. The uniform Bcd transgene contains an N-terminal GFP-tagged Bcd driven by the various maternal promoters discussed in the text. Downstream of the bcd coding sequence is a cassette containing the endogenous bcd 3'UTR and a 3xP3-hsp70 promoter driving promoter of RFP. This cassette is flanked by FRT sites. The sqh 3'UTR lies downstream of the FRT cassette. Flies expressing this version of the transgene can be identified by RFP expression in their eyes, and females produce embryos in which Bcd is distributed in a gradient. Males from this transgenic stock are crossed to females expressing a heat shock inducible flippase (hsFLP), and heat shocking the F1 larvae results in recombination and excision of the cassette at the FRT sites, bringing the sqh 3'UTR directly downstream of the bcd coding sequence. This initially results in mosaic F1 flies with a mosaic graded/uniform Bcd germline. The F1 are further outcrossed to bcdE1 mutants and F2 individuals producing embryos with uniform Bcd distributions can be identified by the lack of RFP expression in the eyes. (D) Expression levels of uniform Bcd constructs measured by western blots. Western blots for GFP-Bcd were performed on embryos at NC14. Representative gels and quantifications are shown for the bcd promoter-driven transgene (A), mtrm promoter-driven transgene (B) and αTub67C promoter-driven transgene (C). In the barplots, band intensities are reported relative to wild-type (GFP-Bcd). All lanes are normalized to an α-tubulin loading control. Error bars are standard deviation between two biological replicates for each sample. MW = molecular wt marker, *=skipped lane.
Figure 2 with 2 supplements
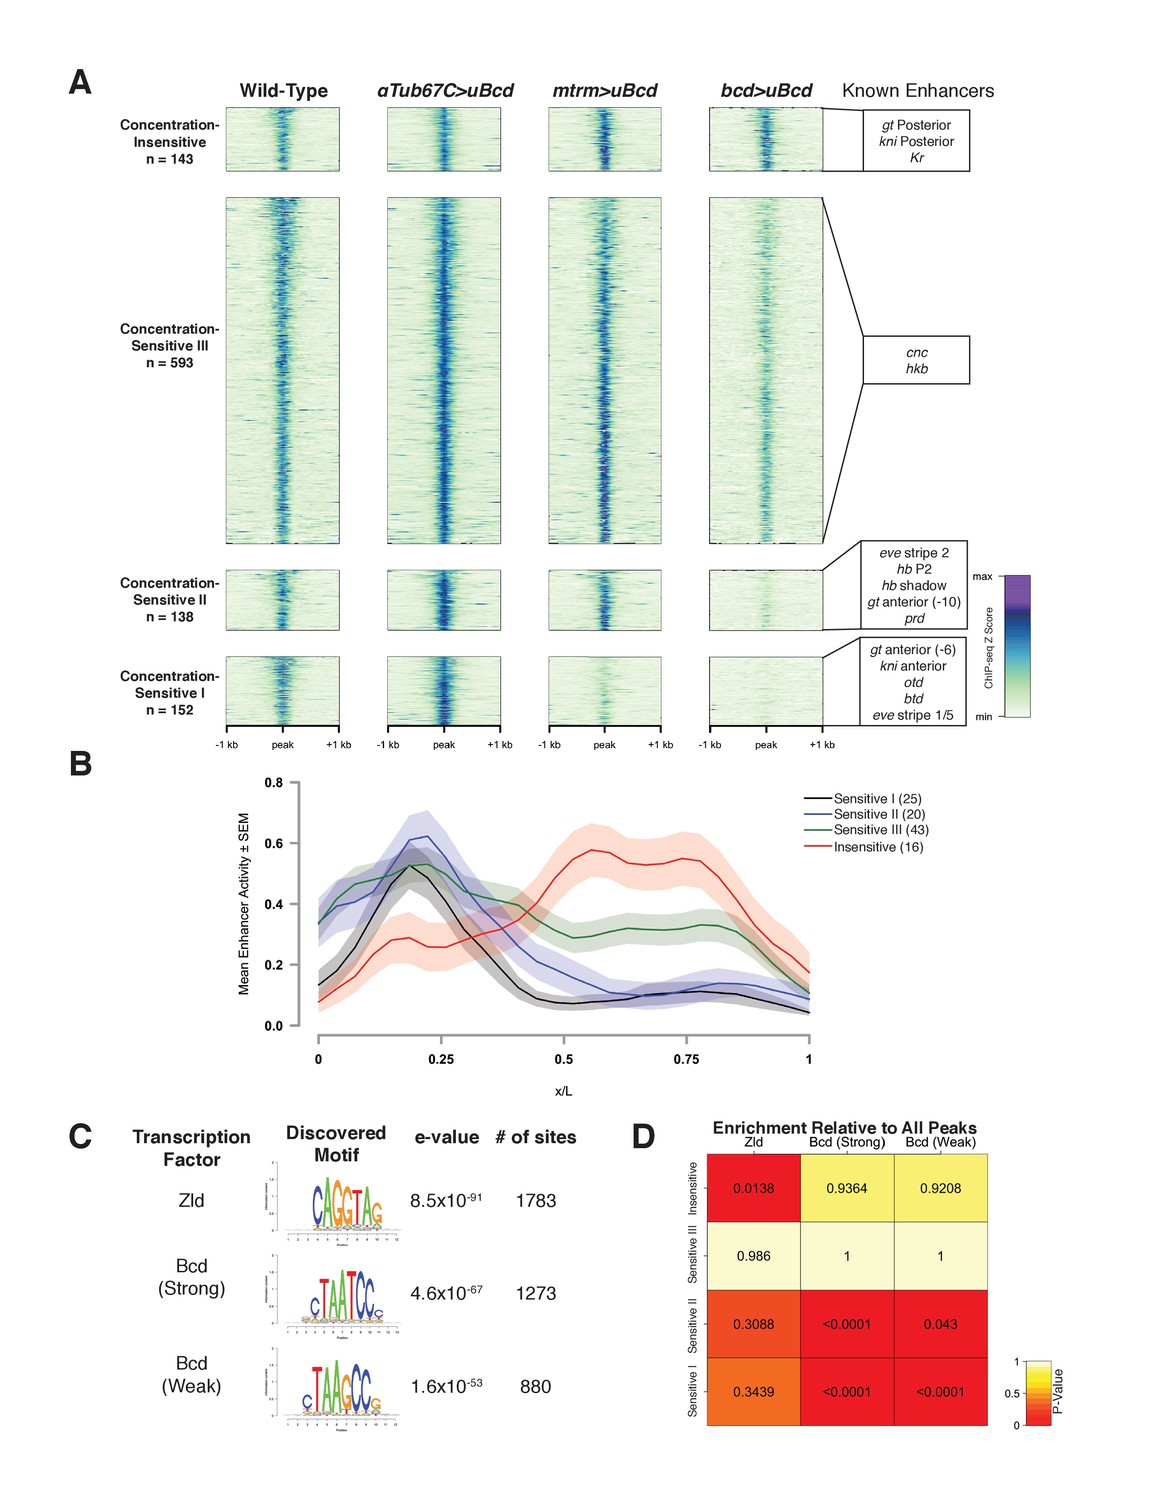
Bcd-bound regions are classified into groups of increasing sensitivity to Bcd concentration.
(A) ChIP-seq data in Bcd-bound peaks. Data is displayed as a heatmap of z-score normalized ChIP-seq reads, in a 2 kilobase region centered around each peak. Peaks in each class are arranged in order of decreasing z-scores in wild-type embryos. One peak (peak 549, see Supplementary file 1) was not classified, as it showed increasing binding at decreasing Bcd concentrations. Previously characterized enhancers overlapping with each class are indicated at right. Concentration-Insensitive: the posterior stripe enhancers for both knirps (Pankratz et al., 1992) and giant (Schroeder et al., 2004), and the Krüppel CD1 enhancer (Hoch et al., 1991). Concentration-Sensitive III: cap’n’collar (Schroeder et al., 2004), and huckebein (Häder et al., 2000) enhancers. Concentration-Sensitive II: the hunchback P2 proximal (Struhl et al., 1989) and shadow enhancers (Perry et al., 2011), the even-skipped stripe 2 enhancer (Goto et al., 1989), an early paired enhancer (Ochoa-Espinosa et al., 2005), and an anterior enhancer for giant (Schroeder et al., 2004). Concentration-Sensitive I: buttonhead (Wimmer et al., 1995), orthodenticle (Gao and Finkelstein, 1998), and anterior enhancers for both knirps and giant (Schroeder et al., 2004). (B) Mean expression patterns of Vienna Tile-GAL4 enhancer reporters overlapping with Bcd peaks in each sensitivity class. Peaks and Vienna Tiles with more than one overlap, as well as 11 Vienna Tiles that drove expression at a level too low to quantify, were excluded from the plot. (C) Top DNA motifs discovered by RSAT peak-motifs. The e-value for is a p-value computed from a binomial distribution for a given motif in the dataset, corrected for multiple testing. See Figure 2—figure supplement 1 for de novo motif discovery in each sensitivity class. (D) Heatmap displaying the enrichment of a given motif in each sensitivity class, relative to the peak list as a whole. P-values were generated from permutation tests (n = 10,000 tests).
Figure 2—figure supplement 1
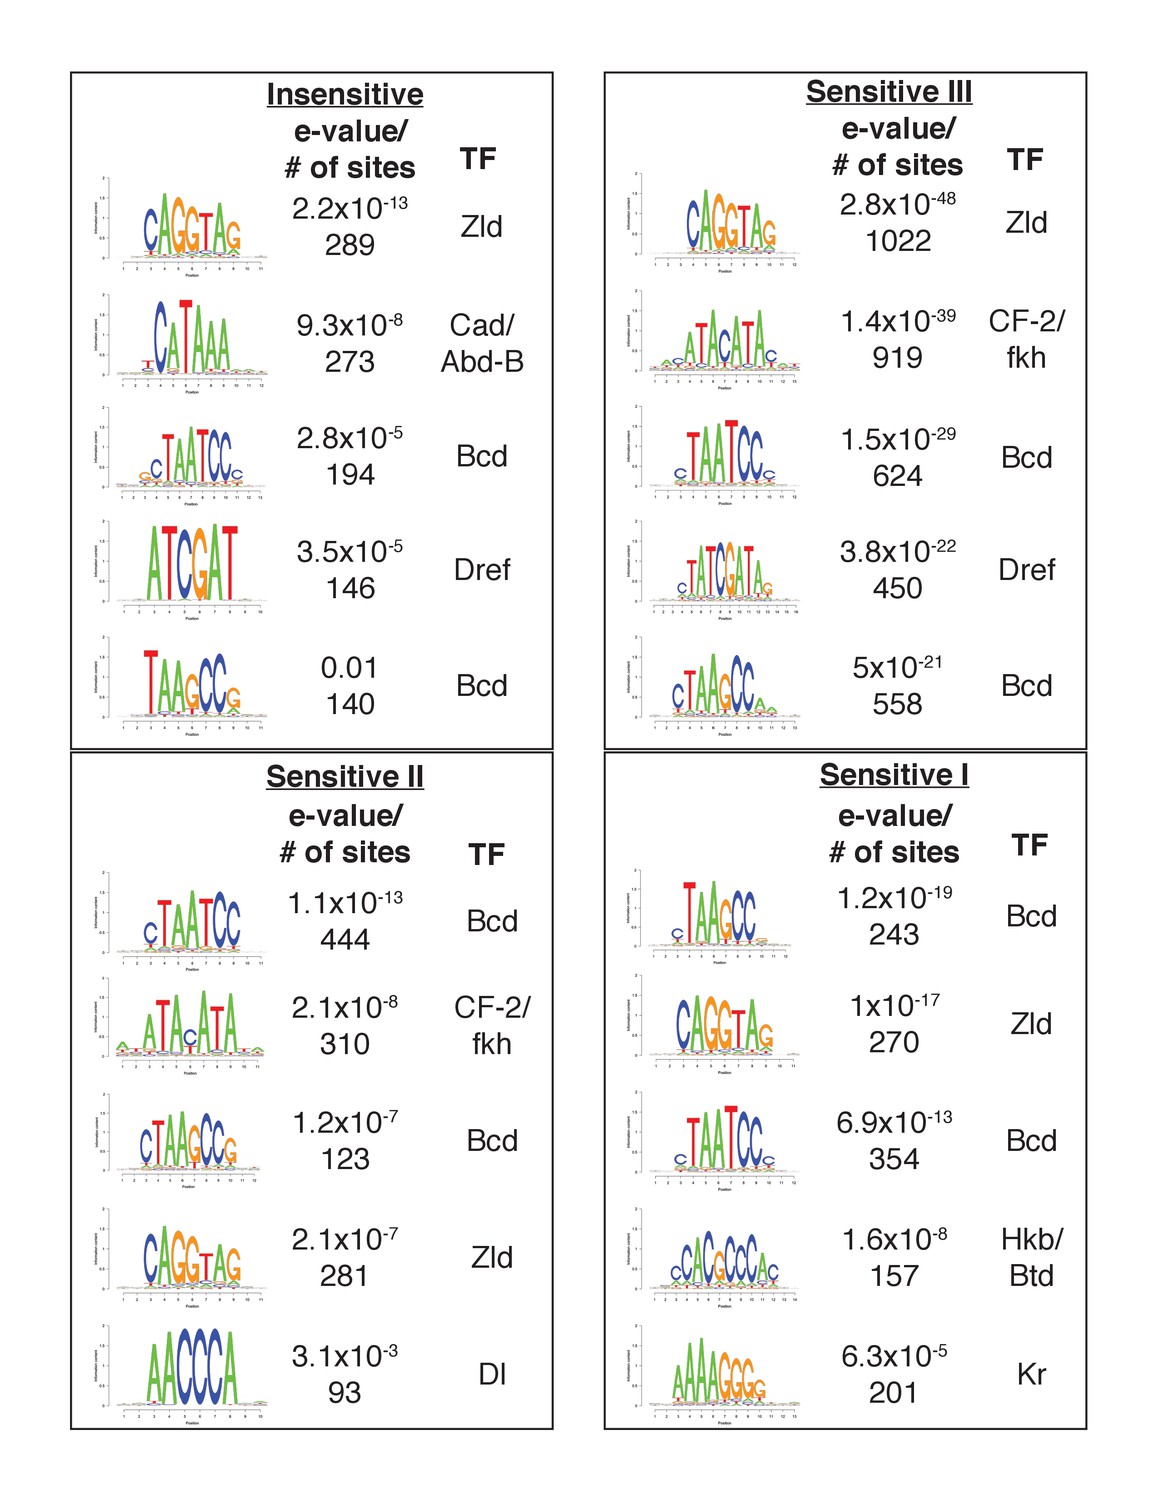
Enrichment for binding and motifs of transcription factors in Bcd sensitivity classes.
De novo motif discovery performed with RSAT as in Figure 2C, for each of the Bcd sensitivity classes individually. The top five enriched motifs are displayed for each sensitivity class.
Figure 2—figure supplement 2
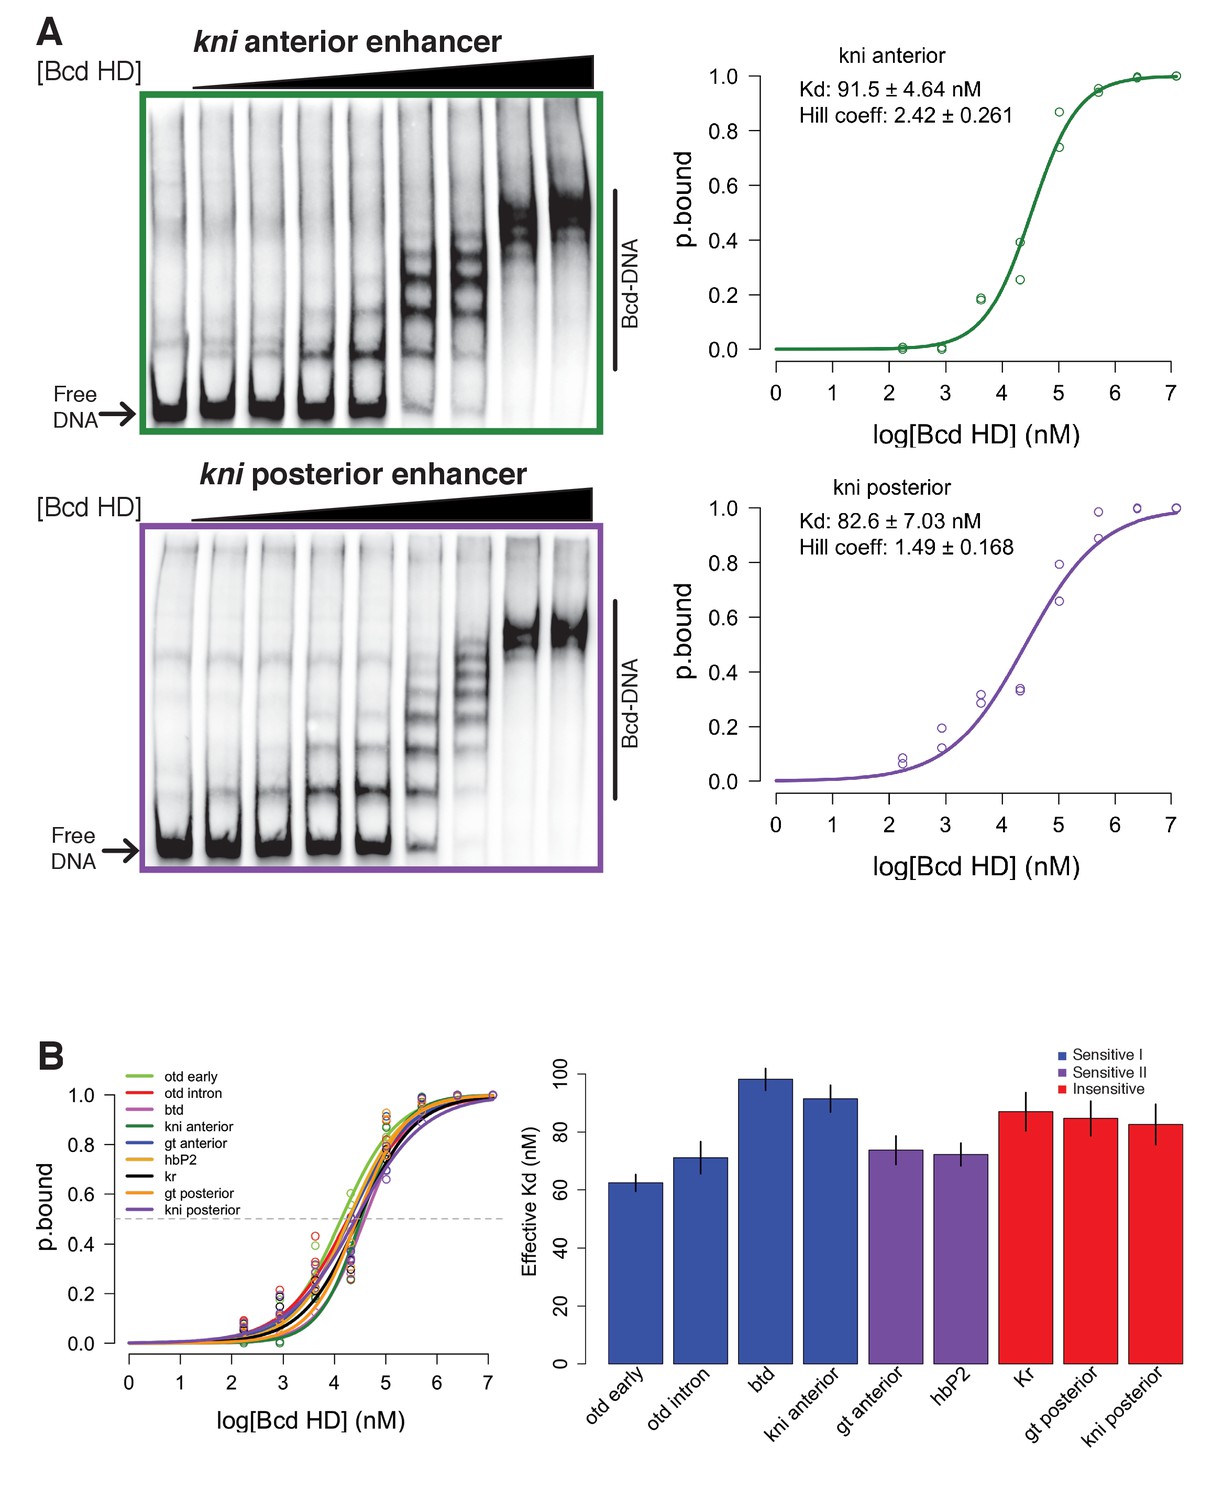
In vitro binding affinity of target enhancers for Bcd protein is insufficient to explain in vivo binding behavior.
(A) Representative gels from EMSAs with kni anterior or posterior enhancer sequence used as DNA probe. Binding curves display the log transformed Bcd concentration is plotted vs. ratio of bound to shifted probe (p.bound). (B) Binding curves for nine EMSA probes show largely overlapping profiles of in vitro affinity for Bcd. (C) Effective Kd measurements for nine EMSA probes do not correspond to in vivo behavior of the same DNA sequences. In vivo sensitivity classifications determined by ChIP-seq are indicated by color of bars. Error bars are standard error from 2 to 3 technical replicates per DNA probe.
Figure 3 with 1 supplement
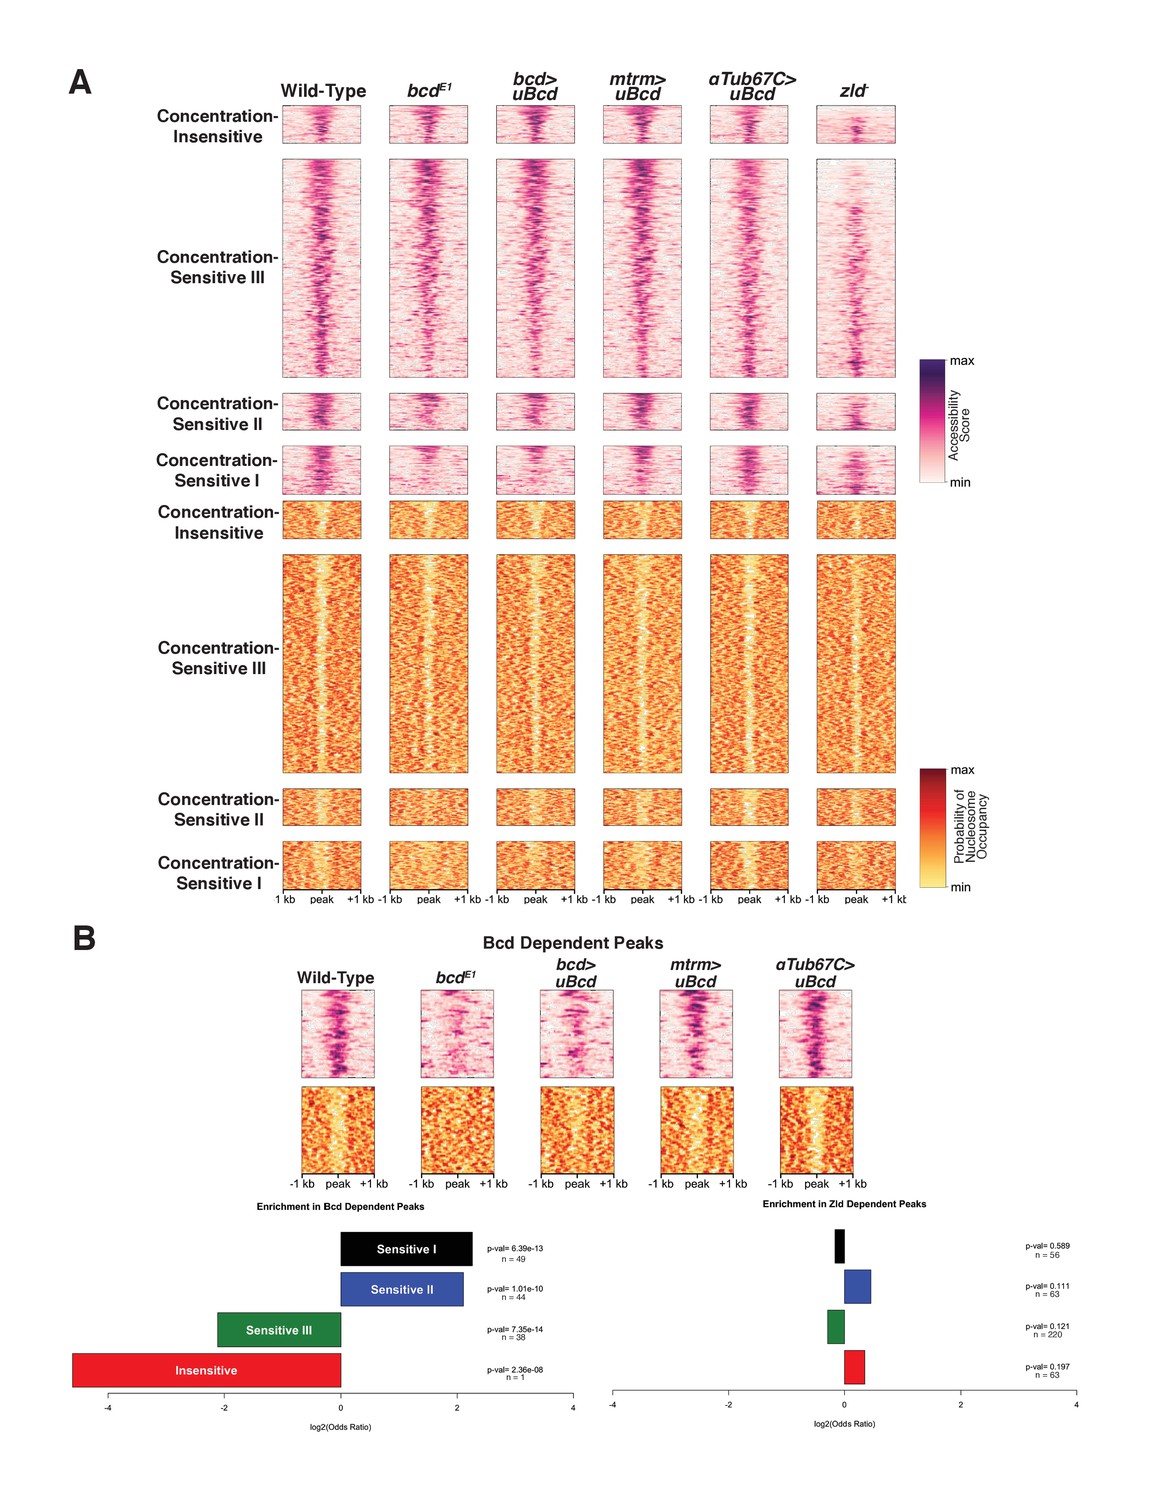
Bcd drives chromatin accessibility primarily at concentration-sensitive targets.
(A) Heatmaps showing chromatin accessibility (top) and probability of nucleosome occupancy (bottom) around Bcd-bound peaks from ATAC-seq experiments. Peak regions are arranged by decreasing accessibility in wild-type embryos. bcdE1 mutant embryos show a loss of accessibility and increased nucleosome occupancy most strongly at the Concentration-Sensitive I and II peaks. zld- embryos show reduced accessibility across all sensitivity classes. (B) Subset of 132 Bcd-bound peaks selected from (A) that become inaccessible in the absence of Bcd. Accessibility at these peaks increases with increasing concentrations of uniform Bcd. Odds ratios and p-values calculated from Fisher's exact test show significant overrepresentation of the Concentration-Sensitive I and II classes in the Bcd- and Zld-dependent peaks. n values indicate the number of peaks in each sensitivity class that are Bcd or Zld dependent.
Figure 3—figure supplement 1
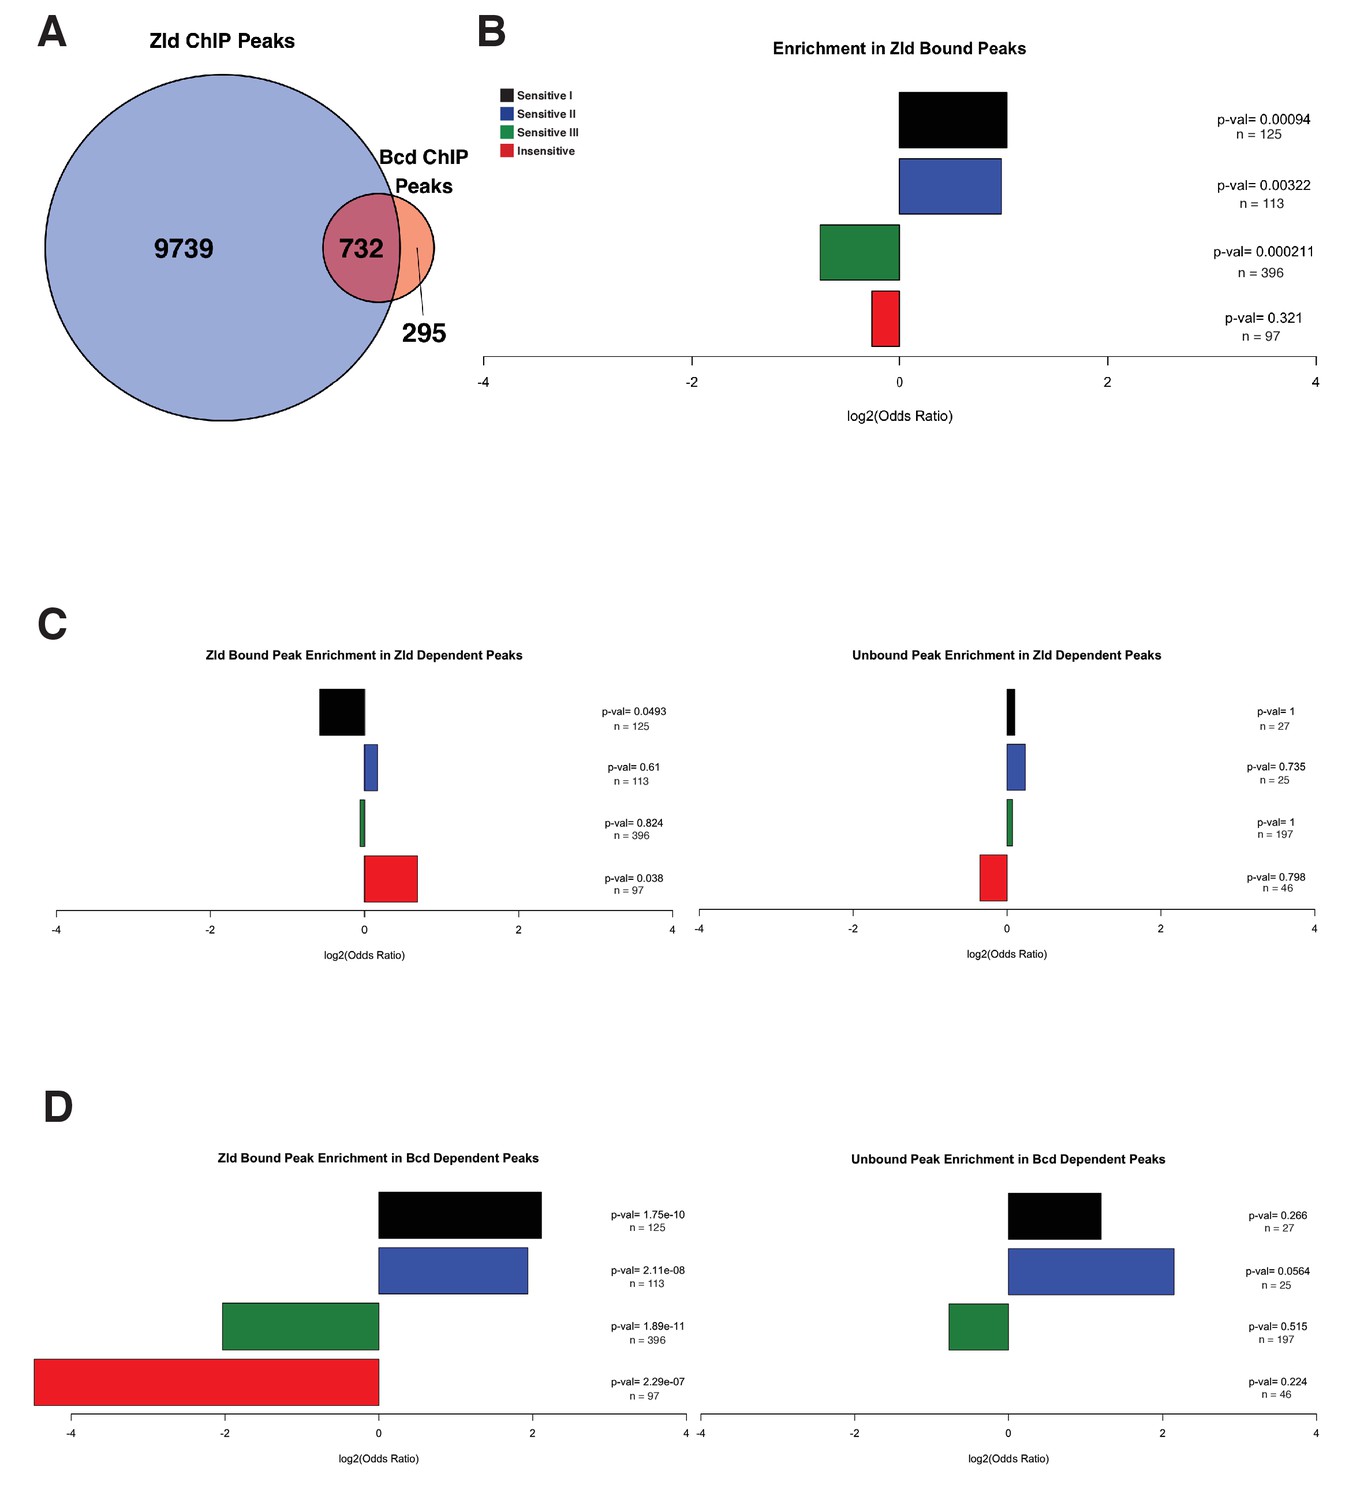
Enrichment of Bcd sensitivity classes in Zld bound peaks.
(A) Overlap between Zld ChIP-seq peaks from Harrison et al. (2011) and Bcd ChIP-seq peaks defined in this study. A total of 732 of Bcd ChIP peaks (71.3%) overlap with Zld peaks. (B) Odds ratios and p-values calculated from Fisher's exact tests for enrichment of each Bcd peak class in peaks that are also bound by Zld. In contrast to Zld dependence as defined by reduced chromatin accessibility in zld– embryos, Concentration Sensitive I and II classes show a greater enrichment for Zld binding than the Concentration Sensitive III and Insensitive classes. (C) Odds ratios and p-values calculated from Fisher's exact tests for enrichment of each Bcd peak class in Zld dependent peaks, separated into those bound and not bound by Zld. Concentration insensitive peaks that are bound by Zld are overrepresented in Zld dependent peaks, while Concentration Sensitive I peaks are underrepresented. In Bcd peaks that are not bound by Zld, no sensitivity class is significantly enriched for Zld dependence. (D) Odds ratios and p-values calculated from Fisher's exact tests for enrichment of each Bcd peak class in Bcd dependent peaks, separated into those bound and not bound by Zld. Concentration Sensitive I and II peaks that are also bound by Zld are overrepresented in Bcd dependent peaks, while Concentration Sensitive III and Insensitive peaks are underrepresented. In Bcd peaks that are not bound by Zld, no sensitivity class is significantly enriched in for Bcd dependence.
Figure 4
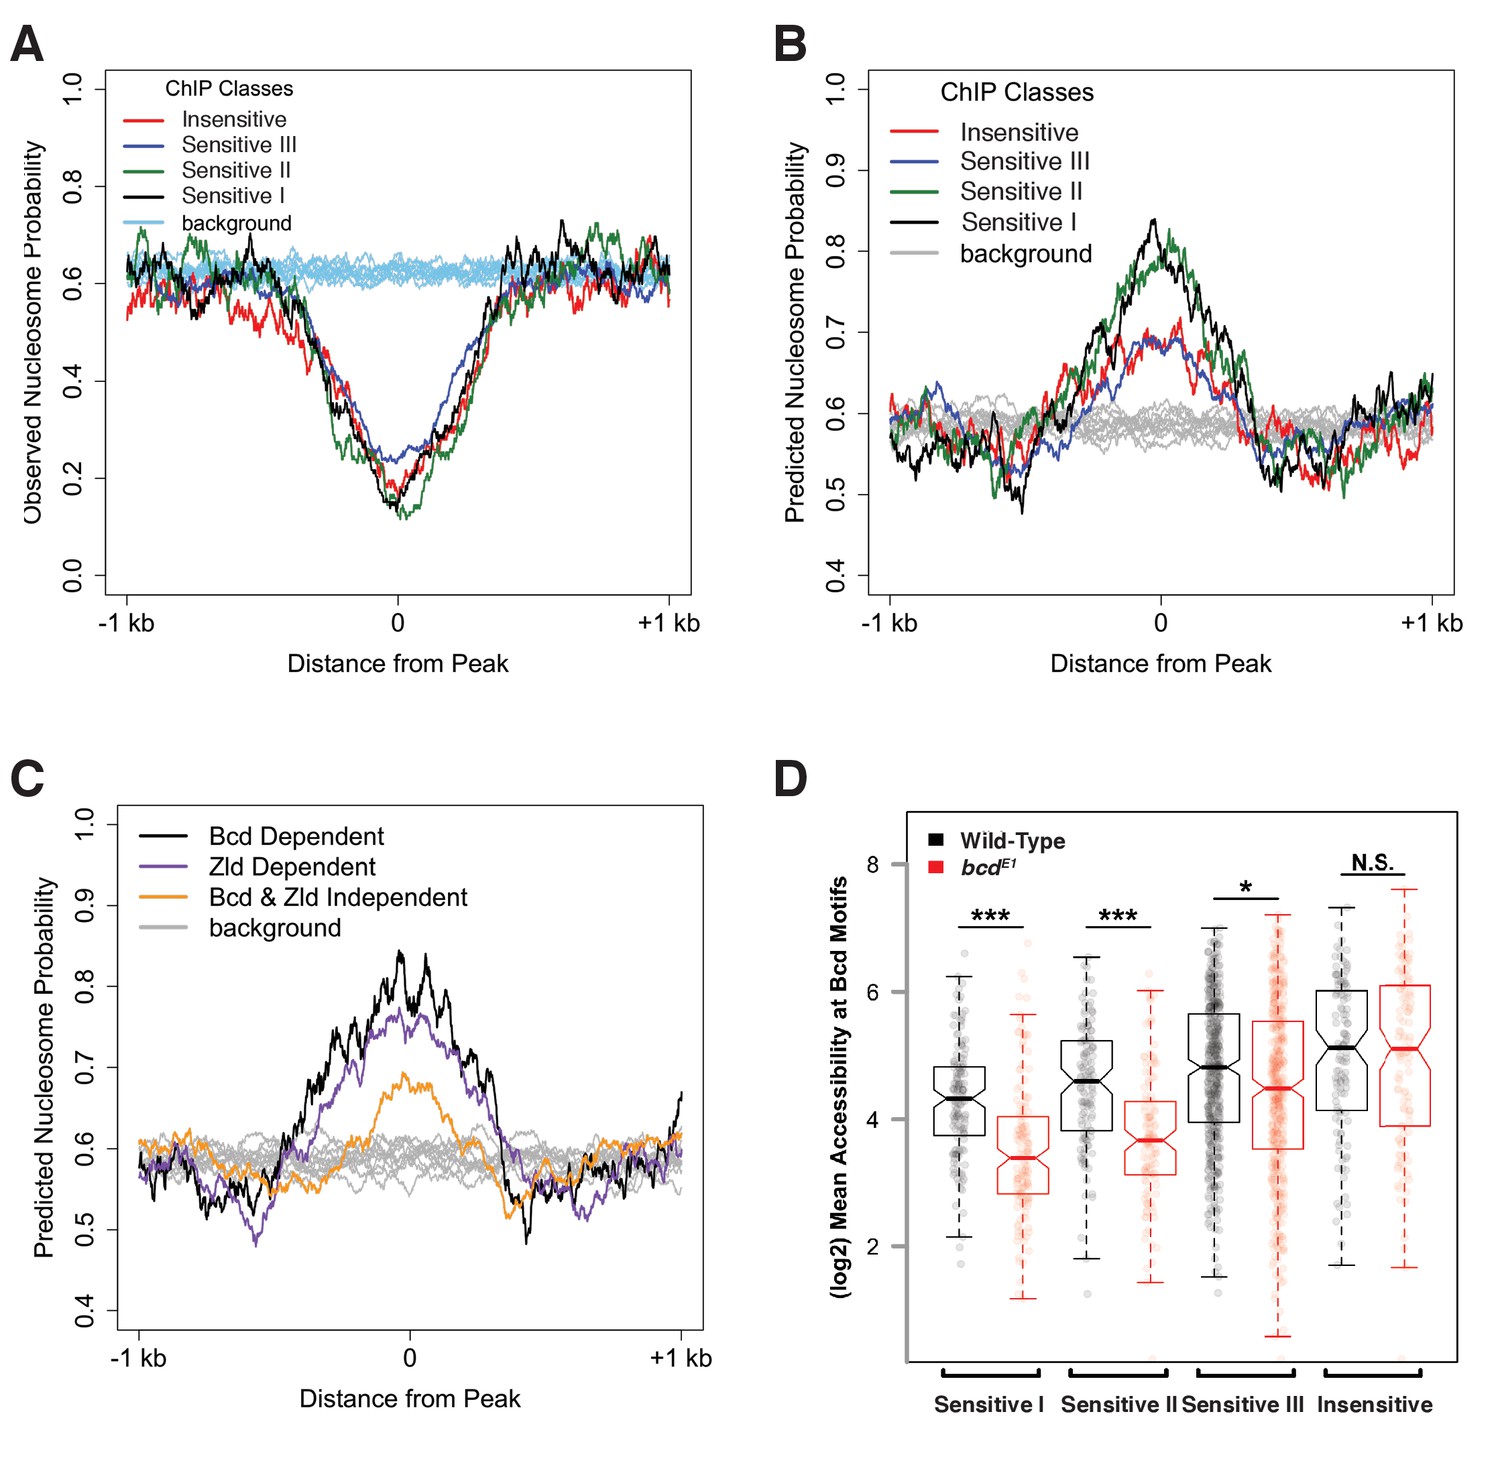
Bcd sensitivity classes differ in both predicted and observed nucleosome occupancy.
(A) Metaprofiles of nucleosome occupancy in each sensitivity class in wild-type embryos. Background represents random selection of regions outside of Bcd peaks shows a genome-wide average nucleosome probability of ~0.6. Bcd-bound peak regions show reduced nucleosome occupancy compared to unbound regions. (B) Predicted nucleosome occupancy using NuPoP show higher modeled probability of nucleosome occupancy in Bcd-bound peaks relative to background regions, with higher probability of occupancy at the Concentration-Sensitive I and II classes. (C) Predicted nucleosome occupancy in peaks dependent on Bcd vs. Zld (nBcd = 132 peaks, nZld = 402 peaks, with n = 61 peaks dependent on both Bcd and Zld) for accessibility show higher predicted occupancy than peaks independent of both Bcd and Zld (n = 554). (D) Mean wild-type (black) or bcd– (red) ATAC accessibility scores for Bcd motifs were calculated for each peak and plotted by sensitivity group. Boxplots depict the distribution of accessibility scores for each group in each genotype, and individual data points are shown as points. P-values were calculated by one-sided permutation test and indicate the likelihood in a randomly selected population of observing a difference between means greater than the observed values (p<1e-6 for Concentration-Sensitive I and II groups, p=0.001207 for Concentration-Sensitive III, and p=0.988167 for Concentration-Insensitive).
Figure 5
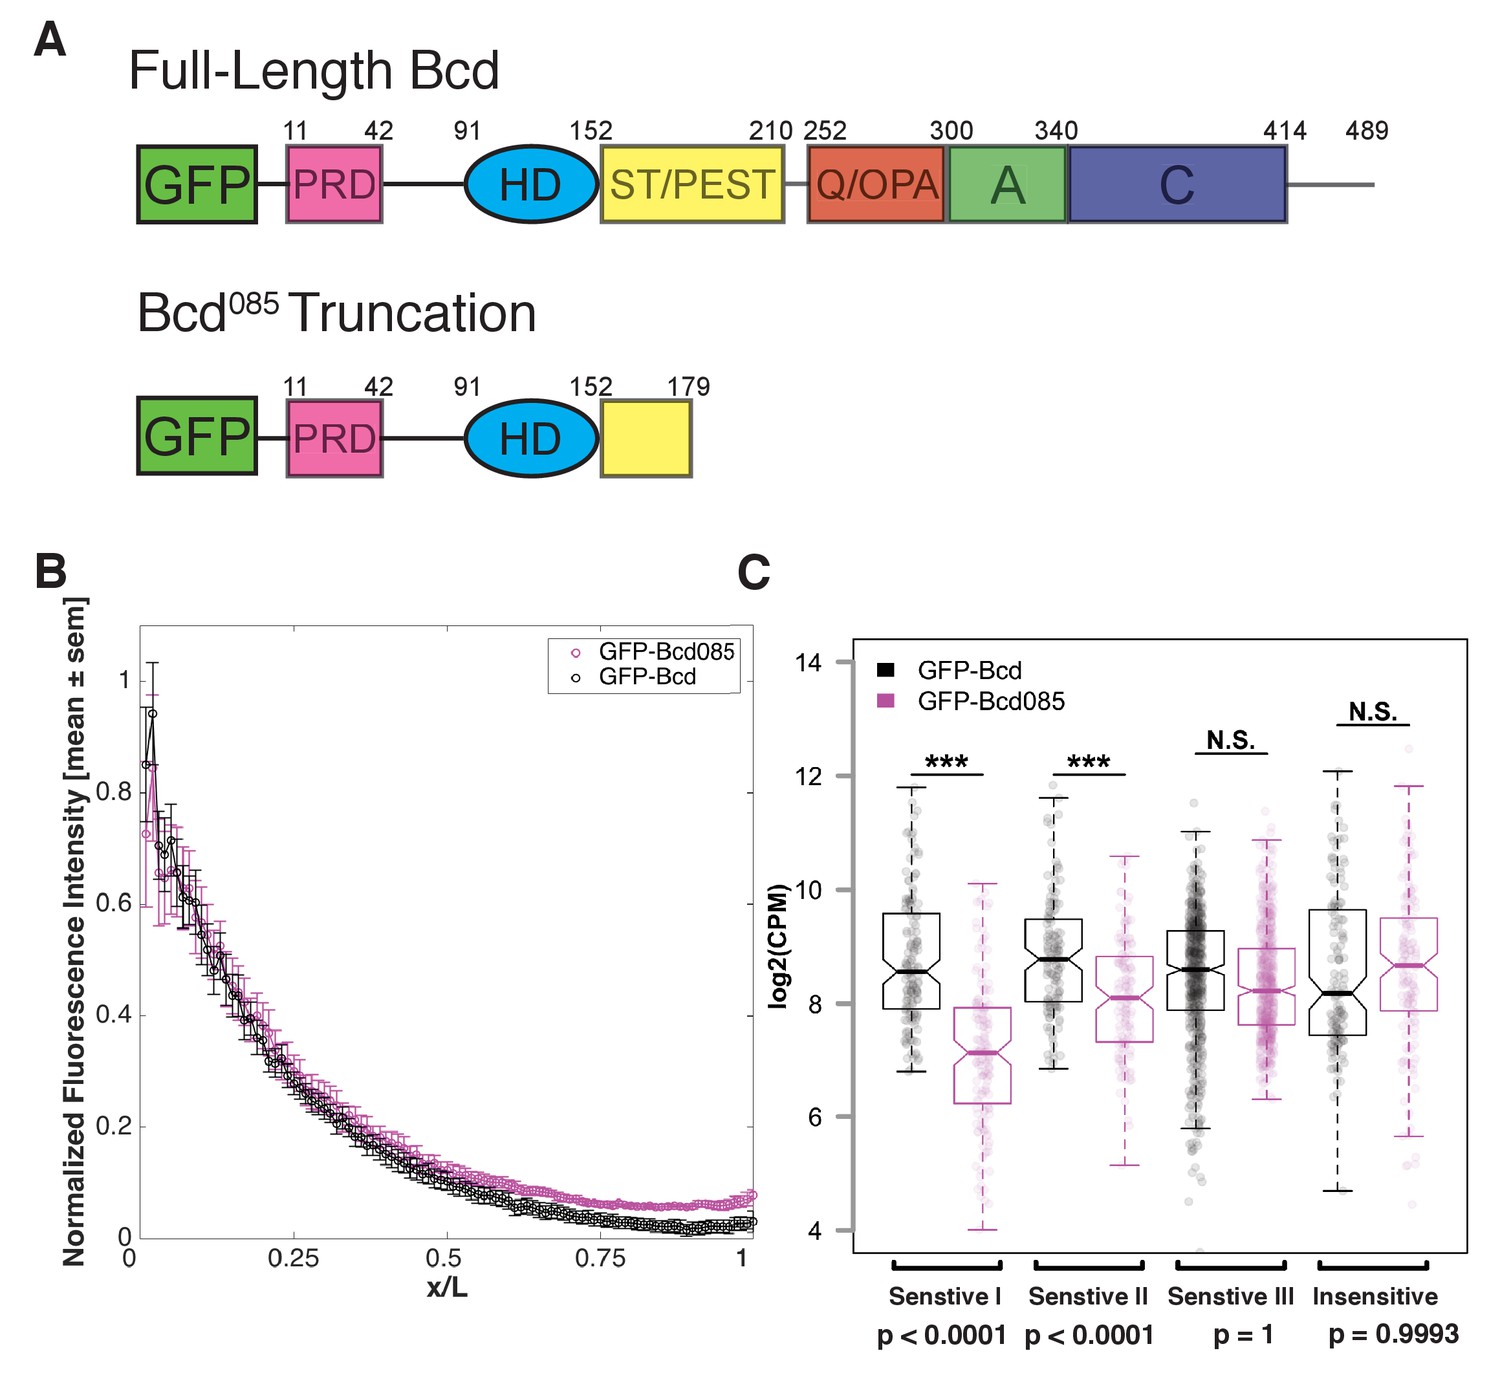
Bcd requires C-terminal protein domains to bind to concentration-sensitive targets.
(A) GFP-Bcd085 construct is truncated within the S/T domain downstream of the homedomain. Wild-type protein domains modified from (Janody et al., 2001) and (Crauk and Dostatni, 2005). The N-terminus of the protein includes a PRD repeat, followed by the DNA-binding homeodomain (HD) (Berleth et al., 1988). The serine/threonine-rich (S/T) domain is the target of MAPK phosphorylation by the terminal patterning Torso pathway (Janody et al., 2000) and contains a PEST sequence implicated in targeting the protein for degradation (Rechsteiner and Rogers, 1996). The C-terminus contains three domains implicated in transcriptional activation. The glutamine-rich (Q)/OPA and alanine-rich (A) domains are required for interactions with TAFII110 and TAFII60, respectively (Sauer et al., 1995). The acidic (C) domain has been demonstrated to play a role in transcriptional activation in yeast, but is not required for Bcd activity in the embryo (Driever et al., 1989). (B) GFP-Bcd085 forms a protein gradient comparable to wild-type GFP-Bcd. GFP fluorescence intensity was extracted from dorsal profiles of live embryos. Error bars are standard error of the mean: GFP-Bcd embryos, n = 8; and GFP-Bcd085 embryos, n = 8. (C) Boxplots displaying log transformed CPM normalized ChIP-seq data from GFP-Bcd;;bcdE1 (wild-type) and GFP-Bcd085;bcdE1 (Bcd085) embryos show significant reduction binding of Bcd085 in Concentration-Sensitive I and II peaks. P-values were calculated from permutation tests (n = 10,000).
Figure 6 with 1 supplement
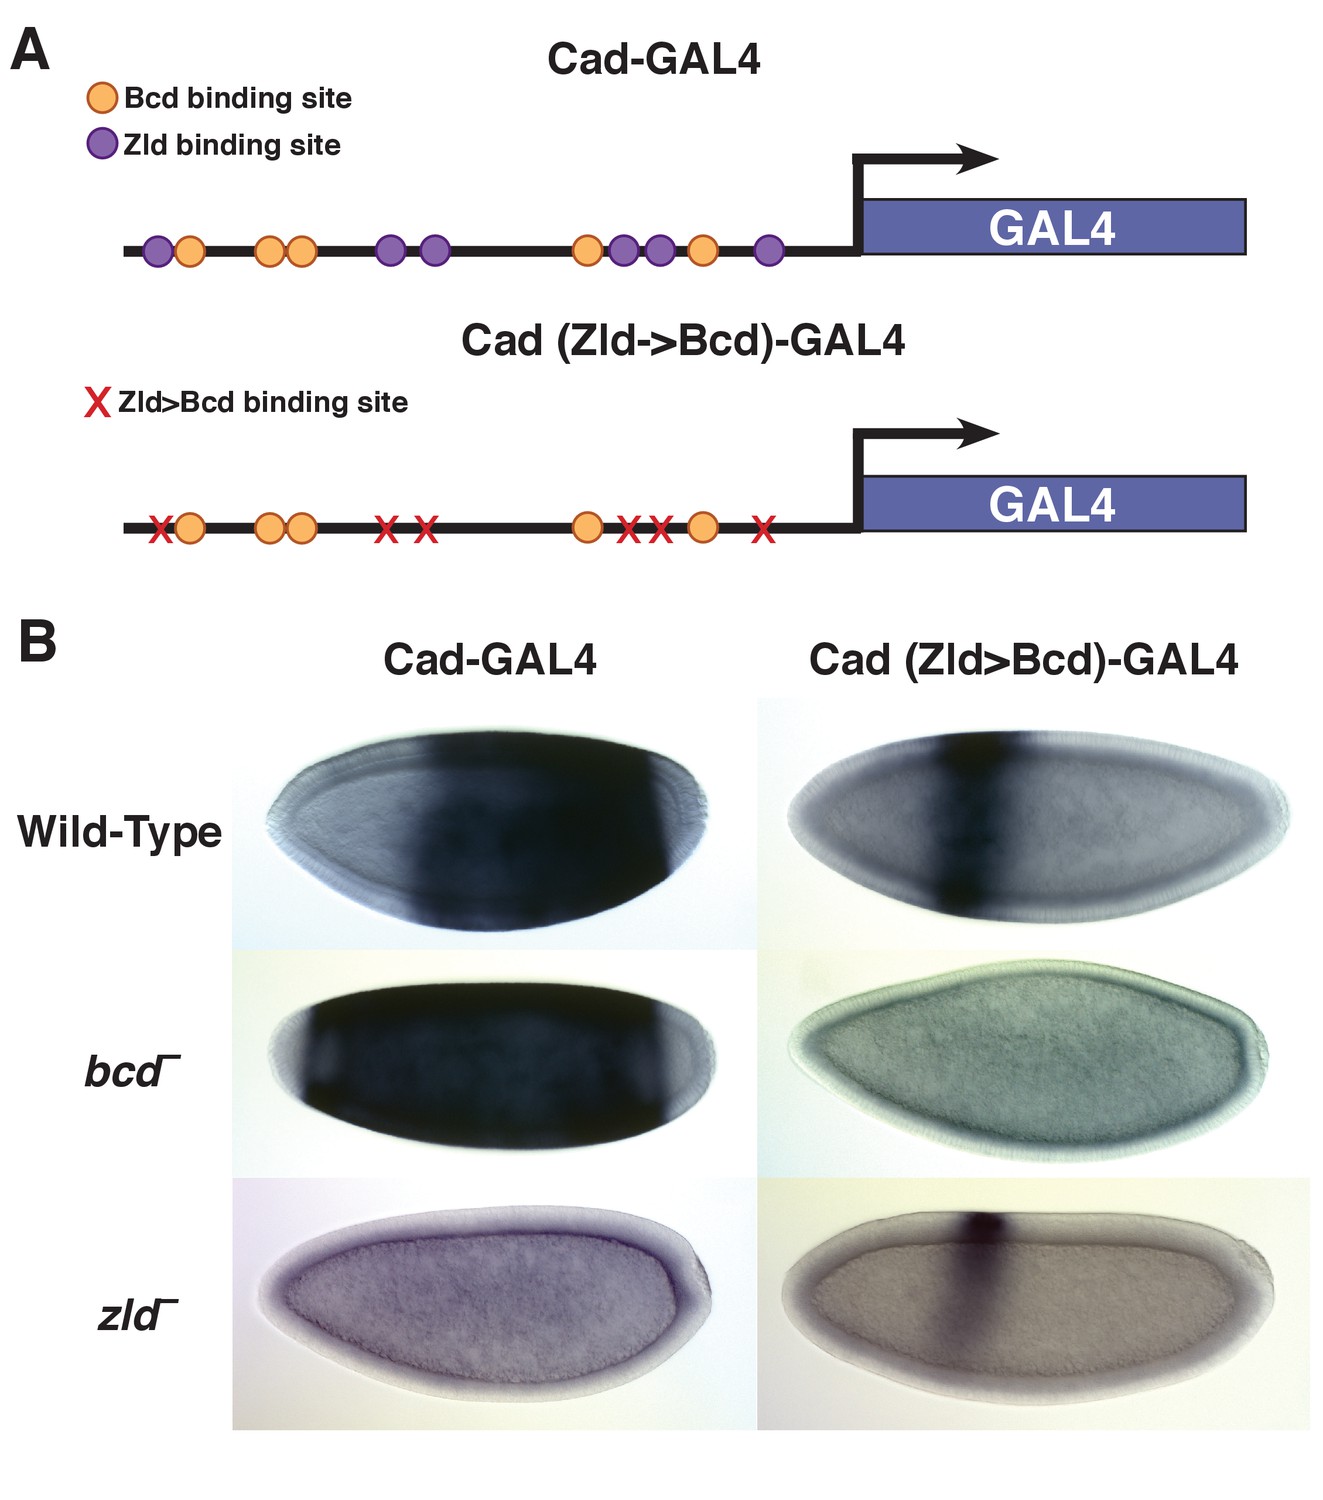
Replacing Zld sites with Bcd sites shifts gene expression to the anterior.
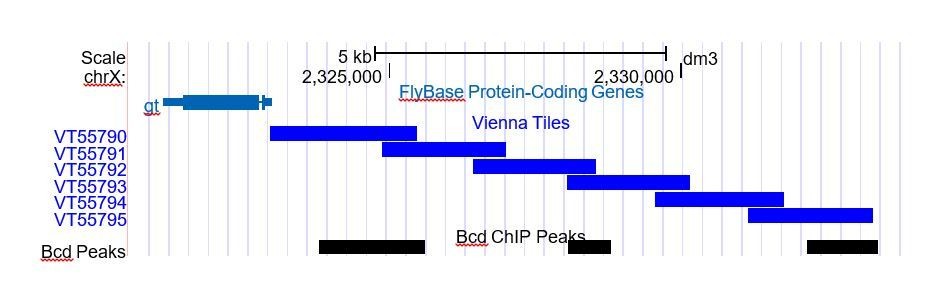
(A) Schematic of the Vienna Tile enhancer reporter for caudal, containing 5 Zld and 6 Bcd binding sites. The mutated reporter contains 11 Bcd binding sites and no Zld sites. (B) Expression of the wild-type and mutated reporter in wild-type, bcd –or zld – embryos.
Figure 6—figure supplement 1
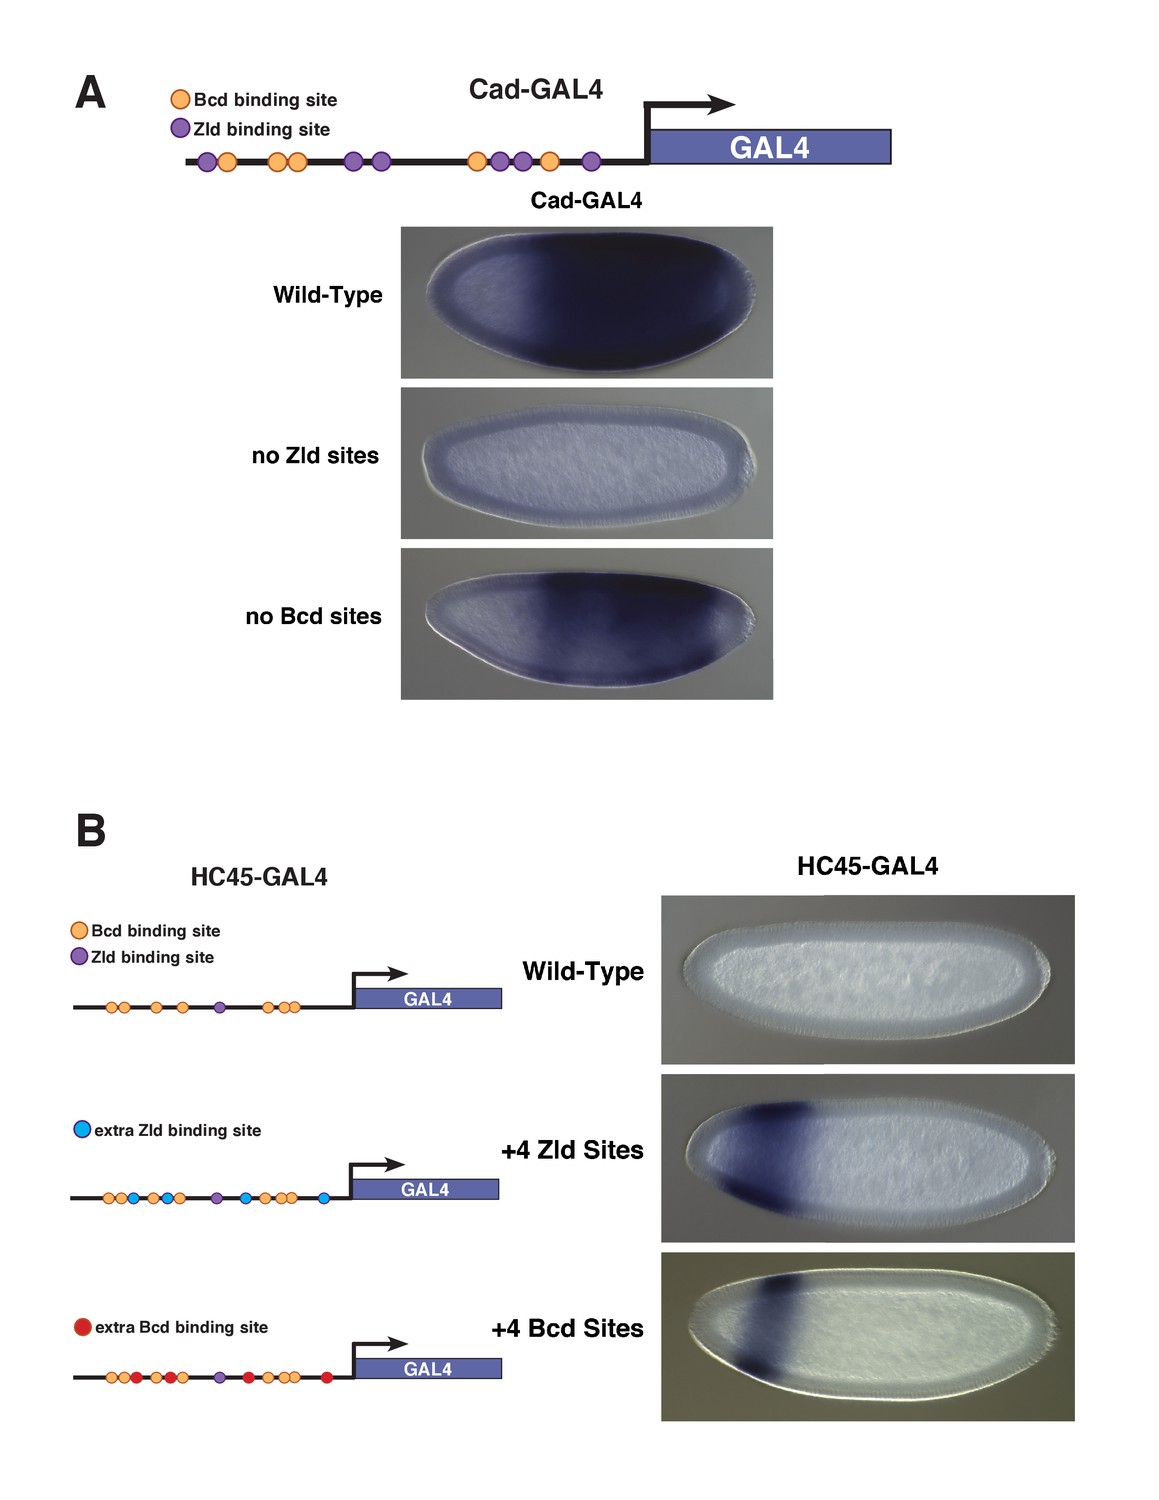
Enhancer reporter constructs with variable Bcd and Zld binding sites.
(A) Schematic of the Vienna Tile enhancer reporter for caudal, containing 5 Zld and 6 Bcd binding sites. The embryos carry transgenic insertions of enhancer reporters that contain either the wild-type enhancer sequence, 6 Bcd binding sites and no Zld sites, or 5 Zld sites and no Bcd sites, respectively. With no Zld sites, the enhancer does not drive expression of the reporter gene. With no Bcd sites, the enhancer drives posterior expression of the reporter. This enhancer loses accessibility in zld– embryos as measured by ATAC-seq, but remains accessible in bcd– embryos. (B) Schematics and expression patterns of reporter constructs HC45 and HC45 +4 Zld sites (HC45.4Z) generated as described in Xu et al. (2014). A third construct (bottom panel) was generated in which the 4 extra Zld binding sites were replaced with 4 extra Bcd binding sites. As shown in Xu et al. (2014), the addition of Zld sites causes the previously inactive DNA fragment to drive gene expression in an anterior domain. Here we show that addition of Bcd sites in the same position as the Zld sites also results in expression from the enhancer, in an anterior stripe.
Figure 7
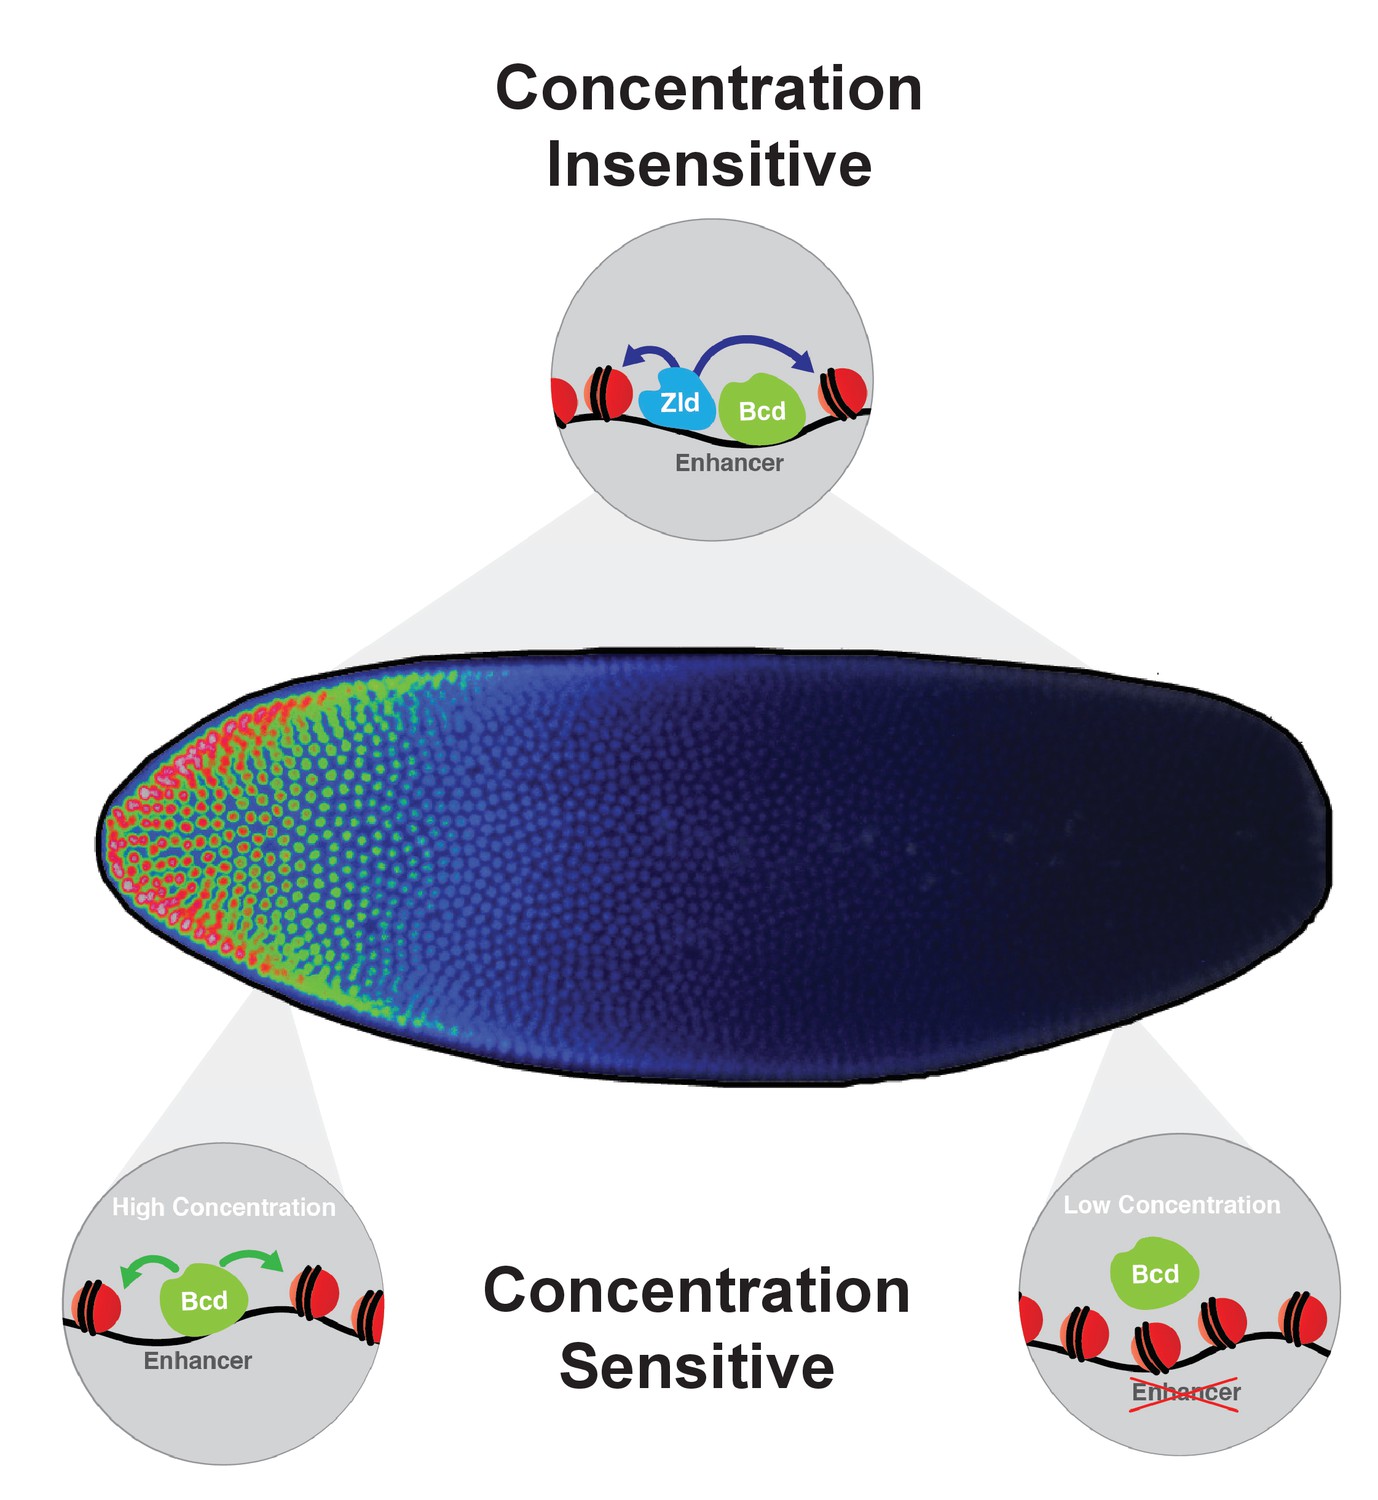
Model for Bcd function along the AP axis.
Bcd drives accessibility of concentration-sensitive, Bcd-dependent enhancers at high concentrations in anterior nuclei, and these sites are closed in posterior nuclei. concentration-insensitive targets remain accessible in both anterior and posterior nuclei, likely through inputs from other factors such as Zld and more open local chromatin structure with a lower nucleosome preference.
Author response image 1

Author response image 2
Author response image 3
Author response image 4
Author response image 5
Tables
Table 1
Number of Bcd ChIP-seq peaks at each step of filtering.
https://doi.org/10.7554/eLife.28275.002| Number of peaks | |||||
|---|---|---|---|---|---|
| Filter applied | Wild-Type | αTub67C > uBcd | mtrm > uBcd | bcd > uBcd | |
| MACS2 | 29,090 | 15,429 | 11,812 | 38,392 | |
| IDR | 9815 | 4245 | 1464 | 1329 | |
| Euchromatic only | 2319 | 4123 | 1429 | 1257 | |
| Common peaks (2/3) | 4126 | ||||
| ATAC-seq ratios | 2143 | 2087 | |||
| Common Peaks | 1027 | ||||
Table 2
Number of overlapping Bcd ChIP peaks and Vienna Tile-GAL4 enhancer reporters.
Note that some Bcd peaks overlap with more than one Vienna Tile, and vice versa. The reporters expressed at stage 4–6 that overlapped with more than one Bcd peak were excluded from the plot in Figure 2B.
| Overlaps with Vienna Tile-GAL4 reporters | ||||
|---|---|---|---|---|
| Total Vienna tiles | Total overlaps | Single overlaps | ||
| Vienna tiles | Bcd peaks | |||
| Active (all stages) | 3604 | 238 | 193 | 127 |
| Active (stage 4–6) | 666 | 163 | 151 | 115 |
| Patterned (stage 4–6) | 627* | 159 | 147 | 112 |
| Not Active | 4189 | 55 | 41 | 28 |
| Total | 7793 | 293 | 234 | 155 |
-
*The patterned expression from the 666 Vienna Tiles that drive expression at stage 4–6 was determined by subtracting the number of tiles scored as ‘ubiquitous’ (39) from the total number of tiles.
Table 3
Number of Bcd ChIP-seq peaks in each class overlapping with Vienna Tile-GAL4 reporters.
Queried Bcd peaks are peaks that are present in the Fly Enhancer database, whose expression can be assessed.
| Overlaps of peak classes with active enhancers and transcription start sites | ||||||
|---|---|---|---|---|---|---|
| Bcd peak class | Overlaps with Vienna tiles | Overlaps with Vienna tiles active at stg. 4–6 | Total bcd peaks | |||
| N | % of Total Bcd Peaks | N | % of Queried Bcd Peaks | % of Total Bcd Peaks | ||
| Concentration-Sensitive I | 52 | 34.2% | 38 | 73.1% | 25.0% | 152 |
| Concentration-Sensitive II | 38 | 27.5% | 29 | 73.7% | 21.0% | 138 |
| Concentration-Sensitive III | 109 | 18.4% | 57 | 52.3% | 9.6% | 593 |
| Concentration-Insensitive | 34 | 23.8% | 26 | 76.5% | 18.2% | 143 |
Table 4
Number of Bcd ChIP-seq peaks in each class within 500 bp Transcription Start Sites.
https://doi.org/10.7554/eLife.28275.010| Bcd peak class | Overlaps with TSS | Total bcd peaks | |
|---|---|---|---|
| N | % | ||
| Concentration-Sensitive I | 29 | 19.1% | 152 |
| Concentration-Sensitive II | 35 | 25.4% | 138 |
| Concentration-Sensitive III | 291 | 49.1% | 593 |
| Concentration-Insensitive | 74 | 51.7% | 143 |
Table 5
Number of peaks dependent on Bcd or Zld for chromatin accessibility.
ATAC +ChIP common peaks are peaks that overlap between the Bcd ChIP-seq peaks and the wild-type ATAC-seq open chromatin peaks.
| Peak list | Bcd Dependent | Zld Dependent | Bcd + Zld dependent | Total |
|---|---|---|---|---|
| ATAC Open Peaks | 326 | 2675 | 206 | 13,226 |
| Bcd ChIP Peaks | 132 | 402 | 61 | 1027 |
| ATAC + ChIP Common Peaks | 121 | 379 | 58 | 855 |
Table 6
Estimated nuclear concentrations of Bcd protein in each uniform line.
https://doi.org/10.7554/eLife.28275.019| Genotype | Protein level relative to WT | Estimated number of molecules | Estimated nuclear concentration |
|---|---|---|---|
| bcd > uBcd | 0.14 | 1085 | 12.58 nM |
| mtrm > uBcd | 1.1 | 8525 | 98.84 nM |
| αTub67C > uBcd | 2.7 | 20925 | 242.61 nM |
Table 7
Primer sequences for EMSA probes.
https://doi.org/10.7554/eLife.28275.020| Primers | Sequence (5'- > 3') | |
|---|---|---|
| hbP2 probe F | Forward primer | /bio/GTCAAGGGATTAGATGGGCA |
| hbP2 probe R | Reverse primer | /bio/GTCGACTCCTGACCAACGTA |
| kni post F | Forward primer | /bio/AGAAAAAATGAGAACAATGTGAC |
| kni post R | Reverse primer | /bio/AGCCAGCGATTTCGTTACCT |
| kni ant F | Forward primer | /bio/ACAACACCGACCCGTAATCC |
| kni ant R | Reverse primer | /bio/GTCATGTTGGCTAATCTGGC |
| kr ant F | Forward primer | /bio/CAGAAAAGAAAAAGTGTAACGCC |
| Kr ant R | Reverse primer | /bio/GCGAAAAAACGCGTCGCGCT |
| otd intron F | Forward primer | /bio/ATCGTTCCTTGCGGTTTAAT |
| otd intron R | Reverse primer | /bio/AGAACAGGACAAAGGGAATTTAATC |
| otd early F | Forward primer | /bio/CTCGCCTCGCGTGCGACATT |
| otd early R | Reverse primer | /bio/CCTGCGGCAGGACTTCACTT |
| btd F | Forward primer | /bio/ACGAAGTCAAAACTTTTCCA |
| btd R | Reverse primer | /bio/AGCTAAGAGATCTCAACCAAC |
| gt −3 F | Forward primer | /bio/TTACAACTGCCCATTCAGGG |
| gt −3 R | Reverse primer | /bio/GAAGGGCTCGGGTTCGG |
| gt −10 F | Forward primer | /bio/AGATCCAGGCGAGCACTTGA |
| gt −10 R | Reverse primer | /bio/TTAAATTAAAATGTCGCAGGAAGGCG |
Additional files
-
Supplementary file 1
Bicoid ChIP-seq Peak Regions and Functional Annotation
The 1027 peak regions as determined by ChIP-seq for Bcd are listed with functional categorizations described in the text. Column names are indicated in the first row. Genomic coordinates of peak binding regions were determined against the dm3 build of the Drosophila melanogaster genome, and are reported in columns 1–4 (chromosome, start, end, strand). The nearest zygotically active gene (including maternal and zygotic genes) is listed in column 5 (nearest.mz). Columns 6 and 7 indicate whether a Bcd ChIP-seq peak was determined to require either Bcd (column 6) or Zld (column 7) for chromatin accessibility as determined by ATAC seq. Columns 8–11 indicate the concentration-dependent binding class determined for each peak. Column 12 indicates the identification number of Vienna Tiles that were found to uniquely overlap with a Bcd ChIP-seq peak. Column 13 indicates the identification number of DNA fragments reported in Chen et al. (2012) overlapping with Bcd ChIP-seq peaks from this study. Column 14 indicates the Bcd ChIP-seq peaks that were found to overlap with Zld ChIP-seq peaks reported in Harrison et al. (2011).
- https://doi.org/10.7554/eLife.28275.021
-
Transparent reporting form
- https://doi.org/10.7554/eLife.28275.022
Download links
A two-part list of links to download the article, or parts of the article, in various formats.
Downloads (link to download the article as PDF)
Open citations (links to open the citations from this article in various online reference manager services)
Cite this article (links to download the citations from this article in formats compatible with various reference manager tools)
Concentration dependent chromatin states induced by the bicoid morphogen gradient
eLife 6:e28275.
https://doi.org/10.7554/eLife.28275


