Stochastic variation in the initial phase of bacterial infection predicts the probability of survival in D. melanogaster
- Cornell University, United States
- UMR5174 EDB, CNRS, ENSFEA, Université Toulouse 3 Paul Sabatier, France
Figures
Figure 1 with 2 supplements
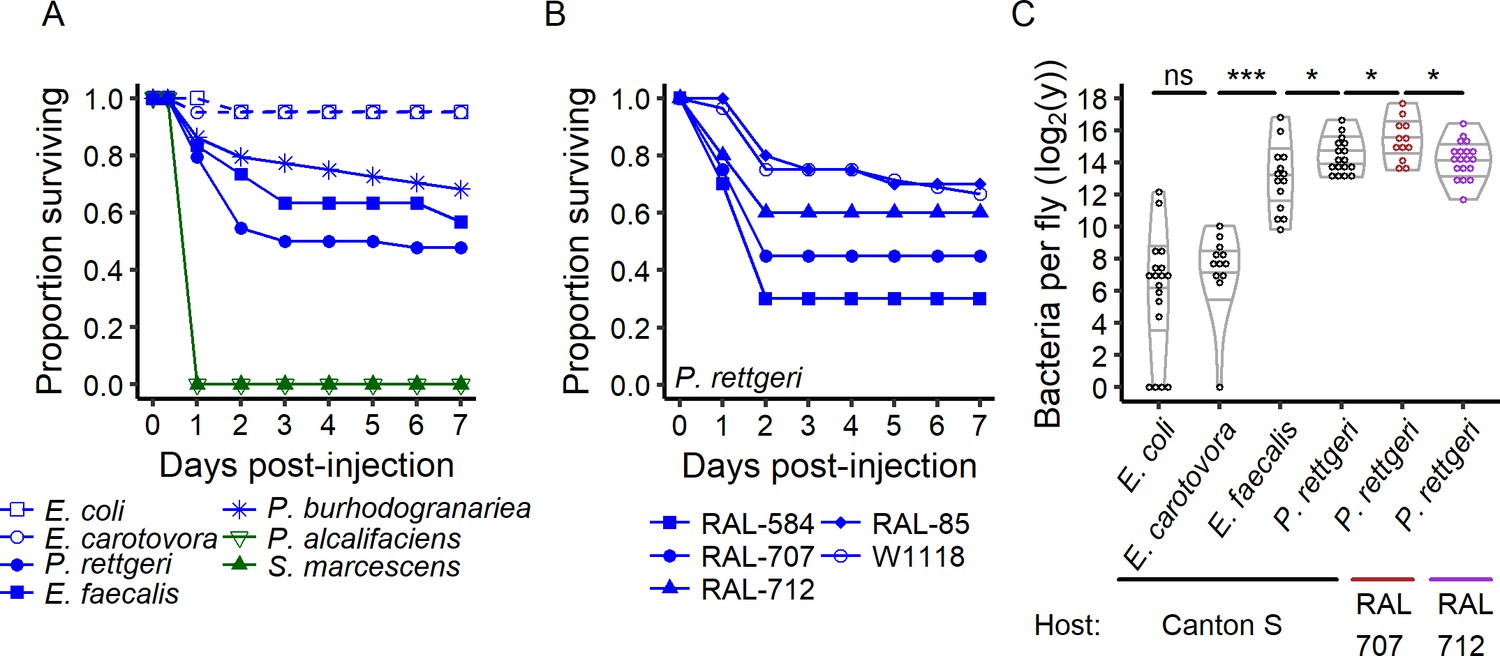
The outcome of infection ranges from 100% to 0% survival.
(A) Canton S flies were injected with the same inoculum (OD600 = 1, ca. 30,000 bacteria) of different bacteria species. Providencia alcalifaciens (n = 29) and Serratia marcescens (n = 30) are lethal pathogens (green solid lines) and killed 100% of the hosts in less than a day. E. coli (n = 21) and E. carotovora (n = 20) infection did not reduce host survival (blue dashed lines). P. rettgeri (n = 44), P. burhodogranariea (n = 44) and E. faecalis (n = 30) infections led to intermediate outcomes (blue solid lines): some individuals died in the first two days after infection while others survived. (B) Even for males of the isogenic lines of the Drosophila Genome Resource Panel and of w1118, same age and reared in a common environment with a controlled microbiota, only a fraction of the hosts was killed by experimentally identical infections with P. rettgeri. This fraction depended on the host genotype (Coxph: Line: df = 4, χ2 = 19.23, p=0.0007, nRAL-584 = 20, nRAL-85 = 20, nRAL-707 = 20, nRAL-712 = 20, nw1118 = 84). (C) Flies that survive infection are chronically infected with a constant bacterial load we termed Set-Point Bacterial Load (SPBL). Distinct bacterial species differ in their SPBL (Kruskal-Wallis test: df = 3, χ2 = 63.14, p=1.25e-13). Host genotype also impacts SPBL (Kruskal-Wallis test: df = 2, χ2 = 6.63, p=0.03). The annotations above the violin plots reflect results of two-by-two Wilcoxon tests comparing medians: *p<0.05, ****p<0.0001 and ns: p>0.05.
-
Figure 1—source data 1
Data set for Figure 1.
- https://doi.org/10.7554/eLife.28298.006
-
Figure 1—source data 2
Data set for Figure 1—figure supplement 1.
- https://doi.org/10.7554/eLife.28298.007
-
Figure 1—source data 3
Data set for Figure 1—figure supplement 2.
- https://doi.org/10.7554/eLife.28298.008
Figure 1—figure supplement 1

The variability of outcome in infection is not due to variation in the time of exposure to CO2 before and after injection.
We monitored the survival after infection of groups either exposed to CO2 for 2 min during the injection, exposed to 15 min of CO2 before an injection time frame of 2 min, or injected during a time frame of 2 min and then immediately subsequently exposed to 15 min of CO2. None of the treatments influence the survival of the infected individuals (Coxph: Treatment: df = 2, χ2 = 0.06, p=0.97), therefore in our experimental conditions, variation in exposure to CO2 cannot explain inter-individual variation.
Figure 1—figure supplement 2

The chronic phase of infection is characterised by the Set Point Bacterial Load (SPBL).
(A) The Set-Point Bacterial Load (SPBL) is stable up to 10 days post-injection (linear regression: Time: df = 1, F = 0.11, p=0.73). The grey dot represents the dose initiating the infection and the dashed line connects the medians. (B) The SPBL at seven days post-injection increases with the size of the inoculum (linear regression: Dose: df = 1, F = 8.15, p=0.006). The blue line represents the regression line.
Figure 2 with 1 supplement
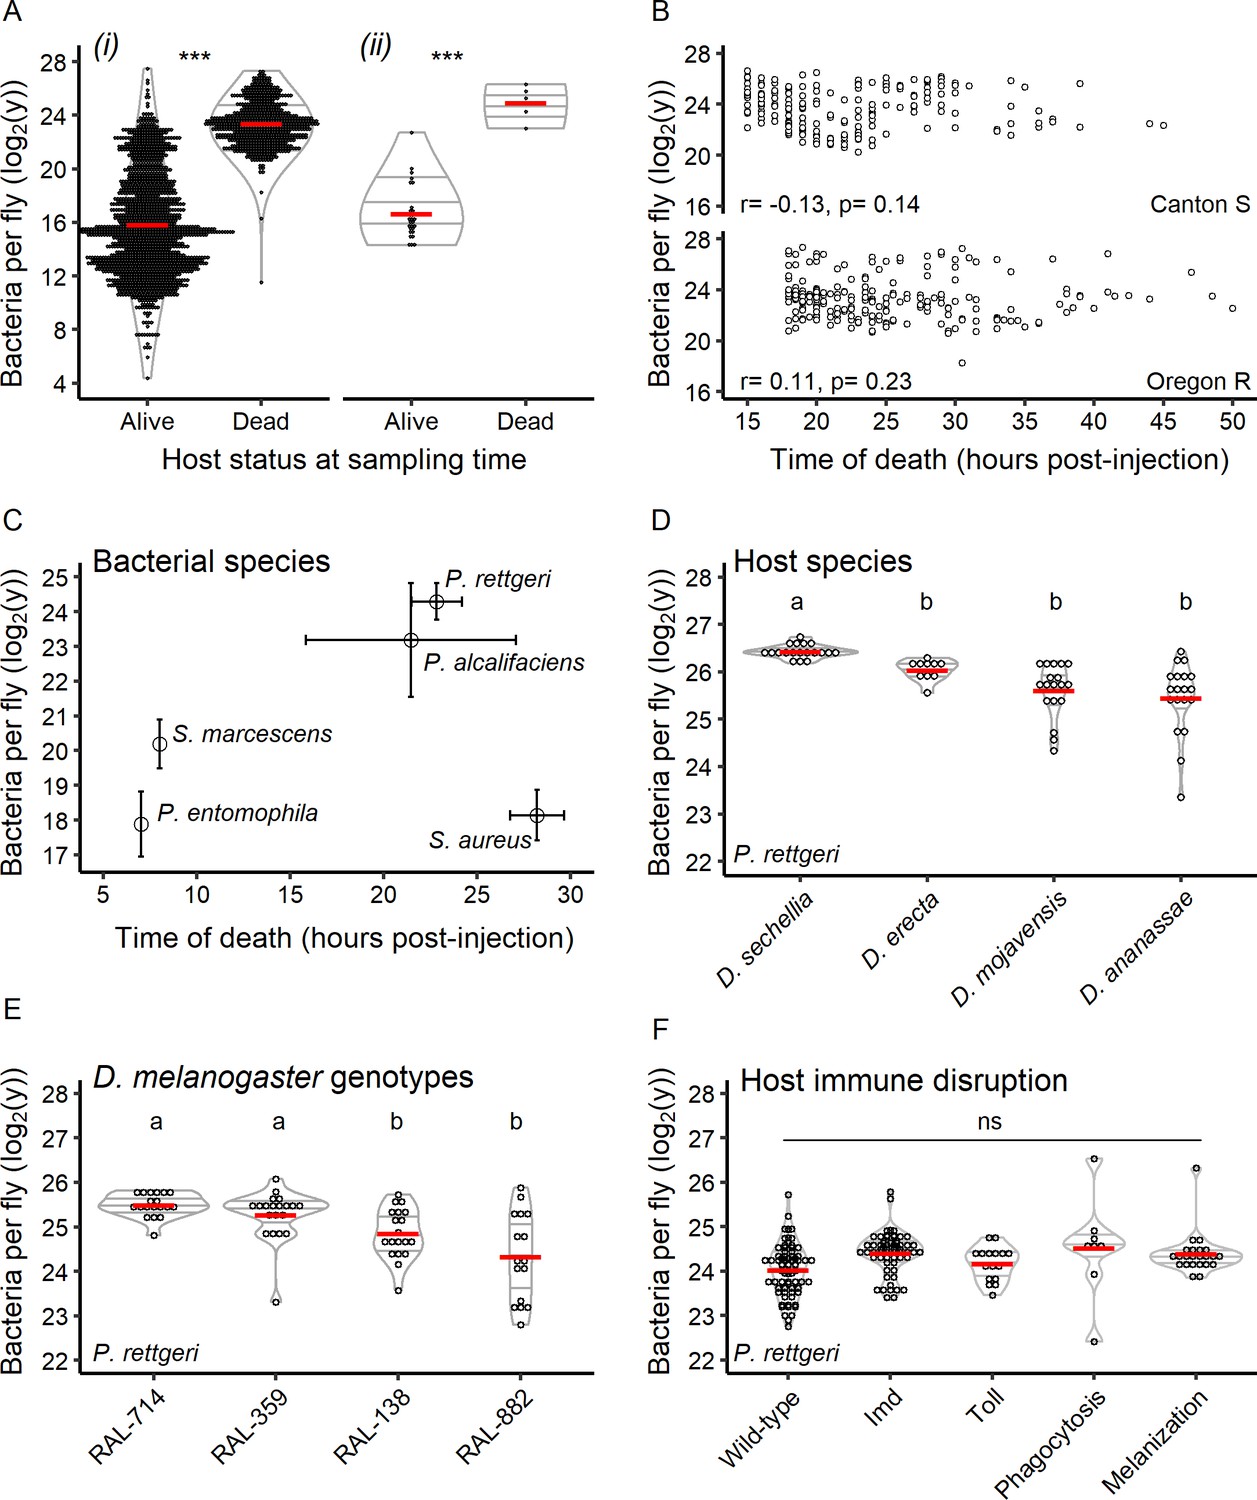
Hosts die at a set bacterial burden, the BLUD, which varies with host and pathogen.
(A) The bacterial load in flies within 30 min of death from P. rettgeri infection is a constant and is higher than that of flies that did not die from the infection. This is true when comparing dead hosts to living hosts regardless of duration of infection (i: df = 1, W = 963036, p=1.39e-252) and when dead individuals are compared to living individuals sampled simultaneously (ii: df = 1, W = 140, p=0.0004). The stars above the violin plots reflect results of two-by-two Wilcoxon tests comparing medians: ***p<0.001. (B) For both Canton S (Spearman correlation test - S = 462763.5, r = −0.13, p=0.14) and Oregon R (Spearman correlation test - S = 327036.4, r = 0.11, p=0.23), the time of host death did not correlate with the BLUD for P. rettgeri. (C) Different bacterial species can differ in BLUD when infecting the same host genotype (Kruskal-Wallis test: df = 3, χ2 = 92.14, p=3.45e-21). However, the average time to death for a given bacterial species does not correlate with its average BLUD (Spearman correlation test: S = 12, r = 0.4, p-value=0.51). (D) The BLUD of P. rettgeri depends on host species (Kruskal-Wallis test: df = 3, χ2 = 39.59, p=1.29e-08). (E) The BLUD of P. rettgeri depends on host genotypes (Kruskal-Wallis test: df = 3, χ2 = 23.438, p=3.27e-05). (F) The BLUD of P. rettgeri is not altered by removing components of the host immune system listed on the x-axis (linear mixed model with lines as random factor with df = 4, Deviance = 7.24, p=0.12). Wildtype refers to the wildtype lines Canton S, Oregon R and w1118. ‘Imd’ refers to the double mutant loss-of-function PGRP-LC, PGRP-LE and the loss-of-function mutant Relish. ‘Toll’ refers to the spzrm7 mutant. Phagocytosis refers to the progeny of the cross Hml-Gal4 >UAS bax. ‘Melanization’ refers to a line double mutant for two prophenoloxidase genes (PPO1Δ, PPO2Δ). The annotations above each violin plot represent the result of the post hoc Dunn tests; treatments with the same letter are not significantly different after FDR p-value correction. Error bars in C are standard deviation around the mean.
-
Figure 2—source data 1
Data set for Figure 2.
- https://doi.org/10.7554/eLife.28298.011
-
Figure 2—source data 2
Data set for Figure 2—figure supplement 1.
- https://doi.org/10.7554/eLife.28298.012
Figure 2—figure supplement 1
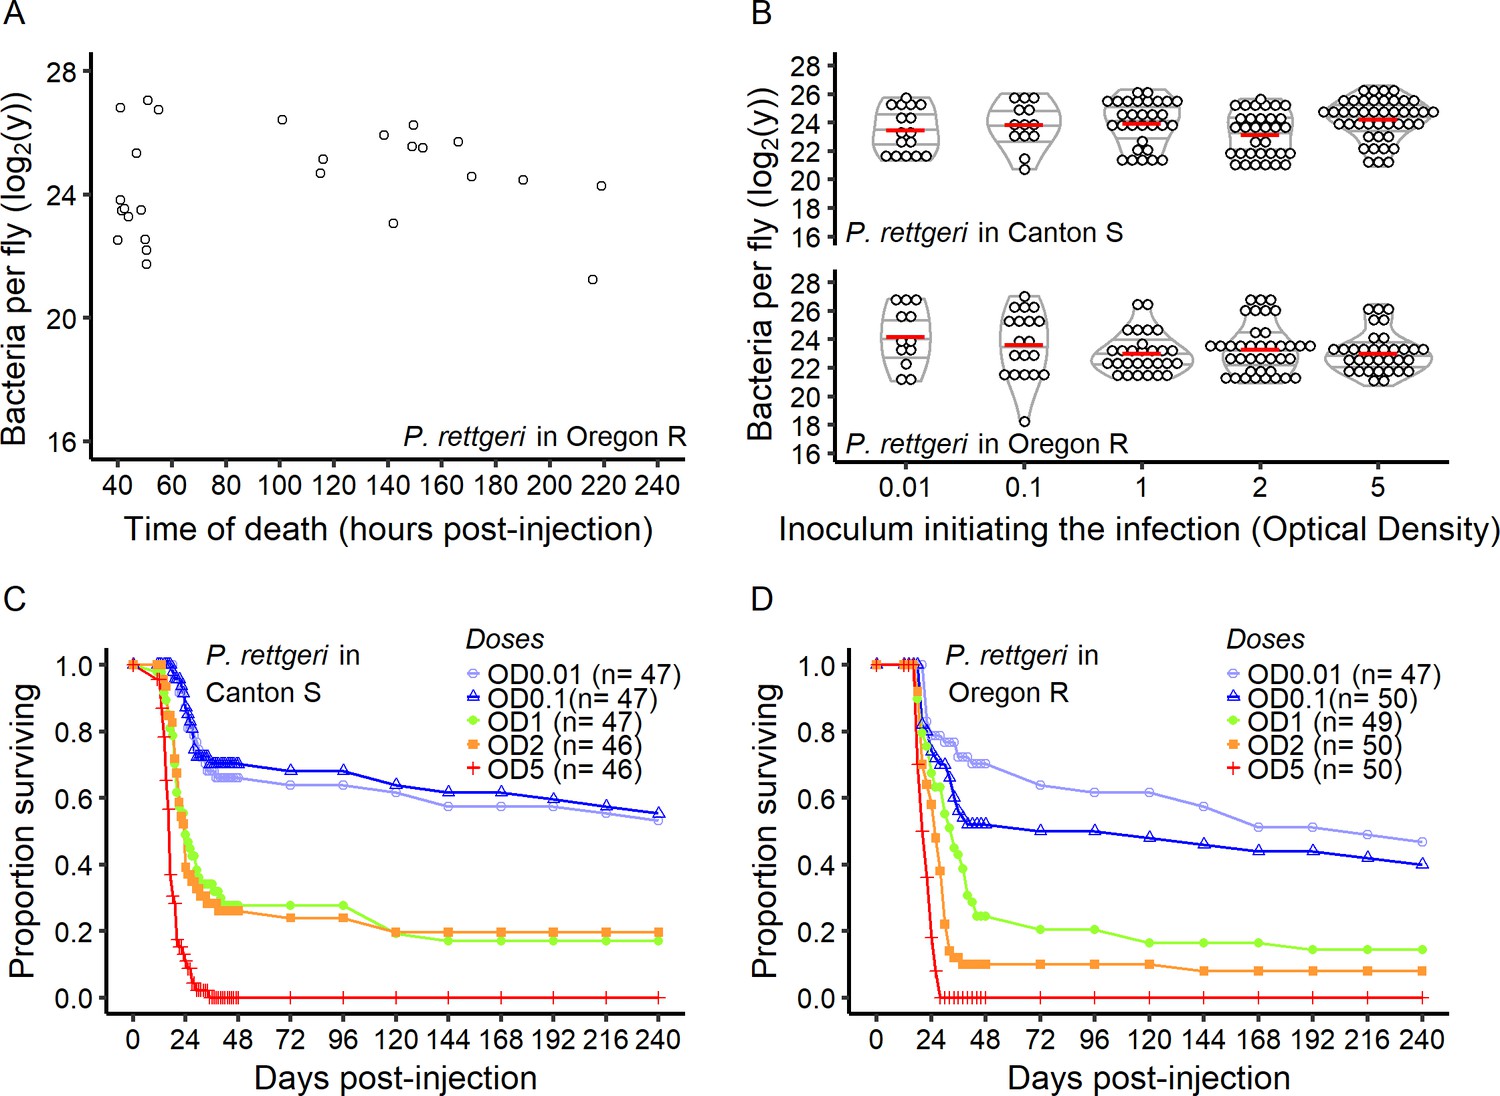
The BLUD is constant over time and does not depend on the initial dose.
(A) BLUD several days post-injection. The BLUD is consistent even over 10 days post-injection. (B) Effect of initial dose on BLUD. For both Canton S and Oregon R hosts, the BLUD for P. rettgeri was not affected by the initial inoculum dose (Spearman correlation test - Oregon R: r = −0.13, p=0.13; Canton S: r = 0.10, p=0.26). (C and D) Survival of Canton S and Oregon R hosts over ten days following the injection of different initial inoculum of P. rettgeri. Despite the consistency in BLUD, host survival was highly dependent on the initial inoculum dose for both host genotypes (Oregon R: Coxph: Dose: df = 4, χ2 = 109.6, p<2.2e-16; Canton S: Coxph: Dose: df = 4, χ2 = 115.7, p<2.2e-16). Optical density of OD600 = 1 is equivalent to an injection of around 30,000 bacteria, with bacterial number scaling linearly with OD over our experimental range.
Figure 3 with 1 supplement
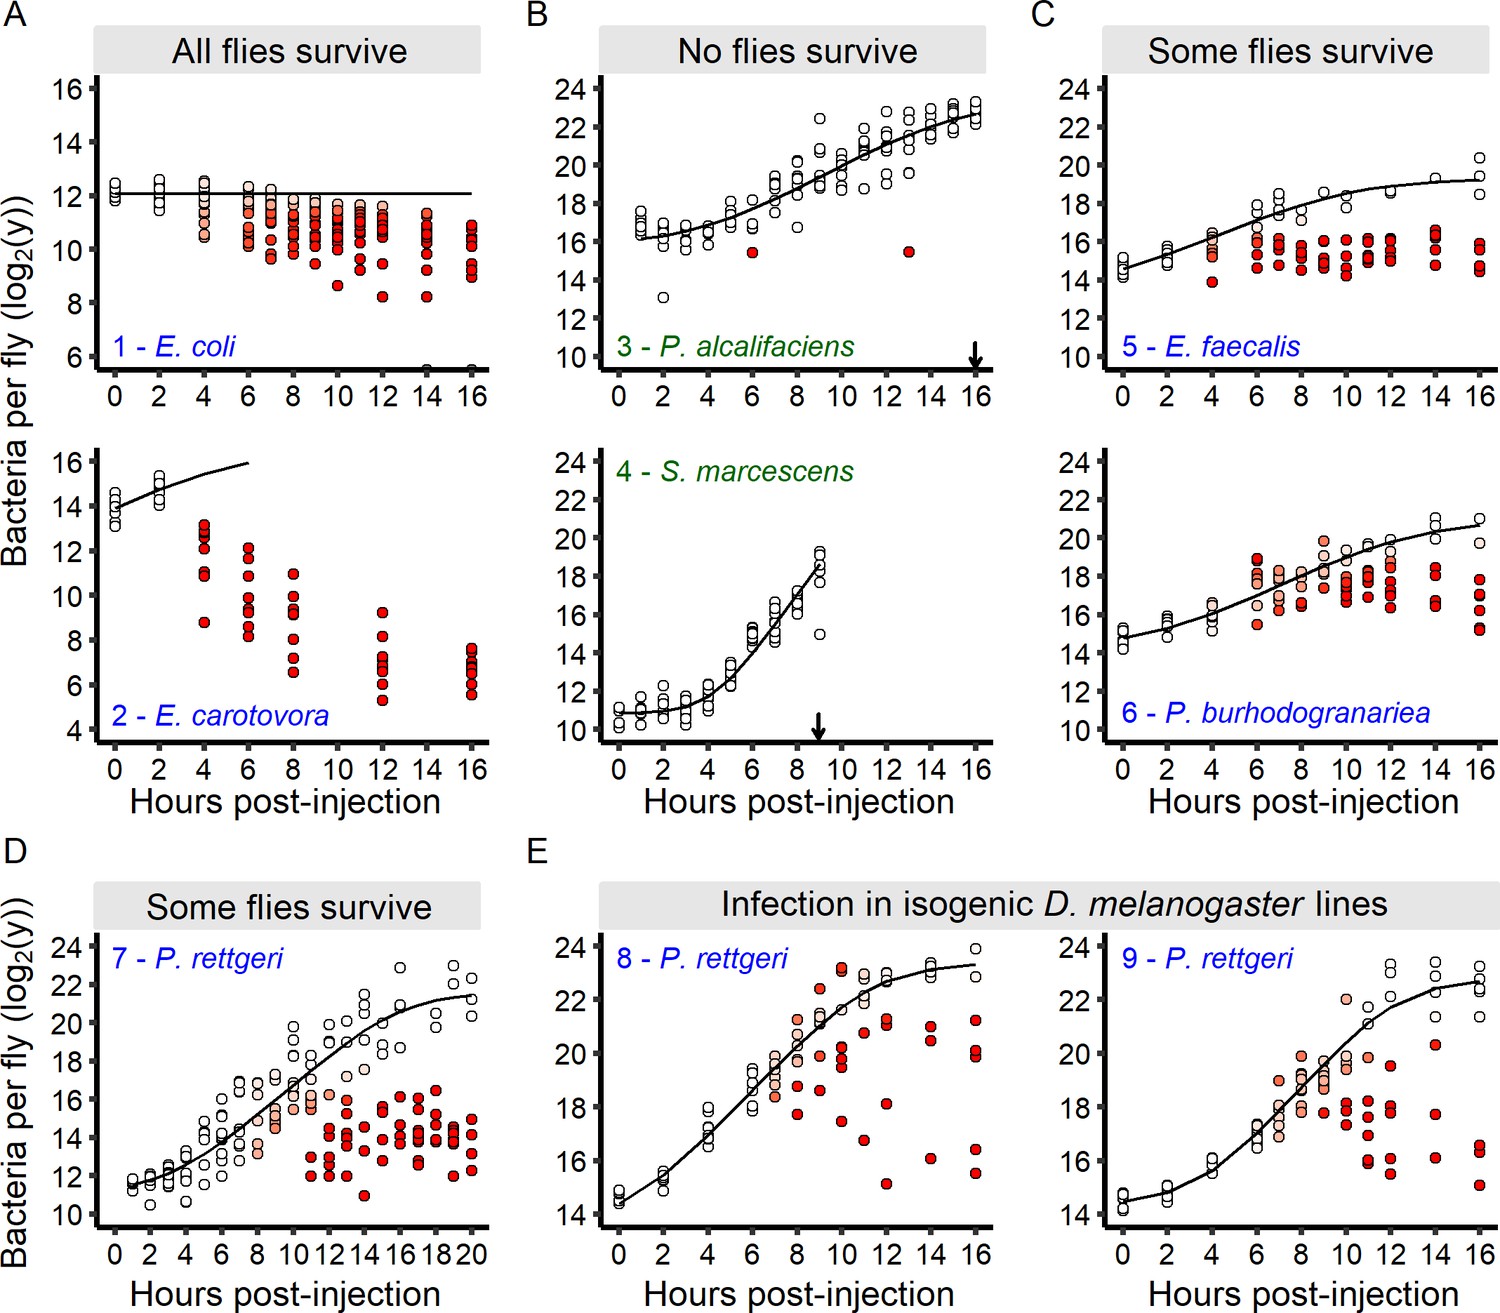
The infection outcome depends on inter-individual variation in within-host bacterial proliferation.
(A) For bacteria that do not kill any infected hosts, bacterial loads decreased soon after the beginning of the infection. Grey dots on the x-axis represent individuals without detectable bacteria. (B) For bacteria that quickly kill all infected hosts, bacterial loads continuously increased until all hosts were dead (black arrows). (C-D) For bacteria that kill a fraction of infected individuals, an initial period of bacterial growth in each individual was followed by a period where individual flies diverged in their loads. In these infections, two groups of individual hosts appeared. In the first group, bacteria continue to grow, while in the other, bacterial growth was controlled. (E) The increase in inter-individual variation in bacterial load over time is also observed in fully isogenic populations (RAL-707 and RAL-712). In all panels, each dot represents the bacterial load in a single fly, the solid line represent the standard Baranyi bacterial population growth fitted on the white dots (see Materials and methods). The intensity of red in the dots represents the probability that hosts controlled the infection (i.e. the denser the red is within a dot, the higher is the probability that this host controlled the infection), and whose pathogen burdens are better described by an exponential decrease model (see Materials and methods). Measurements of bacterial load dynamics were taken from Canton S flies unless otherwise stated. The numbers in each panel identify each infection and are subsequently used in Figure 6B and C. Green labels are bacteria that kill all the hosts and blue labels are bacteria that establish persistent infection in surviving hosts.
-
Figure 3—source data 1
Data set for Figure 3.
- https://doi.org/10.7554/eLife.28298.015
-
Figure 3—source data 2
Data set for Figure 3—figure supplement 1.
- https://doi.org/10.7554/eLife.28298.016
Figure 3—figure supplement 1

In vivo proliferation in the early phase of infection is equivalent to the rate of in vitro growth in LB medium.
During the eight first hours, bacterial proliferation in LB medium (Culture 1 to 4) did not differ from the bacterial proliferation within the host Canton S. This was confirmed by the non-significant interaction terms resulting from the linear model bacterial load ~ time x treatment (P. alcalifaciens: df = 4, F=0.35, p= 0.99; P. rettgeri: df= 4, F= 0.34, p= 0.84; S. marcescens: df=4, F= 0.22, p=0.92).
Figure 4
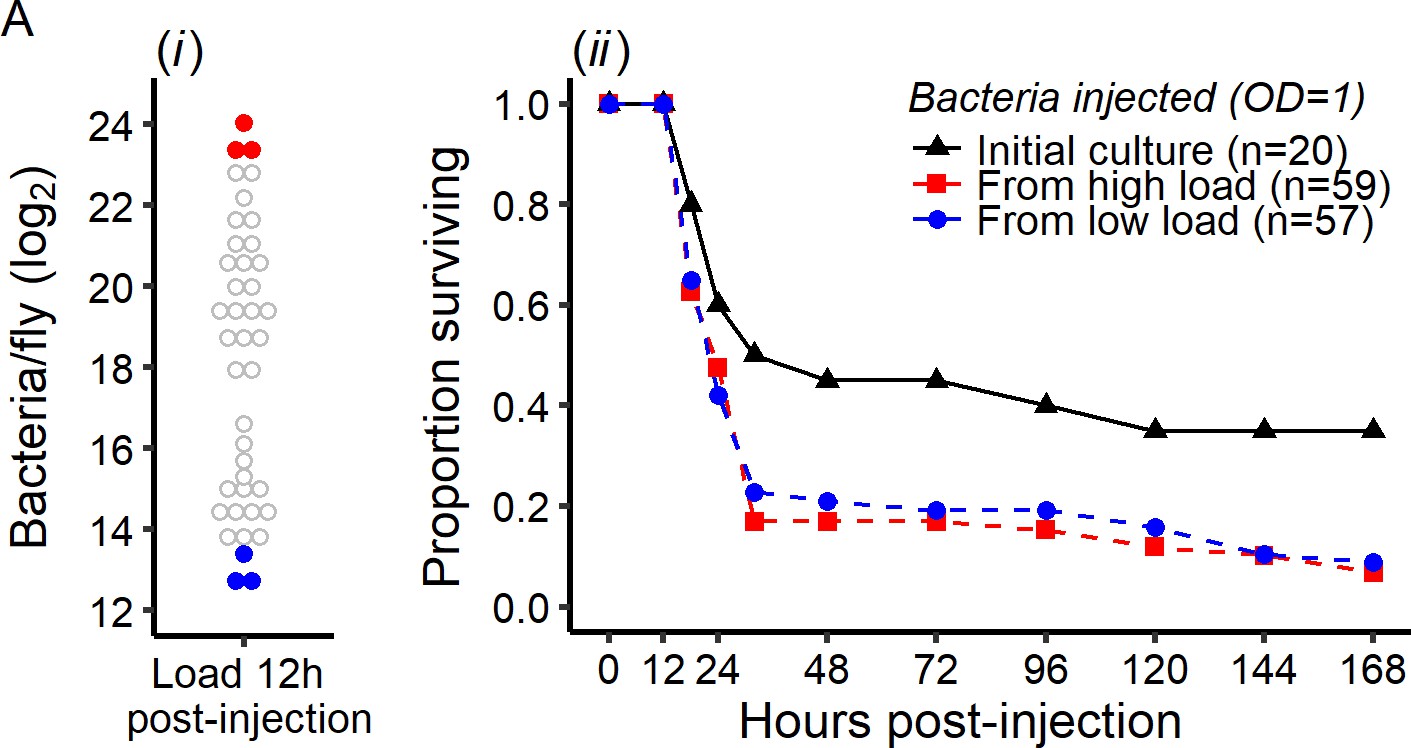
Early intra-host bacterial evolution does not explain the dual outcome of infection.
Bacterial evolution inside the fly does not explain the binary outcomes of infection. (A) Quantification of bacterial load to determine bacterial populations killing the host (bacterial load close to the BLUD 12 hr post-injection, red dots) and bacterial population controlled by the host (bacterial load close to the SPBL 12 hr post-injection, blue dots), (B) Survival of Canton S flies injected with P. rettgeri from the stock used for the original injections, or recovered from flies in which bacteria had been growing for 12 hr (see panel A). Bacteria recovered from experimental flies (dashed lines) killed more hosts than the stock culture (solid line) (Coxph: df = 3, χ2 = 8.28, p=0.01). However, there were no differences in mortality caused by bacterial populations isolated from flies with high loads versus those isolated from flies that had controlled bacterial growth (Coxph: df = 2, χ2 = 0.07, p=0.78).
-
Figure 4—source data 1
Data set for Figure 4.
- https://doi.org/10.7554/eLife.28298.018
Figure 5
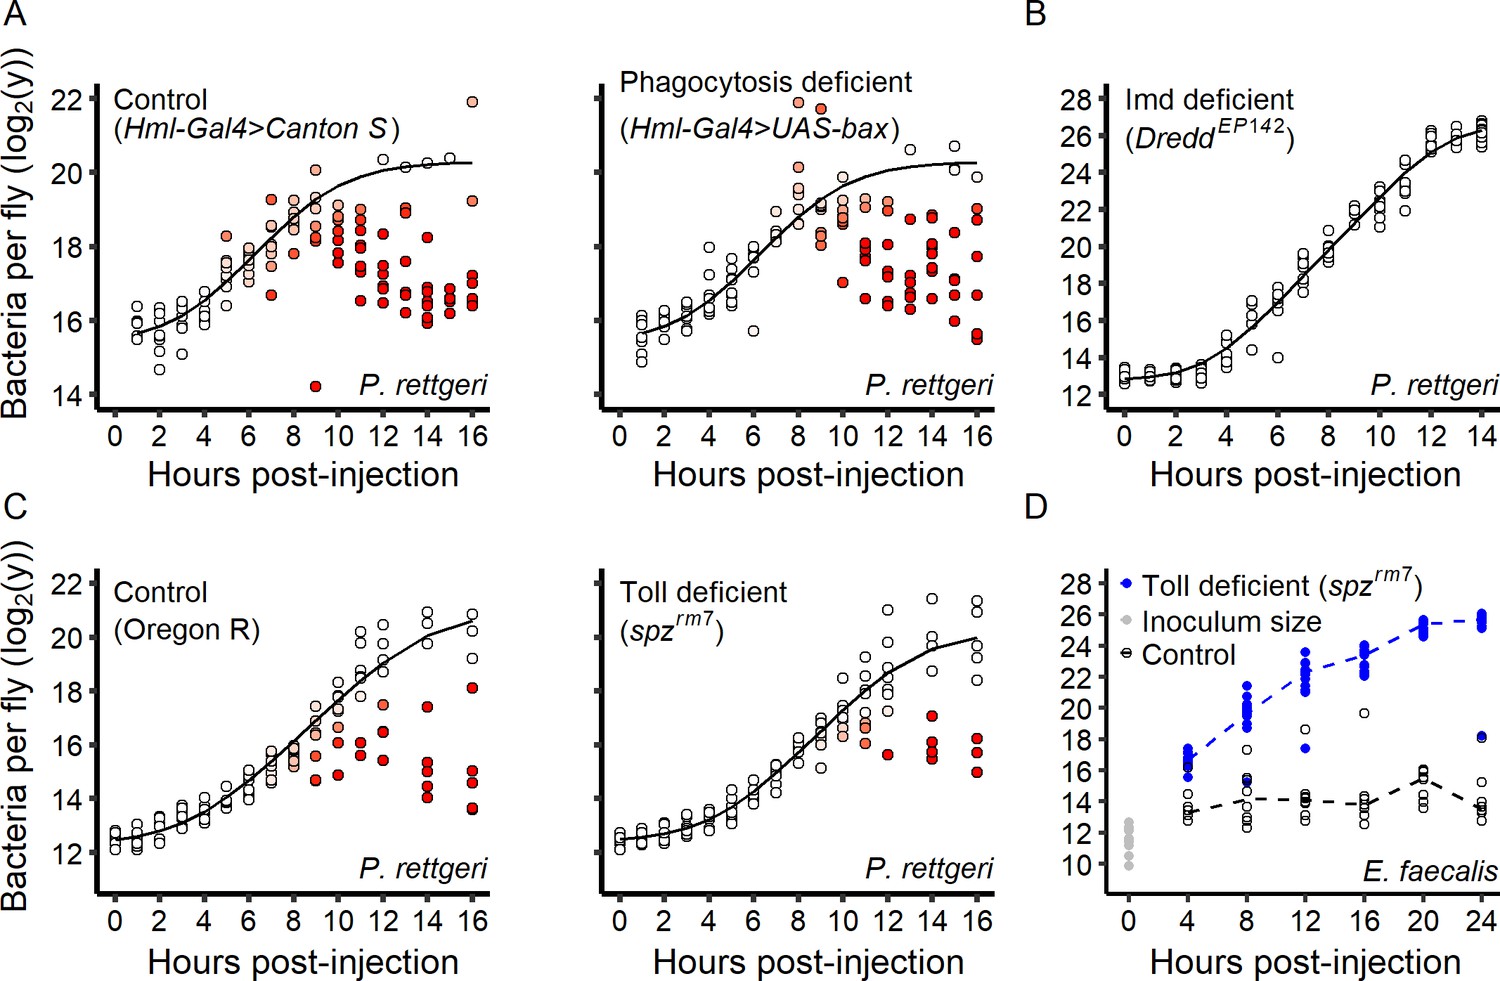
Role of the immune system in the infection dynamic.
(A) Within-host P. rettgeri loads at different times post-injection for wild-type (Canton S) flies and flies deficient in phagocytosis (Hml-Gal4 >UAS GFP; UAS-Bax, Gal80ts). Distinct groups of high-load and low-load flies appear even in absence of phagocytosis. (B) All hosts infected by P. rettgeri suffer high pathogen load in the absence of an Imd-mediated immune response. In these hosts (DreddEP142 mutants), P. rettgeri growth occurs at a rate similar to in vitro bacterial growth (modeled by a Baranyi model, black line). (C) We monitored within-host P. rettgeri loads at different times post-injection for Toll deficient (spzrm7 mutants) and wild-type flies (Oregon R). Distinct groups of high-load and low-load flies appear even in absence of the Toll-dependent immune response. (D) We monitored within-host E. faecalis loads at different times post-injection for Toll-deficient (spzrm7 mutants) and wild-type flies (Oregon R). For this Gram-positive bacterium, despite receiving the same initial inoculum (grey dots), bacterial load differed between mutant and wild-type flies by four hours post-injection (Welsh t-test, df = 22.57, t = 13.01, p-value=5.6e-12). In absence of the Toll pathway (blue dots), all hosts suffered high pathogen burdens. In all panels, each dot represents the bacterial load in a single fly. In Panels A-C, the solid line represent the standard Baranyi bacterial population growth fitted on the white dots (see Materials and methods). The intensity of red in the dots represents the probability that hosts controlled the infection, and whose pathogen burdens are better described by an exponential decrease model (see Materials and methods).
-
Figure 5—source data 1
Data set for Figure 5.
- https://doi.org/10.7554/eLife.28298.020
Figure 6 with 1 supplement

A generalized model of infection.
(A) A schematic representation of a conceptual model for within-host bacterial growth dynamics that, upon three phases, lead either to host survival or death. In a first early phase, the bacterial population grow exponentially without being controlled. Then, in a second phase, some hosts start to control bacterial proliferation. In this resolution phase, inter-individual variation in the time to control (Tc), appears. We hypothesize that if host immune defenses control bacterial multiplication before bacterial load exceeds a critical threshold called the ‘tipping point’, then the host will survive infection and enters in a chronic phase, sustaining a persistent pathogen burden that we call the Set Point Bacterial Load (SPBL). If the tipping point is reached before the host establishes effective control, the infection enters a terminal phase and the bacteria will continue to proliferate until reaching a load that cannot be sustained by the host (the BLUD, or Bacterial Load Upon Death), at which point the host dies. (B) Prediction of the proportion of infected individuals that control their infections. The probability of controlling infection is estimated by our model based on early bacterial load measurements and correlates strongly with the proportion of hosts still alive when the mortality curve plateaued (Spearman rank correlation test: S = 3.02, r = 0.97, p-value=8.17e-6). The oblique line represents a 100% correlation. Error bars on the x-axis represent error of estimation by the model of the probability of controlling proliferation based on bootstrap analysis (1000 iterations). Error bars on the y-axis represent the confidence interval of the proportion of surviving hosts at the time where the mortality curve plateaued. The numbers and colors in the figure indicate the identity of the bacterium used in infection, and correspond to the numbers and identities in Figure 3. Green labels are bacteria that kill all the hosts and blue labels are bacteria that establish persistent infection in surviving hosts. (C) Estimation of t̄c from early growth dynamic of different infections (Figure 3) with our statistical model. Red intervals are empirically estimated (see Figures 5D and 7B). Black error bars on the x-axis represent error of estimation by the model of the t̄c based on bootstrap analysis (1000 iterations).
-
Figure 6—source data 1
Data set for Figure 6.
- https://doi.org/10.7554/eLife.28298.023
Figure 6—figure supplement 1
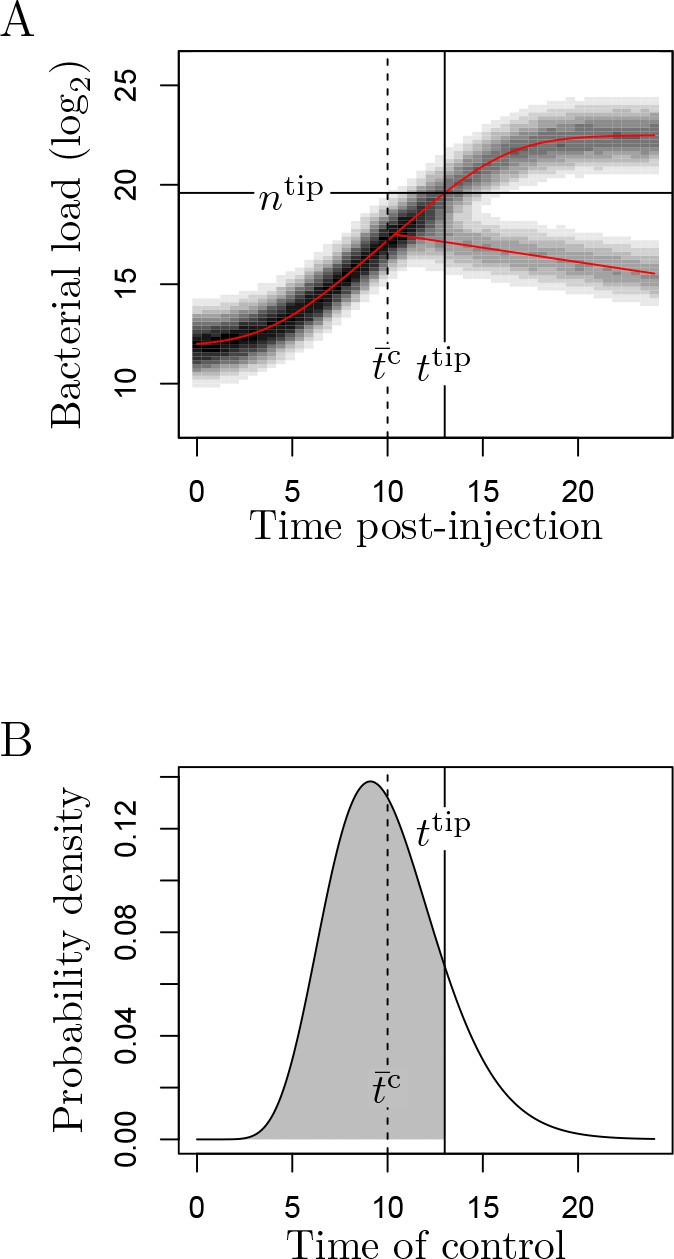
A simulation of the WHD model.
(A) Red curves correspond to the predicted average log2-transformed bacterial load in the Baranyi model (the sigmoid curve) and in the bacterial decrease model. Shades of grey indicate the probability of observing a given load. These probabilities have been obtained from 20,000 simulations for 50 evenly spaced time points ranging from 0 to 24 hr post-injection. Parameters are tlag = 4, µ = 0.6, log2(n0) = 12, log2(nmax) = 22.5, σbb1.0 for the Baranyi model, δ = 1e−01, log2(nc) = 19, σd = 0.9 for the decrease model, and t̄cc10, Vc = 9 and ttip = 13 (which yields ntip = 19.591) for the model of control. (B) The probabilistic distribution of time to control, Tc. Gamma distribution with average t̄c and variance Vc. Probability of control (Pc) is the probability that control is efficient before ntip is reached, which is represented here by the shaded area. In this simulation, Pc = 0.394.
Figure 7 with 1 supplement

The time to effective control by the immune response determines the outcome of infection.
(A) Bacterial load over time in hosts with pre-activated immune systems (Gal80TS; daughterless-Gal4 > UAS Imd) and in the corresponding control flies (Gal80TS; daughterless-Gal4 > Canton s). Early activation of immune response allows flies to start controlling bacterial growth immediately after the infection started. (B) Empirical determination of t̄c. For both Gram-negative bacteria tested, within-host bacterial proliferation was initially similar between lines (GLM with Gamma distribution of error, Time x Line: df = 1, F = 0.4, p=0.53 for P. rettgeri up to 8 hr post-injection, and up to 2 hr for E. carotovora Time x Line: df = 1, F = 0.27, p=0.61), and later was controlled in wild-type (Canton S) but not in Imd-deficient flies (RelishE20 mutants). (C) The antimicrobial peptide gene Diptericin (measured relative to housekeeping gene Rpl32) in Canton S flies was strongly induced after injection of P. rettgeri. This can be seen in three replicate pools of flies tested every two hours post-injection (left panel with red lines representing median values), as well as for eight individual flies sampled 4 hr post-injection (right panel). (D) Correlation between bacterial load in individual fly heads (correlated with bacterial load in the abdomen, see Figure 7—figure supplement 1) and Diptericin expression in Canton S flies 8 hr post-injection with P. rettgeri. The lack of a significant correlation (Spearman correlation test, S = 4225.9, r = 0.06, p=0.75) suggests that the activation of the immune system is independent of early bacterial load. Dashed lines in panels A and B represent the connection between medians.
-
Figure 7—source data 1
Data set for Figure 7.
- https://doi.org/10.7554/eLife.28298.026
-
Figure 7—source data 2
Data set for Figure 7—figure supplement 1.
- https://doi.org/10.7554/eLife.28298.027
Figure 7—figure supplement 1

Correlation between the number of P. rettgeri in head and abdomen of the same fly (Spearman correlation test, S = 633.31, r = 0.84, p=8.8e-09).
https://doi.org/10.7554/eLife.28298.025Tables
Table 2
Effect of early growth (tlag, µ and σb) and control (t̄c, Vc and ntip) parameters on the capacity of the model to predict survival.
Log-likelihood is computed either on bacterial load data (i.e. on the data set we used to fit the model) or on survival data. In this latter case, we used the probability of control predicted by the model as an offset in a binomial general linear model (glm) fitted to survival data. This glm includes an intercept which quantifies the difference between predicted control probability and observed survival. p-values indicate whether keeping a parameter constant for all bacteria significantly alters survival prediction.
| Complete data set | Intermediate survival | ||||||
|---|---|---|---|---|---|---|---|
| Bacterial load | Survival | Bacterial load | Survival | ||||
| df | logLik | logLik | p-value | logLik | logLik | p-value | |
| Full | −1243.119 | −17.85860 | −800.0603 | −11.48770 | |||
| Control | 24 | −1629.965 | −21.68408 | 0.999 | −839.5523 | −17.18319 | 0.496 |
| t̄c | 8 | −1660.396 | −19.18941 | 0.954 | −839.5791 | −16.82534 | 0.030 |
| Vc | 8 | −1643.985 | −17.37663 | 1 | −826.4296 | −14.67760 | 0.173 |
| ntip | 8 | −1634.382 | −25.23397 | 0.064 | −832.8896 | −12.85596 | 0.603 |
| Growth | 24 | −1798.630 | −81.13355 | 6.512e-16 | −854.1100 | −11.37739 | 1 |
| tlag | 8 | −1692.743 | −16.49076 | 1 | −835.3833 | −11.30397 | 1 |
| µ | 8 | −1705.175 | −61.56015 | 1.564e-15 | −836.3794 | −11.75406 | 0.970 |
| σb | 8 | −1704.156 | −21.95270 | 0.415 | −848.2682 | −12.28487 | 0.810 |
Table 1
List of parameters of the mixture model with their signification.
https://doi.org/10.7554/eLife.28298.029| Baranyi model | |
|---|---|
| n0 | Bacterial load upon injection |
| nmax | Maximum bacterial load |
| tlag | Lag time |
| µ | Early bacterial growth rate |
| σb | Standard deviation of loads in the absence of control |
| Exponential model | |
| nc | Intercept of the exponential decrease model |
| δ | Decrease rate in bacterial load when infection is controlled |
| σc | Standard deviation of loads in controlled infections |
| Control | |
| t̄c | Average time to control |
| Vc | Variance in time to control |
| ntip | Bacterial load above which the host cannot control infection |
Additional files
-
Supplementary file 1
Primer sequences used in the qPCR analysis.
- https://doi.org/10.7554/eLife.28298.030
-
Transparent reporting form
- https://doi.org/10.7554/eLife.28298.031
Download links
A two-part list of links to download the article, or parts of the article, in various formats.
Downloads (link to download the article as PDF)
Open citations (links to open the citations from this article in various online reference manager services)
Cite this article (links to download the citations from this article in formats compatible with various reference manager tools)
Stochastic variation in the initial phase of bacterial infection predicts the probability of survival in D. melanogaster
eLife 6:e28298.
https://doi.org/10.7554/eLife.28298


