Defining the location of promoter-associated R-loops at near-nucleotide resolution using bisDRIP-seq
- Cornell University, United States
Figures
Figure 1 with 3 supplements
Near-nucleotide resolution mapping of R-loops.
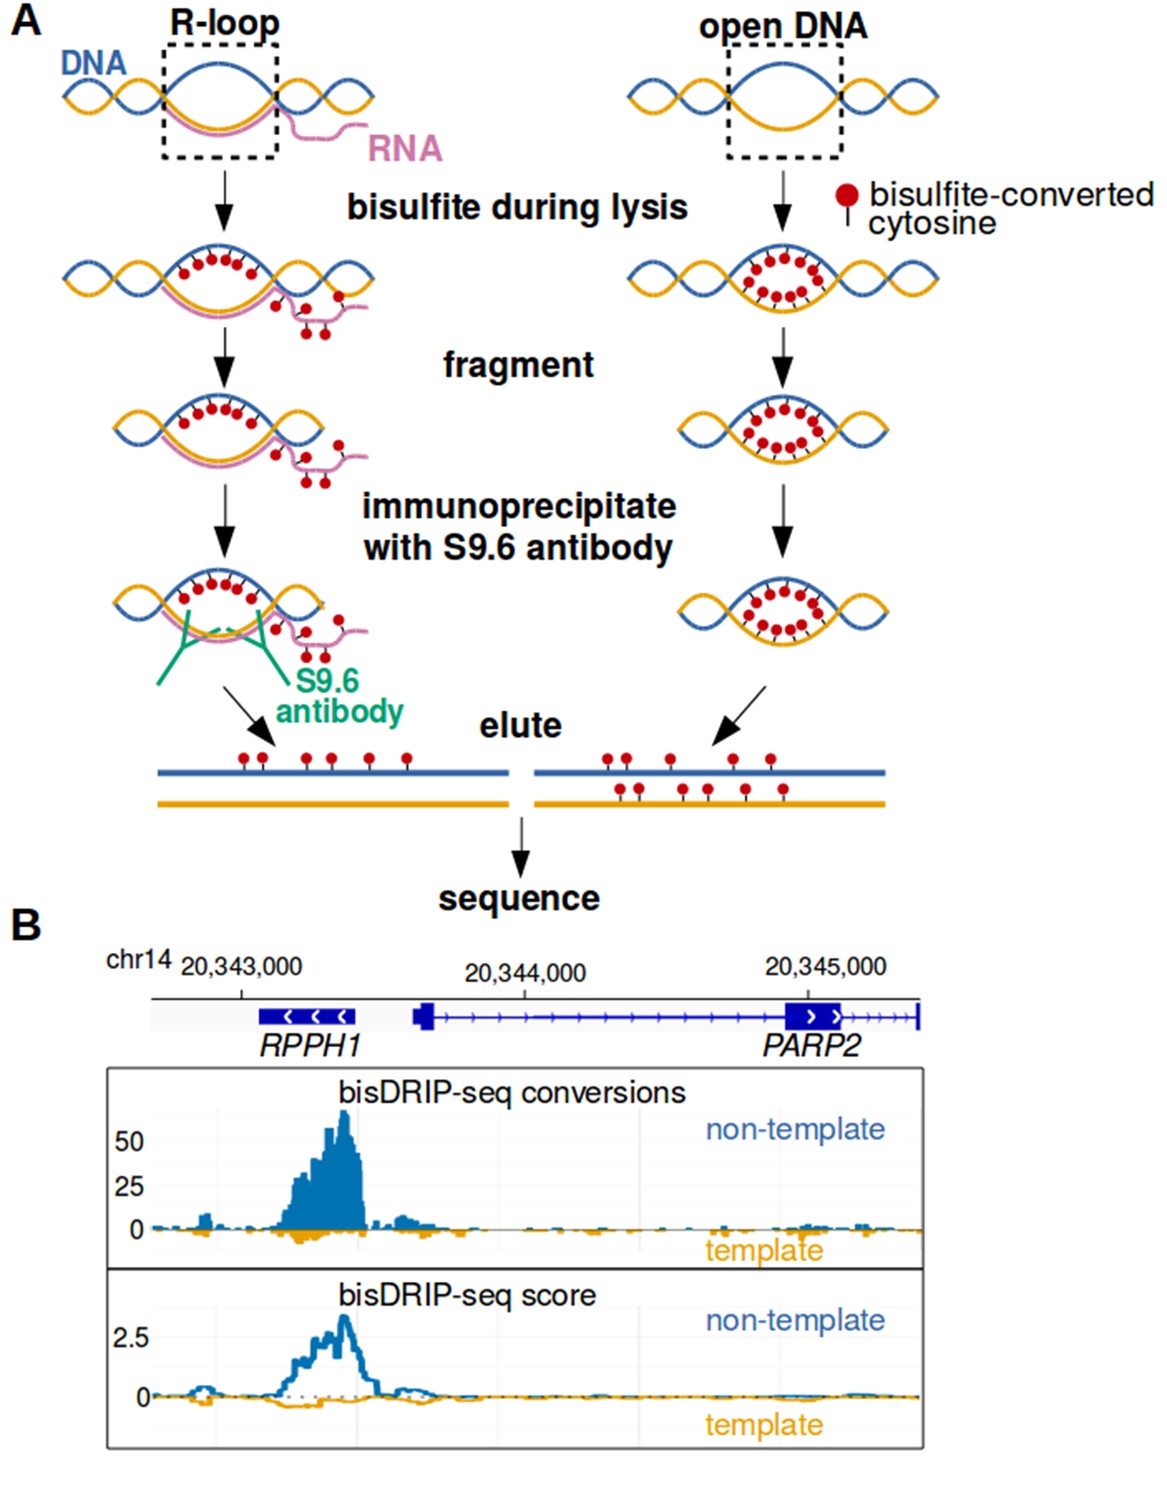
(A) Diagram illustrating the work-flow of the bisDRIP-seq protocol. For DNA molecules, one DNA strand is shown in blue, while the other strand is shown in orange. Red dots indicate the location of bisulfite-induced cytosine-to-uracil conversions. (B) A high number of cytosine conversions and high bisDRIP-seq scores are observed at a specific gene locus. bisDRIP-seq cytosine conversions and high bisDRIP-seq scores are specifically observed on one strand of the RPPH1 gene. In these plots, the template strand refers to the strand used for RPPH1 transcription, rather than the template strand used for PAPR2 transcription. In the top plot, cytosine-to-uracil conversions were mapped to the genomic region surrounding RPPH1. The number of conversions on the template strand and non-template strand were plotted below the x-axis (orange) or above the x-axis (blue), respectively. Shown are the total number of conversions observed in all bisDRIP-seq samples (n = 13). In the lower plot, the bisDRIP-seq scores were mapped to the genomic region surrounding RPPH1 (mean bisDRIP-seq score from n = 13 samples). The bisDRIP-seq score on the template strand and non-template strand were plotted below the x-axis (orange) or above the x-axis (blue), respectively. As can be seen, the genomic region containing RPPH1 had both a high number of cytosine-to-uracil conversions and high bisDRIP-seq scores specifically on the non-template strand. By contrast, the PARP2 gene had minimal bisDRIP-seq conversions and low bisDRIP-seq scores. Source code for bisDRIP-seq score calculation can be found in Source code 1.
Figure 1—figure supplement 1
bisDRIP-seq identifies regions of single-stranded DNA.
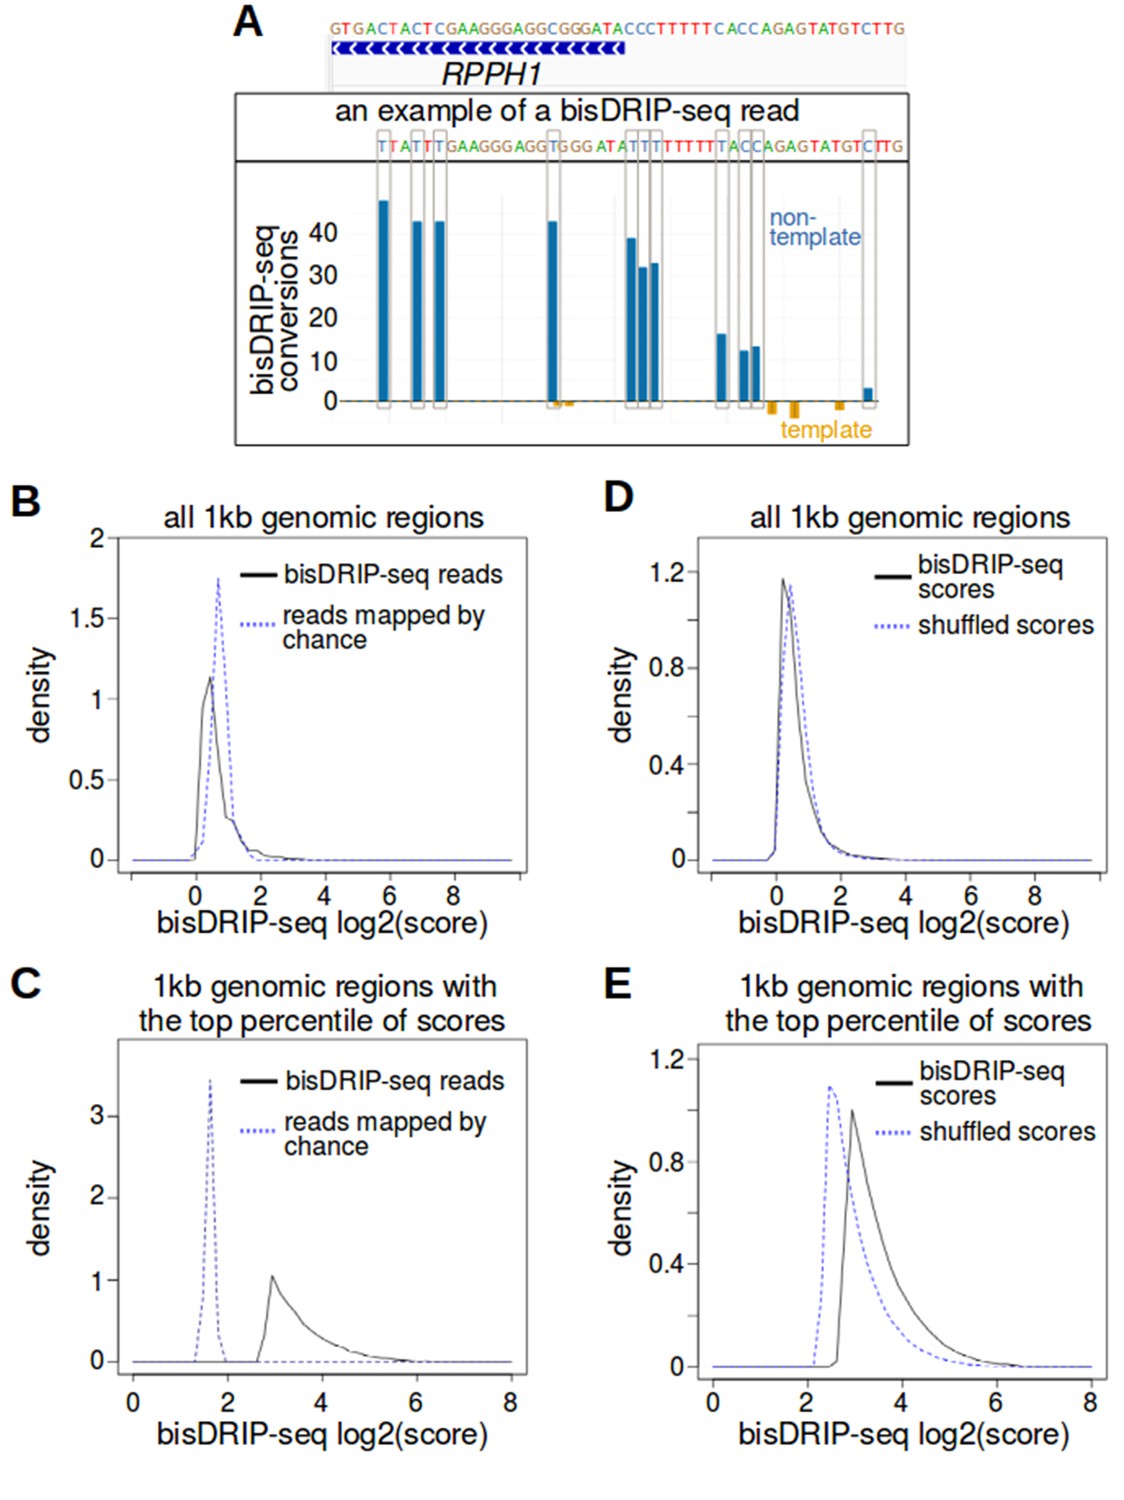
(A) Consecutive bisulfite conversions are observed in the genomic region surrounding RPPH1's transcription start site. The bisDRIP-seq bisulfite treatment should create consecutive cytosine-to-uracil conversions in regions of single-stranded DNA. We expected to observe this in individual reads located in single-stranded regions. We also expected to observe a high aggregated number of conversions within regions of DNA that were frequently single-stranded. As shown in Figure 1B, the entire RPPH1 gene appeared to preferentially contain single-stranded DNA on its non-template strand. Here we observe part of this region at higher resolution and in individual reads. At the top of the panel, a gene model is displayed of the genomic region located within 25 bp of the transcription start site of RPPH1. Above this gene model is the exact sequence of DNA in this region. Under the gene model of RPPH1, is the sequence of one of the reads that overlapped with the transcription start site of RPPH1. Within the sequence of the read, cytosines that were not converted by bisulfite are represented by a blue ‘C’. By contrast, putative bisulfite-converted cytosines are represented by a blue ‘T’. In this particular read, eight consecutive cytosines were converted near the transcription start site, while three consecutive cytosines were not converted further upstream of the transcription start site. This suggests that the read represented a region of DNA that was partially single-stranded and partially double-stranded immediately after cell lysis. In the lower plot, the total number of conversions on the template strand and non-template strand were plotted below the x-axis (orange) or above the x-axis (blue), respectively. Shown are the total number of conversions observed in all bisDRIP-seq samples (n = 13). Consecutive cytosines on the non-template strand had high numbers of conversion in the region immediately upstream of the transcription start site and in the region downstream of the transcription start site. This suggests that the conversions were due to the presence of single-stranded DNA in this region. (B,C) bisDRIP-seq scores are more clustered than expected if read location were determined through stochastic processes. Stochastic processes were modeled using a Monte Carlo simulation. In this simulation, all of the reads from a given sample were mapped to a randomly-assigned 1 kb region. This 1 kb region had to be within the same chromosome as the original read and it had to overlap with one bisDRIP-seq read. This process was repeated for all reads within each sample. Next, mean bisDRIP-seq scores were calculated for each 1 kb region in the genome using either real bisDRIP-seq reads (black, solid, n = 13) or using reads assigned to regions at random (blue, dashed, n = 13). We then compared the density of regions (y-axis) with a given mean bisDRIP-seq score (x-axis) for all regions (C) (n = 2956134) or just the regions that had the top percentile of scores (D) (n = 29561). The Monte Carlo simulation generated a larger proportion of regions with moderate scores, while the bisDRIP-seq scores from aligned reads were concentrated in a smaller subset of regions (p<2.2×10⁻¹⁶, Wilcoxon signed-rank test). This is consistent with bisDRIP-seq showing greater specificity than expected by chance. Source code for calculating bisDRIP-seq region scores can be found in Source code 2 and source code for Monte Carlo simulation can be found in Source code 3. (D,E) bisDRIP-seq scores are more clustered than expected if the bisDRIP-seq scores of reads were determined through stochastic processes. A ‘shuffled scores’ control was generated by randomly assigning bisDRIP-seq scores to reads from the same chromosome in a given sample. This was repeated across all chromosomes and across all samples (n = 13). Next, bisDRIP-seq scores were calculated for each 1 kb region in the genome using either the bisDRIP-seq scores originally calculated for each reads (black, solid) or using the shuffled scores (blue, dashed). We then compared the density of regions (y-axis) with a given mean bisDRIP-seq score (x-axis, n = 13) for all regions (E) (n = 2956134) or just the regions that had the top percentile of scores (F) (n = 29561). The Monte Carlo simulation generated a larger proportion of regions with moderate scores, while the bisDRIP-seq scores generated from experiments were more concentrated in the regions with the highest scores (p<2.2×10⁻¹⁶, Wilcoxon signed-rank test). This suggests that the intensity of bisDRIP-seq score is informative and was not just due to stochastic processes. Source code for calculating bisDRIP-seq region scores can be found in Source code 2 and source code for shuffled scores Monte Carlo simulations can be found in Source code 4.
Figure 1—figure supplement 2
bisDRIP-seq scores are sensitive to RNase H.
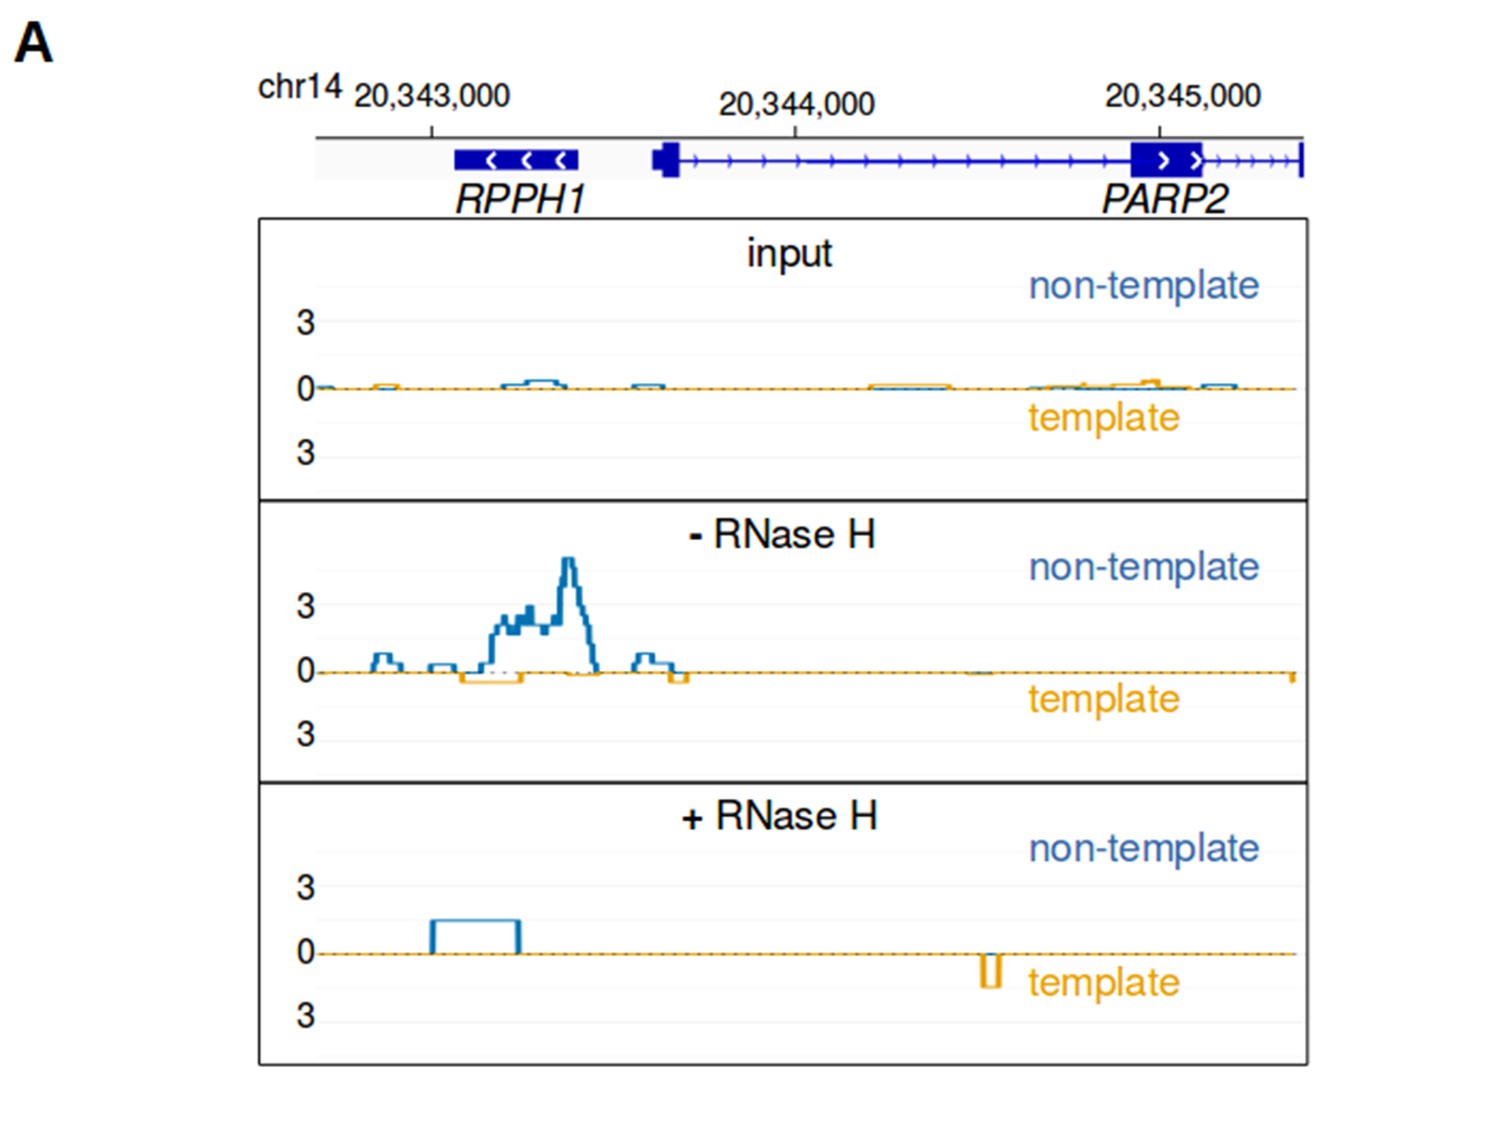
(A) RNA-DNA hybrid formation is necessary for enrichment of bisDRIP-seq signal at sites of R-loop formation. RNA-DNA hybrids are integral components of R-loops. RNA-DNA hybrids are known to bind the S9.6 antibody and to be degraded by RNase H. R-loop signal should therefore be lost in the absence of S9.6 immunoprecipitation or if the sample is treated with RNase H. In each of these plots, the template strand refers to the strand used for RPPH1 transcription, rather than the template strand used for PAPR2 transcription. Also, in each plot the bisDRIP-seq score on the template strand and non-template strand were plotted below the x-axis (orange) or above the x-axis (blue), respectively. In the top plot, bisDRIP-seq scores were mapped to the genomic region surrounding RPPH1 from ‘input’ samples (mean bisDRIP-seq score from n = 2 samples). These input samples received the entire bisDRIP-seq treatment except for the S9.6 immunoprecipitation enrichment steps. In the middle plot, bisDRIP-seq scores were mapped to the genomic region surrounding RPPH1 from a control-treated bisDRIP-seq experiment that was not treated with RNase H (n = 1 sample). In the bottom plot, bisDRIP-seq scores were mapped to the genomic region surrounding RPPH1 from an RNase H-treated bisDRIP-seq experiment (n = 1 sample). The bisDRIP-seq sample that was not treated with RNase H has high bisDRIP-seq score at the RPPH1 locus. On the other hand, there is a large decrease in bisDRIP-seq signal in the sample treated with RNase H. This suggests that bisDRIP-seq signal in the RPPH1 locus depends on the presence of an RNA-DNA hybrid.
Figure 1—figure supplement 3
bisDRIP-seq scores of promoter regions were correlated between samples.
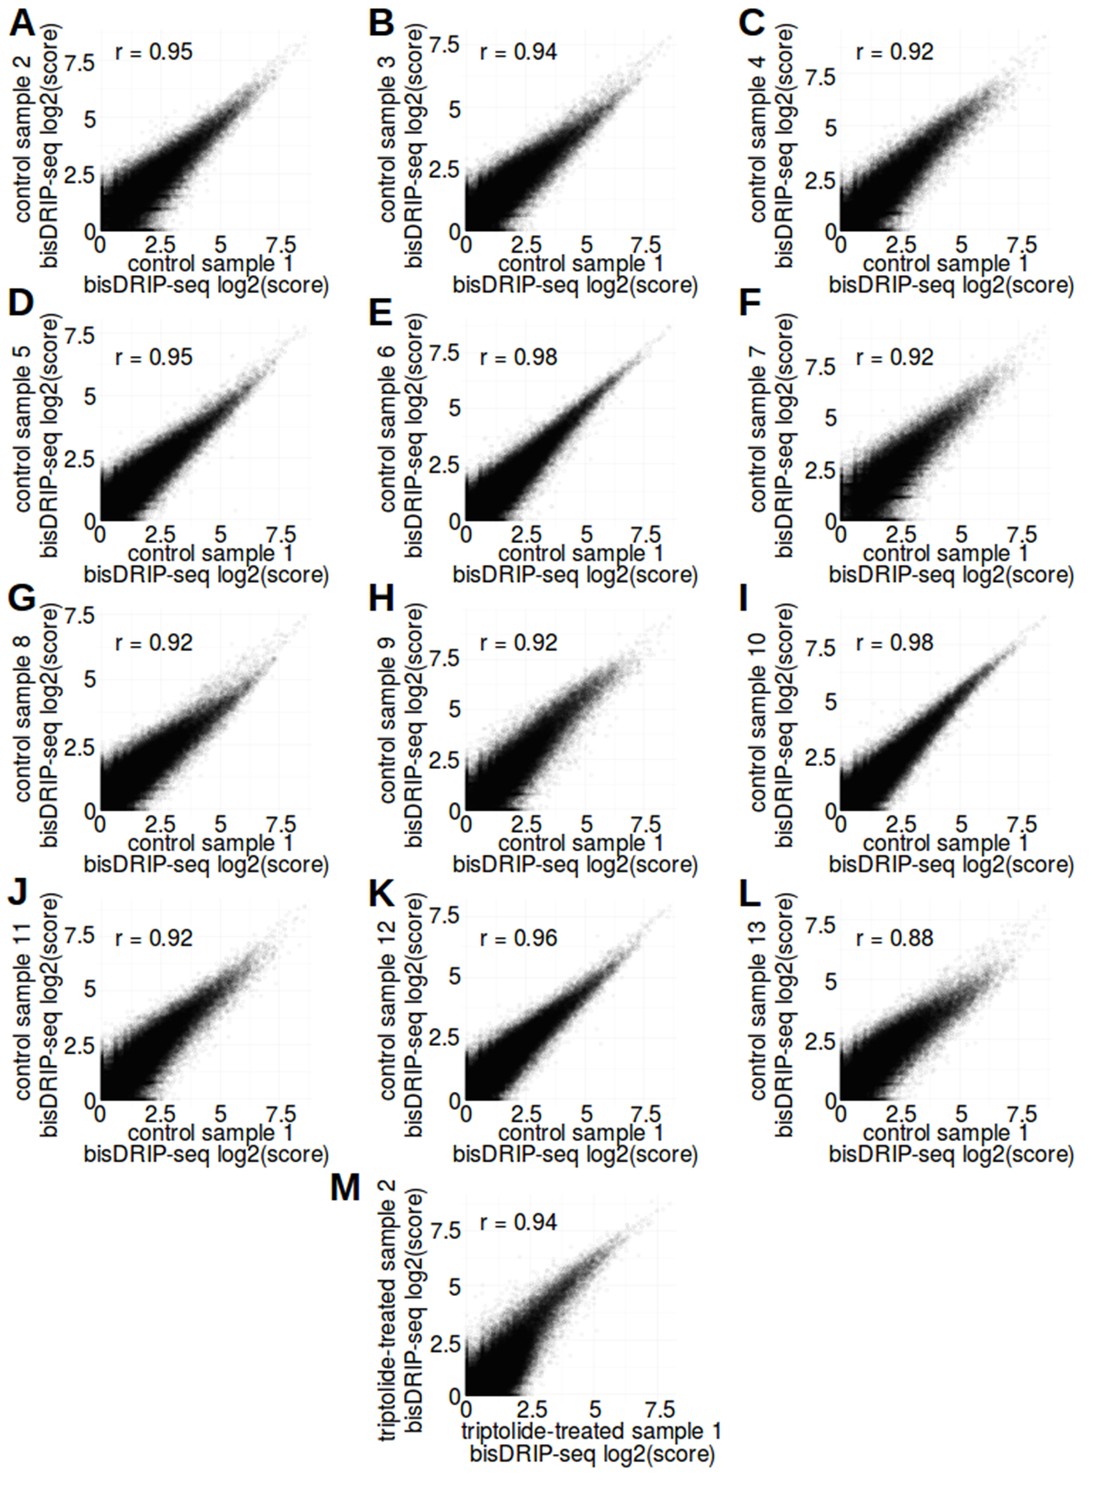
(A–L) bisDRIP-seq scores of promoter regions were reproducible between control-treated samples. In order to examine the level of sample-to-sample variation in control-treated bisDRIP-seq samples, we compared the bisDRIP-seq scores of each promoter region in different control-treated samples. bisDRIP-seq scores were calculated for each promoter region derived from our reference GENCODE transcription start site list (n = 78218). Promoter regions were defined as the region within 1000 bp of a transcription start site. The bisDRIP-seq score for each promoter region was calculated using the sum of the bisDRIP-seq read scores aligned to either strand as described in methods. The log2 of the bisDRIP-seq score for each promoter region in control-treated sample 1 (x-axis) was plotted against the same value generated from each of the other twelve control-treated samples (y-axis). The bisDRIP-seq scores in promoter regions in control-treated sample one were correlated with the bisDRIP-seq scores in promoter regions in each of the other control-treated samples. This suggests that the control-treated bisDRIP-seq experiments were reproducible. Pearson correlation coefficients (r) are indicated in the top-left corner of each plot. (M) bisDRIP-seq scores of promoter regions were reproducible between triptolide-treated samples. In order to examine the level of sample-to-sample variation in triptolide-treated bisDRIP-seq samples, we compared the bisDRIP-seq scores of each promoter region in both of our triptolide-treated samples. bisDRIP-seq scores were calculated as described in (A–L) for control-treated samples. The log2 bisDRIP-seq score for each promoter region (n = 78218) in the triptolide-treated sample 1 (x-axis) was plotted against the same value generated from the triptolide-treated sample 2 (y-axis). The bisDRIP-seq scores in promoter regions were correlated between the two samples. This suggests that our triptolide-treated bisDRIP-seq experiments were reproducible. The Pearson correlation coefficient (r) for this plot is indicated in the top-left corner of the plot.
Figure 2 with 1 supplement
Transcription-dependent R-loops form in active promoter regions.
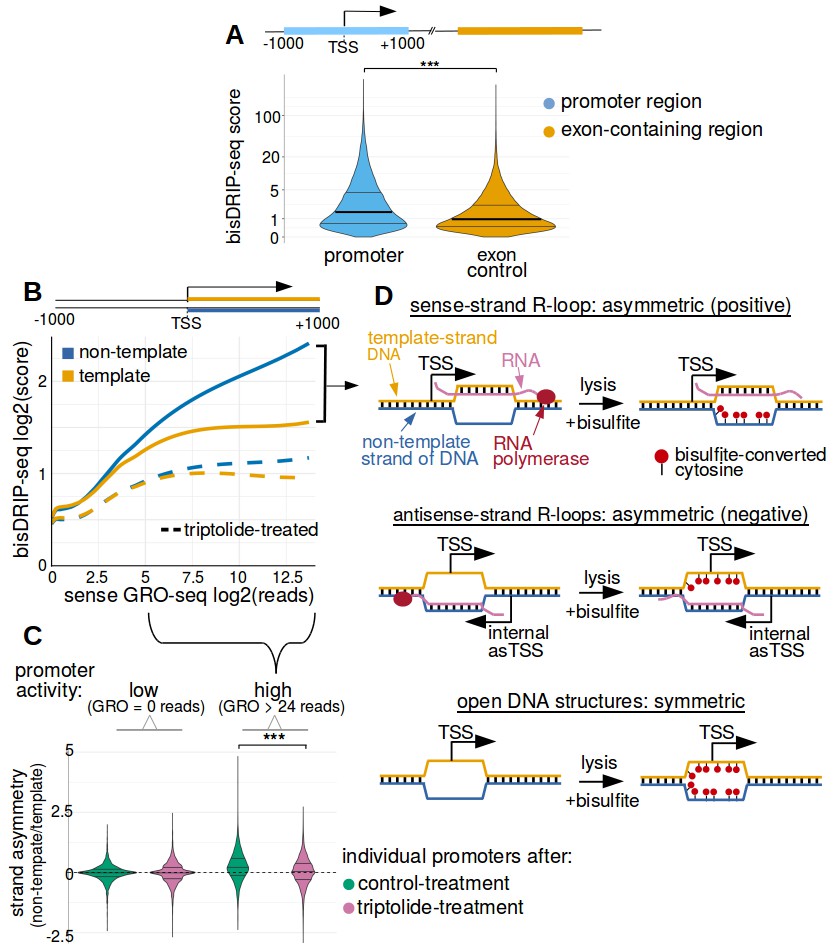
(A) bisDRIP-seq scores in promoter regions tend to be higher than in matched exon-containing regions. R-loops were previously mapped to promoter regions (Ginno et al., 2012). To determine if bisDRIP-seq scores also map to promoter regions, we compared bisDRIP-seq scores in promoter regions with matched exonic regions. Promoter regions (blue) were defined as the region within a thousand base pairs of each transcription start site. For each promoter region, a matched region (orange) was selected downstream of the promoter region in the same gene centered on an exonic site chosen at random. The distribution of bisDRIP-seq scores (y-axis, mean bisDRIP-seq score from n = 13 samples) was plotted for promoter regions (blue, n = 60016) and matched regions (orange, n = 60016) using a violin plot. Within each violin plot, the fraction of genes with a given bisDRIP-seq score are represented by the width of the overlapping violin plot. Individual lines in the violin plot represent quartiles. bisDRIP-seq scores were significantly higher in promoter regions relative to matched exon-centered regions. ‘TSS’ refers to the transcription start site. The y-axis in the plot was log2 transformed. ***p<2.2×10⁻¹⁶, Wilcoxon signed-rank test. (B) R-loop formation correlates with promoter activity. Based on previous studies (Sanz et al., 2016), R-loops are expected to form in active promoter regions, rather than in inactive promoter regions. R-loops can be identified by bisDRIP-seq based on preferential labeling of the non-template strand. Therefore, we compared the bisDRIP-seq scores on the non-template strand to the scores on the template strand and determined whether this correlated with promoter activity. Promoter activity and bisDRIP-seq scores were assessed in the region between the transcription start site and + 1000 bp. bisDRIP-seq scores were assessed separately for the non-template (blue) and template (orange) strands. For each strand, a LOESS smoothed curve was plotted of the bisDRIP-seq scores (y-axis) at different levels of promoter activity (x-axis). This was repeated for control-treated samples (solid, mean bisDRIP-seq score from n = 13 samples) and samples treated with the transcription-inhibitor triptolide (dashed, mean bisDRIP-seq score from n = 2 samples). bisDRIP-seq scores on both strands are correlated with promoter activity. Notably, with increasing promoter activity, the non-template strand is preferentially labeled. This suggests that sense-strand R-loop form in these promoters. Promoter activity was assessed using a MCF-7 GRO-seq dataset from Hah et al., 2013. Both promoter activity and bisDRIP-seq scores were plotted on log2-transformed axes. Source data for figure included in Figure 2—source data 1. (C) Transcription-dependent R-loops form in active promoters. The presence of R-loops is suggested by bisDRIP-seq strand asymmetry as illustrated in Figure 2D. Here, strand asymmetry was calculated as the log2-fold ratio of the bisDRIP-seq score of the non-template strand relative to the bisDRIP-seq score of the template strand (y-axis). The distribution of strand asymmetry for promoter regions with high promoter activity (right, GRO-seq > 24 reads, n = 4895 promoter regions), as well as an equivalent number of inactive promoter regions (left, GRO-seq = 0 reads, n = 4895 promoter regions) was plotted using a violin plots. This was repeated for control-treated samples (green, mean bisDRIP-seq score from n = 13 samples) and triptolide-treated samples (pink, mean bisDRIP-seq score from n = 2 samples). Active promoter regions typically had higher non-template bisDRIP-seq scores than template-strand bisDRIP-seq scores in control-treated samples. This strand asymmetry was significantly reduced in triptolide-treated samples. These results suggest that there were transcription-dependent R-loops in active promoter regions. Promoter activity was assessed using a GRO-seq dataset from Hah et al., 2013. The width of violin plots represents the fraction of genes with the strand asymmetry plotted on the y-axis. The individual lines in violin plots represented quartiles. ***p<2.2×10⁻¹⁶, Wilcoxon signed-rank test. (D) Simple models of the structures that may explain the high bisDRIP-seq scores observed 3' of the transcription start site in Figure 2B. As illustrated, the sense-strand R-loops (top row) logically explain the strand ‘positive’ asymmetry observed in bisDRIP-seq scores. Additionally, the high bisDRIP-seq scores observed on both DNA strands of active promoters are likely explained by some combination of all three types of structure (all three rows). In these models, the vertical black hash marks between nucleic acid strands indicate that two strands are hybridized. Red circles refer to the location of bisulfite induced cytosine-to-uracil conversions. ‘asTSS’ refers to transcription start sites for antisense transcription. Source code for calculating bisDRIP-seq region scores can be found in Source code 2.
-
Figure 2—source data 1
bisDRIP-seq scores of promoter regions.
- https://doi.org/10.7554/eLife.28306.009
Figure 2—figure supplement 1
Promoter regions were enriched in high bisDRIP-seq scores.
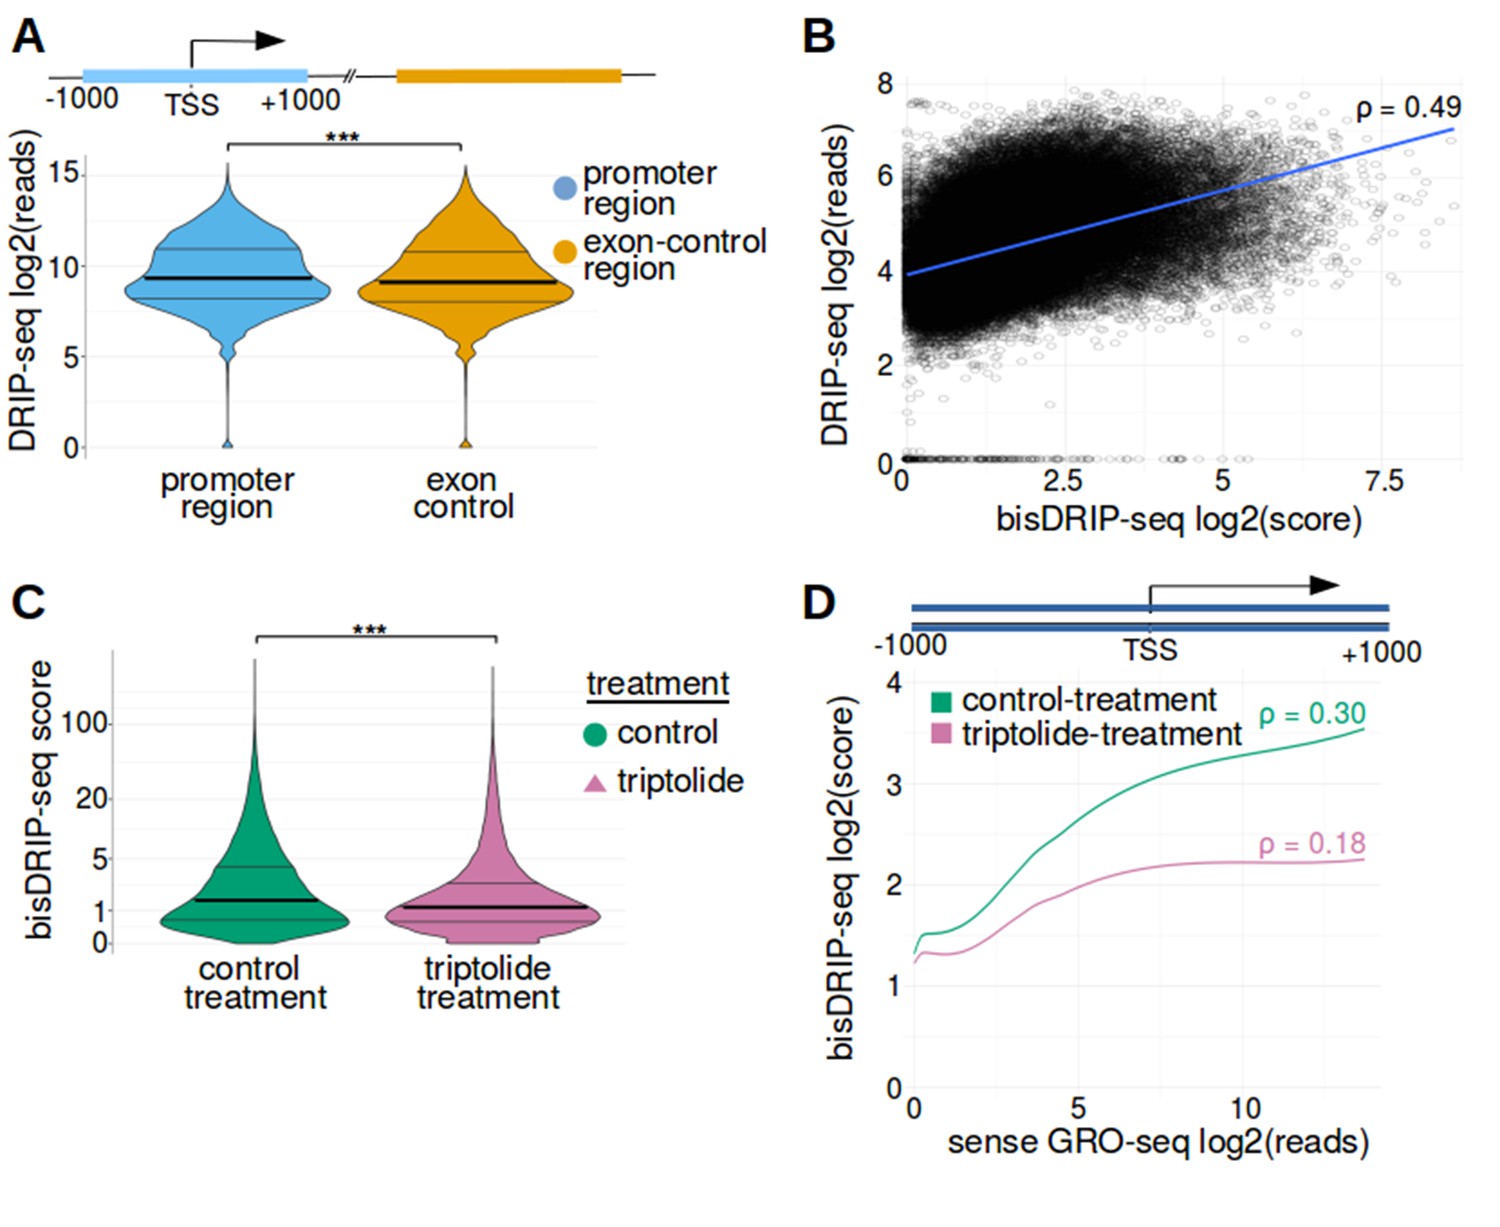
(A) DRIP-seq reads are enriched in promoter regions relative to matched exon-containing regions. R-loops were previously mapped to promoter regions (Ginno et al., 2012). To confirm that this result can be reproduced using our analysis pipeline, we compared DRIP-seq read counts in promoter regions with matched exonic regions. For each promoter region, a matched region (orange) was selected downstream of the promoter region in the same gene centered on an exonic site chosen at random. DRIP-seq read counts were calculated using DRIP-seq datasets generated by Sanz et al., 2016. DRIP-seq read counts (y-axis, log2 mean DRIP-seq reads from n = 2 samples) were plotted for promoter regions (blue, n = 60017) and matched regions (orange, n = 60017) using violin plots. Within each violin plot, the density of points at a given bisDRIP-seq score is represented by the width of the plot. Individual lines in the violin plot represent quartiles. DRIP-seq reads were significantly enriched in promoter regions relative to matched exon-centered regions. ‘TSS’ refers to the transcription start site. ***p<2.2×10⁻¹⁶, Wilcoxon signed-rank test. (B) bisDRIP-seq scores and DRIP-seq scores are correlated in promoter-regions. Since DRIP-seq is the conventional mapping technique to map R-loops at low resolution, we compared DRIP-seq and bisDRIP-seq results at the resolution provided by DRIP-seq. For each promoter region (n = 78218), the DRIP-seq read count (y-axis, log2 mean DRIP-seq reads from n = 2 samples) of the promoter region was plotted against the bisDRIP-seq score (x-axis, log2 mean bisDRIP-seq score from n = 13 samples) of the promoter region. A line of best fit (blue) was then plotted using the ggplot2 ‘lm’ function. The two datasets were significantly correlated (p<2.2×10⁻¹⁶, Spearman's test using asymptotic t approximation) with a Spearman's ρ of 0.49 and a Pearson correlation coefficient of 0.45. Thus, bisDRIP-seq and DRIP-seq provide reasonably similar results at 2 kb resolution despite the major differences between the two mapping approaches. (C) bisDRIP-seq scores are reduced in promoter-regions after transcription inhibition. R-loops were previously shown to be transcription dependent (Sanz et al., 2016). To confirm that the high bisDRIP-seq scores in promoter regions were also transcription-dependent, we repeated bisDRIP-seq in the presence of the transcription-inhibitor triptolide. The distribution of promoter region bisDRIP-seq scores (n = 78218) were plotted for control-treated samples (green, log2 mean bisDRIP-seq score from n = 13 samples) and triptolide-treated samples (purple, log2 mean bisDRIP-seq score from n = 2 samples). The width of the overlapping violin plot represents the fraction of promoter regions that had a given bisDRIP-seq score. Individual lines in the violin plot represent quartiles. The bisDRIP-seq scores in promoter regions were higher in control-treated samples than triptolide-treated samples. This suggests that the enrichment of high bisDRIP-seq scores in promoter regions was at least partially transcription-dependent. ***p<2.2×10⁻¹⁶, Wilcoxon signed-rank test. (D) bisDRIP-seq scores are correlated with promoter activity. R-loops were previously shown to correlate with the level of gene expression (Sanz et al., 2016). We therefore asked if bisDRIP-seq scores are higher in promoter regions with high promoter activity. Promoter activity and bisDRIP-seq scores were assessed in the region between the transcription start site and + 1000 bp in all promoter regions (n = 78218). A LOESS smoothed curve was plotted of bisDRIP-seq scores (y-axis) at different levels of promoter activity (x-axis). This was repeated for control-treated samples (green, log2 mean bisDRIP-seq score from n = 13 samples) and samples treated with the transcription-inhibitor triptolide (pink, mean log2 bisDRIP-seq score from n = 2 samples). bisDRIP-seq scores tend to be higher in promoter regions with higher promoter activity. This difference between promoter regions with high and low activity was reduced in samples treated with triptolide. These results suggest that the bisDRIP-seq score of promoter-regions correlates with promoter activity. Promoter activity was calculated as the mean number of sense-strand GRO-seq reads measured in the region between the transcription start site and + 1000 bp by Hah et al., 2013. Both promoter activity and bisDRIP-seq scores were plotted on log2-transformed axes. p refers to the Spearman's correlation coefficient for each plot.
Figure 3 with 4 supplements
The 5' boundary of promoter-associated R-loops is located at the transcription start site.
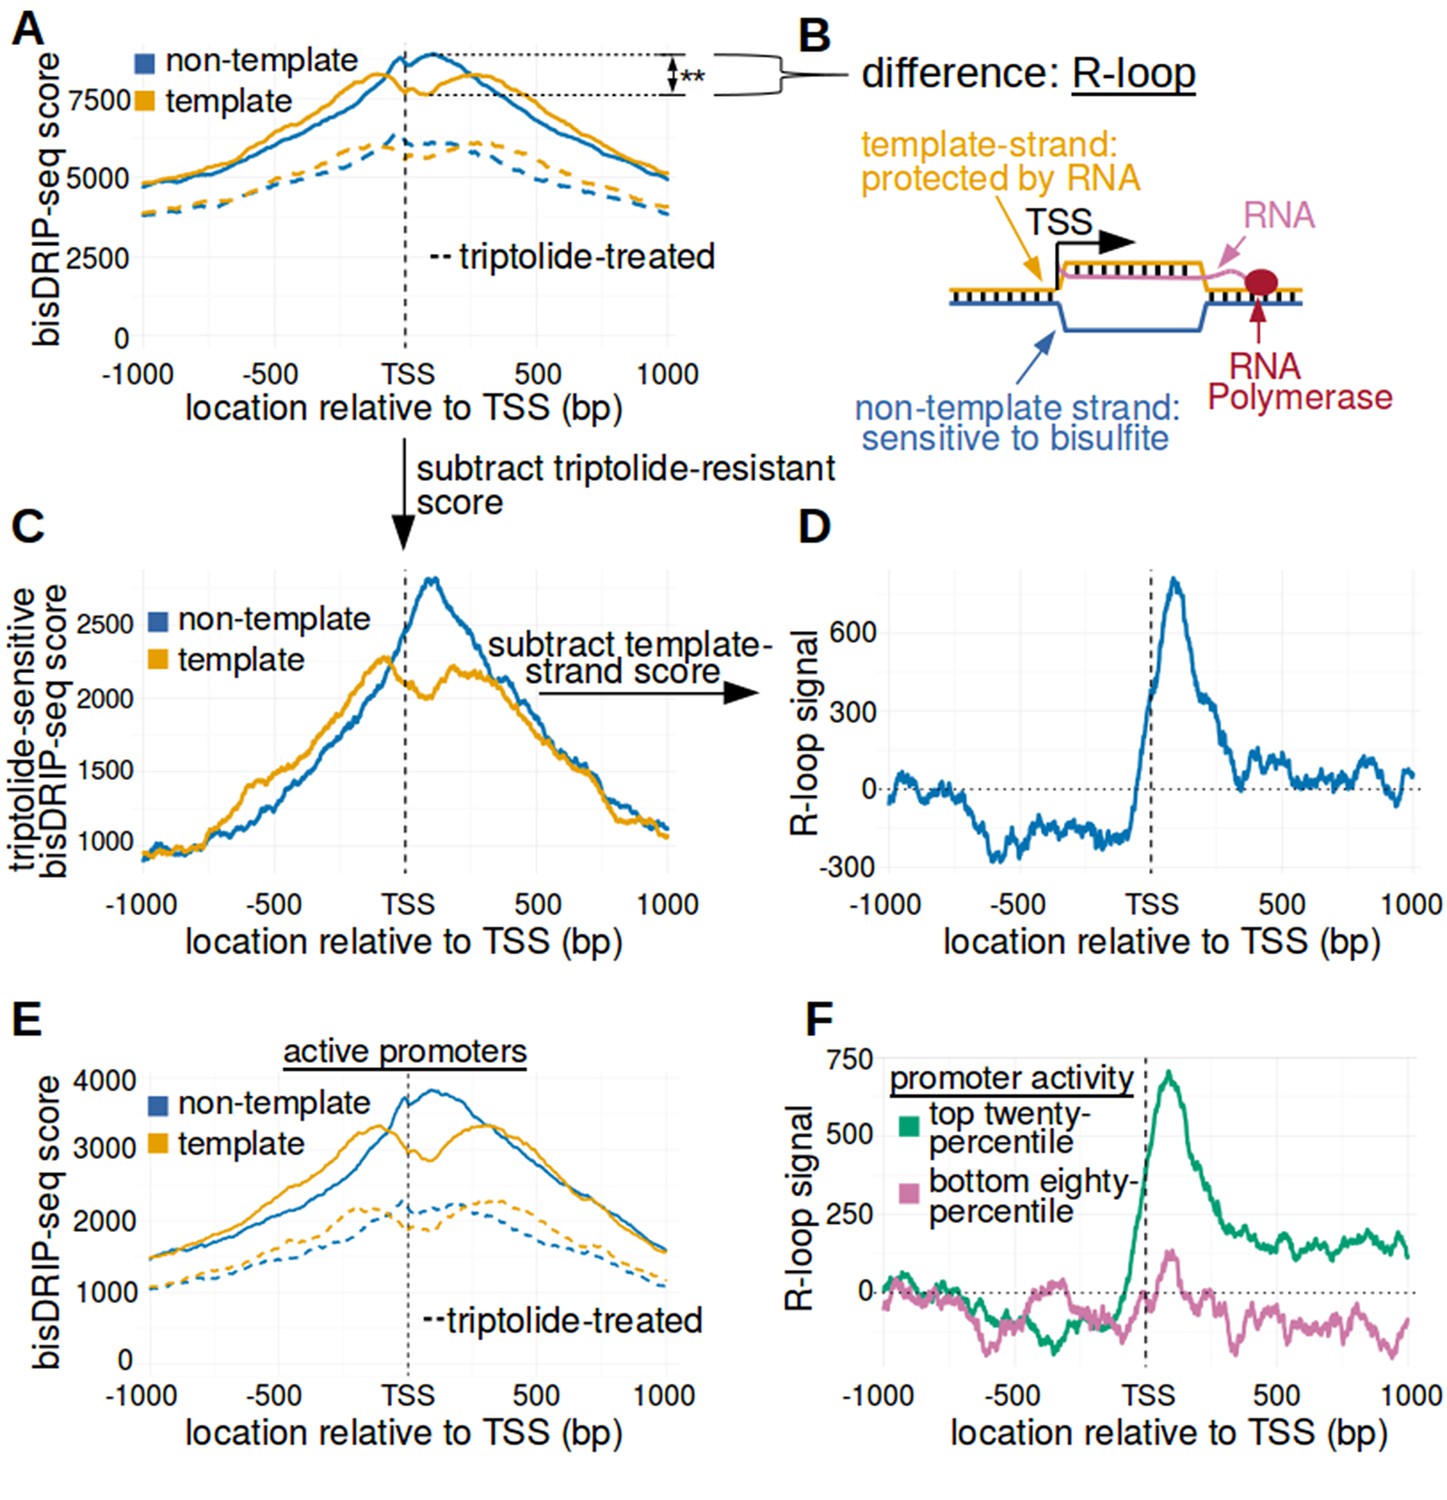
(A) Metaplot analysis of bisDRIP-seq scores reveals the location of promoter-associated R-loops. To determine the location of R-loops within promoter regions at read-length resolution, we used bisDRIP-seq score metaplot analysis. Metaplots were created by summing the bisDRIP-seq scores across all promoter regions (n = 78218) at each nucleotide position relative to the transcription start site. The score was calculated separately for the nucleotide position on the non-template strand (blue) and template strand (orange). Metaplots were then plotted for control-treated samples (solid, mean bisDRIP-seq score from n = 13 samples) and triptolide-treated samples (dashed, mean bisDRIP-seq score from n = 2 samples). In control-treated samples, bisDRIP-seq scores increase near the transcription start site for both strands. However, bisDRIP-seq scores were greater on the non-template strand than on the template strand immediately 3' of the transcription start site. This suggests that R-loops formed immediately 3' of the transcription start site. ‘TSS’ indicates the location of the transcription start site. **p<0.005, Wilcoxon signed-rank test. (B) Model of the sense-strand R-loops forming 3' of the transcription start site in Figure 3A. The location where strand asymmetry is observed in the bisDRIP-seq metaplot suggests that R-loops form 3' of the transcription start site. Additionally, the triptolide sensitivity of the bisDRIP-seq score asymmetry suggests that R-loops contain newly transcribed RNA. In this model, the black lines between nucleic acid strands indicate that two strands are hybridized. (C) Background subtraction more clearly reveals the location of R-loops. Triptolide-resistant bisDRIP-seq scores do not appear to reflect the presence of R-loops in Figures 2B and 3A. As such, we repeated our metaplot analysis using triptolide-sensitive bisDRIP-seq scores. Metaplots of the template (orange) and non-template (blue) triptolide-sensitive scores (y-axis) in all promoter regions (n = 78218) were plotted relative to the transcription start site. The preferential labeling of the non-template strand immediately 3' of the transcription start site is more apparent in this plot. Triptolide-sensitive non-template bisDRIP-seq scores were generated by subtracting the triptolide-treated sample scores (mean bisDRIP-seq score from n = 2 samples) from the control-treated sample scores (mean bisDRIP-seq score from n = 13 samples). Triptolide-sensitive template bisDRIP-seq scores were generated in the same manner. (D) Metaplot of ‘R-loop signal’ reveals that R-loops form at the transcription start site. To better visualize the location of R-loops, we directly examined the difference in the bisDRIP-seq scores of the two strands by generating a metaplot of R-loop signal. R-loop signal was defined as the triptolide-sensitive template-strand bisDRIP-seq score subtracted from the triptolide-sensitive non-template bisDRIP-seq score. A metaplot of R-loop signal (y-axis) was plotted for all promoter regions (n = 78218) relative to the transcription start site. R-loop signal (blue) was highest in the region immediately 3' of the transcription start site and decreased 200–250 bp downstream of the transcription start site. R-loop signal at each nucleotide position was derived using the mean bisDRIP-seq score from n = 13 control-treated samples and mean bisDRIP-seq score from n = 2 triptolide-treated samples. (E) Metaplot of bisDRIP-seq scores in active promoter regions. In Figure 2C,R-loops appeared to predominantly form in active promoter regions. Thus metaplot analysis was repeated using only active promoter regions. A metaplot of bisDRIP-seq scores was created for the non-template strand (blue) and template strand (orange) across only active promoter regions (n = 15644). bisDRIP-seq scores were plotted on separate lines for control-treated samples (solid, mean bisDRIP-seq score from n = 13 samples) and triptolide-treated samples (dashed, mean bisDRIP-seq score from n = 2 samples). In control-treated samples, the location in the metaplot where the non-template bisDRIP-seq scores are higher than the template bisDRIP-seq scores is the same as in the metaplot for all promoters (Figure 3A). However, the difference between the strands is more pronounced in this metaplot of just active promoter regions. In this plot, active promoters refers to promoters with activity in the top twenty percentile as calculated using the GRO-seq dataset from Hah et al., 2013. (F) R-loops are only clearly observed in active promoter regions. A metaplot of R-loop signal was plotted for promoter regions in the top twenty percentile of promoter activity (green, n = 15644) and for promoter regions in the bottom eighty percentile of promoter activity (purple, n = 62574). There is no clear positive R-loop signal observed in promoter regions with lower promoter activity. By contrast, in active promoters the R-loop signal 3' of the transcription start site appears to be as high as the R-loop signal observed in all promoter regions (Figure 3D). R-loop signal at each nucleotide position was derived using the mean bisDRIP-seq score from n = 13 control-treated samples and mean bisDRIP-seq score from n = 2 triptolide-treated samples. Source code for metaplots can be found in Source code 5.
Figure 3—figure supplement 1
R-loop boundaries at the transcription start site of active promoter regions.
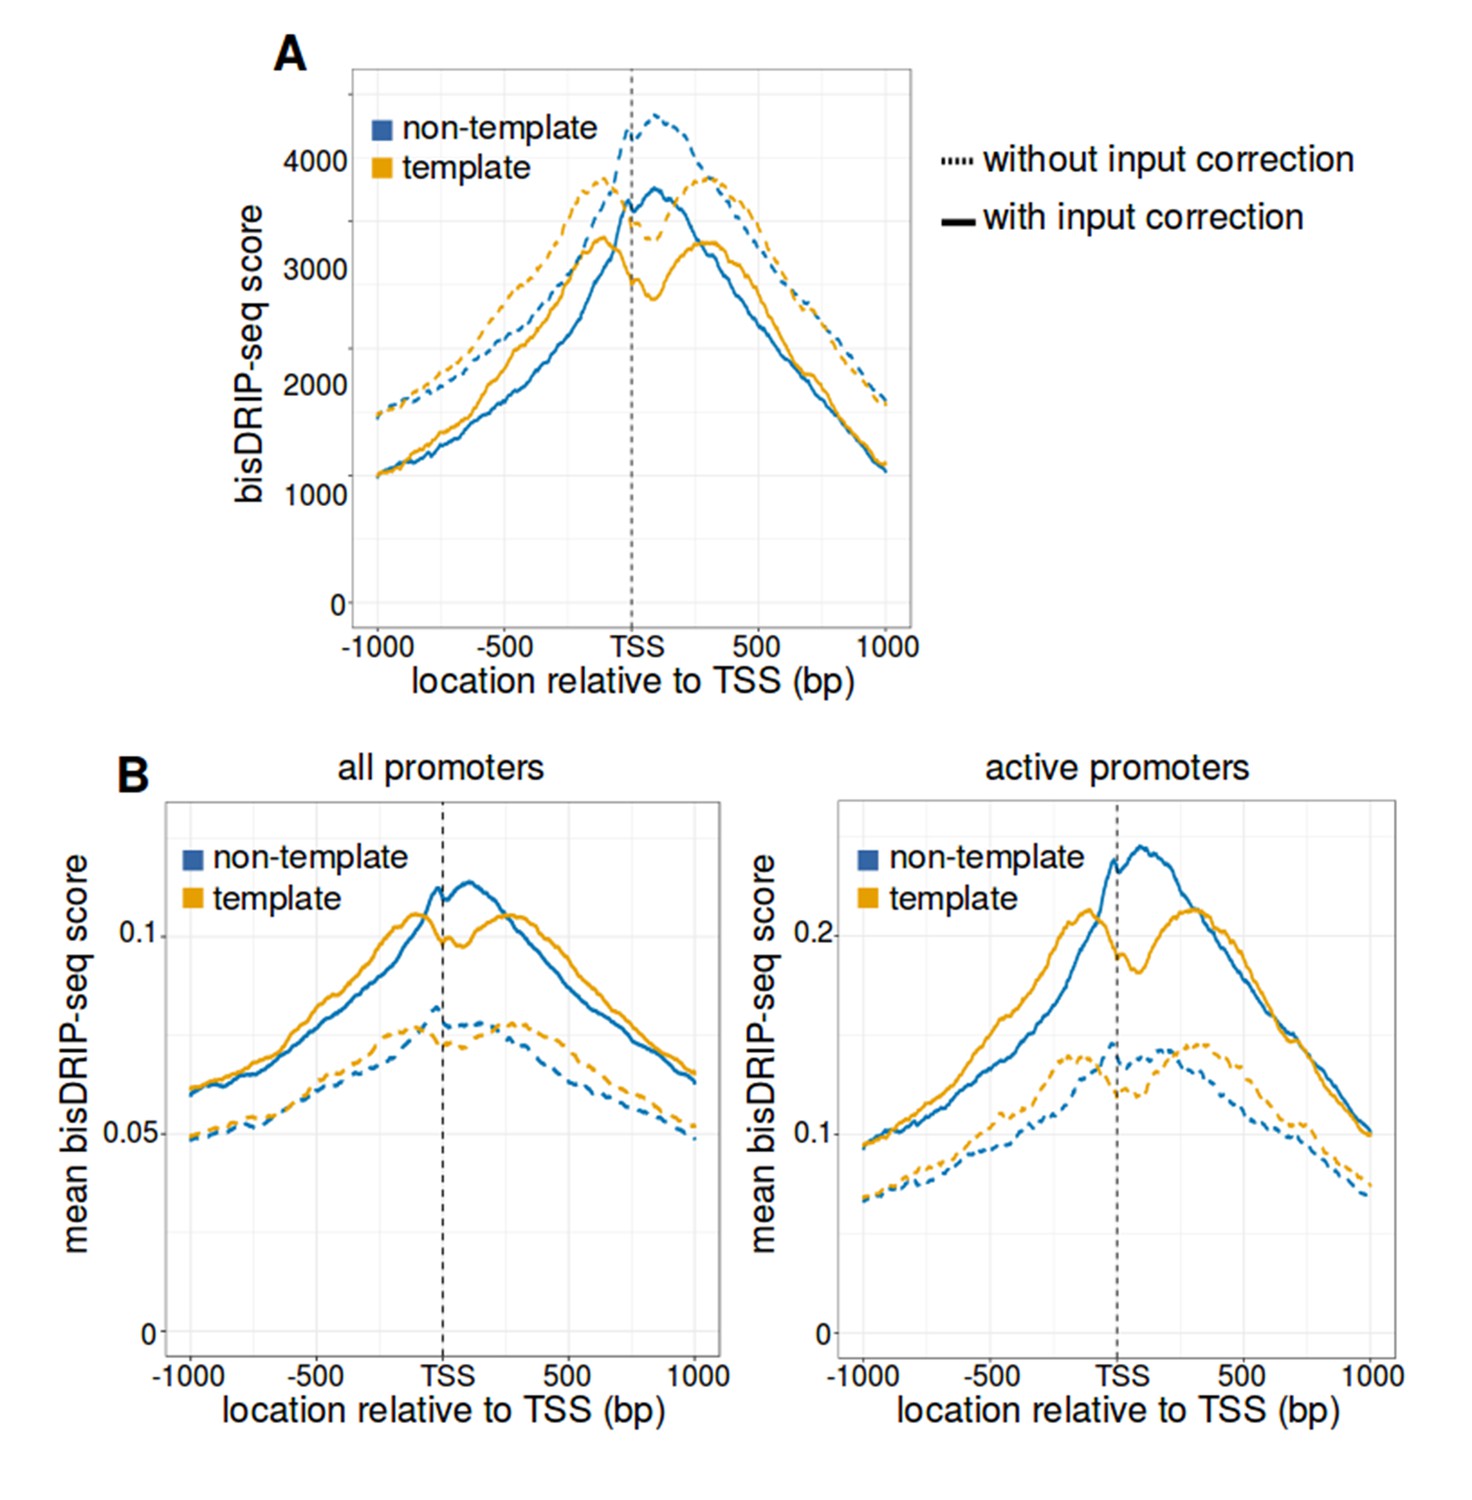
(A) The strand asymmetry downstream of the transcription start site remains after ‘input’-sample background correction. The observation of R-loops by bisDRIP-seq should depend on RNA-DNA hybrid immunoprecipitation. We therefore asked whether that strand asymmetry is lost in metaplot analysis after performing background correction using bisDRIP-seq scores from input samples. Metaplots were generated separately for the non-template strand (blue) and template strand (orange) across active promoter regions (n = 15644). bisDRIP-seq scores were plotted for control-treated samples (dashed lines, n = 13 samples) and for control-treated samples after the subtraction of input bisDRIP-seq scores (solid lines, n = 13 control-treated samples and n = 2 input bisDRIP-seq samples). bisDRIP-seq scores decrease on both strands after input sample correction. However, there is no apparent decrease in the strand asymmetry of bisDRIP-seq score. This suggests that RNA-DNA hybrids enriched by S9.6 antibody are causing the strand asymmetry immediately downstream of the transcription start site. Input bisDRIP-seq samples were treated identically to bisDRIP-seq experiments, except that no S9.6 immunoprecipitation enrichment steps were performed. (B,C) Active promoter regions have high mean bisDRIP-seq scores relative to all promoter regions. To determine the location of R-loops within promoter regions at read-length resolution, we used bisDRIP-seq score metaplot analysis. In (B), metaplots were generated by plotting the mean bisDRIP-seq score of all promoter regions (mean of n = 78218 promoter regions) at each nucleotide position relative to the transcription start site. In (C), metaplots were generated by plotting the bisDRIP-seq score of active promoter regions (mean of n = 15644 promoter regions) at each nucleotide position relative to the transcription start site. For both panels, mean bisDRIP-seq scores were calculated separately for the nucleotide positions on the non-template strand (blue) and template strand (orange). Metaplots were then plotted for control-treated samples (solid, mean bisDRIP-seq score from n = 13 samples) and triptolide-treated samples (dashed, mean bisDRIP-seq score from n = 2 samples). In both plots, the non-template bisDRIP-seq scores are higher on the non-template strand relative to the template strand immediately 3' of the transcription start site. However, the mean bisDRIP-seq score for each strand is higher among active promoters. Additionally, the difference between strand mean bisDRIP-seq scores is higher among active promoters. This suggests that R-loop tend to form preferentially in active promoter regions. In this plot, active promoters refers to promoters with activity in the top twenty percentile as calculated using the GRO-seq dataset from Hah et al., 2013.
Figure 3—figure supplement 2
The transcription start site bounds R-loops in active promoter regions.
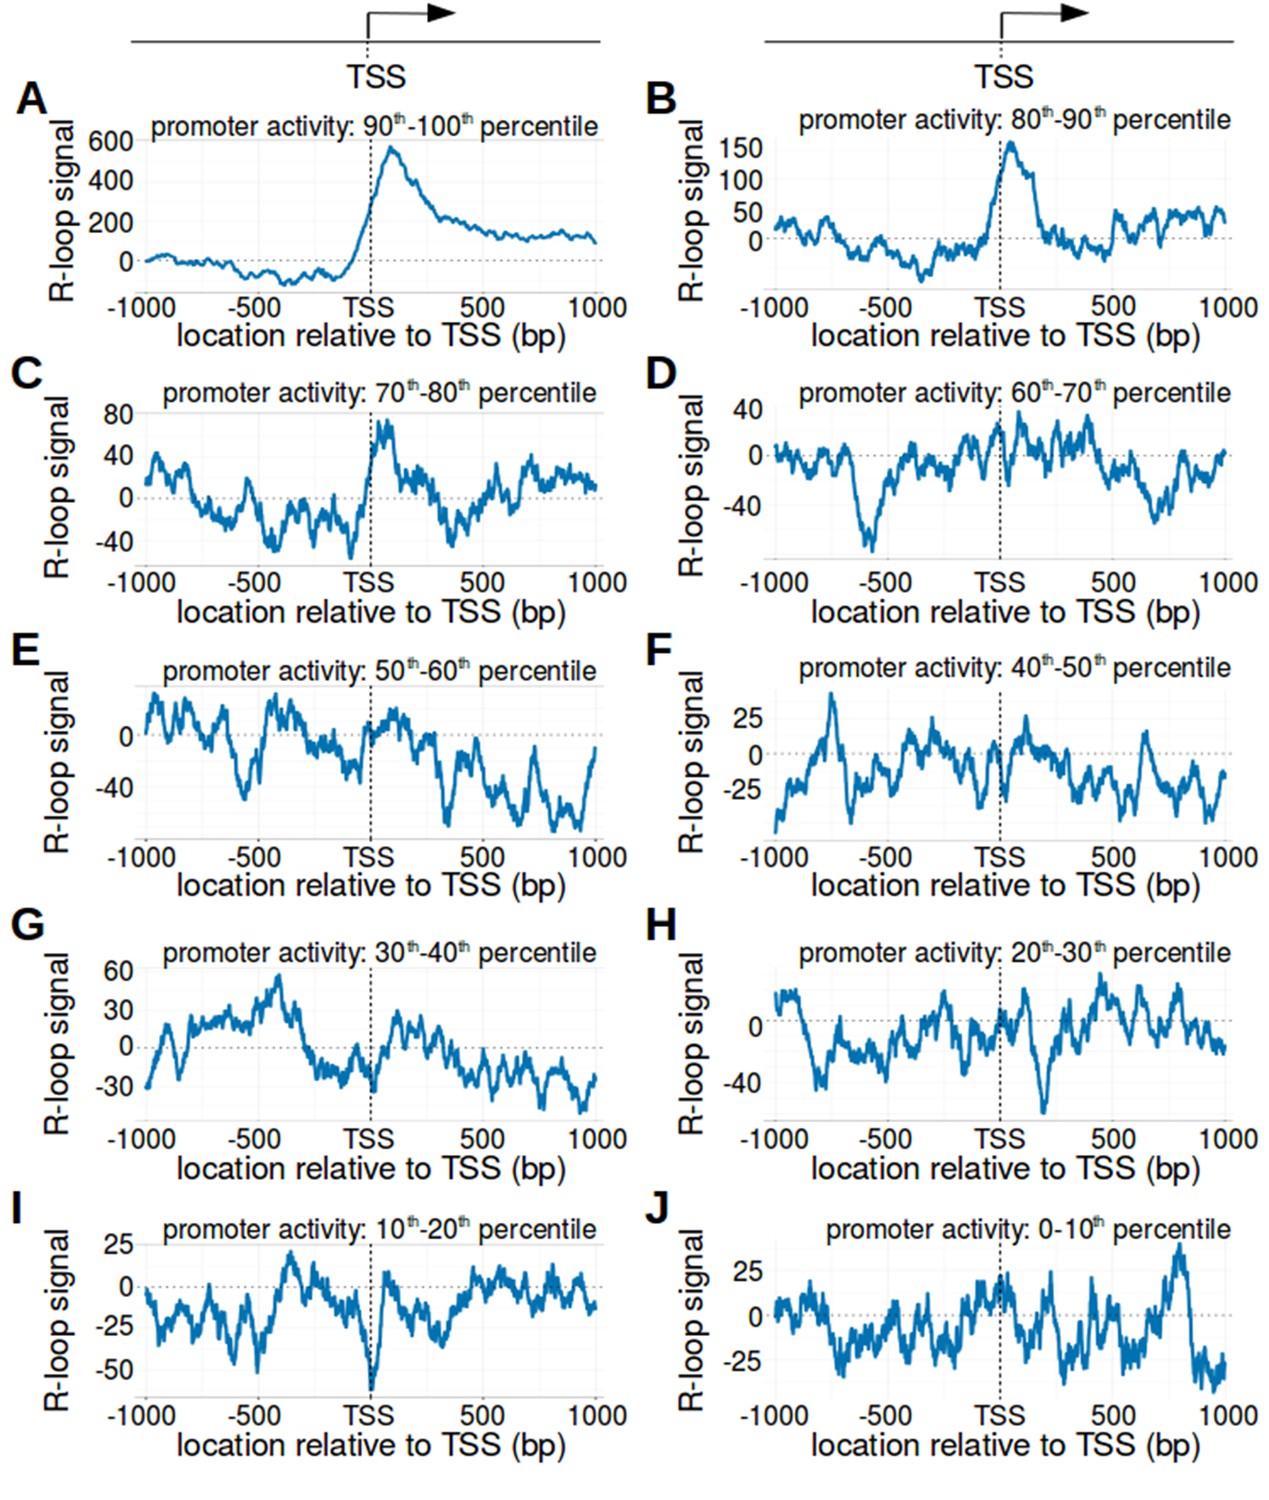
(A–J) R-loop signal in promoter regions with different levels of promoter activity. In Figure 2C, bisDRIP-seq scores were typically greater on the non-template strand than the template strand in promoter regions with high promoter activity. We therefore wanted to know if metaplots of promoter regions varied based on promoter activity. Promoter regions were binned into ten nearly equal-sized bins based on promoter activity (n = 7821 or 7822). Metaplots with a higher promoter activity percentile have a higher promoter activity. Metaplots were generated of the R-loop signal (blue) in the promoter region of each bin: (A) ninety to a hundred percentile, (B) eighty to ninety percentile, (C) seventy to eighty percentile, (D) sixty to seventy percentile, (E) fifty to sixty percentile, (F) forty to fifty percentile, (G) thirty to forty percentile, (H) twenty to thirty percentile, (I) ten to twenty percentile, and (J) zero to ten percentile. Notably, a clear peak of positive R-loop signal downstream of the transcription start site was only observed in metaplots of promoter regions with promoter activity in the top twenty percentile (A and B). This indicates that R-loops predominantly form downstream of the transcription start site in this subset of promoter regions. Promoter activity was calculated as the mean number of sense-strand GRO-seq reads measured in the region between the transcription start site and + 1000 bp by Hah et al., 2013. R-loop signal was defined as the triptolide-sensitive template-strand bisDRIP-seq score subtracted from the triptolide-sensitive non-template bisDRIP-seq score. In each metaplot, R-loop signal at each nucleotide position was derived using the mean bisDRIP-seq score from n = 13 control-treated samples and mean bisDRIP-seq score from n = 2 triptolide-treated samples. ‘TSS’ refers to the transcription start site.
Figure 3—figure supplement 3
The strand asymmetry of bisDRIP-seq scores 3' of the transcription start site is sensitive to RNase H.
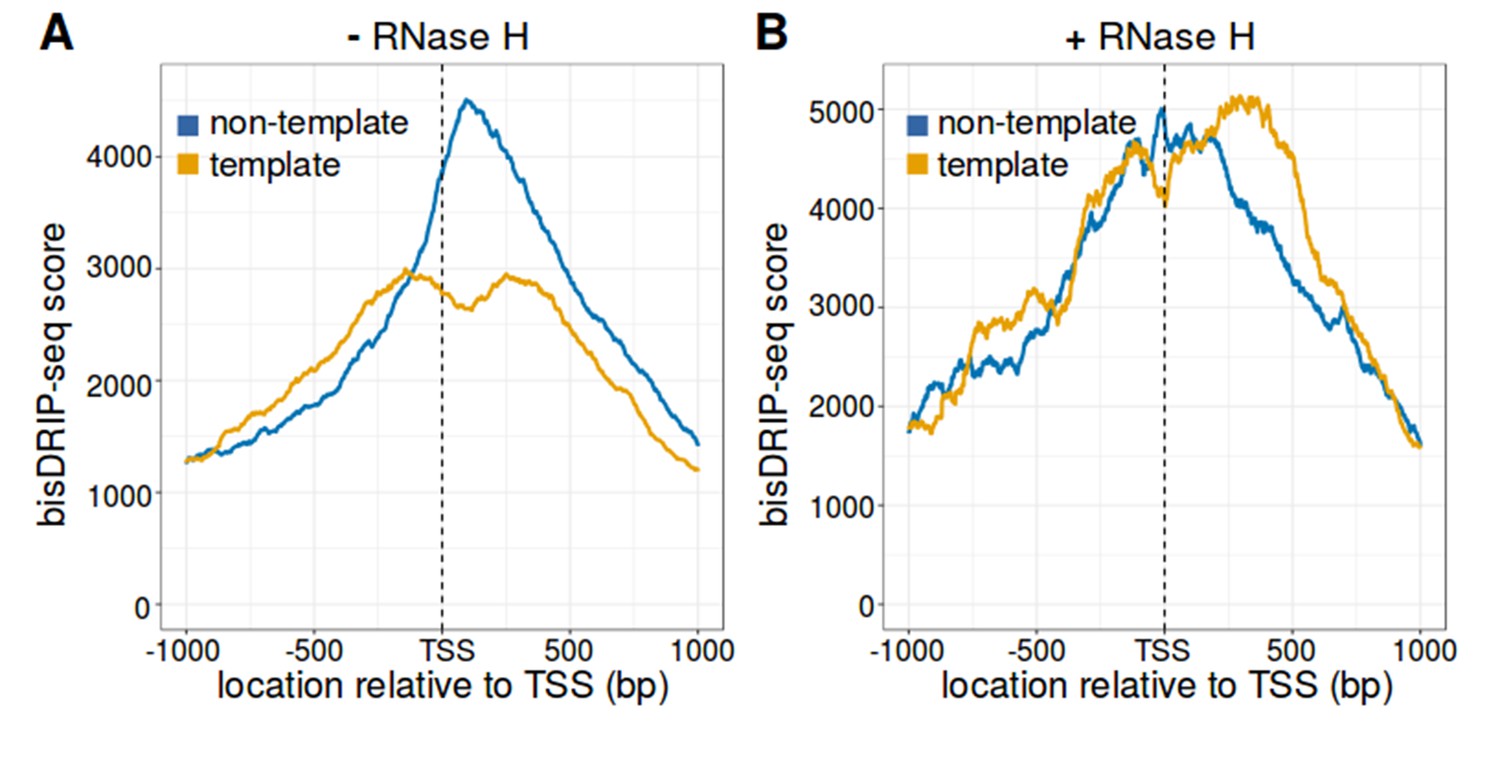
(A,B) The strand asymmetry in bisDRIP-seq scores 3' of transcription start sites is not observed after RNase H treatment. RNA-DNA hybrids are core components of R-loops. If the strand asymmetry observed in metaplots of promoter regions is due to R-loops, than it should be selectively sensitive to RNase H. We therefore generated metaplots of bisDRIP-seq scores from two samples treated identically except that (A) received a vehicle treatment, while (B) was treated with RNase H. Metaplots were created by summing the bisDRIP-seq scores across active promoter regions (n = 15644) at each nucleotide position relative to the transcription start site. bisDRIP-seq scores were calculated separately for the nucleotide position on the non-template strand (blue) and template strand (orange). In the vehicle-treated sample, non-template bisDRIP-seq scores are higher than template bisDRIP-seq scores immediately 3' of the transcription start site. This replicates the result from Figure 3E. On the other hand, there is a complete loss of bisDRIP-seq score strand asymmetry after RNase H treatment in (B). This confirms that the asymmetry observed in Figure 3E is caused by R-loops.
Figure 3—figure supplement 4

Antisense-strand R-loops were observed in promoter regions with high antisense-promoter activity.
(A) Antisense-strand R-loop formation correlates with antisense promoter activity. In Figure 3D, there was evidence of antisense-strand R-loops upstream of the transcription start site. Since sense-strand R-loops were observed in promoter regions with high sense-promoter activity, we asked if antisense-strand R-loops form in promoter regions with high antisense-promoter activity. Antisense-strand R-loops can be identified by bisDRIP-seq based on preferential labeling of the template strand for canonical transcription. Therefore, we compared the bisDRIP-seq scores on the non-template strand to the scores on the template strand and determined whether this correlated with antisense promoter activity. Here, template strand refers to the template for transcription of the canonical gene rather than the antisense transcript. Antisense promoter activity and bisDRIP-seq scores were assessed in the region between −1000 bp and the transcription start site. bisDRIP-seq scores were assessed separately for the non-template (blue) and template (orange) strands. For each strand, a LOESS smoothed curve was plotted of the bisDRIP-seq scores (y-axis) at different levels of antisense promoter activity (x-axis). This was repeated for control-treated samples (solid, mean bisDRIP-seq score from n = 13 samples) and samples treated with the transcription-inhibitor triptolide (dashed, mean bisDRIP-seq score from n = 2 samples). bisDRIP-seq scores on both strands are correlated with promoter activity. Notably, with increasing antisense promoter activity, the template strand is preferentially labeled. This suggests that antisense-strand R-loops form in these promoters. Antisense promoter activity was assessed using a MCF-7 GRO-seq dataset from Hah et al., 2013. Both antisense promoter activity and bisDRIP-seq scores were plotted on log2-transformed axes. ‘TSS’ refers to the transcription start site. (B) Transcription-dependent antisense-strand R-loops form in promoters with high antisense promoter activity. The presence of antisense-strand R-loops is suggested by negative bisDRIP-seq strand asymmetry as illustrated in Figure 3—figure supplement 4C. For this plot, strand asymmetry was calculated as the log2-fold ratio of the bisDRIP-seq score of the non-template strand relative to the bisDRIP-seq score of the template strand (y-axis). Here, template strand refers to the template for transcription of the canonical gene rather than the antisense transcript. The distribution of promoter regions' strand asymmetry was plotted in separate violin plots for promoter regions with high antisense promoter activity (right, GRO-seq > 24 reads, n = 3020 promoter regions), as well as an equivalent number of promoter regions with no antisense activity (left, GRO-seq = 0 reads, n = 3020 promoter regions). This was repeated for control-treated samples (green, mean bisDRIP-seq score from n = 13 samples) and triptolide-treated samples (pink, mean bisDRIP-seq score from n = 2 samples). Promoter regions with high antisense promoter activity typically had higher template bisDRIP-seq scores than non-template-strand bisDRIP-seq scores in control-treated samples. This negative strand asymmetry was significantly reduced in triptolide-treated samples. These results suggest that there were transcription-dependent antisense-strand R-loops in promoter regions with high antisense promoter activity. Antisense promoter activity and bisDRIP-seq scores were assessed in the region between −1000 bp and the transcription start site. Antisense-promoter activity was determined using a GRO-seq dataset from Hah et al., 2013. The width of violin plots represented the fraction of promoter regions with a given strand asymmetry. Individual lines within violin plots represented quartiles. ***p<2.2×10⁻¹⁶, Wilcoxon signed-rank test. (C) Simple model of the antisense-strand R-loops putatively observed in Figure 3A – Figure 2A and B. As illustrated, antisense-strand R-loops logically explain the strand ‘negative’ asymmetry observed in bisDRIP-seq scores. In particular, these antisense-strand R-loops contain single-stranded DNA on the template-strand, which should lead to preferential bisulfite labeling of this strand. In this model, template strand refers to the template for transcription of the canonical gene rather than the antisense transcript. The vertical black hash marks between nucleic acid strands indicate that two strands are hybridized. ‘asTSS’ refers to transcription start sites for antisense transcription. (D) Metaplot of R-loop signal in promoter regions with either high or low antisense-promoter activity. A metaplot of R-loop signal was plotted for promoter regions in the top ten percentile of antisense-promoter activity (blue, n = 7822) and for promoter regions in the bottom ten percentile of antisense-promoter activity (purple, n = 7822). Antisense-promoter activity was defined here as the number of GRO-seq antisense-strand reads measured by Hah et al., 2013 in the region between −250 bp and the transcription start site. There is no clear negative R-loop signal observed in promoter regions with low antisense-promoter activity. By contrast, promoter regions with high antisense-promoter activity have a peak of negative R-loop signal 5' of the transcription start site. This negative R-loop signal suggests that antisense-strand R-loops form in this region. R-loop signal was defined as the triptolide-sensitive template-strand bisDRIP-seq score subtracted from the triptolide-sensitive non-template bisDRIP-seq score. In this plot, template strand refers to the template for transcription of the canonical gene rather than the antisense transcript. R-loop signal at each nucleotide position was derived using the mean bisDRIP-seq score from n = 13 control-treated samples and mean bisDRIP-seq score from n = 2 triptolide-treated samples.
Figure 4 with 1 supplement
The first exon-intron junction appears to act as a 3' boundary to R-loops.
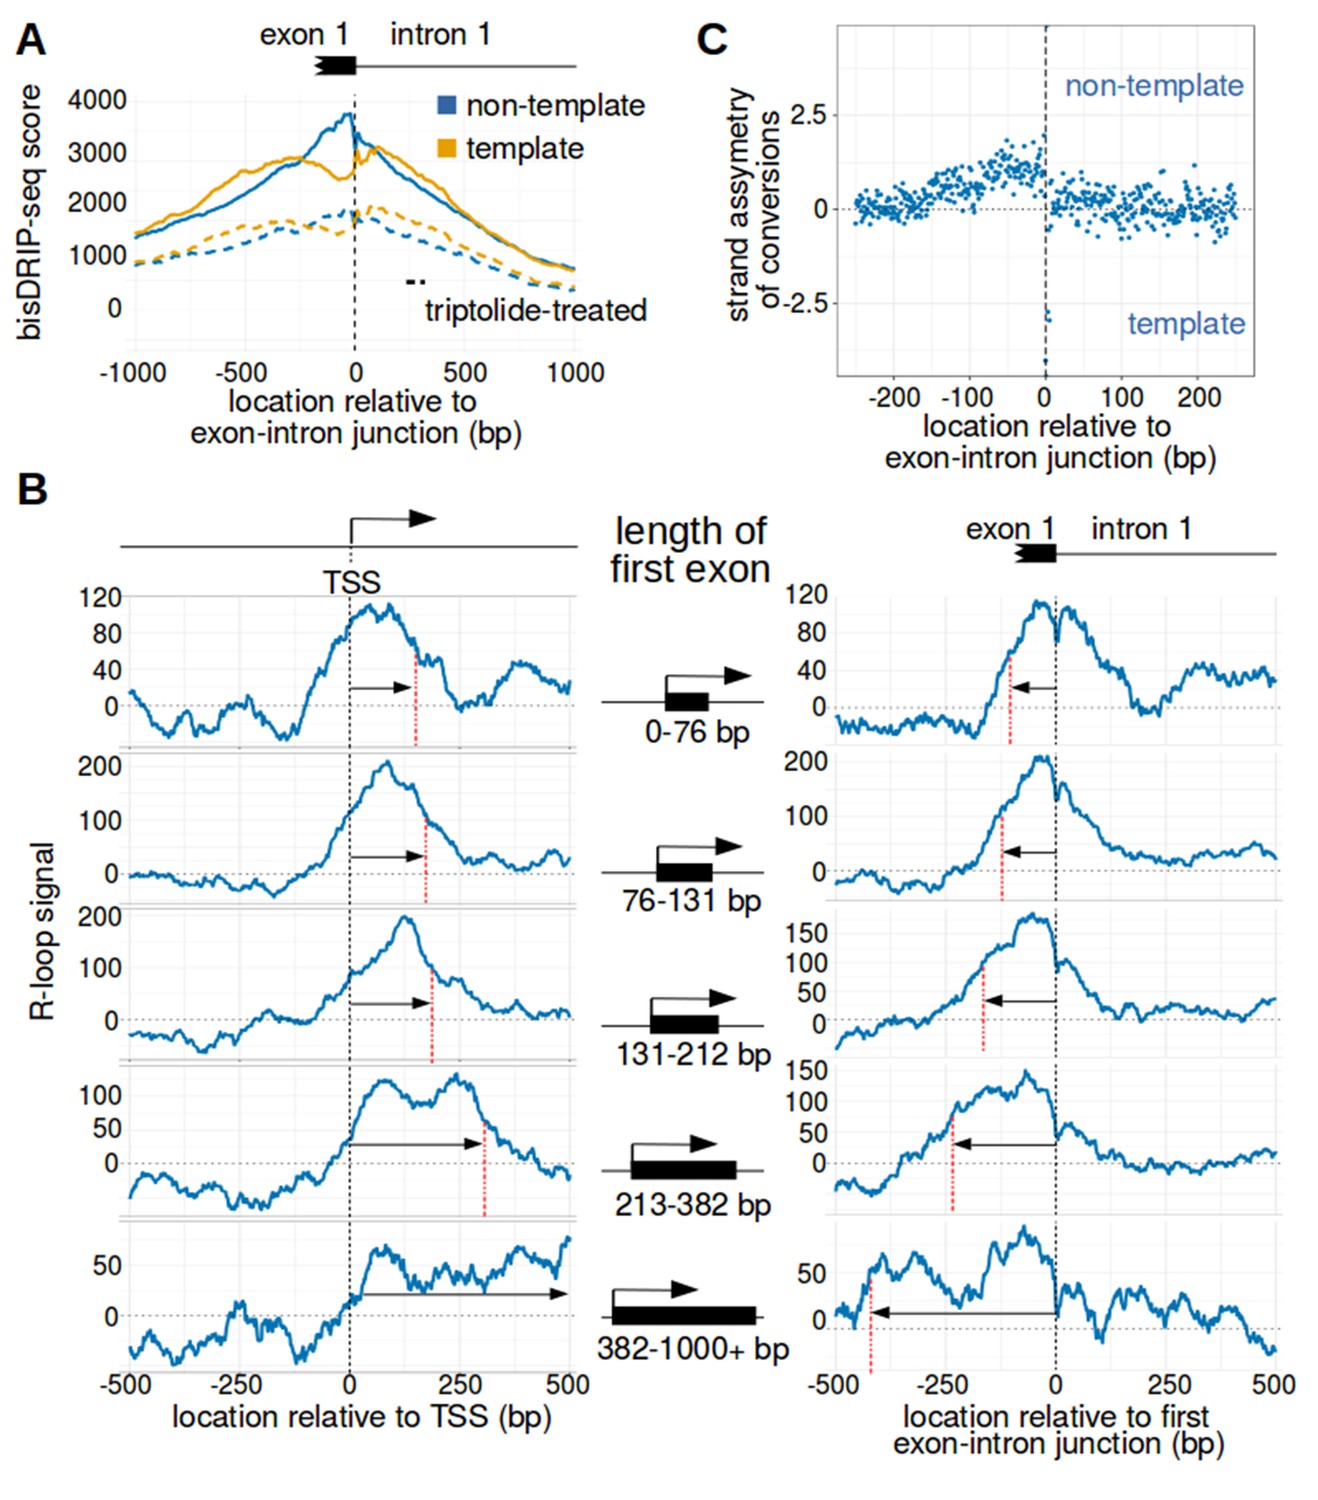
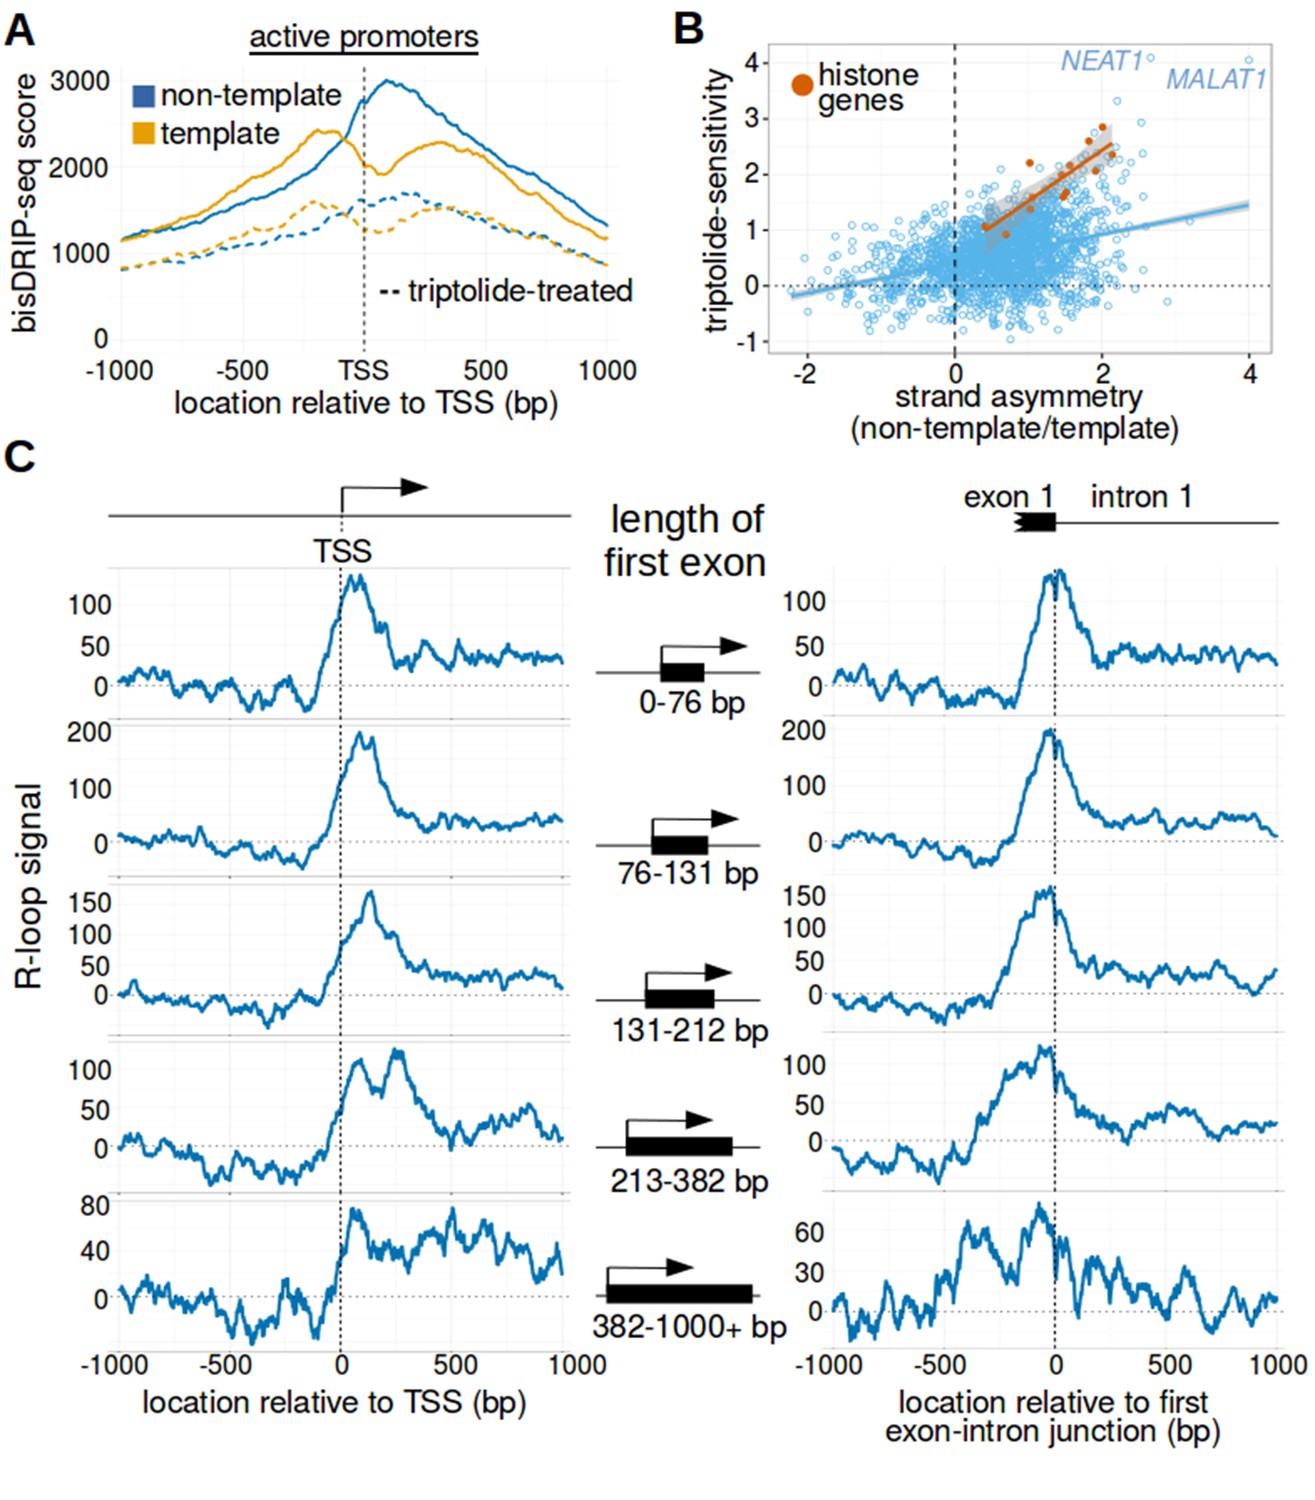
(A) Strand asymmetry in bisDRIP-seq scores ends at the first exon-intron junction. To determine where R-loops are located relative to the first exon-intron junction, a metaplot of bisDRIP-seq scores was generated relative to the first exon-intron junction. bisDRIP-seq scores were calculated for control-treated samples (solid, mean bisDRIP-seq score from n = 13 samples) and triptolide-treated samples (dashed, mean bisDRIP-seq score from n = 2 samples). These mean bisDRIP-seq scores were then summed at each position relative to the first exon-intron junction for all intron-containing gene promoter regions (n = 14538). These values were plotted separately for the template strand (orange) and for the non-template strand (blue). Immediately 5' of the exon-intron junction, the non-template bisDRIP-seq scores were greater than the template bisDRIP-seq scores in control-treated samples. This difference in bisDRIP-seq scores between the two strands was eliminated almost immediately 3' of the exon-intron junction. This suggests that the first exon-intron junction acted as a 3' boundary to promoter-associated R-loops. (B) R-loop-forming regions expand further from both the transcription start site and the exon-intron junction in promoter regions with larger first exons. To test if the first exon-intron junction was acting as a boundary to R-loops, we created metaplots of R-loop signal in bins of promoter regions with different first-exon sizes. Promoter regions were binned into five groups based on the size of their first exon (n = 2907 or 2908 per bin). On the left side of the panel, metaplots of R-loop signal (blue) centered on the transcription start site were plotted for each bin of promoter regions. A vertical, dashed line (red) indicates the 3’-most location where R-loop signal was at half of the maximum signal in the metaplot. The arrow pointing to the dashed line indicates the distance from the line to the transcription start site. In the middle of the panel are schematics indicating the range of first-exon sizes observed in the bin of promoter regions that is examined in the adjacent metaplots. As illustrated, the smallest first exons are examined in the bin displayed in the top row and each subsequent row examines a bin containing larger first exons. On the right side of the panel, metaplots of R-loop signal (blue) centered on the first exon-intron junction were plotted for each bin of promoter regions. A vertical, dashed line (red) indicates the 5'-most location where R-loop signal was at half of the maximum signal in the metaplot. The arrow pointing to the dashed line indicates the distance from the line to the transcription start site. In metaplots representing genes with longer first exons, R-loop signal extended further 3' from the transcription start site and further 5' of the first exon-intron junction. These results suggest that R-loops were typically bounded between the transcription start site and the first exon-intron junction. ‘TSS’ refers to the transcription start site. In each case, R-loop signal at each nucleotide position was derived using the mean bisDRIP-seq score from n = 13 control-treated samples and mean bisDRIP-seq score from n = 2 triptolide-treated samples. (C) The 3' boundary of promoter-associated R-loops is within a few base pairs of the first exon-intron junction. To determine, at near-nucleotide resolution, the 3' R-loop boundary relative to the first exon-intron junction, we generated a metaplot of bisDRIP-seq-conversion asymmetry. To generate this metaplot, the total number of conversions was summed at each position relative to the first exon-intron junction for all intron-containing gene promoter regions (n = 14538). This was performed separately for each strand of the control-treated sample (mean of n = 13 samples) and then these values were background-corrected by subtracting the same values from the triptolide-treated samples (mean of n = 2 samples). Finally, the strand asymmetry of conversions was calculated as the log ratio of the number of conversions on the non-template strand relative to the template strand. This strand asymmetry of conversions (y-axis) was plotted for each position relative to the exon-intron junction (x-axis). In this metaplot, there is asymmetry in the strand orientation of conversions immediately 5' of the exon-intron junction, with more conversions on the non-template strand. However, within a few base pairs 3' of the exon-intron junction, conversions appear to be equally distributed on both the template and non-template strand. The consensus splice site confounds this analysis to some extent at the exact splice site. Nevertheless, this analysis suggests that the 3' R-loop boundary is located within base pairs of the first exon-intron junction. See Figure 4—source data 1 for source data regarding the set of exon-intron junctions studied in Figure 4A and B.
-
Figure 4—source data 1
Location of exon-intron junctions analyzed in Figure 4.
- https://doi.org/10.7554/eLife.28306.017
Figure 4—figure supplement 1
The first exon-intron junction is the only intron-exon junction that is observed to act as a boundary for R-loop formation.
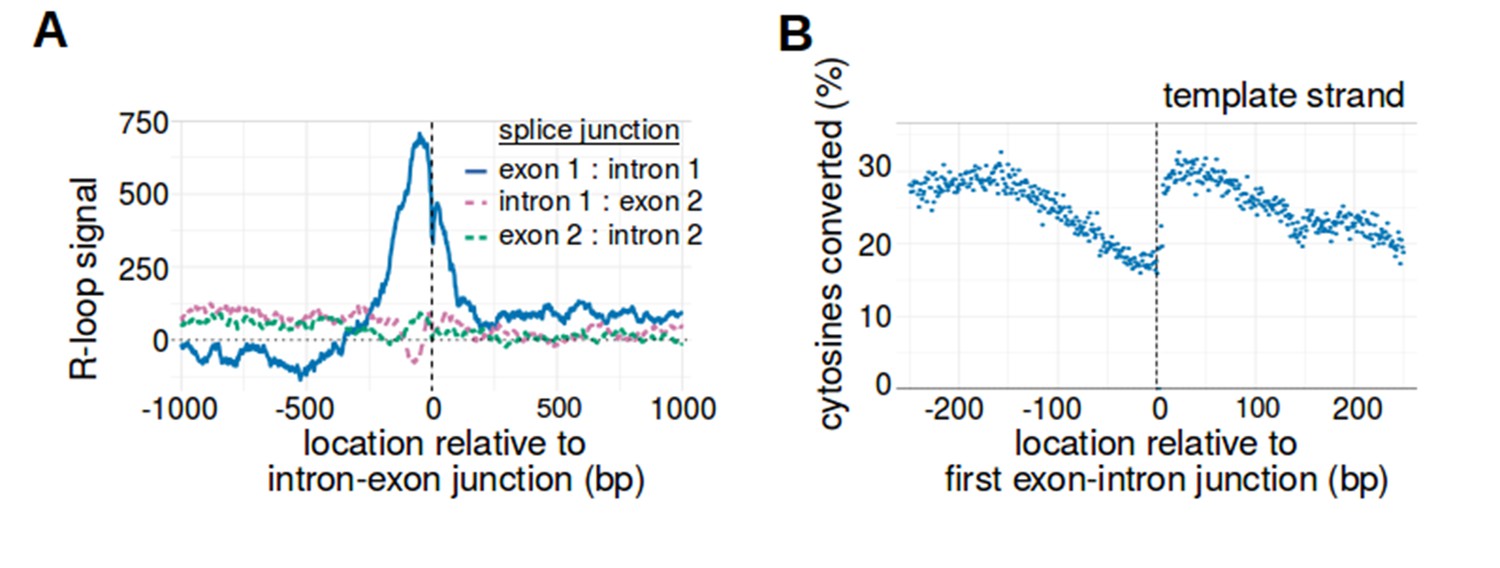
(A) Only the first exon-intron junction acts as an R-loop boundary. To determine whether other splice junctions act as R-loop boundaries, we created metaplots of R-loop signal centered on the first three splice junctions. Metaplot were generated relative to the junction between the first exon and first intron (blue, n = 14538), the junction between the first intron and second exon (purple, n = 14538), and the junction between the second exon and second intron (green, n = 12100). While there is a positive R-loop signal peak immediately 5' of the first exon-intron junction, there was no similar peak observed for the other two splice junctions. In each metaplot, R-loop signal at each nucleotide position was derived using the mean bisDRIP-seq score from n = 13 control-treated samples and mean bisDRIP-seq score from n = 2 triptolide-treated samples. (B) The strand asymmetry of bisulfite conversions 5' of the exon-intron junction is due to a reduction in the percentage of template-strand cytosines that are converted. In our model of R-loop formation, we expect R-loops to cause strand asymmetry because the RNA binds the template strand and prevents it from reacting with bisulfite. To determine if this explains the conversion asymmetry 5' of the exon-intron junction, we generated a metaplot of the percentage of template-strand cytosines that were converted by bisulfite. At each position relative to the first exon-intron junctions of active promoter regions (n = 14538), we plotted the percentage of cytosines that were converted relative to the number of reads aligned to that site (blue). As expected, there is a reduction in the percentage of converted cytosines 5' of the first exon-intron junction. This mirrors the decrease in template-strand bisDRIP-seq scores 5' of the transcription start site and likely explains that decrease in template-bisDRIP-seq scores. N = 13 bisDRIP-seq samples.
Figure 5 with 3 supplements
Replication-dependent histone genes frequently form R-loops.
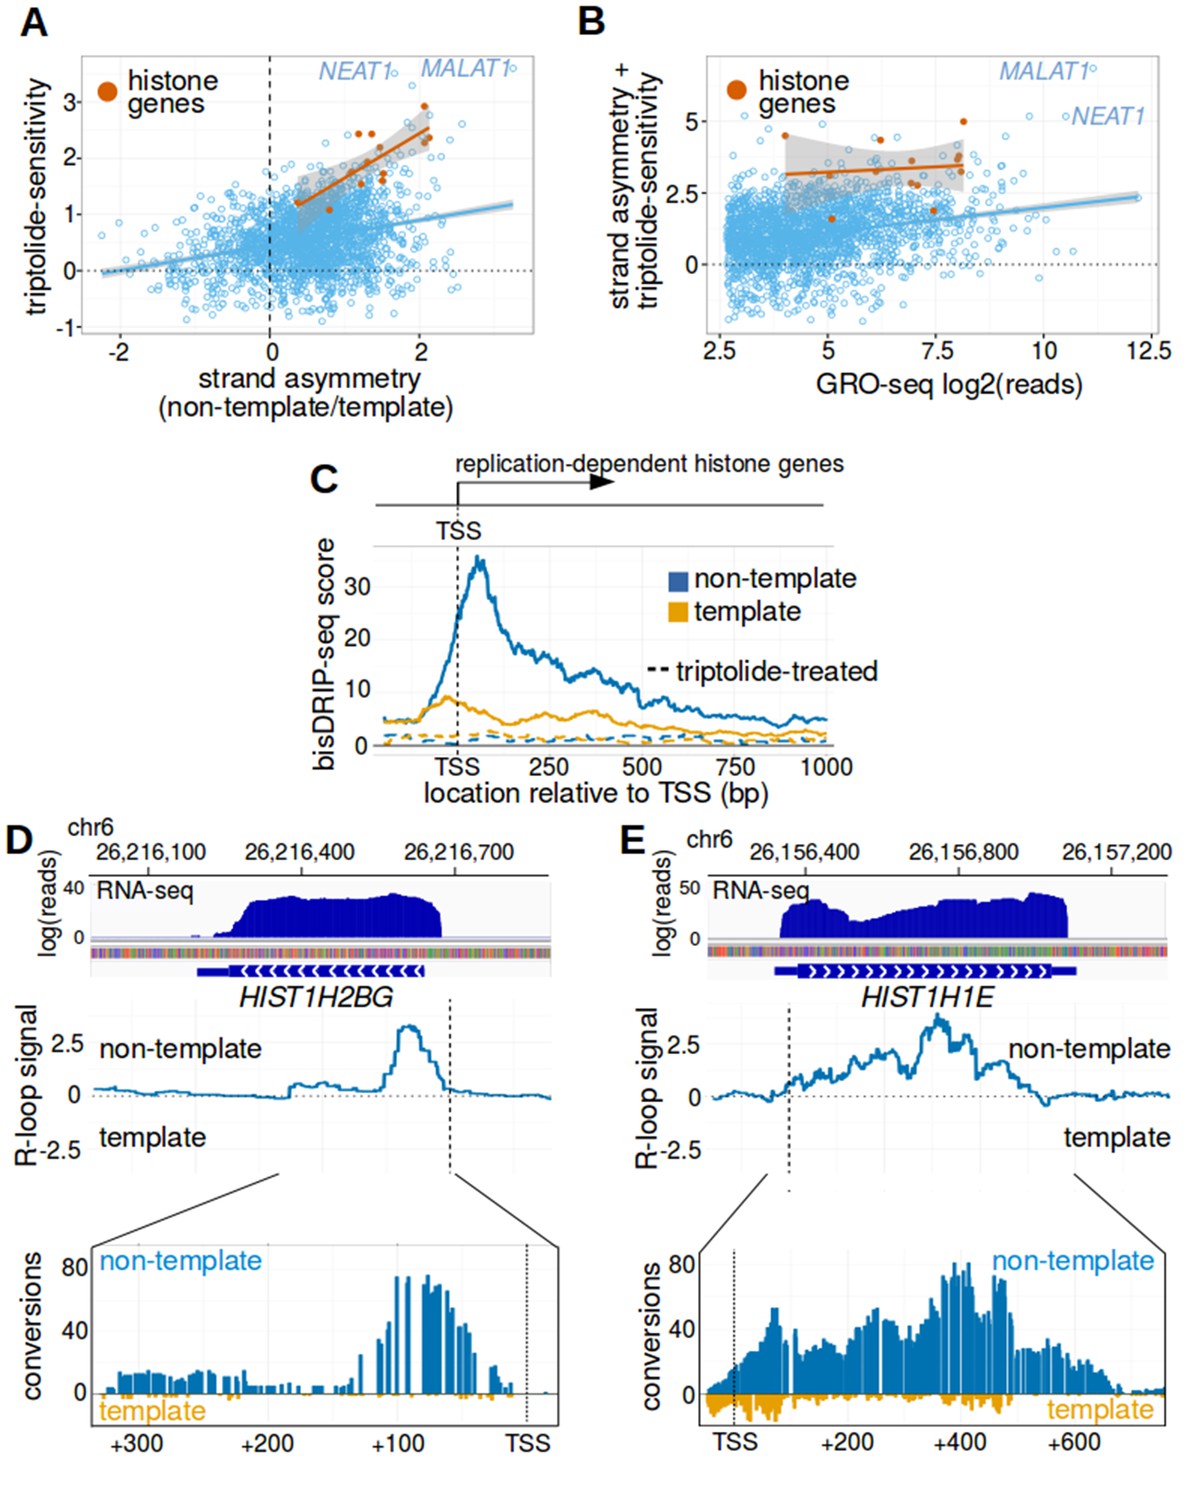
(A) Genes that are strongly associated with promoter-associated R-loops were identified using two criteria. First, transcription-dependent R-loop formation was identified based on the triptolide-sensitivity of the promoter region bisDRIP-seq score (x-axis). Second, R-loop formation was identified by the strand asymmetry of the promoter region bisDRIP-seq score (y-axis). Promoter regions for all genes except those encoding replication-dependent histones (n = 2064, blue) were plotted on these two axes alongside a linear regression model (blue line). Promoter regions for replication-dependent histones (n = 13, orange) were plotted alongside a separate linear regression model (orange line). In the resulting plot, there appears to be a group of genes with relatively high scores on both axes. This suggests that these genes are strongly associated with transcription-dependent R-loops formation. This set of genes included the replication-dependent histones genes and the indicated lncRNA genes MALAT1 and NEAT1. In this plot, all bisDRIP-seq score measurements were made in the region between the transcription start site and + 250 bp. Triptolide-sensitivity was calculated as the non-template bisDRIP-seq score in triptolide treated-samples (mean bisDRIP-seq score from n = 2 samples) subtracted from the non-template bisDRIP-seq score from control-treated samples (mean bisDRIP-seq score from n = 13 samples). Strand asymmetry was calculated as the log2 ratio of the non-template bisDRIP-seq score to the template bisDRIP-seq score in control-treated samples (mean bisDRIP-seq score from n = 13 samples). The shaded areas around both linear regression models represent 95% confidence intervals. (B) Promoter activity does not explain the association between histone genes and R-loop formation. R-loop formation was calculated for each promoter region by taking the sum of the x-axis and y-axis values from Figure 5A. R-loop formation was then plotted against promoter activity for each promoter region. Promoter regions for non-histone genes (n = 2064, blue) were plotted alongside a linear regression model (blue) for these genes. Promoter regions for replication-dependent histone genes (n = 13, orange) were plotted alongside a separate linear regression model (orange). Promoter activity was correlated with R-loop formation. Nonetheless, all of the examined replication-dependent histone genes have higher R-loop formation scores than most of the genes with similar promoter activity. Promoter activity (x-axis) was calculated between the transcription start site and +250 bp using the GRO-seq dataset from Hah et al., 2013. R-loop formation was calculated as the sum of bisDRIP-seq score strand asymmetry and triptolide-sensitivity. These values were derived from the mean bisDRIP-seq scores of n = 13 control-treated samples and mean bisDRIP-seq scores of n = 2 triptolide-treated samples. The shaded areas around both linear regression models represent 95% confidence intervals. (C) R-loops are prevalent in the promoter regions of replication-dependent histone genes. The location of R-loops in the promoter regions of replication-dependent histone genes was examined using metaplot analysis. A metaplot was generated of bisDRIP-seq scores relative to the transcription start sites of all replication-dependent histone genes (n = 69). bisDRIP-seq scores were plotted separately for the template (orange) and non-template (blue) strands. This was repeated for control-treated samples (solid, mean bisDRIP-seq score from n = 13 samples) and triptolide-treated samples (dashed, mean bisDRIP-seq score from n = 2 samples). The bisDRIP-seq scores on the non-template strand were higher than the scores on the template strand throughout the promoter region 3' of the transcription start site. Additionally, almost no signal was observed in the triptolide-treated samples. These results suggest that R-loops are the predominant structure observed by bisDRIP-seq in the promoter regions of this class of genes. ‘TSS’ indicates the location of the transcription start site. (D,E) Gene-specific heterogeneity in the 3' R-loop boundaries of histone genes. To examine whether promoter-associated R-loops have 3' boundaries in intronless genes, R-loop signal was examined in select histone genes. The observed heterogeneity in 3' R-loop boundaries is represented by (E) HIST1H2BG and (F) HIST1H1E. At the top of each panel are the gene loci and the sense-strand RNA-seq reads that map to the loci containing either gene. In the middle of each panel is the R-loop signal (y-axis) plotted across the genomic loci containing each gene (blue line). In the lower plot, cytosine-to-uracil conversions were mapped to the genomic loci containing each gene. The number of conversions on the template strand and non-template strand were plotted below the x-axis (orange) or above the x-axis (blue), respectively. Shown are the total number of conversions observed in all bisDRIP-seq samples (n = 13). The sharp drop in R-loop signal near the start of the HIST1H2BG gene contrasts with the relatively stable R-loop signal observed in HIST1H1E. Transcription start sites are indicated by both ‘TSS’ and by dashed vertical lines. R-loop signal at each nucleotide position was derived using the mean bisDRIP-seq score from n = 13 control-treated samples and mean bisDRIP-seq score from n = 2 triptolide-treated samples. See Figure 5—source data 1 for source data for Figure 5A and B.
-
Figure 5—source data 1
R-loop scoring of promoters studied in Figure 5A, B.
- https://doi.org/10.7554/eLife.28306.022
Figure 5—figure supplement 1
Histone genes are enriched in R-loops.
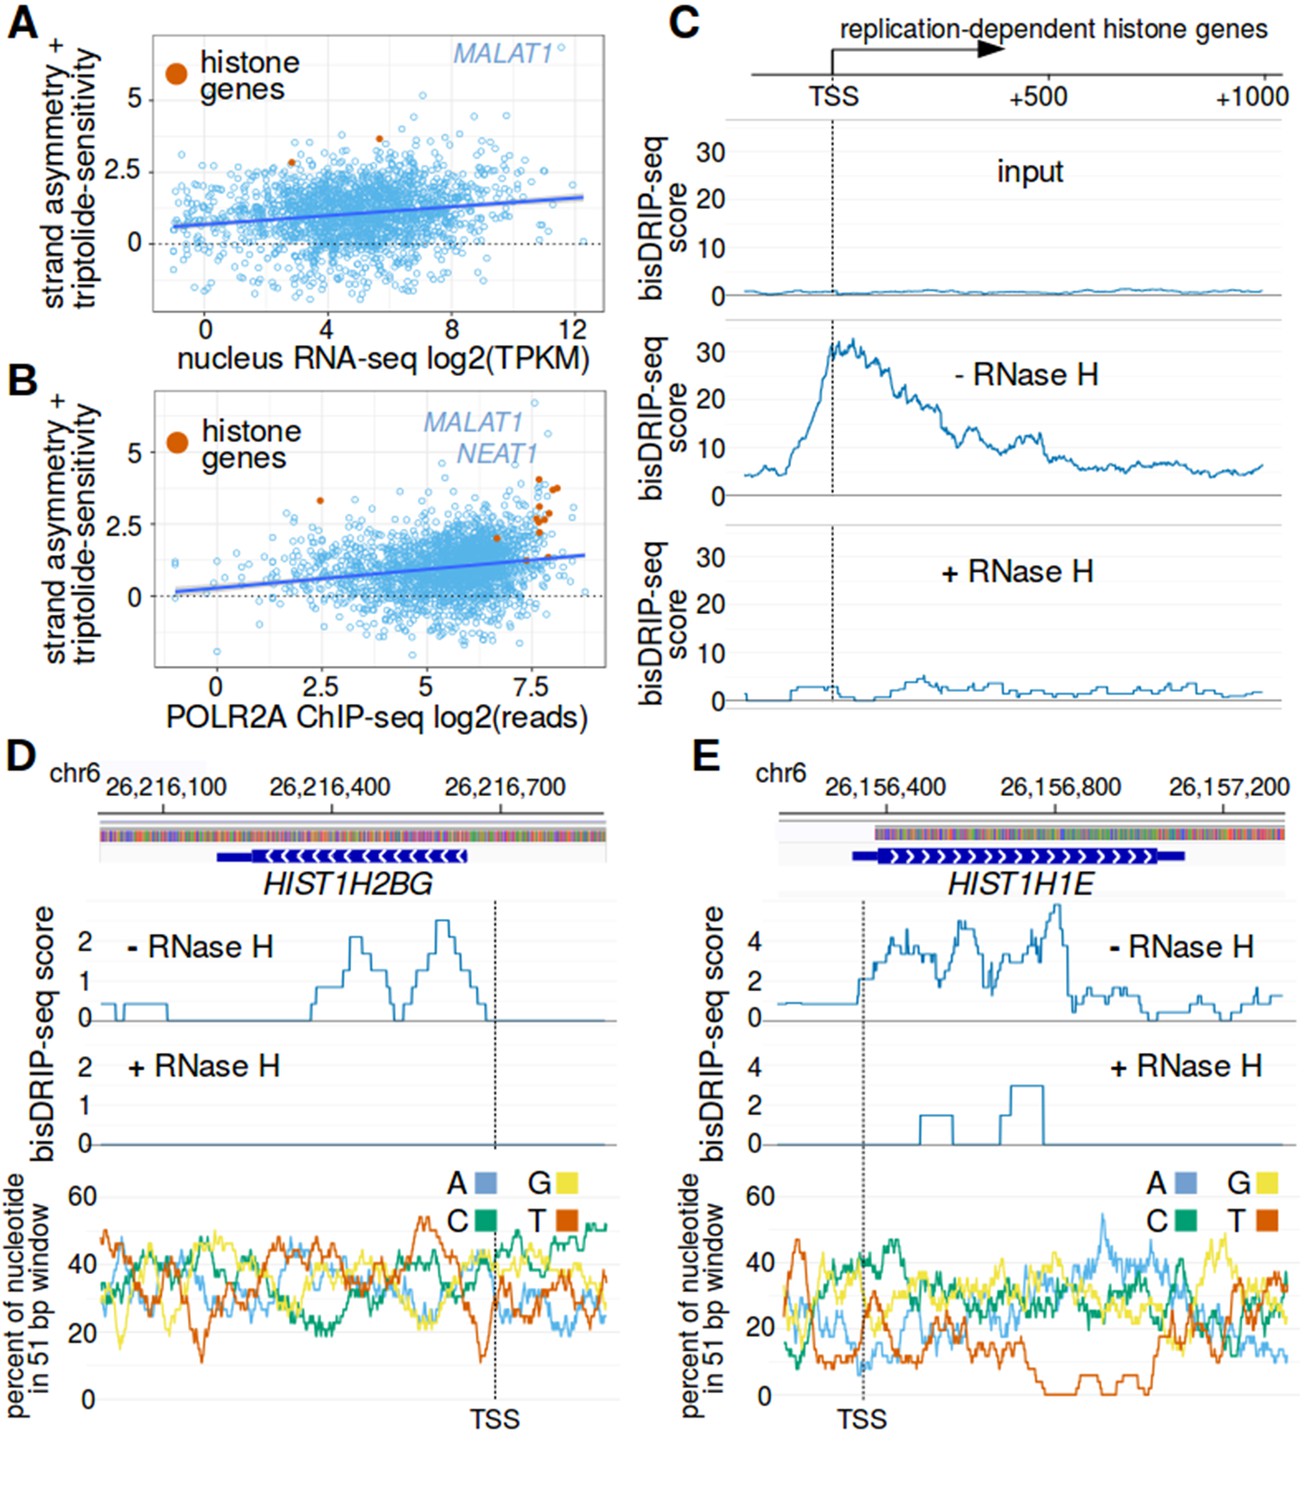
(A,B) RNA polymerase II binding and RNA levels in the nucleus do not appear to explain the association between histone genes and R-loop formation. R-loop formation was calculated for each promoter region by taking the sum of bisDRIP-seq score strand asymmetry and the triptolide-sensitivity the non-template bisDRIP-seq scores. R-loop formation was then plotted against (A) nuclear RNA levels or (B) POLR2A (RNA polymerase II) chromatin immunoprecipitation (ChIP) signal for each promoter region. Promoter regions were plotted separately for non-histone genes (blue) and replication-dependent histone genes (orange). A linear regression for all genes was also plotted (blue). Both nuclear RNA levels and RNA polymerase II ChIP signal were weakly correlated with R-loop formation. Nevertheless, replication-dependent histone genes typically had higher R-loop formation scores than genes with similar promoter activity. This suggests that the nuclear RNA level of histones mRNAs in do not explain the high R-loop signal of these genes. It also suggests that the level of RNA polymerase II bound to histone genes does not explain the high R-loop signal observed at these genes. The bisDRIP-seq values in both plots were derived from the mean bisDRIP-seq scores of n = 13 control-treated samples and mean bisDRIP-seq scores of n = 2 triptolide-treated samples. In (A), we examined n = 1813 non-histone genes and n = 2 histone genes. In (B), we examined n = 2064 non-histone genes and n = 13 histone genes. TPKM refers to transcripts per kilobase million. The shaded areas around linear regression models represent 95% confidence intervals. (C) RNase H sensitivity of the bisDRIP-seq signal in histone genes. Metaplots were generated of histone gene non-template bisDRIP-seq score from three different bisDRIP-seq experiments. In the top plot, bisDRIP-seq scores were derived from ‘input’ samples (mean bisDRIP-seq score from n = 2 samples). These input samples received the entire bisDRIP-seq treatment except for the S9.6 immunoprecipitation enrichment steps. In the middle plot, bisDRIP-seq scores were derived from a bisDRIP-seq experiment that did not include an RNase H treatment (n = 1 sample). In the bottom plot, bisDRIP-seq scores were derived from an RNase H-treated bisDRIP-seq experiment (n = 1 sample). The bisDRIP-seq sample that was not treated with RNase H replicated the high non-template bisDRIP-seq scores observed in other bisDRIP-seq experiments at histone loci. On the other hand, almost no bisDRIP-seq signal was observed in either the input samples or in the bisDRIP-seq sample treated with RNase H. This suggests that the bisDRIP-seq signal observed at these gene loci is caused by R-loops. Transcription start sites are indicated by both ‘TSS’ and by dashed vertical lines. (D,E) bisDRIP-seq enrichment at (D) HIST1H2BG and (E) HIST1H1E is due to the presence of R-loops. In the middle and top plots, we compare the bisDRIP-seq from an RNase H treated sample (n = 1) and a bisDRIP-seq sample that was not treated with RNase H (n = 1), respectively. In both the middle and top plot, bisDRIP-seq scores from each experiment were mapped to the genomic region surrounding (D) HIST1H2BG and (E) HIST1H1E. At both loci, the bisDRIP-seq sample that was not treated with RNase H had similar bisDRIP-seq signal to our other bisDRIP-seq control experiments (Figure 5D and E). On the other hand, there is a clear reduction in bisDRIP-seq scores in the RNase H-treated sample. This decrease in signal after RNase H treatment suggests that RNA-DNA hybrids do form at these loci. In the bottom panel, the percentage of each nucleotide is plotted in 51 bp windows. There is no obvious relationship between nucleotide composition and bisDRIP-seq scores throughout these two genes.
Figure 5—figure supplement 2

R-loop boundaries in a subset of replication-dependent histone genes.
R-loop formation was examined individually in nine replication-dependent histone genes. These genes were identified in Figure 5A as being strongly associated with promoter-associated R-loop structure. Since replication-dependent histone genes lack exon-intron junctions, it was not clear where the 3' boundaries would be located in these genes. Metaplots of R-loop signal (blue) were plotted across each gene and the immediate adjacent genomic region. For each gene, a gene model is displayed above the metaplot. The transcription start site from our GENCODE reference list is indicated by a vertical dashed line. Metaplots were created for (A) HIST1H2BG, (B) HIST1H2BC, (C) HIST1H2BK, (D) HIST4H4, (E) HIST1H2BD, (F) HIST1H1D, (G) HIST1H1E, (H) HIST1H1C and (I) HIST1H1B. Some genes have sharp drops in R-loops signal in the first third of the gene body, while others appear to have positive R-loop signal throughout the gene body. This suggests that at least some intronless genes contain 3' R-loop boundaries despite the lack of intron-exon junctions in these genes. In each plot, the location of the transcription start site is demarcated by ‘TSS’ and a dashed vertical line. R-loop signal was defined as the triptolide-sensitive template-strand bisDRIP-seq score subtracted from the triptolide-sensitive non-template bisDRIP-seq score. R-loop signal at each nucleotide position was derived using the mean bisDRIP-seq score from n = 13 control-treated samples and mean bisDRIP-seq score from n = 2 triptolide-treated samples.
Figure 5—figure supplement 3
Conclusions of bisDRIP-seq results are not altered by normalizing bisDRIP-seq scores to account for the number of cytosines per read.
To ensure that our bioinformatic approach was not biased by the number of cytosines in individual reads, we repeated our analysis after performing ‘cytosine normalization.’ Cytosine normalization involved multiplying all reads by a variable specific for all reads with the same original number of cytosines. The variable was chosen to ensure that, for all x and y, the average score for reads with x original number of cytosines became equal to the average score for reads with y original number of cytosines. Using this approach, we repeated our analysis. (A) Figure 3E was reproduced using cytosine-normalized bisDRIP-seq scores. A metaplot of bisDRIP-seq scores was created for the non-template strand (blue) and template strand (orange) across only active promoter regions (n = 15644). bisDRIP-seq scores were plotted on separate lines for control-treated samples (solid, mean bisDRIP-seq score from n = 13 samples) and triptolide-treated samples (dashed, mean bisDRIP-seq score from n = 2 samples). As observed in Figure 3E, bisDRIP-seq scores were greater on the non-template strand than on the template strand immediately 3' of the transcription start site. In this plot, active promoters refers to promoters with promoter activity in the top twenty percentile as calculated using the GRO-seq dataset from Hah et al., 2013. ‘TSS’ refers to the transcription start site. (B) Figure 5A was reproduced using cytosine-normalized bisDRIP-seq scores. Genes with transcription-dependent promoter-associated R-loop formation were identified by two criteria. First, transcription-dependent R-loop formation was identified based on the triptolide-sensitivity of the promoter region bisDRIP-seq score (x-axis). Second, R-loop formation was identified by the strand asymmetry of the promoter region bisDRIP-seq score (y-axis). Promoter regions for all genes except those encoding replication-dependent histones (n = 2064, blue) were plotted on these two axes alongside a linear regression model (blue line). Promoter regions for replication-dependent histones (n = 13, orange) were plotted alongside a separate linear regression model (orange line). As observed in Figure 5A, there appears to be a group of genes with relatively high scores on both axes. This set of genes includes the replication-dependent histones genes and the indicated lncRNA genes MALAT1 and NEAT1. Thus, the conclusions of Figure 5A remain unchanged when using cytosine-normalized bisDRIP-seq scores. In this plot, all bisDRIP-seq score measurements were made in the region between the transcription start site and +250 bp. Triptolide-sensitivity was calculated as the non-template bisDRIP-seq score in triptolide treated-samples (mean bisDRIP-seq score from n = 2 samples) subtracted from the non-template bisDRIP-seq score from control-treated samples (mean bisDRIP-seq score from n = 13 samples). Strand asymmetry was calculated as the log2 ratio of the non-template bisDRIP-seq score to the template bisDRIP-seq score in control-treated samples (mean bisDRIP-seq score from n = 13 samples). The shaded areas around both linear regression models represent 95% confidence intervals. (C) Figure 4B was reproduced using cytosine-normalized bisDRIP-seq scores. To test if the first exon-intron junction was acting as a boundary to R-loops, we created metaplots of R-loop signal in bins of promoter regions with different first-exon sizes. Promoter regions were binned into five groups based on the size of their first exon (n = 2907 or 2908 per bin). On the left side of the panel, metaplots of R-loop signal (blue) centered on the transcription start site were plotted for each bin of promoter regions. In the middle of the panel are schematics indicating the range of first-exon sizes observed in the bin of promoter regions that is examined in the adjacent metaplots. As illustrated, the smallest first exons are examined in the bin displayed in the top row and each subsequent row examines a bin of promoter regions containing larger first exons. On the right side of the panel, metaplots of R-loop signal (blue) centered on the first exon-intron junction were plotted for each bin of promoter regions. In metaplots representing genes with longer first exons, R-loop signal extended further 3' from the transcription start site and further 5' of the first exon-intron junction. As observed in Figure 4B, these results suggest that R-loops were typically bounded between the transcription start site and the first exon-intron junction. Thus, the conclusions of Figure 4B remain unchanged when using cytosine-normalized bisDRIP-seq scores. R-loop signal was defined as the triptolide-sensitive template-strand bisDRIP-seq score subtracted from the triptolide-sensitive non-template bisDRIP-seq score. In each case, R-loop signal at each nucleotide position was derived using the mean bisDRIP-seq score from n = 13 control-treated samples and mean bisDRIP-seq score from n = 2 triptolide-treated samples.
Figure 6 with 4 supplements

MALAT1 and NEAT1 contain large, bounded promoter-associated R-loops.
(A) The promoter-associated R-loop forming region in MALAT1 is large, but bounded. MALAT1 had the strongest association with R-loops in Figure 5A and it is a longer intronless gene than the previously examined replication-dependent histone genes. To determine how far the R-loop-forming region in MALAT1 extends into the gene body, the bisDRIP-seq signal at the MALAT1 locus was examined. At the top of the panel is the gene model of MALAT1 and the sense-strand RNA-seq reads that mapped to this region from an ENCODE MCF-7 RNA-seq dataset (blue, plotted on a log axis). Under the gene model of MALAT1, bisDRIP-seq scores were mapped to the genomic region containing MALAT1 (mean bisDRIP-seq score from n = 13 samples). The bisDRIP-seq score on the template strand (orange) and non-template strand (blue) were plotted separately. In the lower plot, cytosine-to-uracil conversions were mapped to the genomic region surrounding the MALAT1 R-loop forming region. The number of conversions on the template strand and non-template strand were plotted below the x-axis (orange) or above the x-axis (blue), respectively. Shown are the total number of conversions observed in all bisDRIP-seq samples (n = 13). The MALAT1 R-loop region extended from the transcription start site to a site approximately 1750 base pairs downstream of the transcription start site. The transcription start site, indicated by ‘TSS’ and a dashed vertical line, was determined based on the MCF-7 ENCODE CAGE-seq dataset ENCFF207DXM and was located at ch11:65,499,042. (B) The promoter-associated R-loop forming region in NEAT1 appears to have reduced R-loop further into the NEAT1 gene body. R-loop formation in the NEAT1 locus was examined since NEAT1 is adjacent to MALAT1 and was also strongly associated with R-loop formation. At the top of the panel is a gene model of NEAT1 and the sense-strand RNA-seq reads that mapped to this region from an ENCODE MCF-7 RNA-seq dataset (blue, plotted on a log axis). Below the gene model of NEAT1, the bisDRIP-seq scores were mapped to the genomic region containing NEAT1 (mean bisDRIP-seq score from n = 13 samples). The bisDRIP-seq score on the template strand (orange) and non-template strand (blue) were plotted separately. In the lower plot, cytosine-to-uracil conversions were mapped to the genomic region surrounding the NEAT1 R-loop forming region. The number of conversions on the template strand and non-template strand were plotted below the x-axis (orange) or above the x-axis (blue), respectively. Shown are the total number of conversions observed in all bisDRIP-seq samples (n = 13). The NEAT1 R-loop forming region extended almost 1500 base pairs from the transcription start site. However, R-loop signal showed periodicity and appeared to decrease gradually from the transcription start site to its final 3' boundary. The gene model of NEAT1 represents the 23 kb NEAT1 isoform.
Figure 6—figure supplement 1
R-loop formation in MALAT1 and NEAT1.
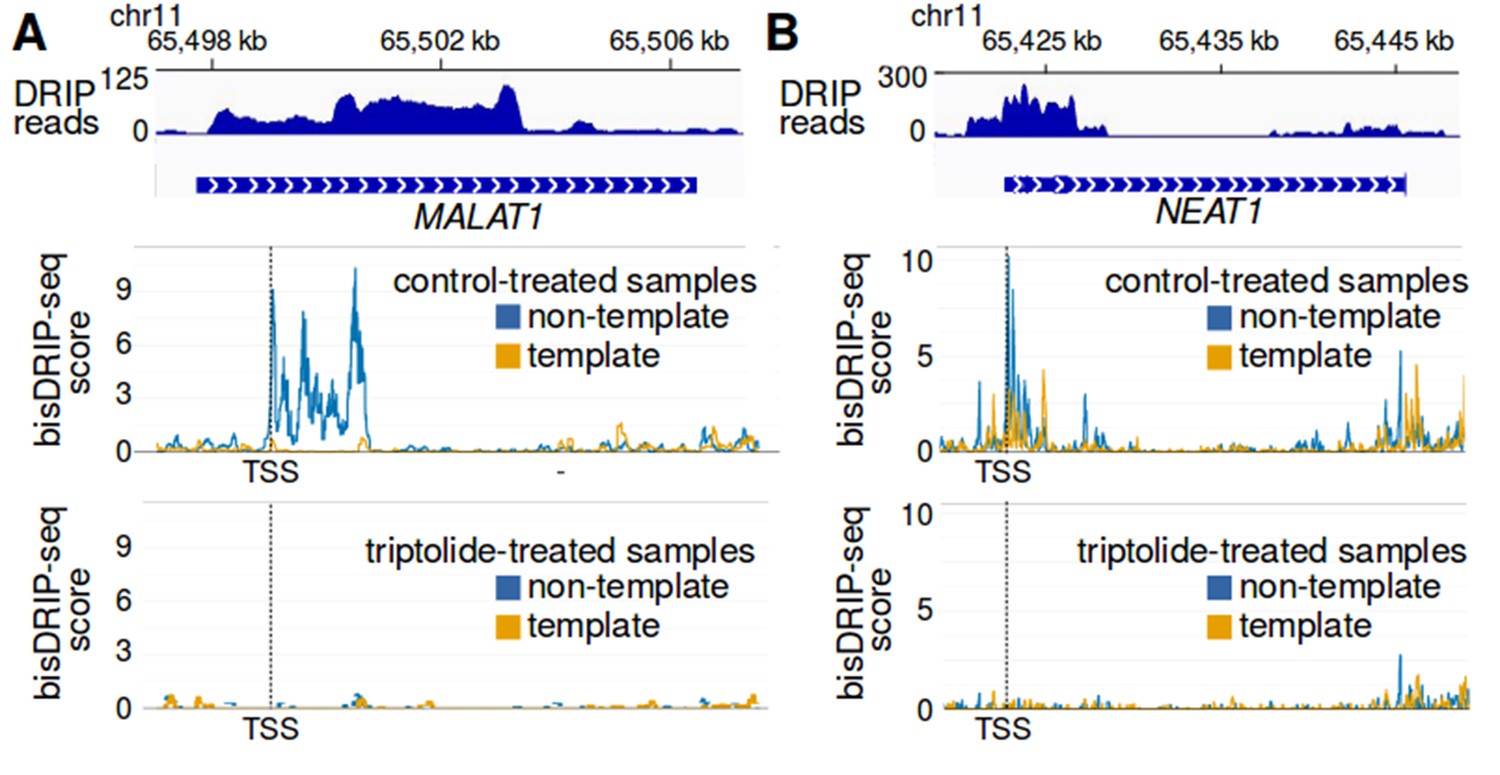
(A,B) Evidence for MALAT1 and NEAT1 R-loop formation in conventional DRIP-seq R-loop mapping. Since MALAT1 and NEAT1 were found to have strong R-loop signals using bisDRIP-seq, we asked if there was evidence of R-loops in previously published DRIP-seq datasets. At the top of each panel, DRIP-seq read counts from the Sanz et al., 2016 NT2 GSM1720616 dataset (blue) were mapped to the (A) MALAT1 and (B) NEAT1 genomic loci. Below the DRIP-seq reads are gene models for the (A) NEAT1 and (B) MALAT1 genomic loci. Under the gene models, bisDRIP-seq scores from control-treated samples were mapped to the genomic region containing (A) MALAT1 and (B) NEAT1 (mean bisDRIP-seq score from n = 13 samples). The bisDRIP-seq score on the template strand (orange) and non-template strand (blue) were plotted separately. In the lower plot, bisDRIP-seq scores from triptolide-treated samples were mapped to the genomic region containing (A) MALAT1 and (B) NEAT1 (mean bisDRIP-seq score from n = 2 samples). The locations in MALAT1 and NEAT1 that contain positive bisDRIP-seq scores also appear to have peaks of DRIP-seq reads. The R-loop peaks observed in DRIP-seq data cover a larger genomic region than the peaks in bisDRIP-seq, which is consistent with bisDRIP-seq having higher resolution than DRIP-seq. Additionally, the high bisDRIP-seq scores observed in the promoters of these genes are lost upon transcription-inhibition by triptolide. ‘TSS’ refers to the transcription start sites, also demarcated by dashed vertical lines, which were determined based on MCF-7 ENCODE CAGE-seq dataset ENCFF207DXM as described in materials and methods.
Figure 6—figure supplement 2
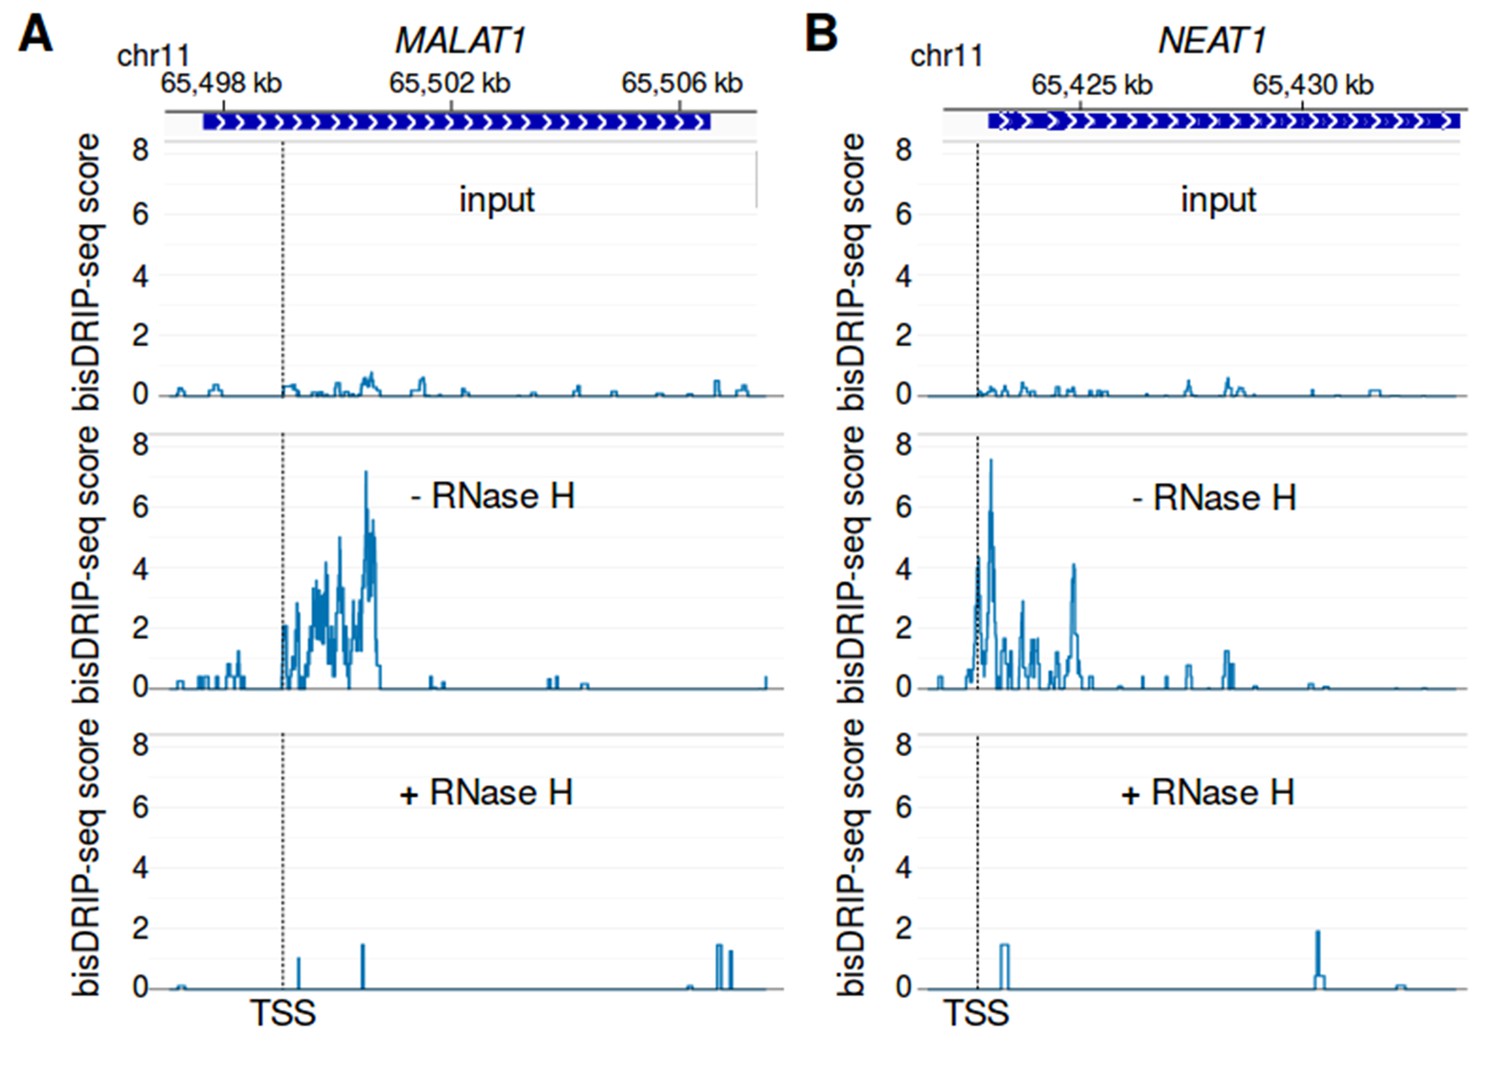
R-loop signal in MALAT1 and NEAT1 is reduced by RNase H treatment.
(A,B) bisDRIP-seq enrichment at (A) MALAT1 and (B) NEAT1 is lost after RNase H treatment and is not observed without RNA-DNA hybrid immunoprecipitation by S9.6 antibody. RNase H should selectively degrade the RNA component of R-loops. Thus, if bisDRIP-seq signal is caused by R-loops, RNase H treatment should reduce bisDRIP-seq signal. In the top panel, bisDRIP-seq scores from ‘input’ samples (mean of n = 2 samples) were mapped to each gene locus. bisDRIP-seq input samples were treated an identical manner to other bisDRIP-seq samples, except that no S9.6 antibody immunoprecipitation steps were performed. In the middle and lower plots, the bisDRIP-seq scores from two matched bisDRIP-seq experiments were mapped to each locus. The only difference between these experiments is that one sample was not treated with RNase H (middle plots, n = 1 sample), while the other sample was treated with RNase H (lower plots, n = 1 sample). At both loci, the sample that was not treated with RNase H replicated the bisDRIP-seq signal observed in standard bisDRIP-seq control experiments (Figure 6A and B). On the other hand, there is less bisDRIP-seq signal observed at each loci in both the input and RNase H-treated samples. These results suggest that RNA-DNA hybrids form in the MALAT1 and NEAT1 loci and that these RNA-DNA hybrids cause the high bisDRIP-seq scores observed at these loci. The location of the transcription start site is demarcated by ‘TSS’ and a dashed vertical line.
Figure 6—figure supplement 3
Analysis of individual reads suggests that there is heterogeneity in the R-loop structures forming in the MALAT1 locus.
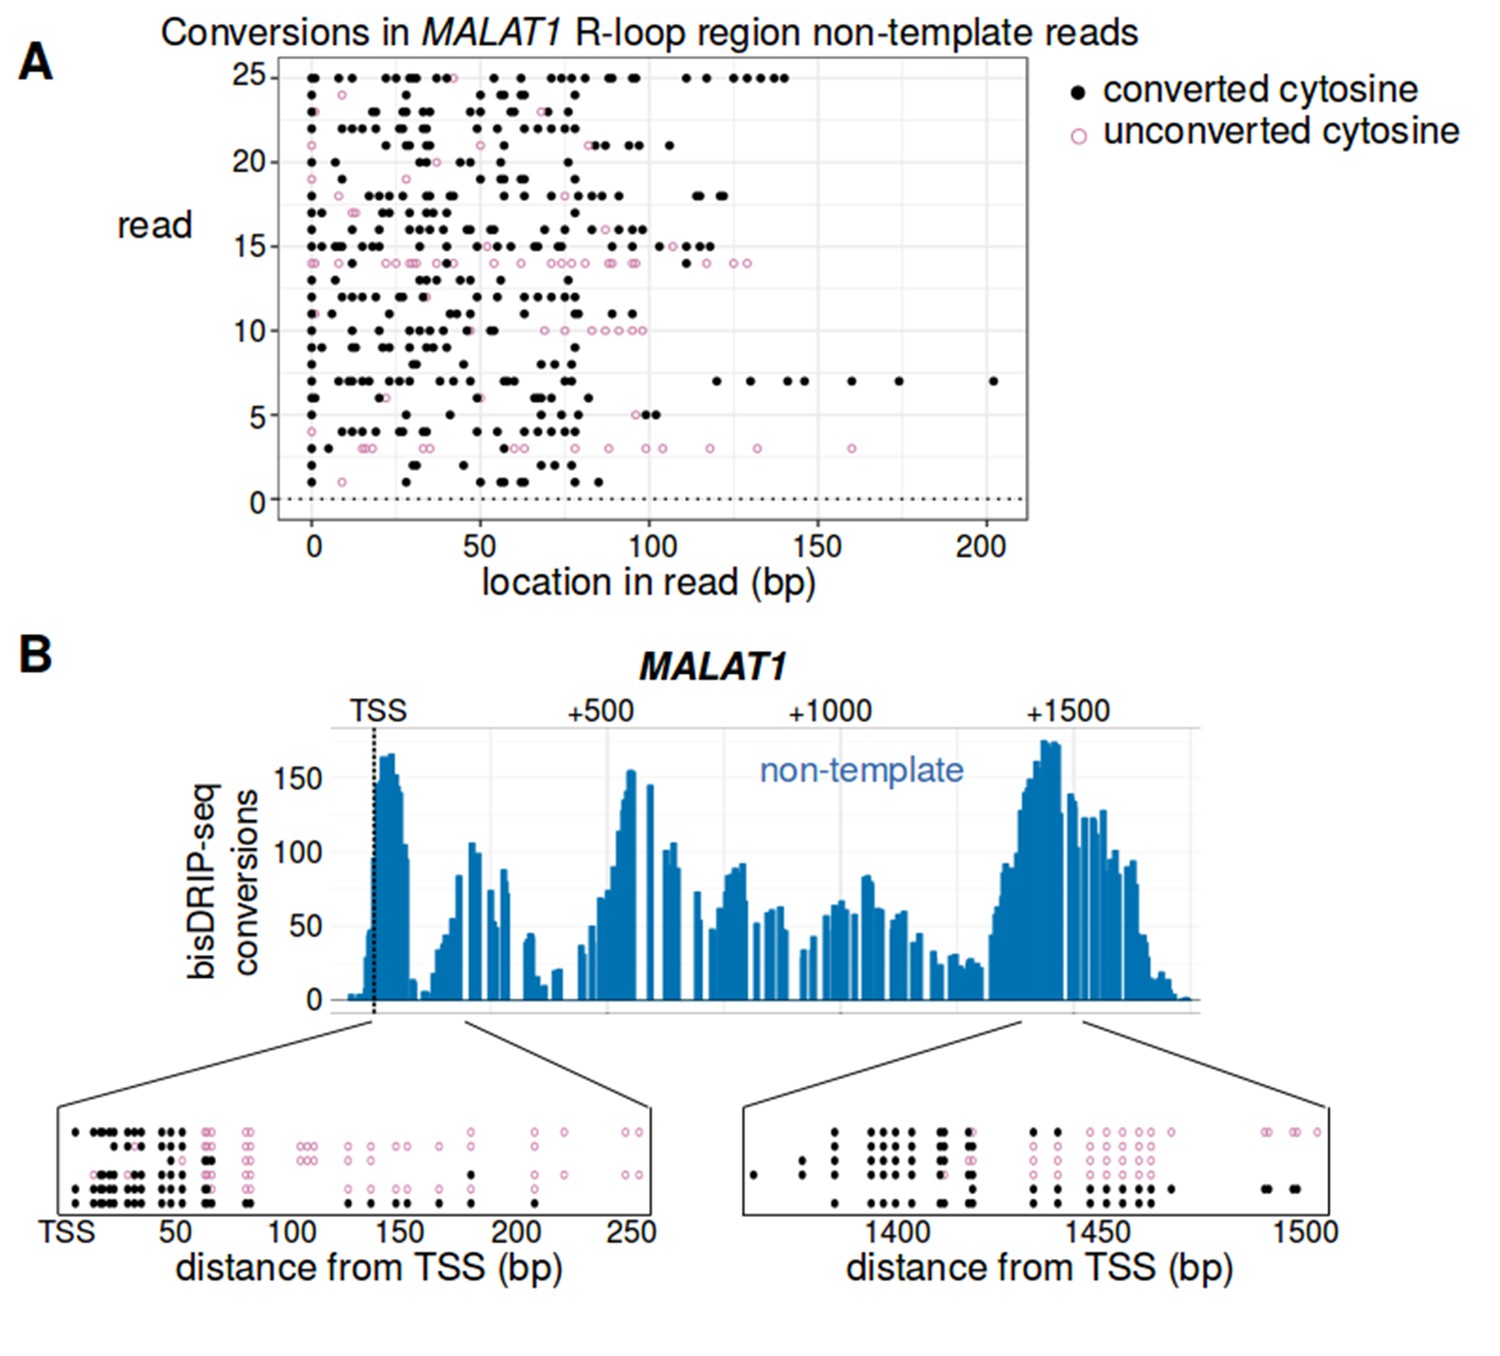
(A) Most reads from the non-template strand of MALAT1's R-loop region were heavily converted. To further analyze the R-loop that forms in the MALAT1 locus, we examined the individual reads from this locus. Here, we plotted twenty-five reads randomly sampled from the reads larger than 75 bp that aligned to the non-template strand of MALAT1's R-loop region (transcription start site to +1600 bp). For each read (y-axis), the location of converted cytosines (black, solid circle) and the location of non-converted cytosines (purple, empty circle) is plotted relative to the start of the read (x-axis). Most reads were almost completely converted. The length of the stretches of converted cytosines in these reads is consistent with the reads coming from the single-stranded regions of R-loops. (B) Examples of single-stranded DNA boundary reads from within the R-loop forming region in MALAT1. Analysis of bisDRIP-seq reads can potentially reveal the precise transition between an R-loop region and double stranded DNA. This is illustrated by the observation of ‘single-stranded DNA boundary reads’ observed in MALAT1. Single-stranded DNA boundary reads are reads that contain a long stretch of converted cytosines on one end of the read and a long stretch of unconverted cytosines on the other end and therefore likely traverse the boundary of an R-loop. Here we illustrate four examples of boundary reads mapped to around + 65 bp from the transcription start site and another four reads that map to + 1425 from the transcription start site. In each case, the location of converted cytosines (solid, black circles) and unconverted cytosines (empty, purple circles) is plotted on the x-axis relative to the transcription start site of MALAT1. While boundary reads were observed in these regions, we also observed reads that were completely or nearly completely converted in the same regions. Together, these results suggest that the mapped R-loop region may reflect the amalgamation of different sized R-loops from different MALAT1 genes in the cell population. This heterogeneity may stem from variation in the size or location of R-loops in MALAT1. Alternatively, it may reflect the formation of hairpins or other double-stranded structures within the single-stranded regions of R-loops. The location of the transcription start site is demarcated by ‘TSS’ and a dashed vertical line.
Figure 6—figure supplement 4
The R-loop in MALAT1 ends at an SRSF1 binding site.
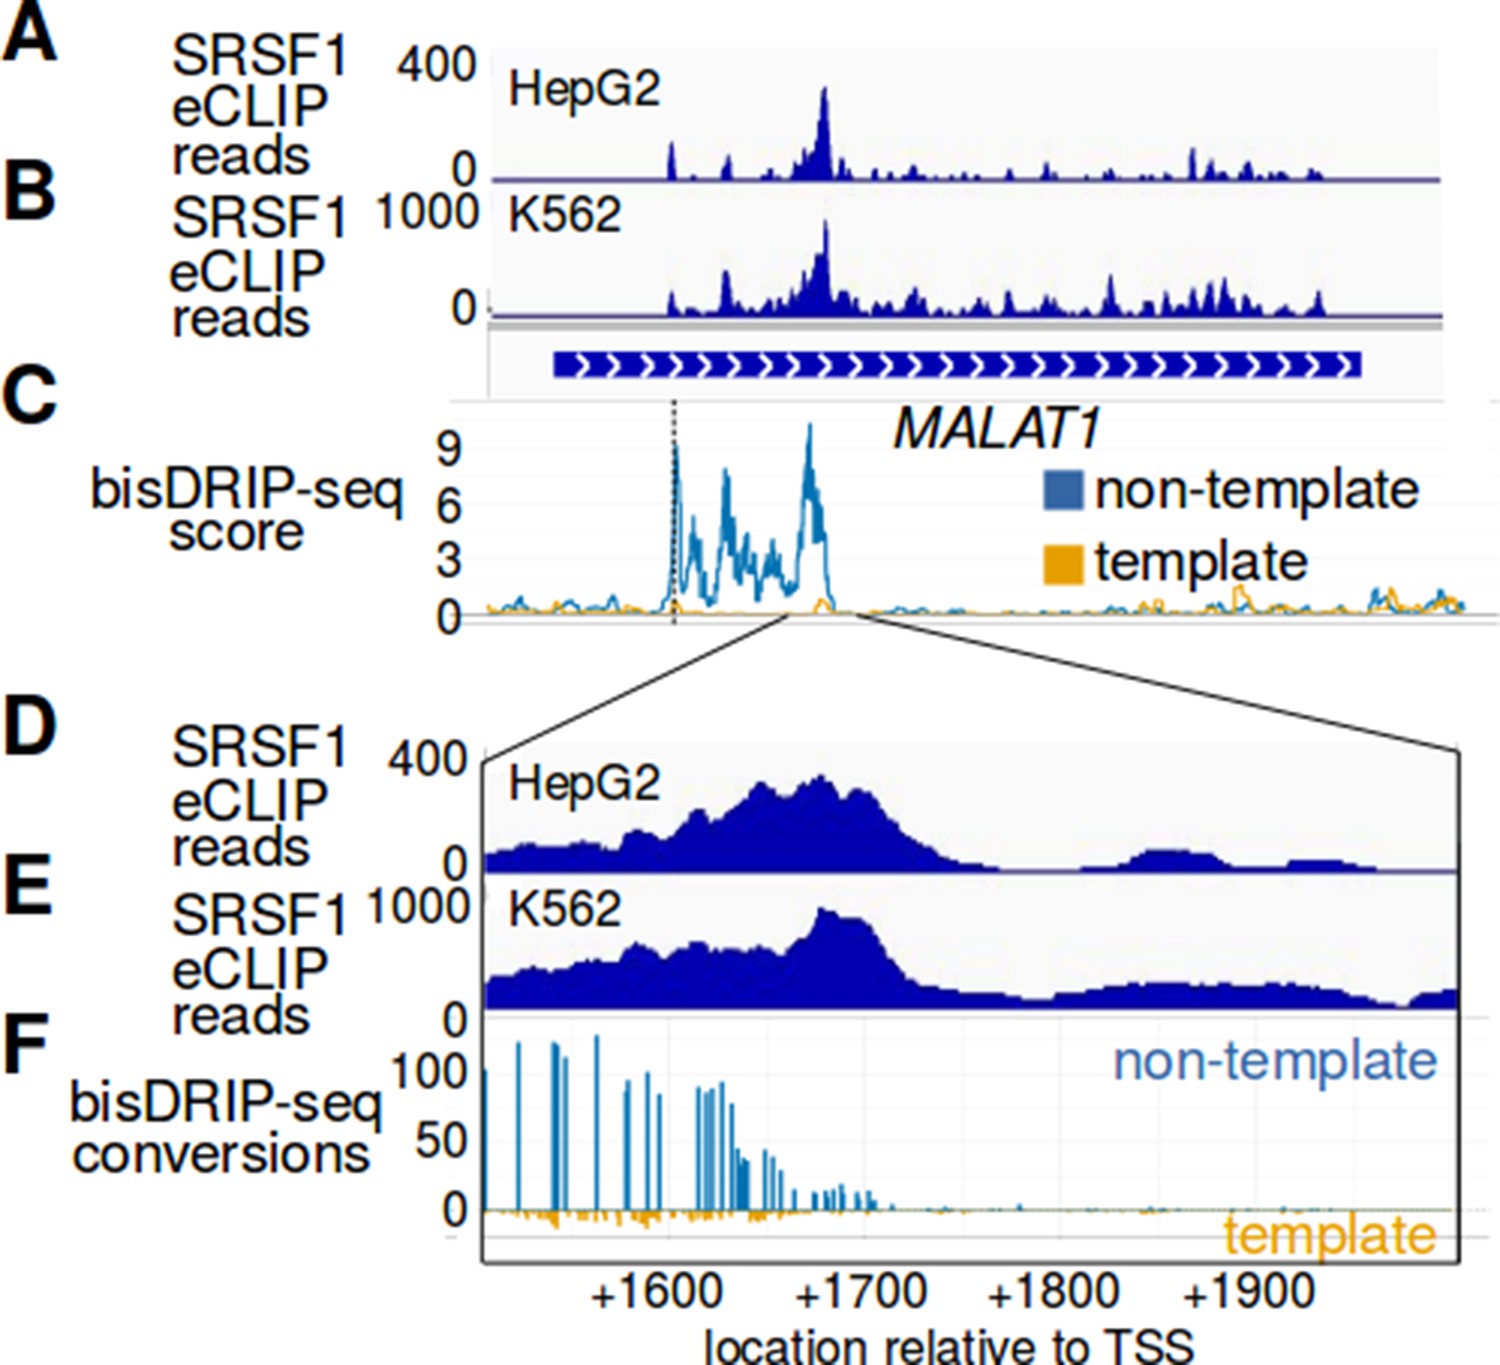
(A–F) SRSF1 preferentially binds MALAT1 RNA near the location corresponding to the end of the MALAT1 R-loop. SRSF1 is a splicing factor that was previously shown to suppress R-loop formation (Li and Manley, 2005). SRSF1 eCLIP reads were mapped to the MALAT1 genome locus from the (A) HepG2 ENCFF327NVE ENCODE dataset and from the (B) K562 ENCFF137IAG ENCODE dataset. The cell type is indicated at the top left of each plot. Below the SRSF1 eCLIP reads is a gene model of the MALAT1 genomic locus. (C) The mean bisDRIP-seq scores for the non-template strand (blue) and template strand (orange) of control-treated samples (n = 13) were mapped to the same MALAT1 genomic locus. In (D–F), the region near the end of the MALAT1 R-loop is expanded. (D,E) SRSF1 eCLIP reads were mapped to this expanded region using the same HepG2 ENCFF327NVE ENCODE dataset and K562 ENCFF137IAG ENCODE dataset. In (F), we mapped the end of the R-loop at near-nucleotide resolution. Here the number of bisDRIP-seq conversions on the template strand and non-template strand were plotted below the x-axis (orange) or above the x-axis (blue), respectively. Shown are the total number of conversions observed in all bisDRIP-seq samples (n = 13). In these plots, it is clear that the location of the SRSF1 binding site is adjacent to the end of the MALAT1 R-loop. It is intriguing to speculate that SRSF1 might be involved in defining the 3' boundary of the R-loop in MALAT1.
Figure 7
bisDRIP-seq provides improved mapping of R-loops relative to DRIPc-seq.
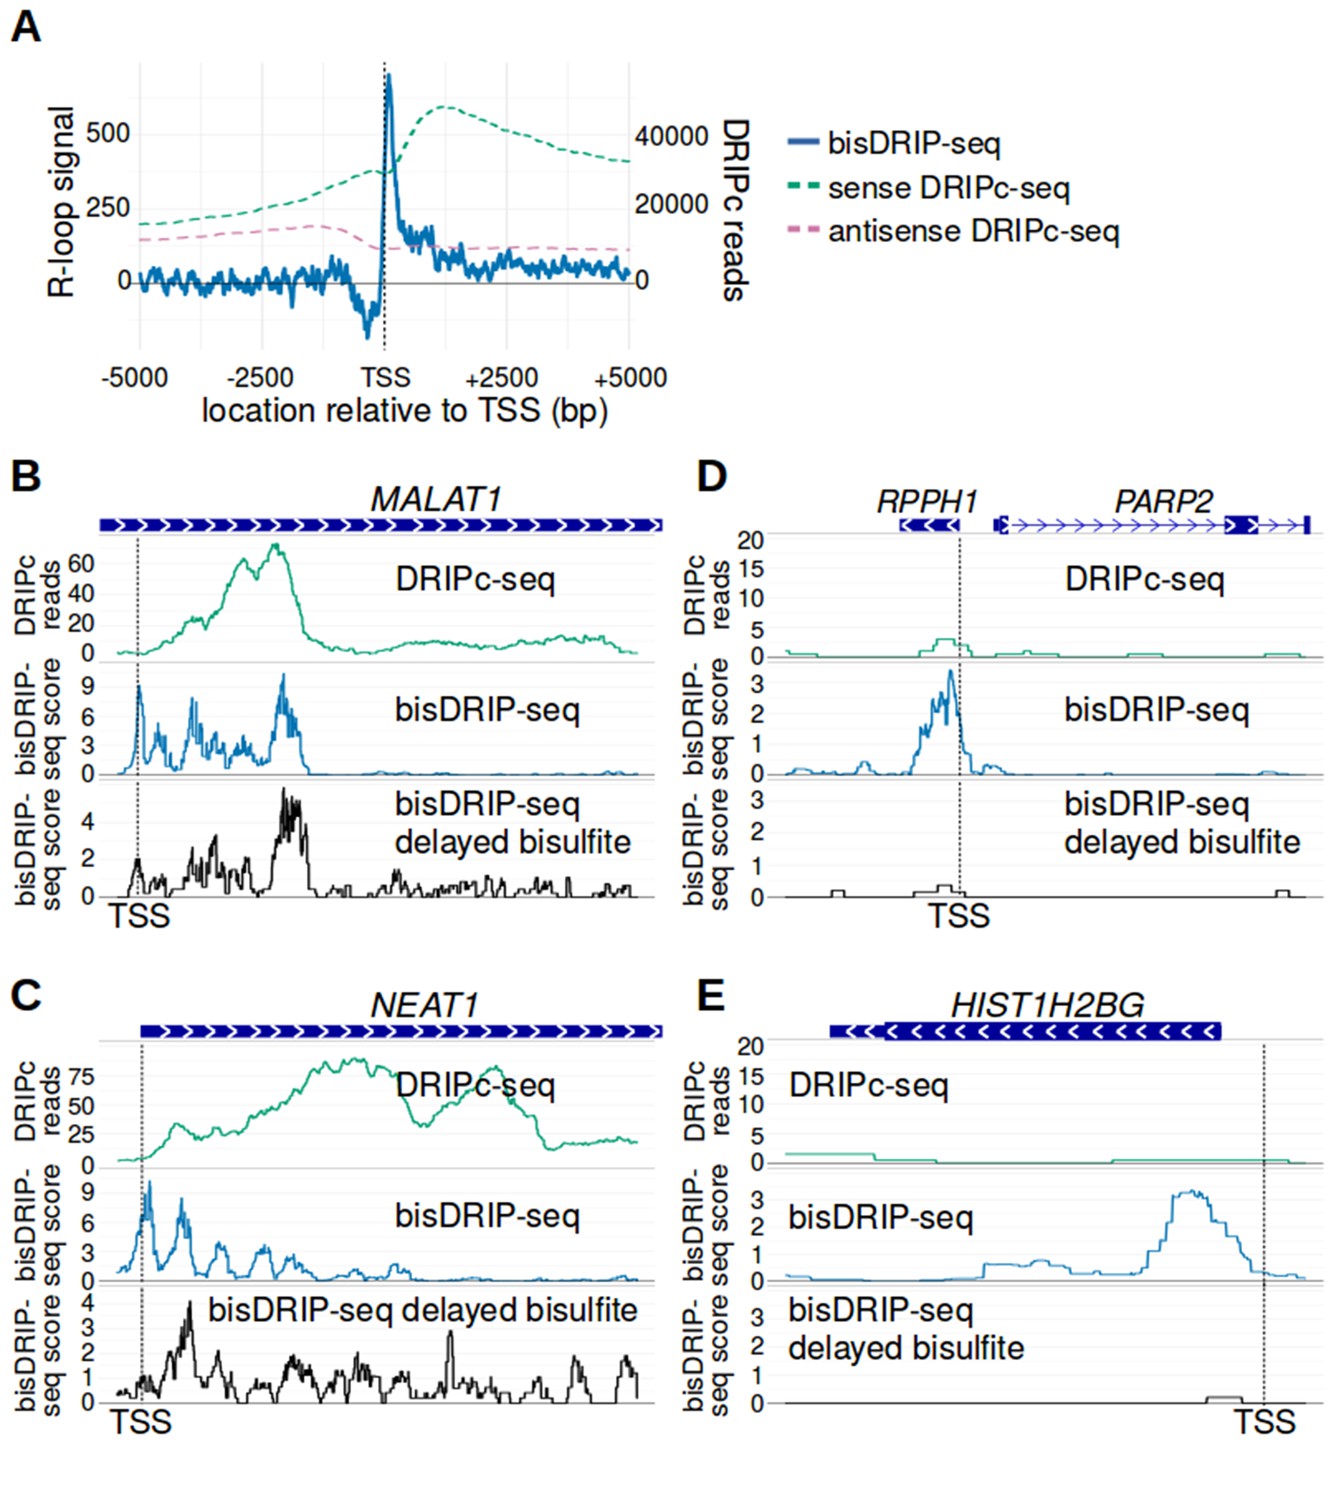
(A) The well-defined R-loop boundaries observed by bisDRIP-seq are less well demarcated in DRIPc-seq. To determine if the resolution of bisDRIP-seq R-loop mapping improves upon the resolution of previous R-loop mapping methods, we compared the data from bisDRIP-seq and DRIPc-seq. DRIPc-seq maps the location of RNAs that are incorporated into R-loops and, apart from bisDRIP-seq, it is the highest resolution method to map R-loops (Sanz et al., 2016). A metaplot of bisDRIP-seq R-loop signal (y-axis, solid blue) was plotted for active promoter regions (n = 15644) relative to the transcription start site. Overlapped onto the bisDRIP-seq metaplot are metaplots of sense-strand and antisense-strand DRIPc-seq reads. R-loop signal (blue) was highest in the region immediately 3' of the transcription start site and decreased 200–250 bp downstream of the transcription start site. Although there is also a peak of sense-strand DRIPc-seq reads 3' of the transcrption start site, there is no sharp 3' boundary to these reads within 5000 bp of the transcription start site. This suggests that bisDRIP-seq can map R-loop boundaries at a higher resolution than existing R-loop mapping methods. R-loop signal was defined as the triptolide-sensitive template-strand bisDRIP-seq score subtracted from the triptolide-sensitive non-template bisDRIP-seq score. This R-loop signal at each nucleotide position was derived using the mean bisDRIP-seq score from n = 13 control-treated samples and mean bisDRIP-seq score from n = 2 triptolide-treated samples. DRIPc-seq reads reflect the mean number of reads at a given site from n = 2 DRIPc-seq experiments calculated using the datasets from Sanz et al., 2016. The location of the transcription start site is demarcated by ‘TSS’ and a dashed vertical line. (B–E) A subset of R-loops are unstable ex vivo. The structure of R-loops has previously been shown to change in vitro (Kaback et al., 1979; Landgraf et al., 1996). To determine whether the structure of R-loops isolated from cells can change ex vivo, we compared R-loop maps from experiments in which R-loop mapping occurred either during cell lysis (bisDRIP-seq) or hours after cell lysis (delayed bisDRIP-seq and DRIPc-seq). In the delayed bisDRIP-seq experiment (lower plot), R-loops were labeled with bisulfite 16 hr after cell lysis (black, y-axis, n = 1 sample) rather than during cell lysis. R-loops were mapped to the gene loci of (B) MALAT1, (C) NEAT1, (D) RPPH1 and (E) HIST1H2BG using DRIPc-seq (top plot, green, mean of n = 2 samples), bisDRIP-seq (middle plot, blue, n = 13 samples) and delayed bisDRIP-seq (lower plot, black, n = 1 sample). For (A) MALAT1 and (B) NEAT1, R-loops map to similar regions in all three experiments. However, the R-loop signal appears to migrate towards the 3' end of the gene in both genes. On the other hand, the R-loop signal observed for (C) RPPH1 and (D) HIST1H2BG in control-treated bisDRIP-seq samples is not observed in either the delayed bisDRIP-seq or DRIPc-seq datasets. Together, these results suggest that a subset of R-loops are unstable ex vivo. DRIPc-seq data was obtained from Sanz et al., 2016.
Figure 8
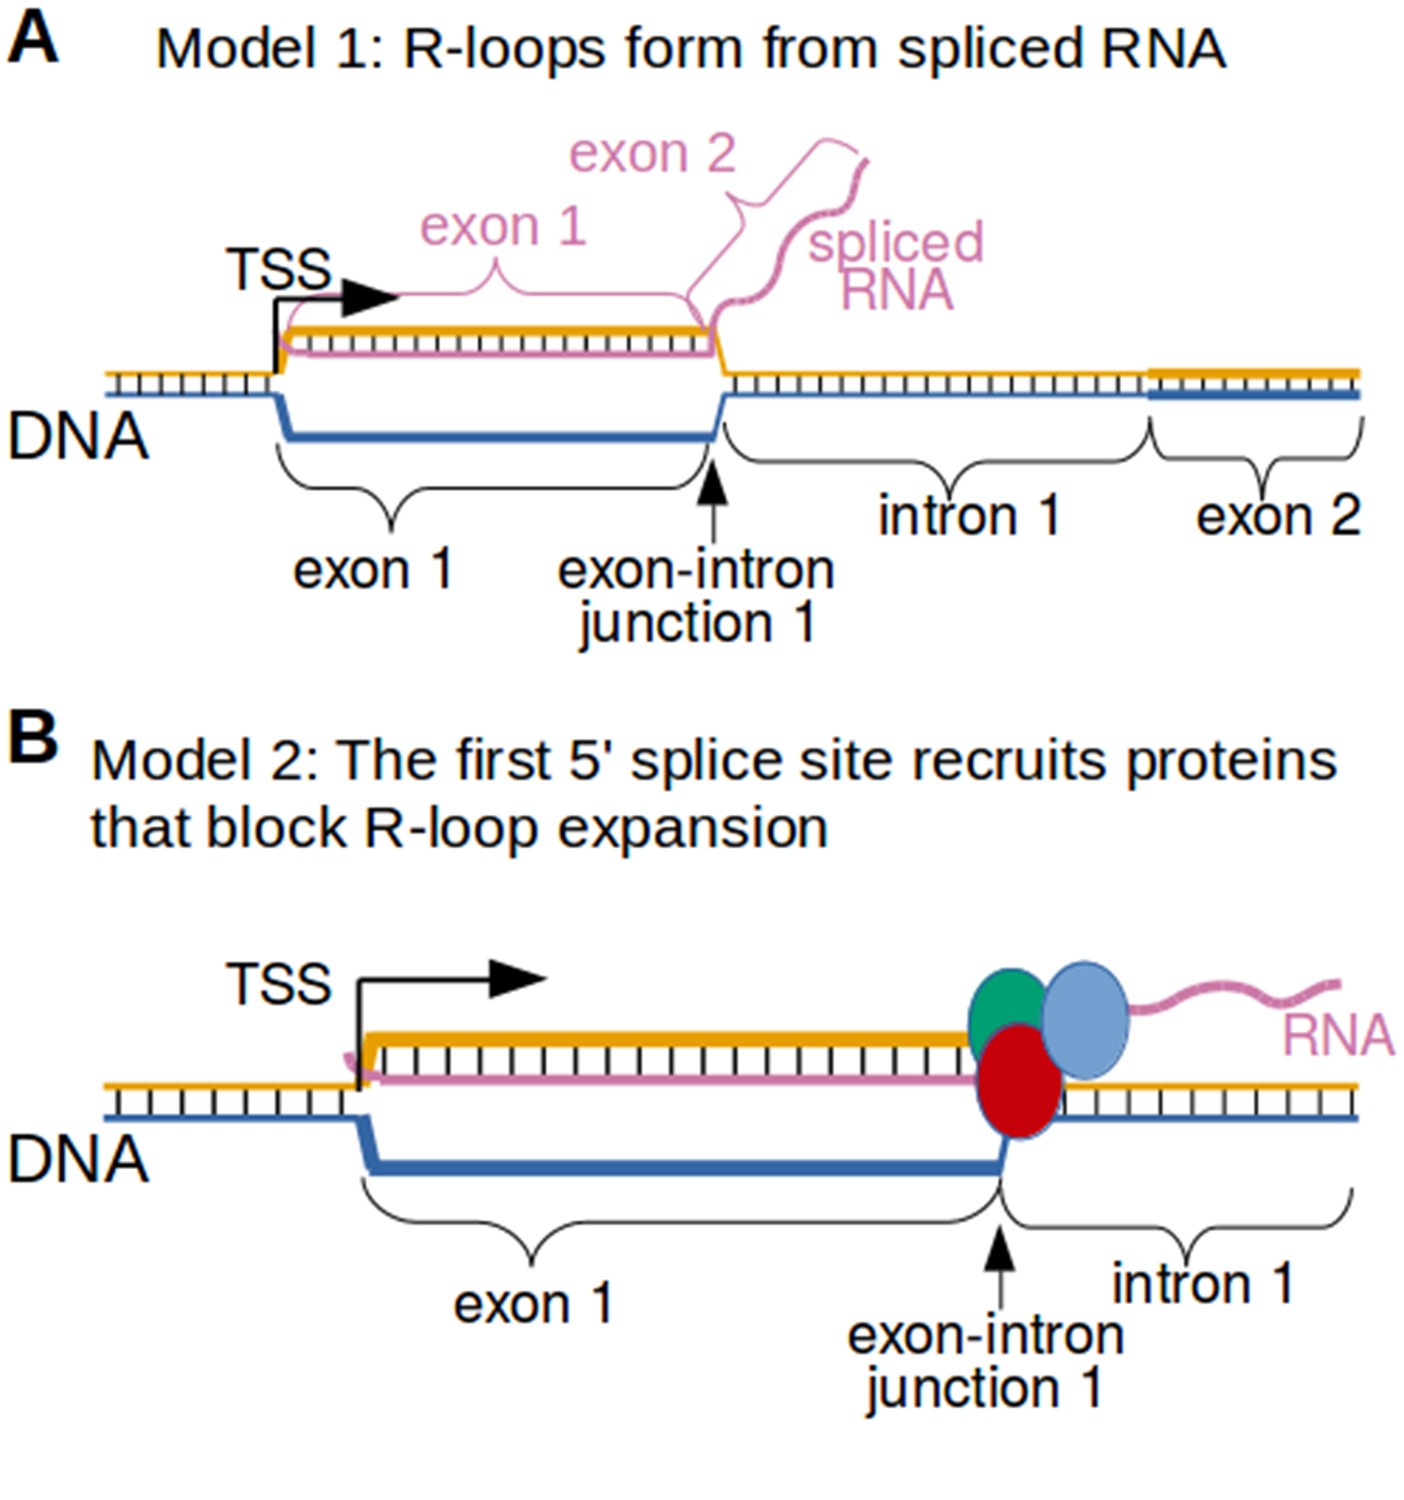
Two possible models to explain the R-loop boundaries observed in the promoter regions of intron-containing genes.
(A) Spliced RNA R-loop model. Promoter-associated R-loops may be bounded by the exon-intron junction because the RNA component of R-loops is spliced. If the first intron is spliced out of the RNA that is incorporated into promoter-associated R-loops, then the RNA cannot hybridize to the region of DNA encoding the first intron. This would prevent R-loops from expanding past exons. In this model, the template strand for canonical transcription is represented in orange, while the opposite, non-template strand is represented in blue. Black lines between two nucleic acid strands indicate that the nucleic acids are hybridized. ‘TSS’ refers to the transcription start site. (B) Protein-recruitment model. Alternatively, the first exon-intron junction may recruit proteins that prevent R-loop formation in the intron region. For example, the first exon-intron junction recruits splicesome proteins, which have been implicated in R-loop processing (Li and Manley, 2005). These or other proteins may bind the exon-intron junction and then block R-loop expansion. In this model, the template strand for canonical transcription is represented in orange, while the opposite, non-template strand is represented in blue. The red, green and blue circles represent proteins associated with first exon-intron junction. Black lines between two nucleic acid strands indicate that the nucleic acids are hybridized.
Tables
Table 1
The 25 genes that were most strongly associated with transcription-dependent sense-strand R-loop structures in the region between the transcription start site and + 250 bp.
https://doi.org/10.7554/eLife.28306.023| Gene | Histone | Single exon | Genetype |
|---|---|---|---|
| MALAT1 | no | yes | lncRNA |
| CTB-58E17.1 | no | yes | lncRNA |
| RHOB | no | yes | protein coding |
| NEAT1 | no | yes | lncRNA |
| HIST1H2BC | yes | yes | protein coding |
| STX16 | no | no | protein coding |
| ARFIP2 | no | no | protein coding |
| HIST1H2BG | yes | yes | protein coding |
| XBP1 | no | no | protein coding |
| TM7SF2 | no | no | protein coding |
| DNAJB1 | no | no | protein coding |
| HIST1H2BK | yes | yes | protein coding |
| MIEN1 | no | no | protein coding |
| NFKBIA | no | no | protein coding |
| RP11-166B2.1 | no | no | protein coding |
| SRSF3 | no | no | protein coding |
| LASP1 | no | no | protein coding |
| RPPH1 | no | yes | ribozyme |
| HIST4H4 | yes | yes | protein coding |
| RPL23 | no | no | protein coding |
| HIST1H2BD | yes | yes | protein coding |
| GSS | no | no | protein coding |
| HIST1H1E | yes | yes | protein coding |
| SRSF7 | no | no | protein coding |
| TPM3 | no | no | protein coding |
Key resources table
| Reagent type (species) or resource | Designation | Source or reference | Identifiers | Additional information |
|---|---|---|---|---|
| cell line (human) | MCF-7 cells | ATCC | HTB-22 | |
| antibody | S9.6 antibody | Kerafast | ENH001 | Used at a concentration of 20 mg/L |
| commercial assay or kit | Pico-Methyl Seq Library Prep Kit | Zymo Research | D5455 | |
| chemical compound, drug | Ammonium sulfite monohydrate | Sigma-Aldrich | 358983–500G | |
| chemical compound, drug | 45% ammonium bisulfite | Pfaltz and Bauer Inc | A29946250g | |
| chemical compound, drug | sodium bisulfite | Sigma-Aldrich | 243973–100G | |
| chemical compound, drug | triptolide | R and D Systems | 3253 | |
| software, algorithm | Bismark | Babraham Bioinformatics | version 0.14.3 | |
| software, algorithm | Flexbar | Dodt et al., 2012 PMID: 24832523 | version 2.5 |
Additional files
-
Source code 1
Calculating bisDRIP-seq scores from bisDRIP-seq reads.
- https://doi.org/10.7554/eLife.28306.031
-
Source code 2
Calculating region bisDRIP-seq scores.
- https://doi.org/10.7554/eLife.28306.032
-
Source code 3
Stochastic read alignment Monte Carlo simulations.
- https://doi.org/10.7554/eLife.28306.033
-
Source code 4
Stochastic read score switching Monte Carlo simulations.
- https://doi.org/10.7554/eLife.28306.034
-
Source code 5
Generating metaplots around specific sites.
- https://doi.org/10.7554/eLife.28306.035
-
Transparent reporting form
- https://doi.org/10.7554/eLife.28306.036
Download links
A two-part list of links to download the article, or parts of the article, in various formats.
Downloads (link to download the article as PDF)
Open citations (links to open the citations from this article in various online reference manager services)
Cite this article (links to download the citations from this article in formats compatible with various reference manager tools)
Defining the location of promoter-associated R-loops at near-nucleotide resolution using bisDRIP-seq
eLife 6:e28306.
https://doi.org/10.7554/eLife.28306


