Cation selectivity of the presequence translocase channel Tim23 is crucial for efficient protein import
- University Medical Center Göttingen, Germany
- Max Planck Institute for Biophysical Chemistry, Germany
- Göttinger Zentrum für Molekulare Biowissenschaften, Germany
- European Neuroscience Institute Göttingen, Germany
Figures
Figure 1 with 2 supplements

Substitutions of pore-lining residues of Tim23 reduce the channel’s ion selectivity and lead to a growth defect in S. cerevisiae.
(A) Helical wheel projection of amino acid residues 150–163 of the second transmembrane helix of Tim23. Highlighted residues in green indicate near 100% conservation. Colored hemispheres indicates polar/apolar facing regions of helix. Residues mutated in this study are circled in red. (B) S. cerevisiae strains with chromosomal deletion of the TIM23 gene, complemented by a plasmid carrying both URA3 and TIM23 gene, were transformed with plasmids containing wild type TIM23 or mutants and tested for viability after plasmid loss on 5-FOA containing medium. (C) tim23Δ yeast cells with plasmids containing wild type TIM23 or pore-lining mutants were grown on fermentable (left) or non-fermentable (right) media at 37°C. Strains WT to A156L were grown on a single plate each for glucose and glycerol respectively. (D) Electrophysiological current-voltage (I–V) curves were recorded at asymmetrical buffer conditions with 12.5-fold KCl gradient for Tim23 (grey) or Tim23G153A (red) to determine reversal potentials. (E) Reversal potentials Urev were experimentally determined for wild type Tim23 and all mutants by independent triplicates at asymmetrical buffer conditions, the ion selectivity was calculated from the mean reversal potential following the Goldman-Hodgkin-Katz equation. Errors represent standard deviation.
Figure 1—figure supplement 1
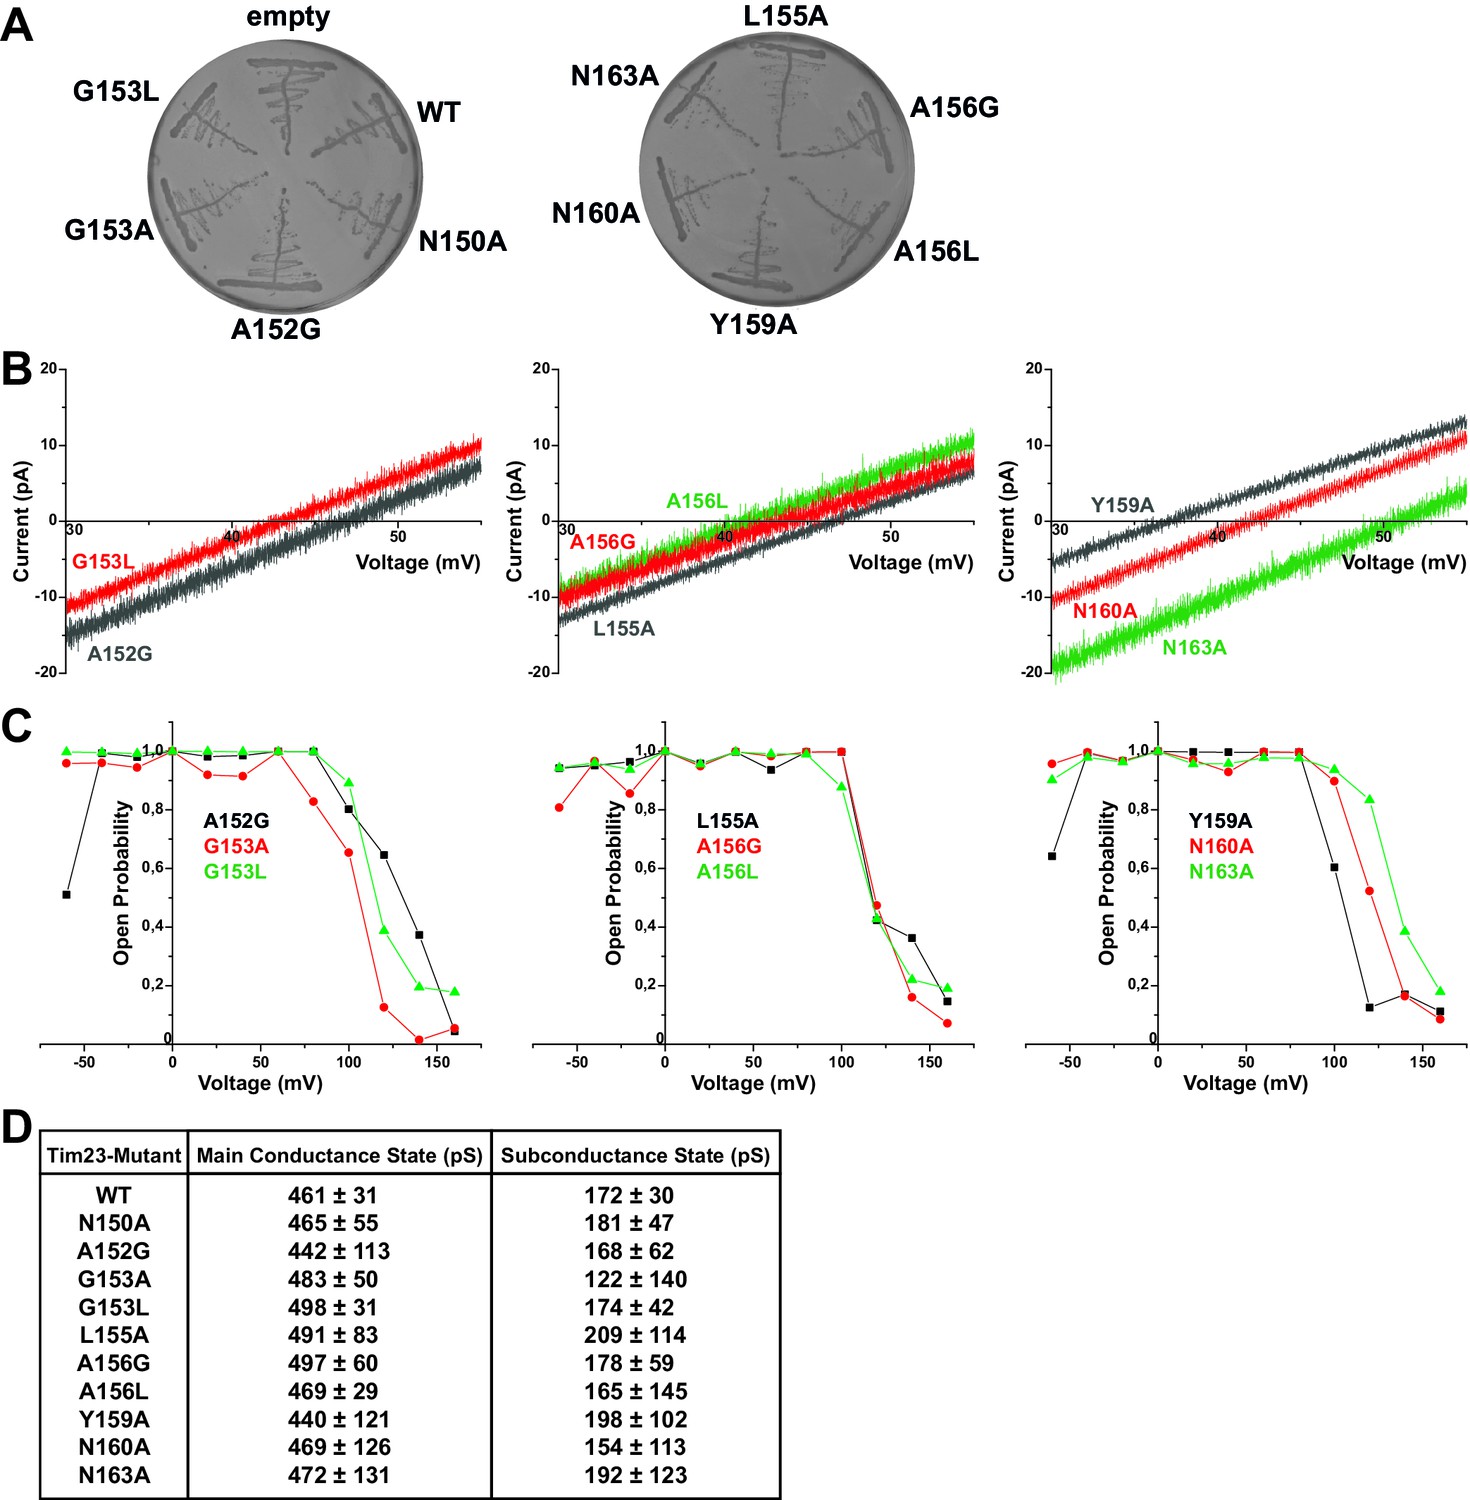
Electrophysiological screening of Tim23 mutants.
(A) S. cerevisiae cells with chromosomal deletion of the TIM23 gene, complemented by a plasmid carrying both URA3 and TIM23 gene, were transformed with plasmids containing HIS3 gene and wild type TIM23 or mutants. Cells were tested for proper plasmid transformation on -His selective medium. (B) I-V curves of all mutants not shown in Figure 1 or Figure 3. Recorded under asymmetric buffer conditions with 12.5-fold KCl-gradient. (C) Open probabilities of all mutants not shown in Figure 3 were calculated from one full set of constant-voltage recordings (from −60 mV to +160 mV) each. (D) Table of main and primary subconductance states of wild type Tim23 and all mutants were determined by Gaussian fits from gating event histograms (as shown in Figure 3B). Mean and errors represent center and FWHM of Gaussian fits. For Tim23 and Tim23N150A, more than 2000 gating events from three independent full sets of recordings and for every other mutant more than 700 gating events from one full set of recordings were analyzed each.
Figure 1—figure supplement 2
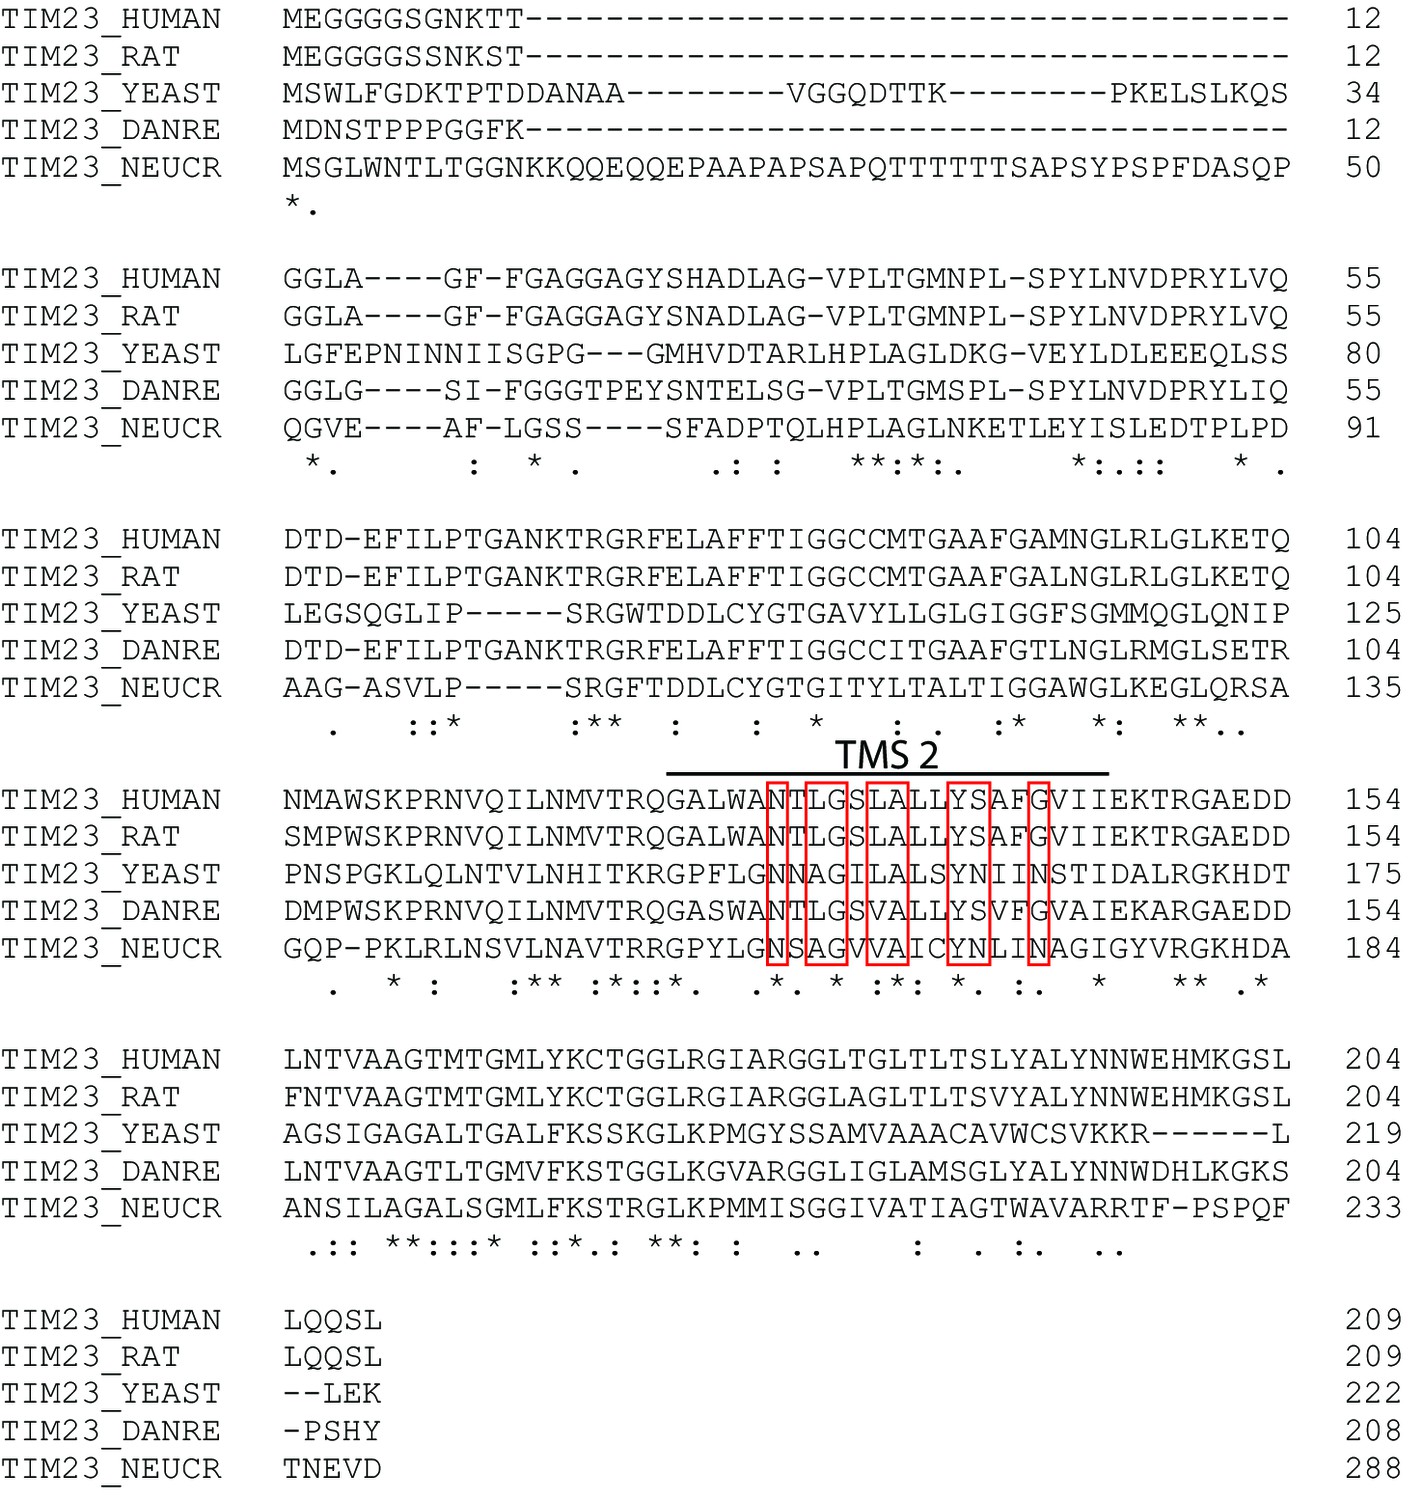
Sequence conservation of Tim23.
Sequence alignment of Tim23 proteins from different species (Homo sapiens, Rattus norvegicus, Saccharomyces cerevisiae, Danio rerio, Neurospora crassa). Sequence consensus as computed by ClustalW: * identity; : high similarity; . low similarity. Mutations used in this study are boxed in red.
Figure 2 with 1 supplement
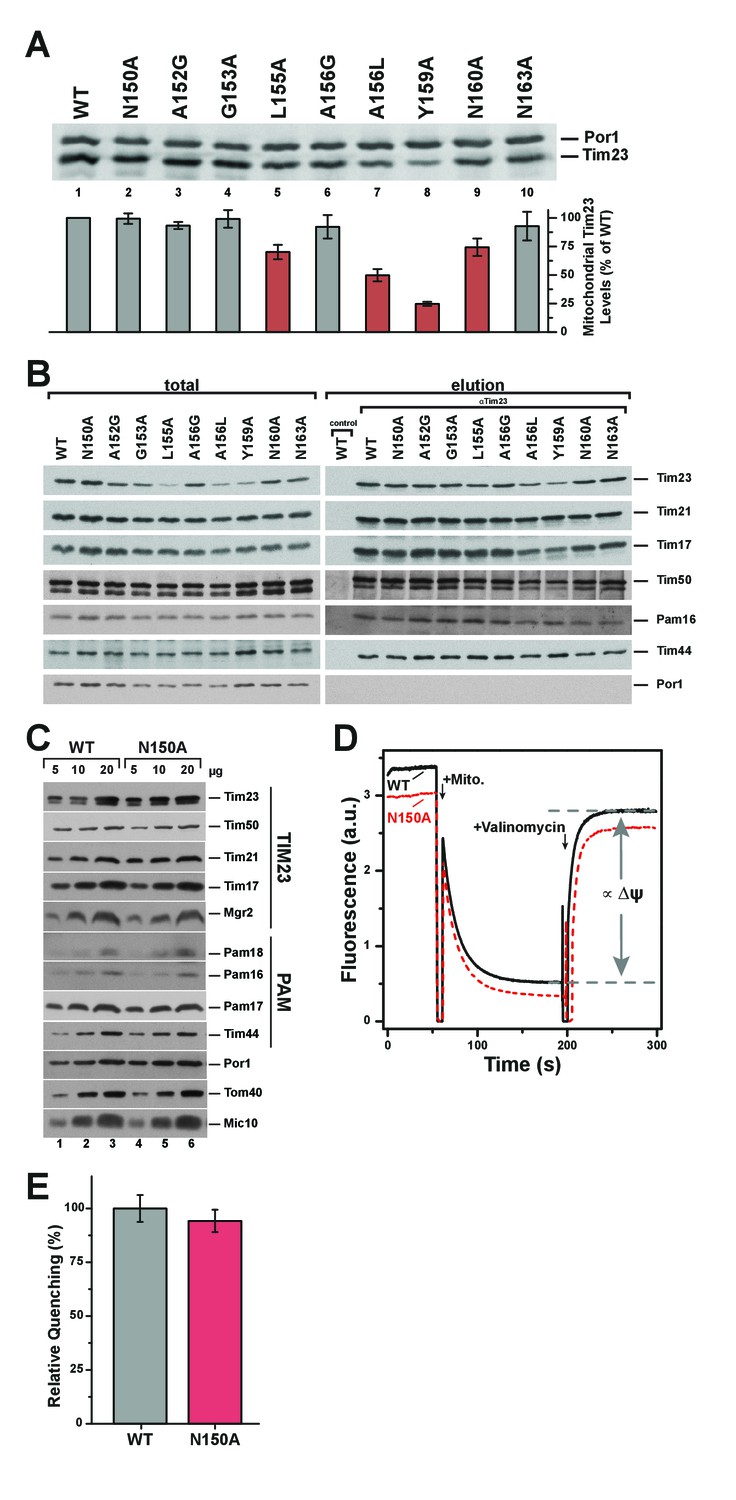
Pore-lining mutant Tim23N150A is properly expressed and integrated into TIM23 complexes.
(A) Mitochondrial steady state levels of yeast expressing wild type Tim23 or mutants were assessed by Western blot analysis (upper) with decoration against Tim23 and Por1 (mitochondrial outer membrane). Protein levels were quantified using fluorescently labelled secondary antibodies in four independent experiments and normalized by mitochondrial Por1 levels. Significantly reduced levels are indicated in red. Error bars represent standard error of the mean. (B) TIM23 complex integrity and recruitment of PAM complex of wild type and Tim23 mutants was examined by co-immunoprecipitation of mitochondrial lysates using Tim23 antibodies. (C) Isolated mitochondria containing Tim23 or Tim23N150A were Western blotted and decorated against proteins of the TIM23 complex, the PAM complex, Por1 and Tom40 (both mitochondrial outer membrane) and Mic10 (mitochondrial inner membrane). (D) Membrane potential ΔΨ was assessed by adding isolated mitochondria containing Tim23 (black solid) or Tim23N150A (red dashed) to the fluorophore DiSC3(5), then dissipating ΔΨ with valinomycin and determining the amount of quenching. Grey dashed lines and arrows indicate the parameter quantified in (E). (E) Relative fluorophore quenching as a measure of membrane potential ΔΨ for Tim23 (grey) and Tim23N150A (red) was quantified (as depicted in D) in three independent experiments. Error bars represent standard error of the mean before normalization.
Figure 2—figure supplement 1
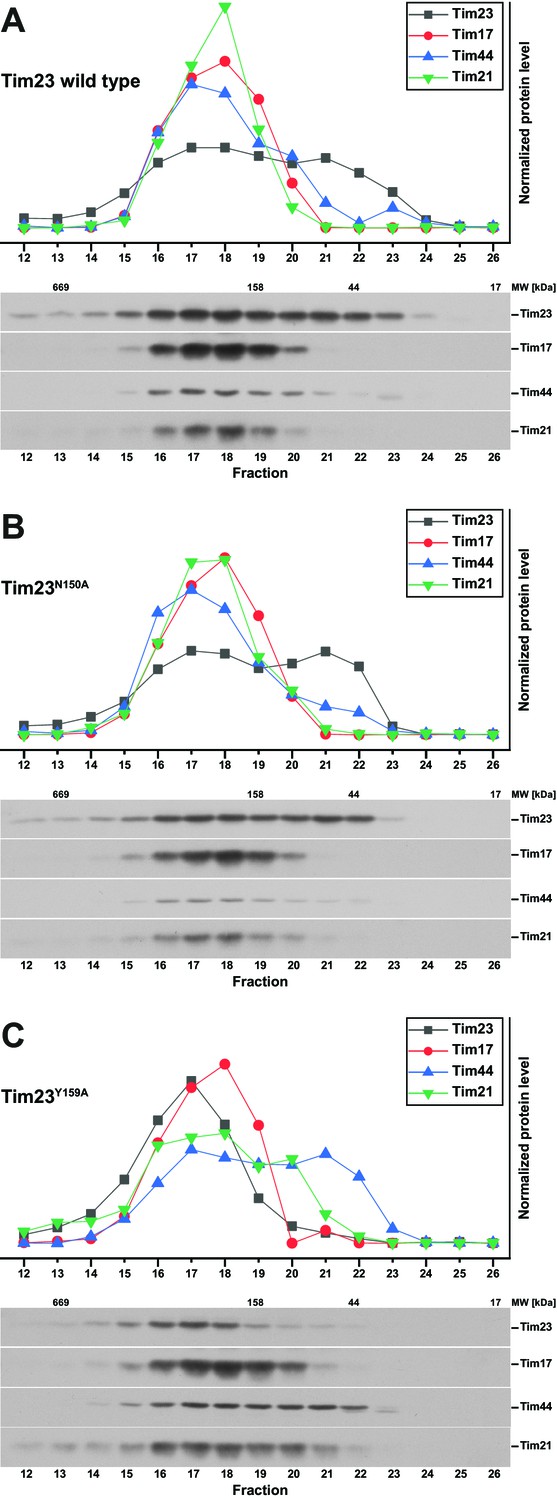
TIM23 complex characterization by size exclusion chromatography profiles.
(A) – (C) Relative elution profile of the TIM23 complex (top) was assessed by quantification of Western blots (bottom) after size exclusion chromatography of solubilized mitochondria containing Tim23 wild type (A), Tim23N150A (B) and Tim23Y159 (C).
Figure 3
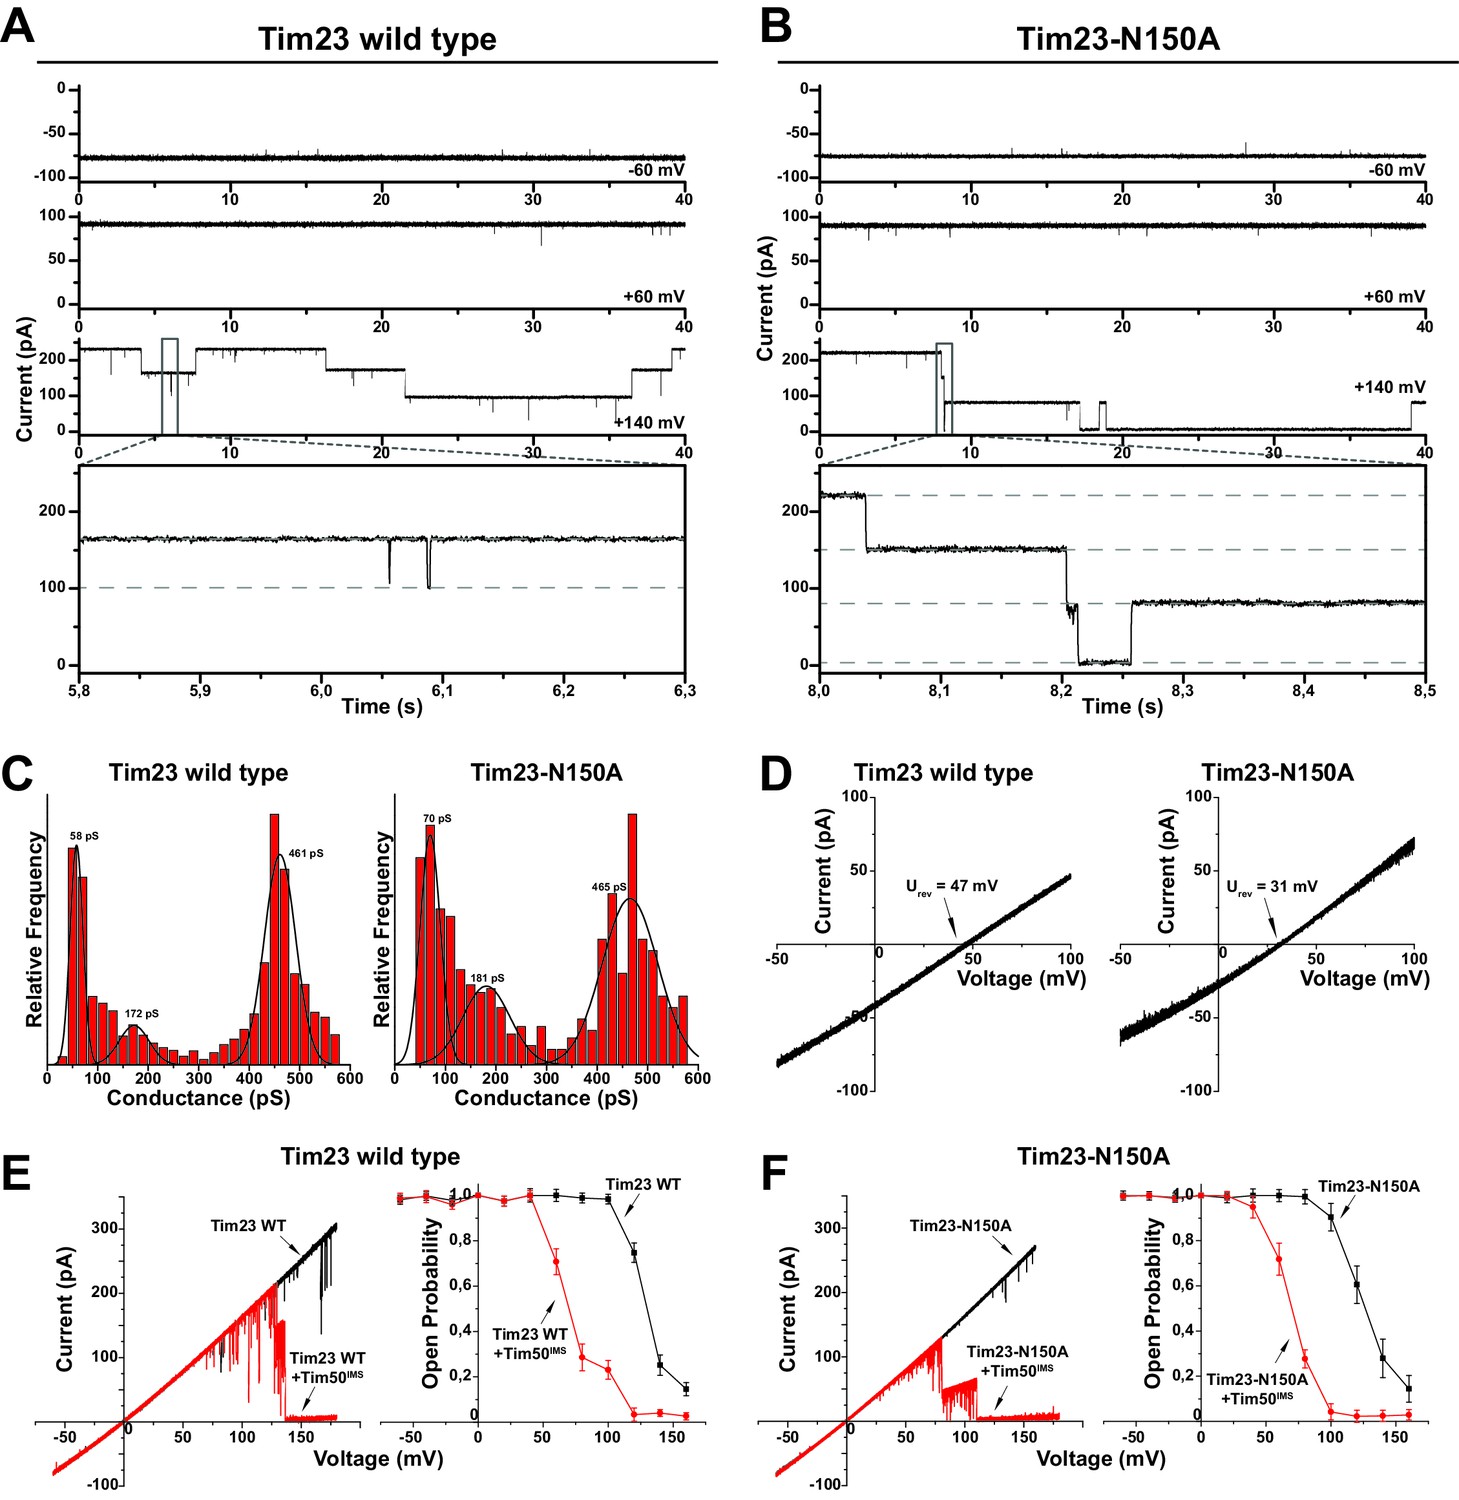
Tim23N150A displays reduced cation preference.
(A)/(B) Tim23- (A) or Tim23N150A-containing (B) proteoliposomes were fused with planar lipid bilayers and single-channel activity was characterized by electrophysiological current recordings. (C) Gating event histograms for Tim23 (left) and Tim23N150A (right) were calculated from constant-voltage recordings (as depicted in A) with at least 2000 gating events each. The three most prominent classes of conductance changes were modeled with a Gaussian fit. (D) I-V curves at asymmetrical buffer conditions were recorded for Tim23 (left) and Tim23N150A (right) with indicated reversal potential Urev for 12.5-fold KCl-gradient. (E)/(F) I-V curves (left) and open probabilities (right) were determined for bilayer incorporated Tim23 (E) or Tim23N150A (F) before (black) and after (red) addition of 700 nM Tim50IMS to IMS-side of the channel. Error bars represent standard deviation (SD, n = 3).
Figure 4 with 1 supplement
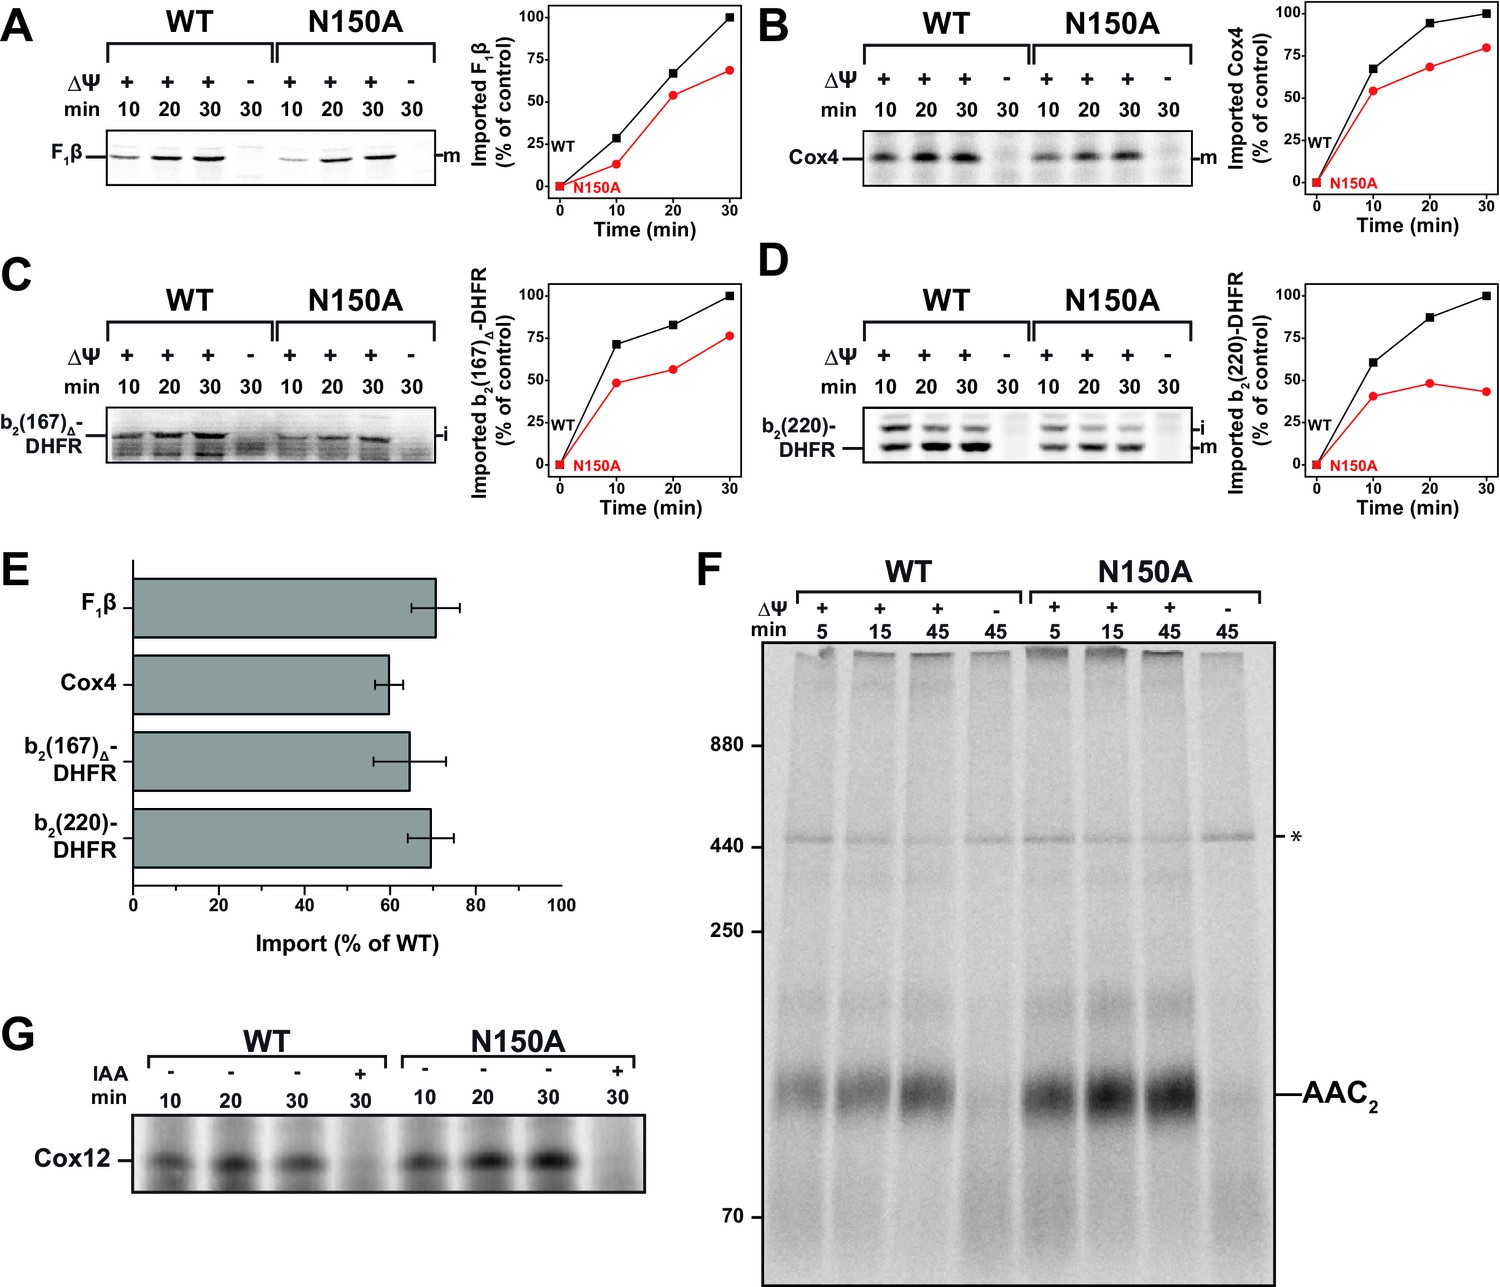
Tim23N150A exhibits significant import defects for various TIM23 substrates.
(A–D) Import capability of wild type and tim23N150A mutant mitochondria was determined by incubating [35S]-radiolabeled matrix destined precursors F1β (A), Cox4 (B), b2(167)Δ-DHFR (C) or the inner membrane sorted b2(220)-DHFR (D) with isolated mitochondria for 10, 20 or 30 min. The import reactions were stopped by dissipating ΔΨ and subsequent Proteinase K (PK)-digest. Digital autoradiographs (left) were analyzed and quantified (right). Maximum import into wild type mitochondria was set to 100%. (E) Relative import efficiency after 15 min of import into mitochondria containing Tim23N150A was quantified for different substrates. Error bars represent standard error of the mean (SEM, n = 3). (F) Carrier import into Tim23N150A-containing mitochondria was assessed via ADP/ATP carrier (AAC) complex assembly by incubating [35S]-radiolabeled AAC with isolated mitochondria for 15, 30 or 45 min. The import reaction was stopped by dissipating ΔΨ and subsequent PK-digest. Assembly of AAC dimer was monitored by BN-PAGE. (G) The MIA substrate Cox12 was [35S]-radiolabeled and imported into Tim23N150A-containing mitochondria for 10, 20 or 30 min. The import reaction was stopped by addition of iodoacetamide (IAA) and subsequent PK-digest.
Figure 4—figure supplement 1
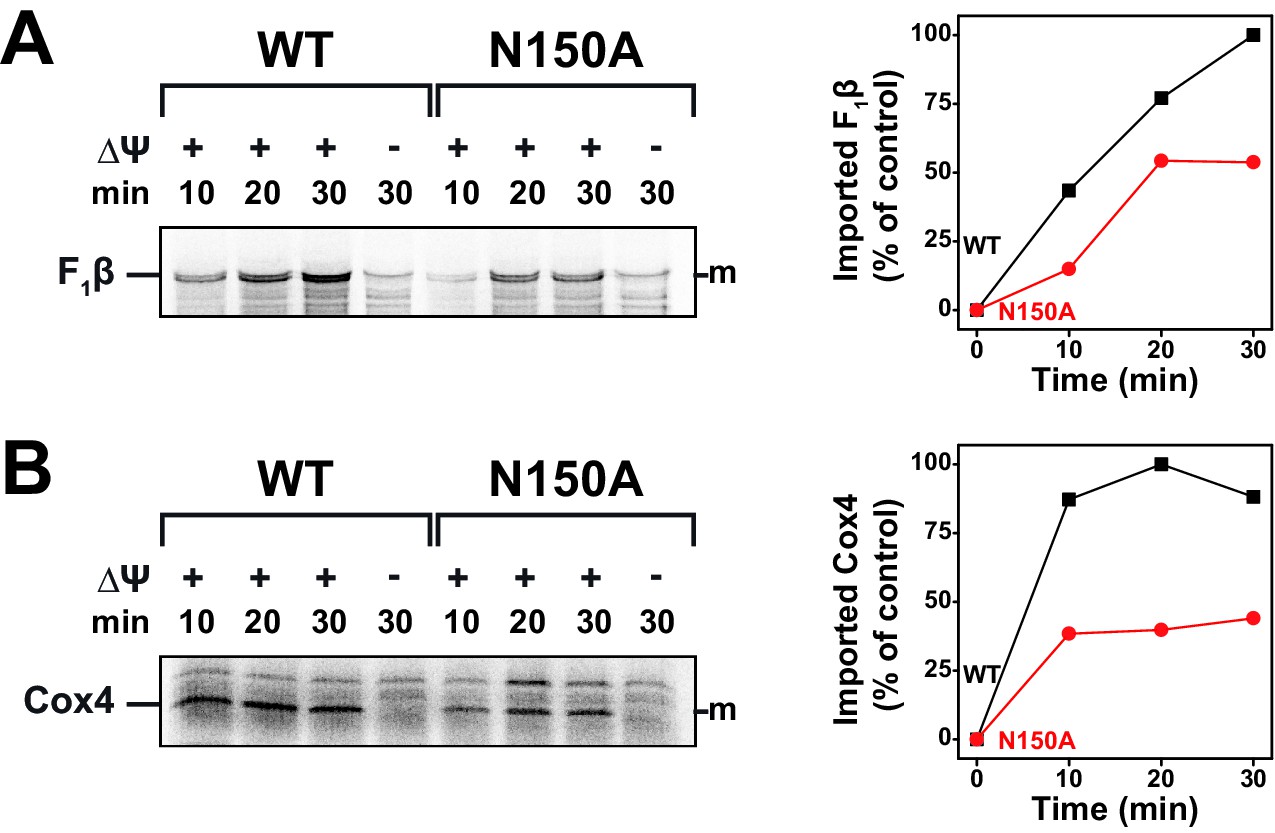
Import of TIM23-substrates at non-permissive temperatures.
(A and B) Temperature influence on import capability of Tim23N150A was assessed by incubating [35S]-radiolabeled F1β (A) or Cox4 (B) with isolated mitochondria for 10, 20 or 30 min at 37°C. Maximum import into wild type mitochondria was set to 100%.
Figure 5
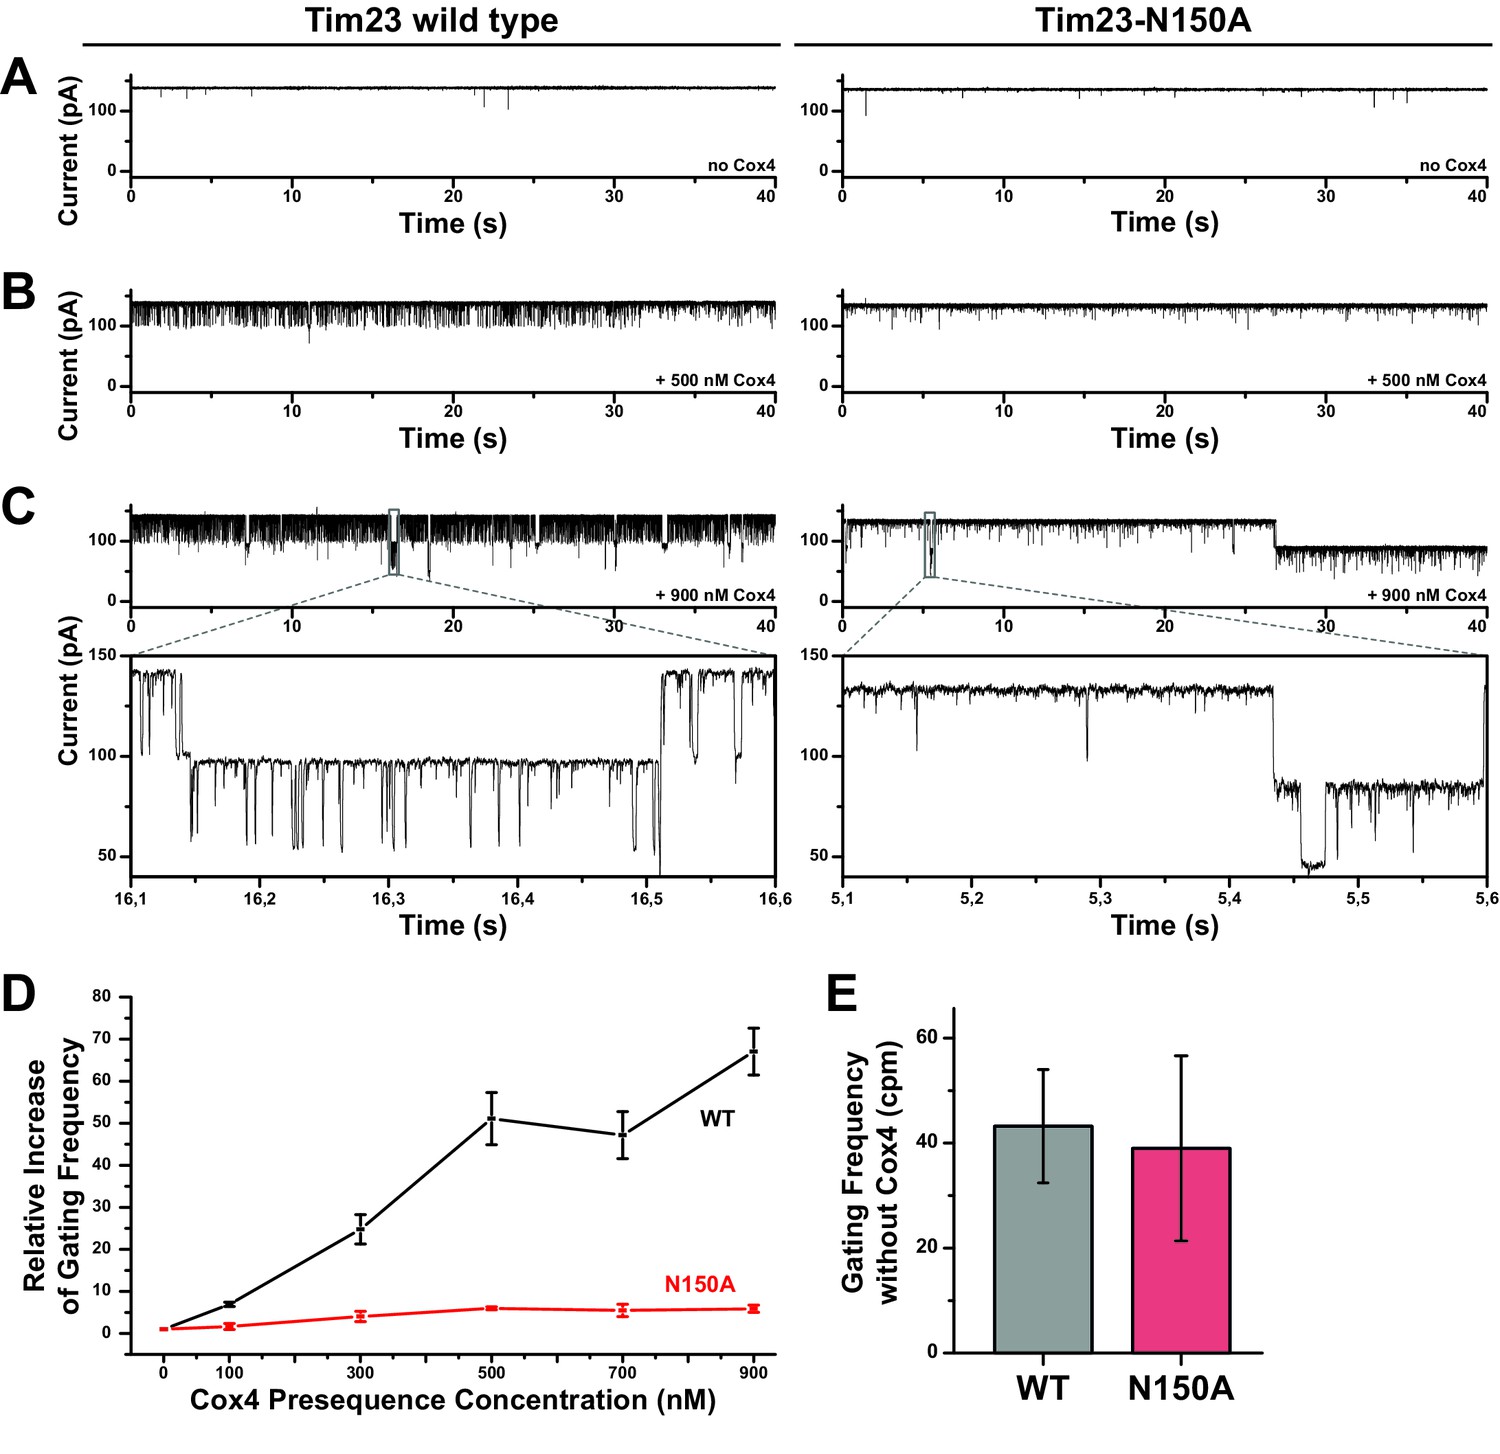
Increased gating frequency as a measure of channel response to presequence titration is heavily reduced for Tim23N150A.
(A) Bilayer-incorporated Tim23 (left) or Tim23N150A (right) single-channel currents were recorded at +80 mV before addition of Cox4 presequence peptide. (B)/(C) Current recordings of wild type (left) and mutant (right) channels were performed after each titration step. (D) Channel response of Tim23 (black) and Tim23N150A (red) after addition of Cox4 presequence was quantified by counting gating events and calculating the relative increase in activity compared to unstimulated channels. Error bars represent standard deviation. (E) Absolute gating frequency of unstimulated Tim23 and Tim23N150A was determined from current recordings before presequence titration. Error bars represent standard deviation (SD, n = 3).
Additional files
-
Transparent reporting form
- https://doi.org/10.7554/eLife.28324.012
Download links
A two-part list of links to download the article, or parts of the article, in various formats.
Downloads (link to download the article as PDF)
Open citations (links to open the citations from this article in various online reference manager services)
Cite this article (links to download the citations from this article in formats compatible with various reference manager tools)
Cation selectivity of the presequence translocase channel Tim23 is crucial for efficient protein import
eLife 6:e28324.
https://doi.org/10.7554/eLife.28324


