Heat stress promotes longevity in budding yeast by relaxing the confinement of age-promoting factors in the mother cell
- ETH Zürich, Switzerland
Figures
Figure 1
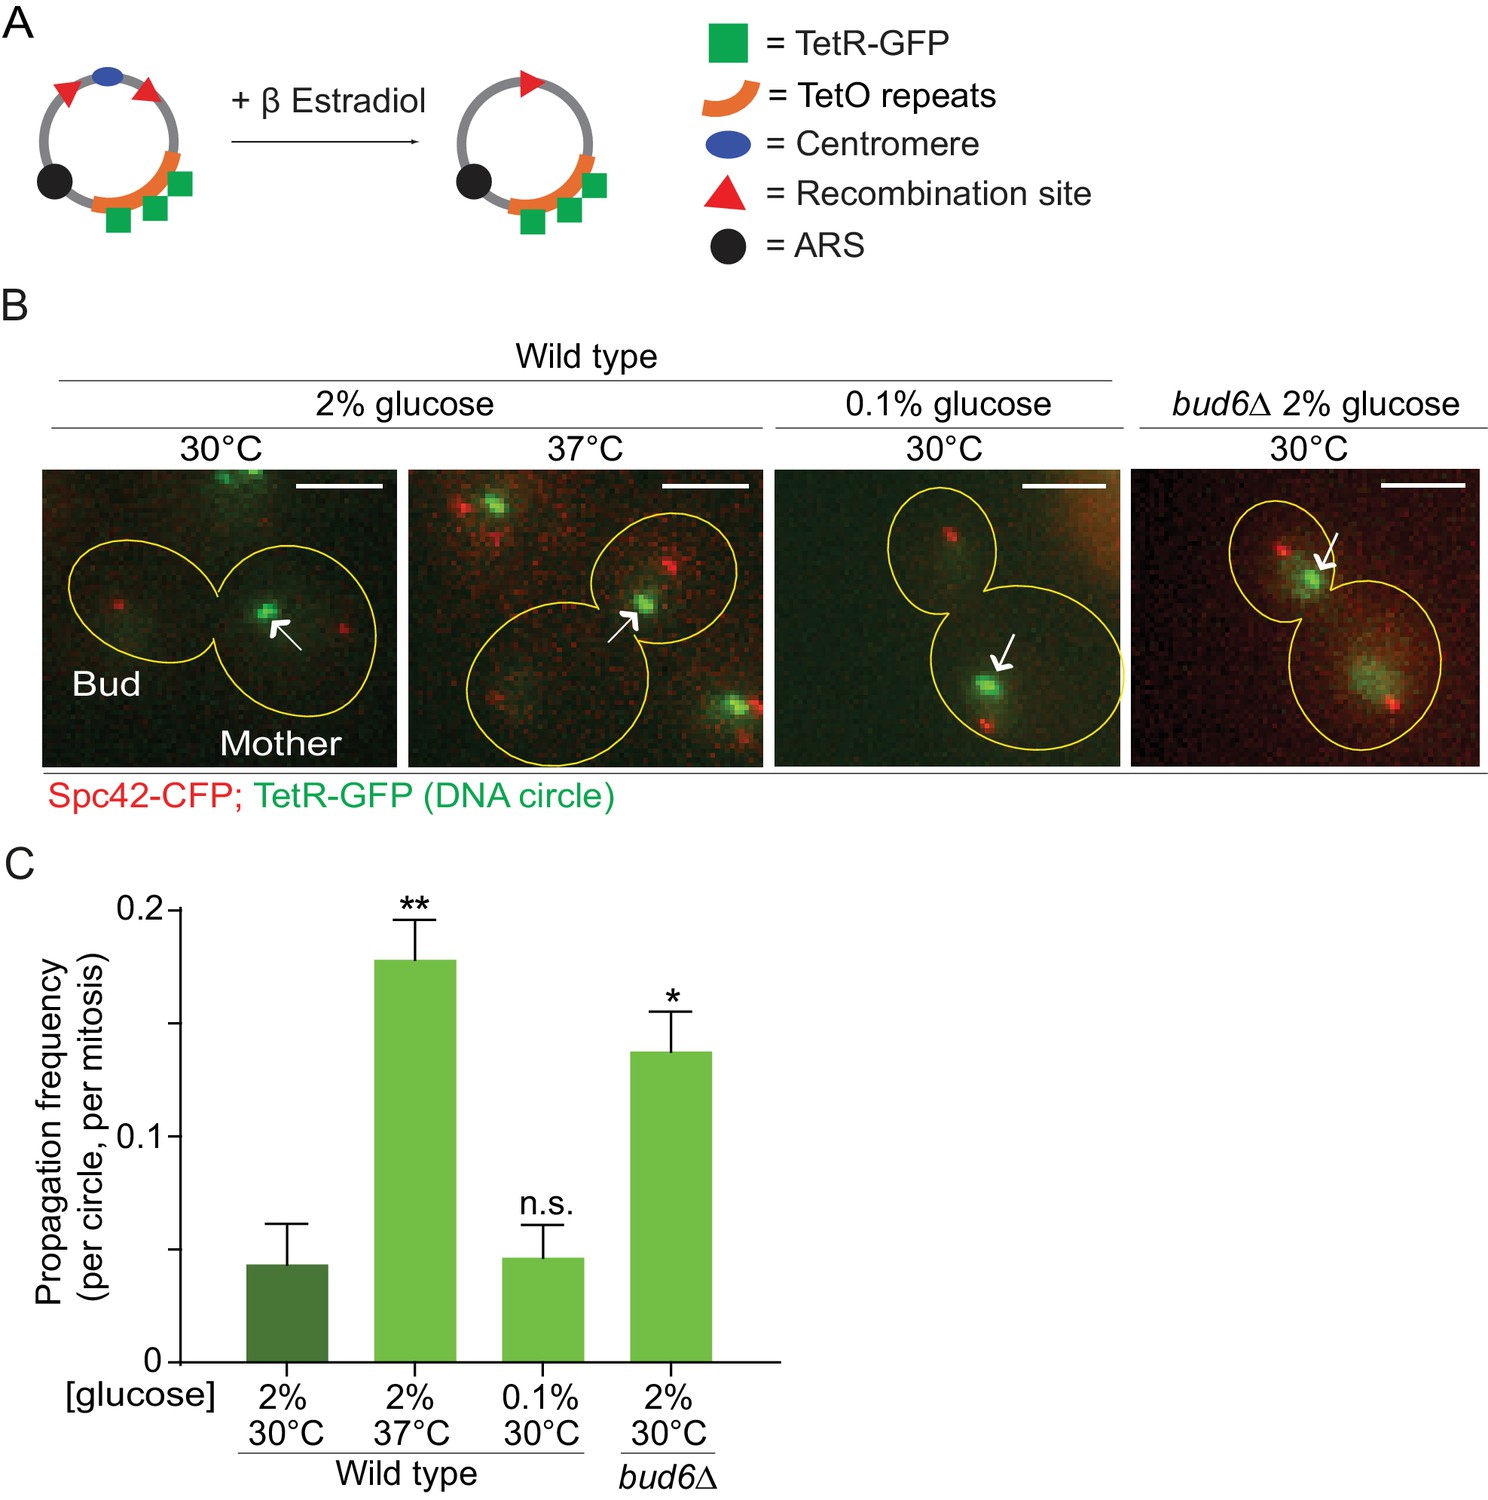
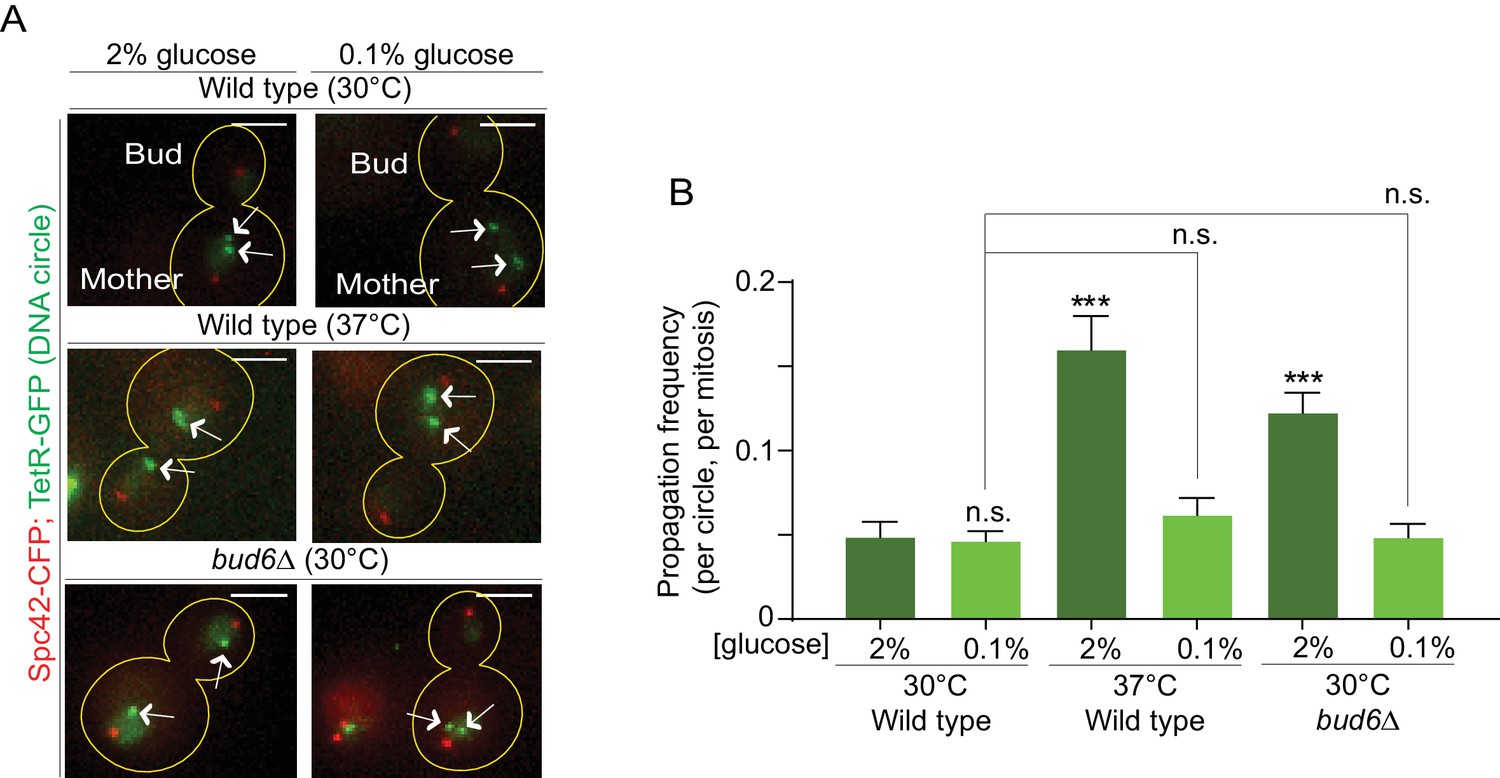
Heat stress reduces the confinement of DNA circles in the mother cell upon mitosis.
(A) Model DNA circle with excisable centromere (blue) and TetO repeats (orange), which can be labeled with TetR-GFP (green) for visualization. ARS is an autonomously replicating sequence (black). (B) Examples of anaphase cells (maximum intensity projection, outline of the cell in yellow, scale bar is 3 µm). The arrows indicate DNA circles. The SPBs appear in red due to image processing. (C) Propagation frequency: mean ± SEM of three experiments (six for calorie restriction) with 31 ≤ n ≤ 122 cells per experiment; unpaired t-test, **p<0.01.
Figure 2 with 2 supplements
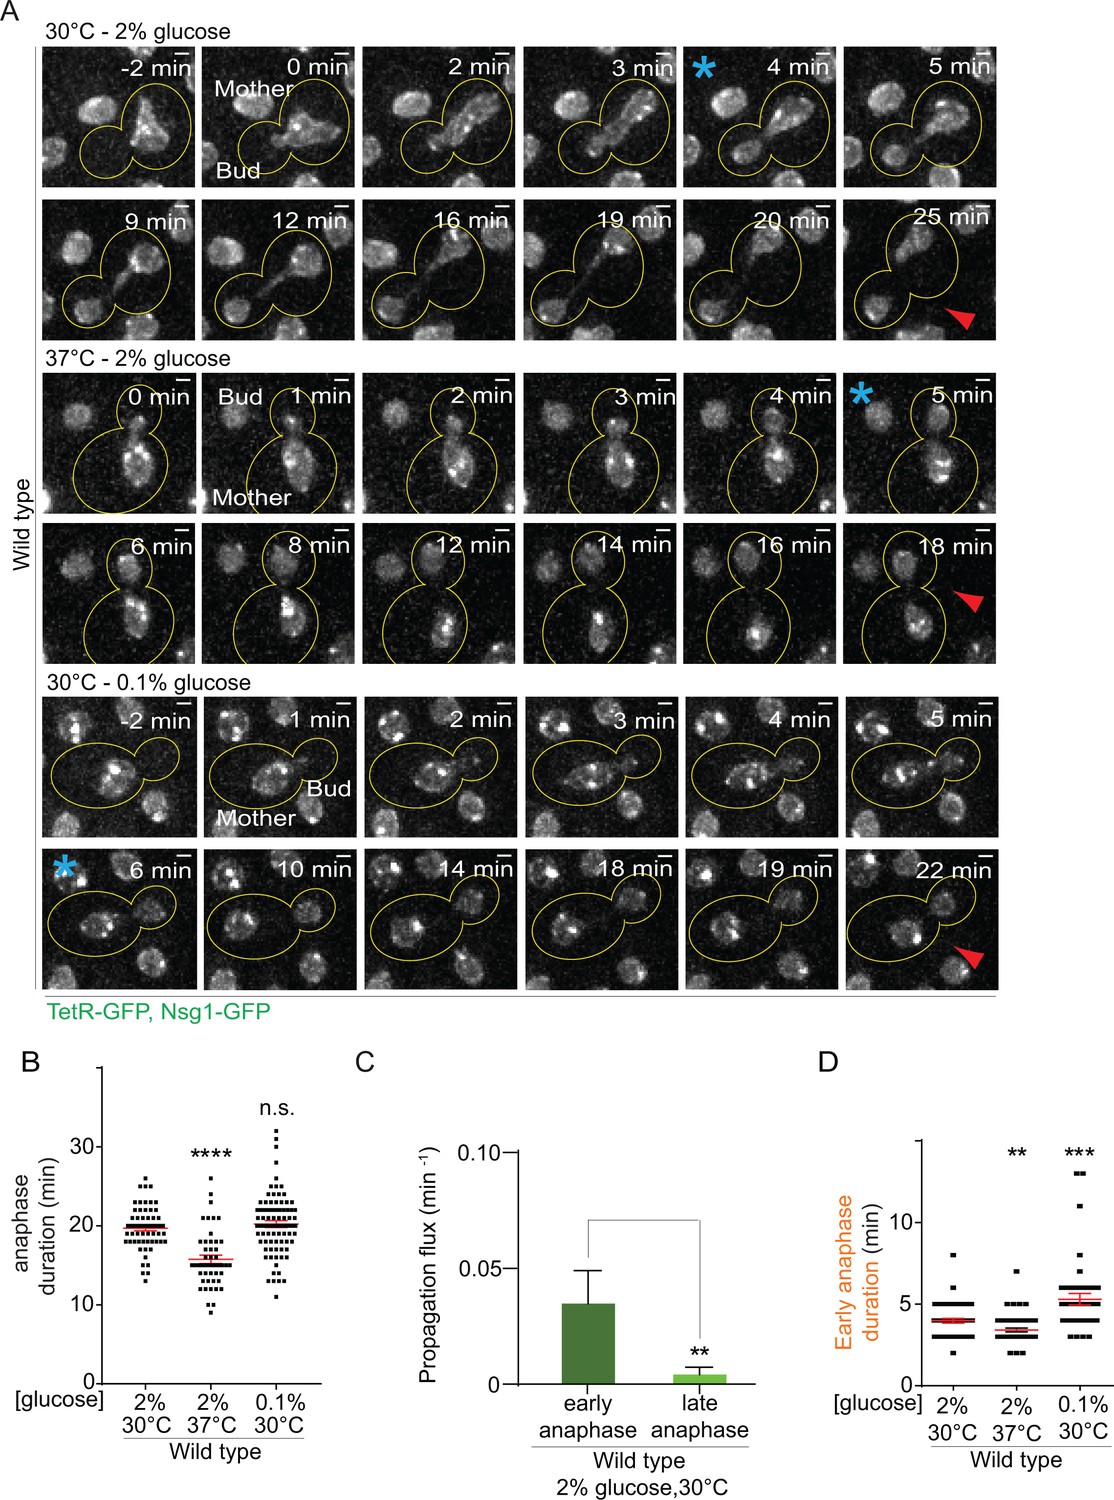
Changes in anaphase duration cannot explain DNA circle segregation upon heat stress.
(A) Dividing nuclei used to measure the duration of anaphase (maximum intensity projection, outline of the cell in yellow, scale bar is 1 µm). Bright dots represent either DNA circles or, if at the opposite sides of the nucleus, the SPBs. For the purpose of the analysis presented here, we measured only the timing of nuclear division without looking at the behavior of the DNA circles. 0 min was set as the beginning of anaphase. The red arrow marks karyokinesis, whereas the blue asterisks mark the end of early anaphase (see Figure 2—figure supplement 1). B) Quantification of anaphase duration (mean ±SEM of three to four independent experiments with 47 < n < 83 cells and two or three independent clones per condition). Non-parametric Mann-Whitney U test: ****p<0.0001. (C) The propagation flux of individual DNA circles through the bud neck (mean ± SD passage frequency per minute in early and late anaphase of four independent experiments and three independent clones). Number of cells is 51 ≤ n ≤ 104 cells per anaphase stage; Unpaired t-test, **p<0.01. (D) Quantification of early anaphase duration (mean ±SEM of two to three independent experiments per condition), 47 ≤ n ≤ 53 cells per condition. Non-parametric Mann-Whitney U test: **p<0.01.
Figure 2—figure supplement 1
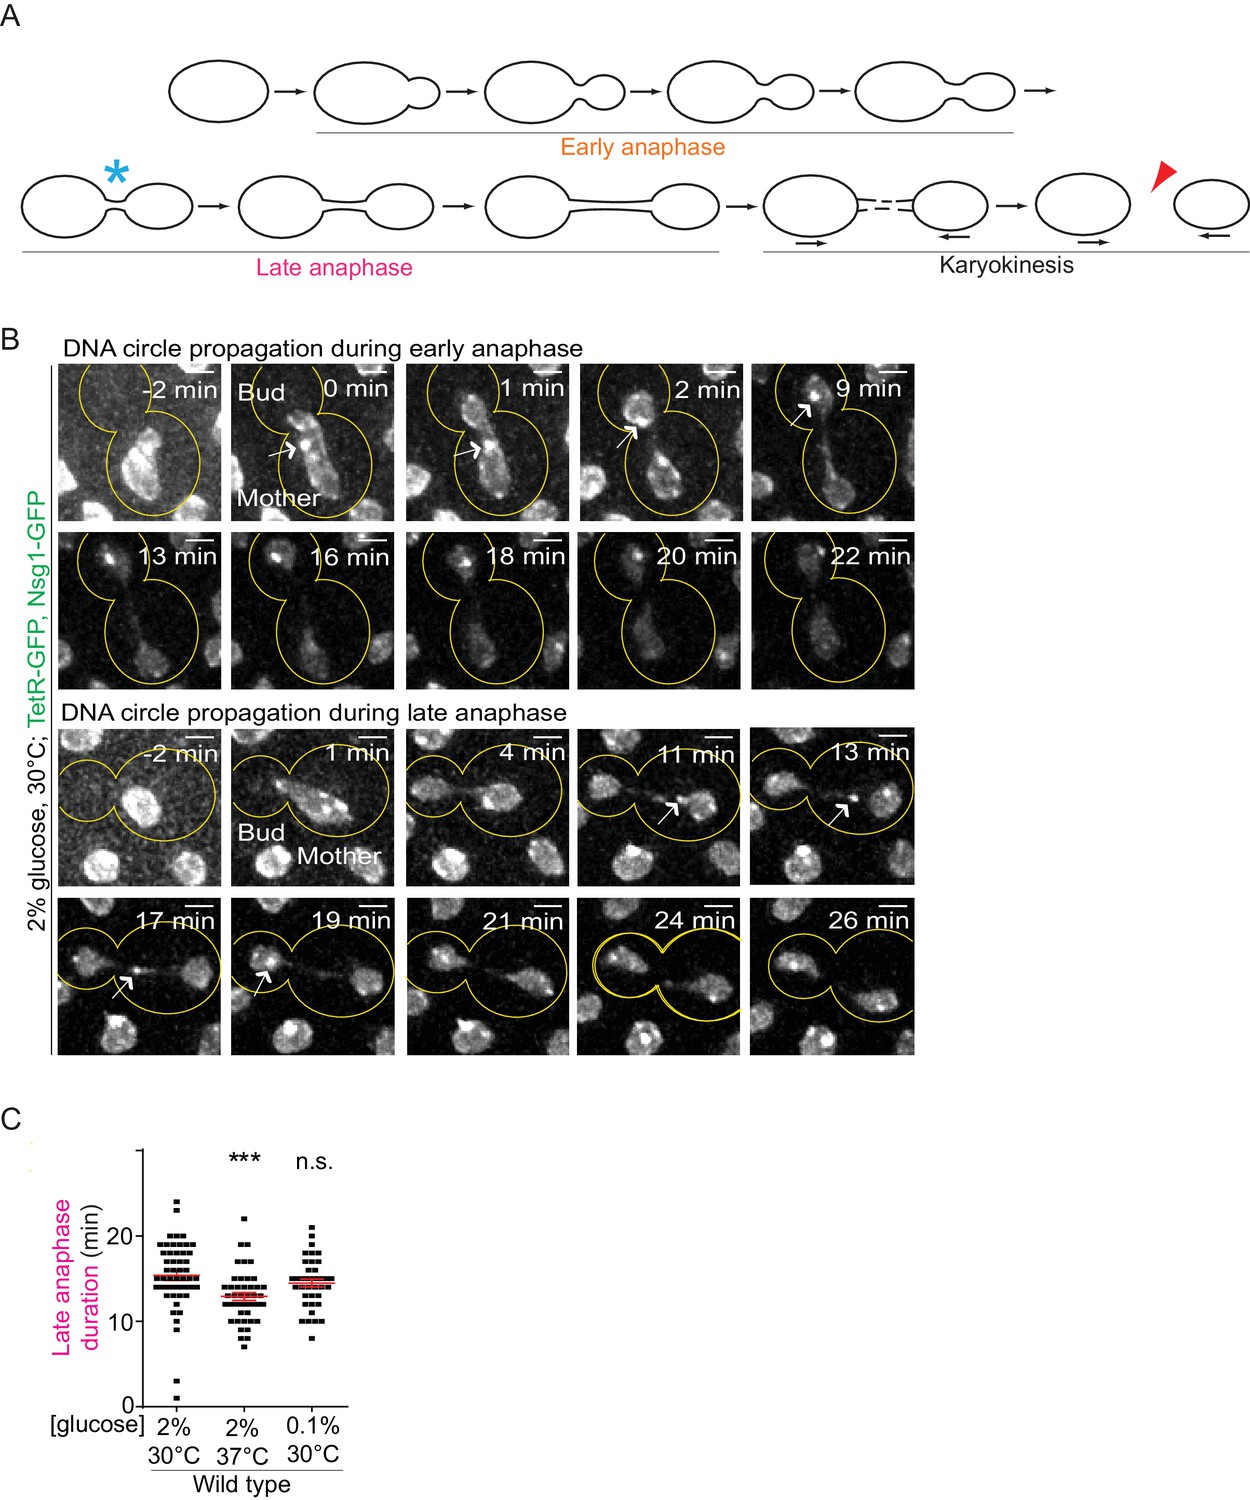
Changes in early or late anaphase duration cannot explain DNA circle segregation upon heat stress.
A) Schematic definition of anaphase stages, see text for details. (B) Dividing nuclei showing the followed DNA circle (arrow), during early and late anaphase (maximum intensity projection, outline of the cell in yellow, scale bar is 1 µm). Bright dots represent either DNA circles or, if at the opposite sides of the nucleus, the SPBs. 0 min was set as the beginning of anaphase (the frame when the nucleus starts entering into the bud). (C) Quantification of late anaphase duration (mean ±SEM of two to three independent experiments per condition), 39 ≤ n ≤ 50 cells per condition. Non-parametric Mann-Whitney U test: **p<0.01.
Figure 2—figure supplement 2
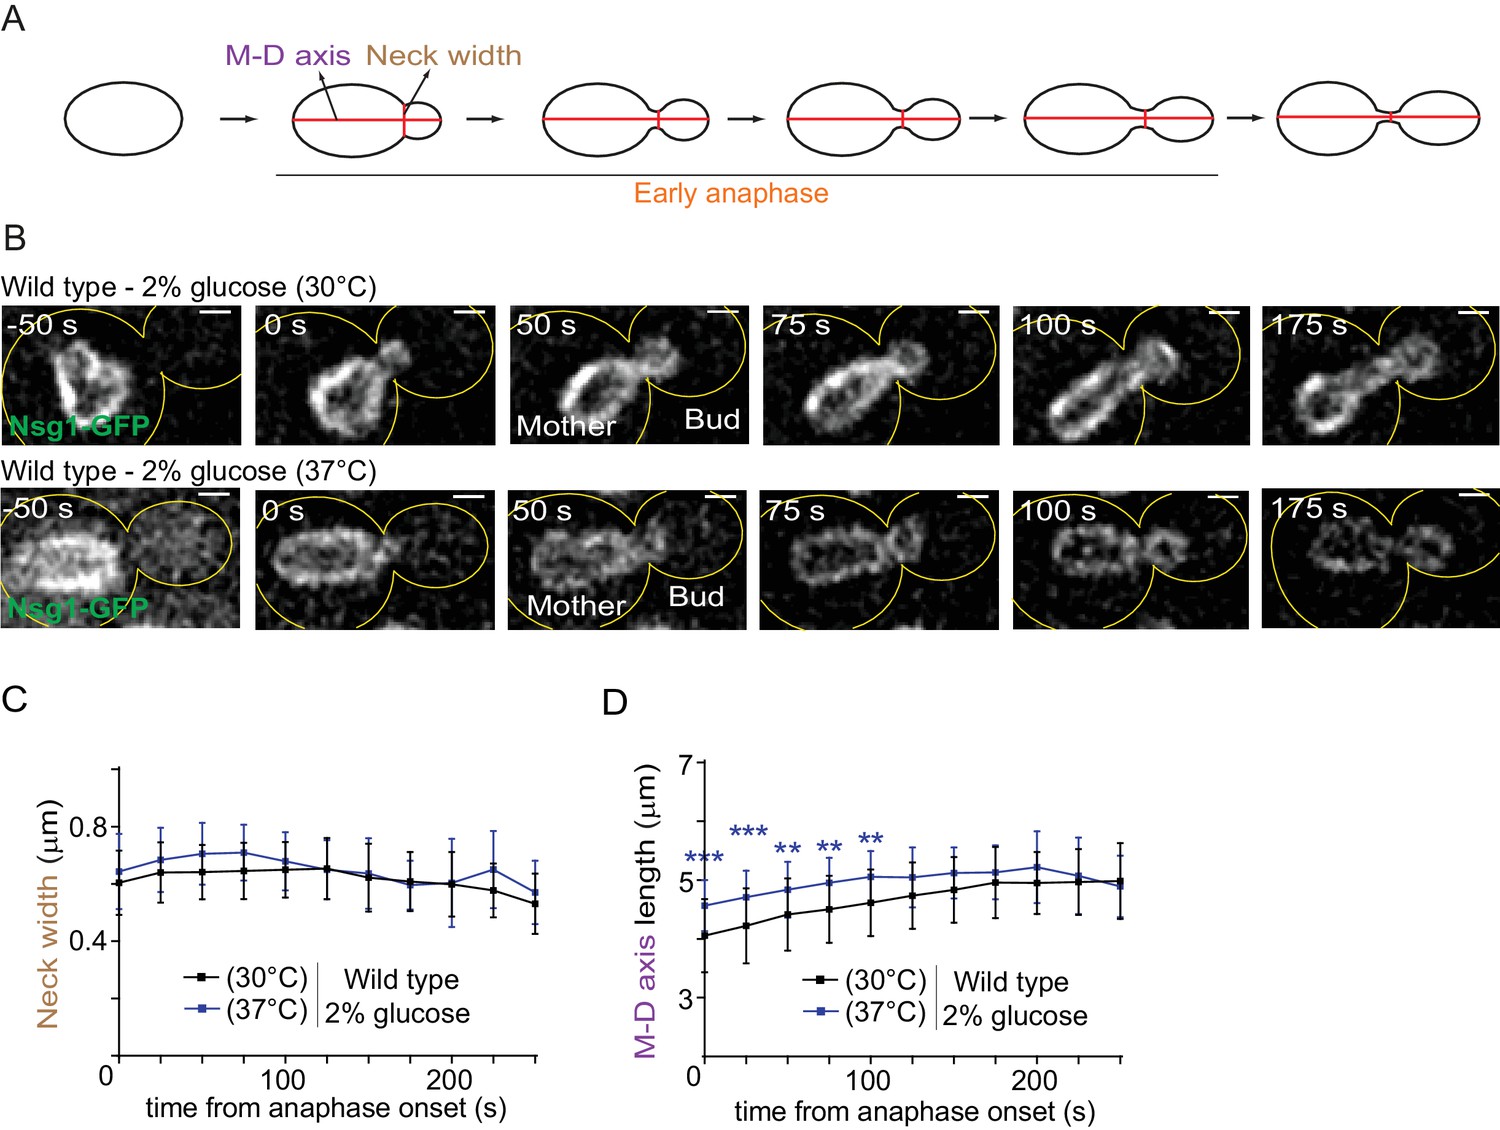
The morphology of the dividing nucleus is not significantly affected by heat stress.
(A) Scheme of the nuclear division imaged in B. B) Dividing nuclei in anaphase (average intensity projection, outline of the cell in yellow, scale bar is 1 µm). 0 s was set as the beginning of anaphase (the frame when the nucleus starts entering into the bud). (C–D) Quantification (Mean ± SD of 46 and 35 cells, respectively, for 30°C and 37°C, three to six independent pooled experiments) of the neck width and the mother-daughter axis length. ≥11 cells per time point were analyzed (for 225 and 250 s, this cut off was 4). 2-way ANOVA test, **p<0.01.
Figure 3 with 1 supplement
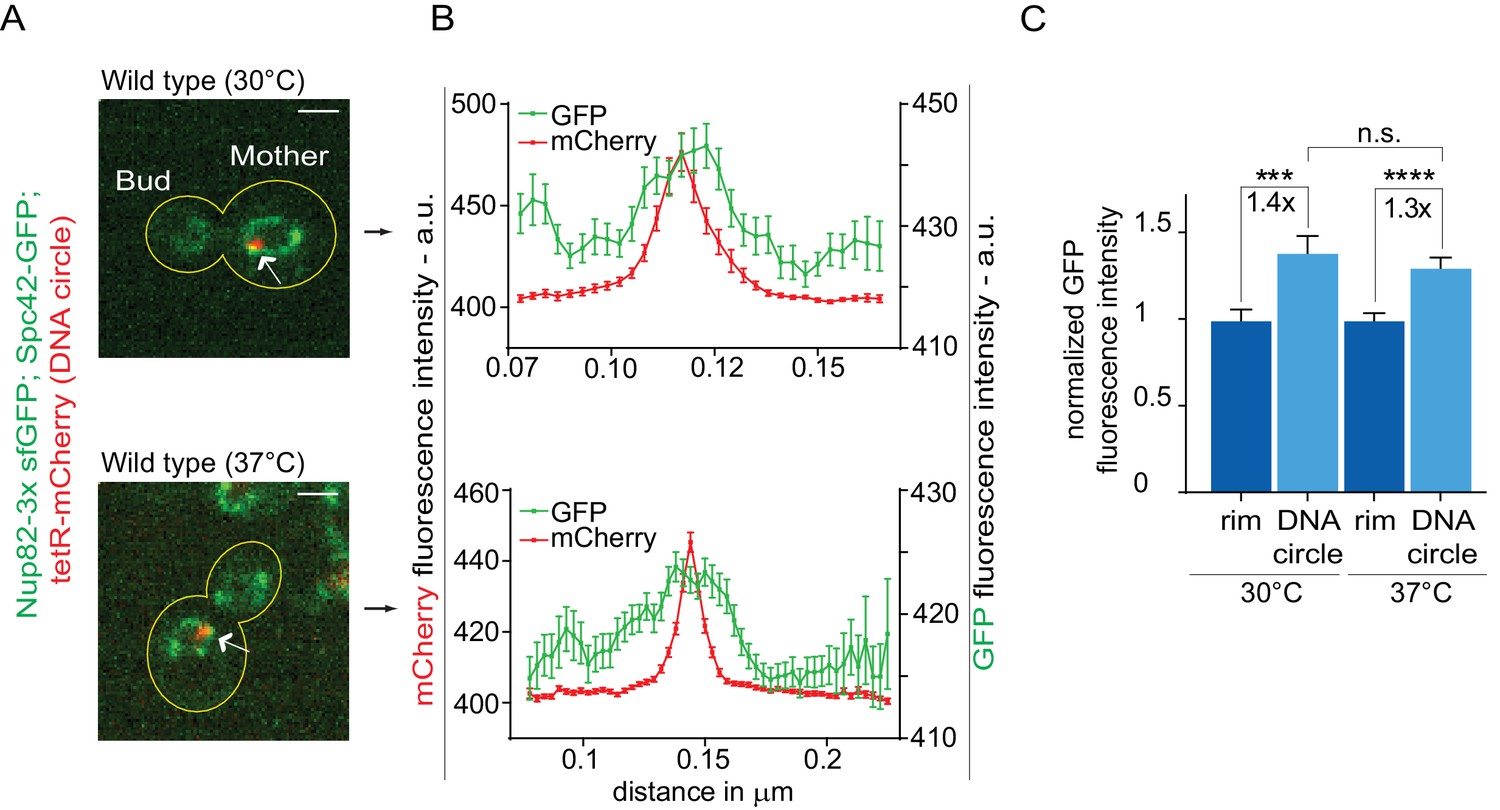
Heat stress does not affect the attachment of DNA circles to the NPCs.
(A) Representative anaphase nuclei (one focal plane, outline of the cell in yellow, scale bar is 1 µm). The DNA circle is in red (tetR-mCherry, arrow) and the NPCs in green (Nup82-3x sfGFP). (B) Fluorescence intensity profiles for Nup82-3x sfGFP were aligned with respect to the maximum intensity of the DNA circle tetR-mCherry intensity peak (Mean ± SEM). C) The mean Nup82-GFP fluorescence intensity at the entire rim of the nuclear envelope (normalized to 1) or locally at the DNA circle, from 41 ≤ n ≤ 105 cells per condition (mean ± SEM). The fold changes of Nup82-GFP intensity at the DNA circle versus the rest of the nuclear envelope are indicated. Four independent pooled experiments per condition. Unpaired t-test, ***p<0.001.
Figure 3—figure supplement 1

DNA circle are detached from NPCs in SAGA-mutant strain.
(A) Representative anaphase nuclei (one focal plane, outline of the cell in yellow, scale bar is 1 µm). The DNA circle is in red (tetR-mCherry, arrow) and the NPCs in green (Nup82-3x sfGFP). (B) Fluorescence intensity profiles for Nup82-3x sfGFP were aligned with respect to the maximum intensity of the DNA circle tetR-mCherry intensity peak (Mean ± SEM). (C) The mean Nup82-GFP fluorescence intensity at the entrie rim of the nuclear envelope (normalized to 1) or locally at the DNA circle, from 42 ≤ n ≤ 78 cells per condition (mean ± SEM). The fold changes of Nup82-GFP intensity at the DNA circle versus the rest of the nuclear envelope are indicated. Four independent pooled experiments per condition. Unpaired t-test.
Figure 4 with 1 supplement
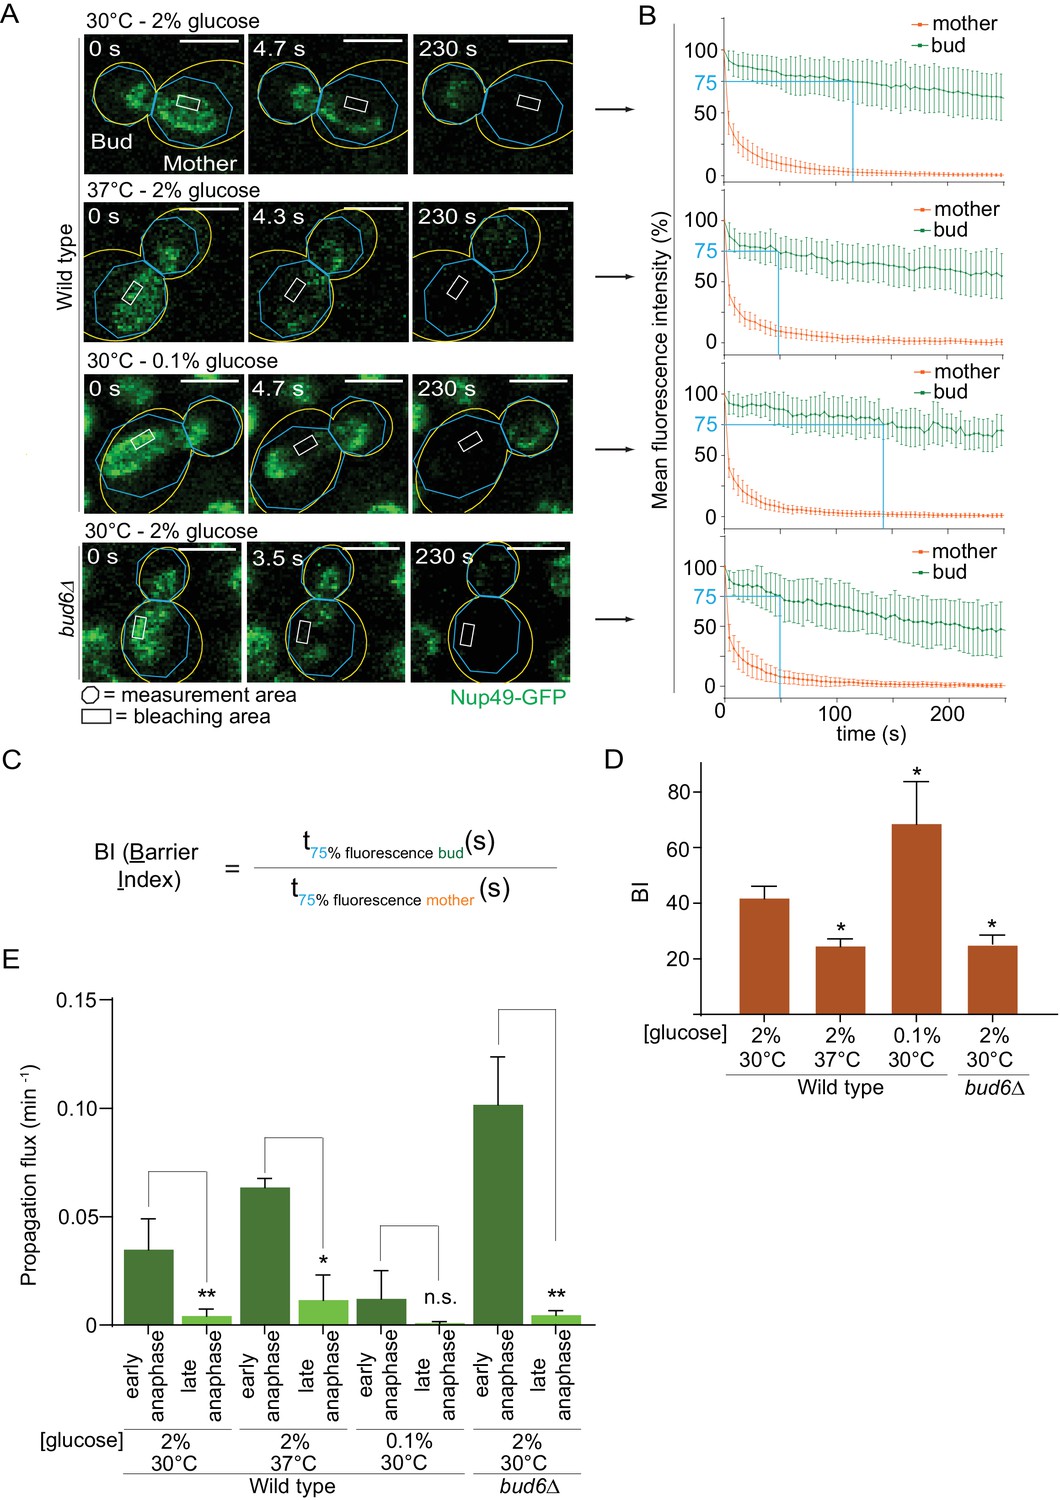
Heat stress and calorie restriction affect the nuclear diffusion barrier in opposite manners.
(A) Representative dividing nuclei (outline of the cell in yellow, scale bar is 3 µm). Areas of constant bleaching and fluorescence measurement are indicated. (B) Mean fluorescence intensity over time (±SD, 18 ≤ n ≤ 55 cells per condition). The blue lines illustrates the 75% threshold used to define the barrier index (see method for details). (C) Definition of the BI. t75% fluorescence is the time required for the fluorescence to decrease to 75% of its initial value. The BI is defined as the ratio of t75% fluorescence in the non-bleached (bud) compartment to that of the bleached (mother) compartment. (D) BI quantification of measurements in the nuclear envelope (±SEM, unpaired t-test, *p<0.05). (E) The propagation flux of individual DNA circles through the bud neck (mean ±SD passage frequency per minute in early and late anaphase of two to four independent experiments and three independent clones per condition). Number of cells as follows: 37°C (2% glucose), 51 ≤ n ≤ 104 cells per anaphase stage; 30°C (0.1% glucose), 35 ≤ n ≤ 39 cells per anaphase stage; bud6Δ mutant cells, 21 ≤ n ≤ 27 cells per anaphase stage. Unpaired t-test, *p<0.05. Note that the data for 30°C (2% glucose) is a duplication from Figure 2, for comparison purposes.
Figure 4—figure supplement 1
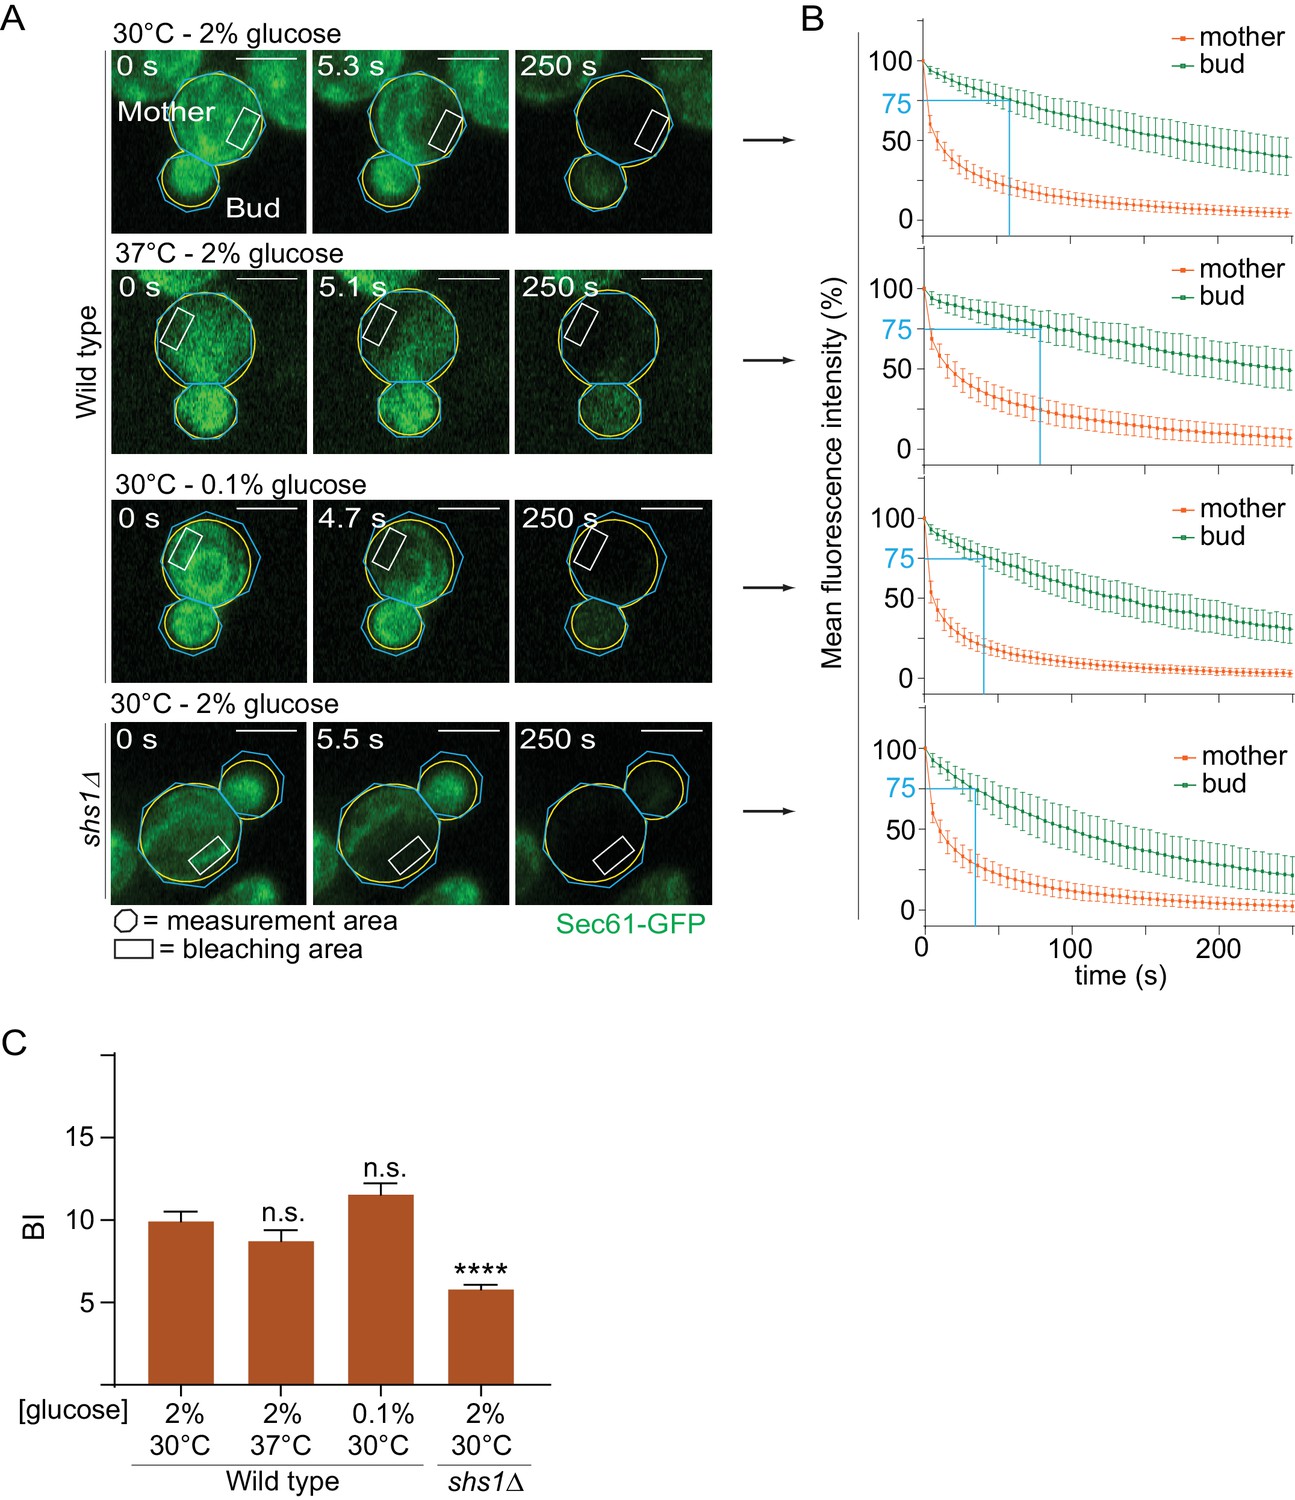
Heat stress and calorie restriction do not affect the cortical ER diffusion barrier.
(A) Representative metaphase cells (outline of the cell in yellow, scale bar is 3 µm). Areas of constant bleaching and fluorescence measurement are indicated. (B) Mean fluorescence intensity over time (±SD, 26 ≤ n ≤ 52 cells per condition). (C) BI quantification of measurements performed in the ER (±SEM, unpaired t-test, ****p<0.0001).
Figure 5 with 2 supplements
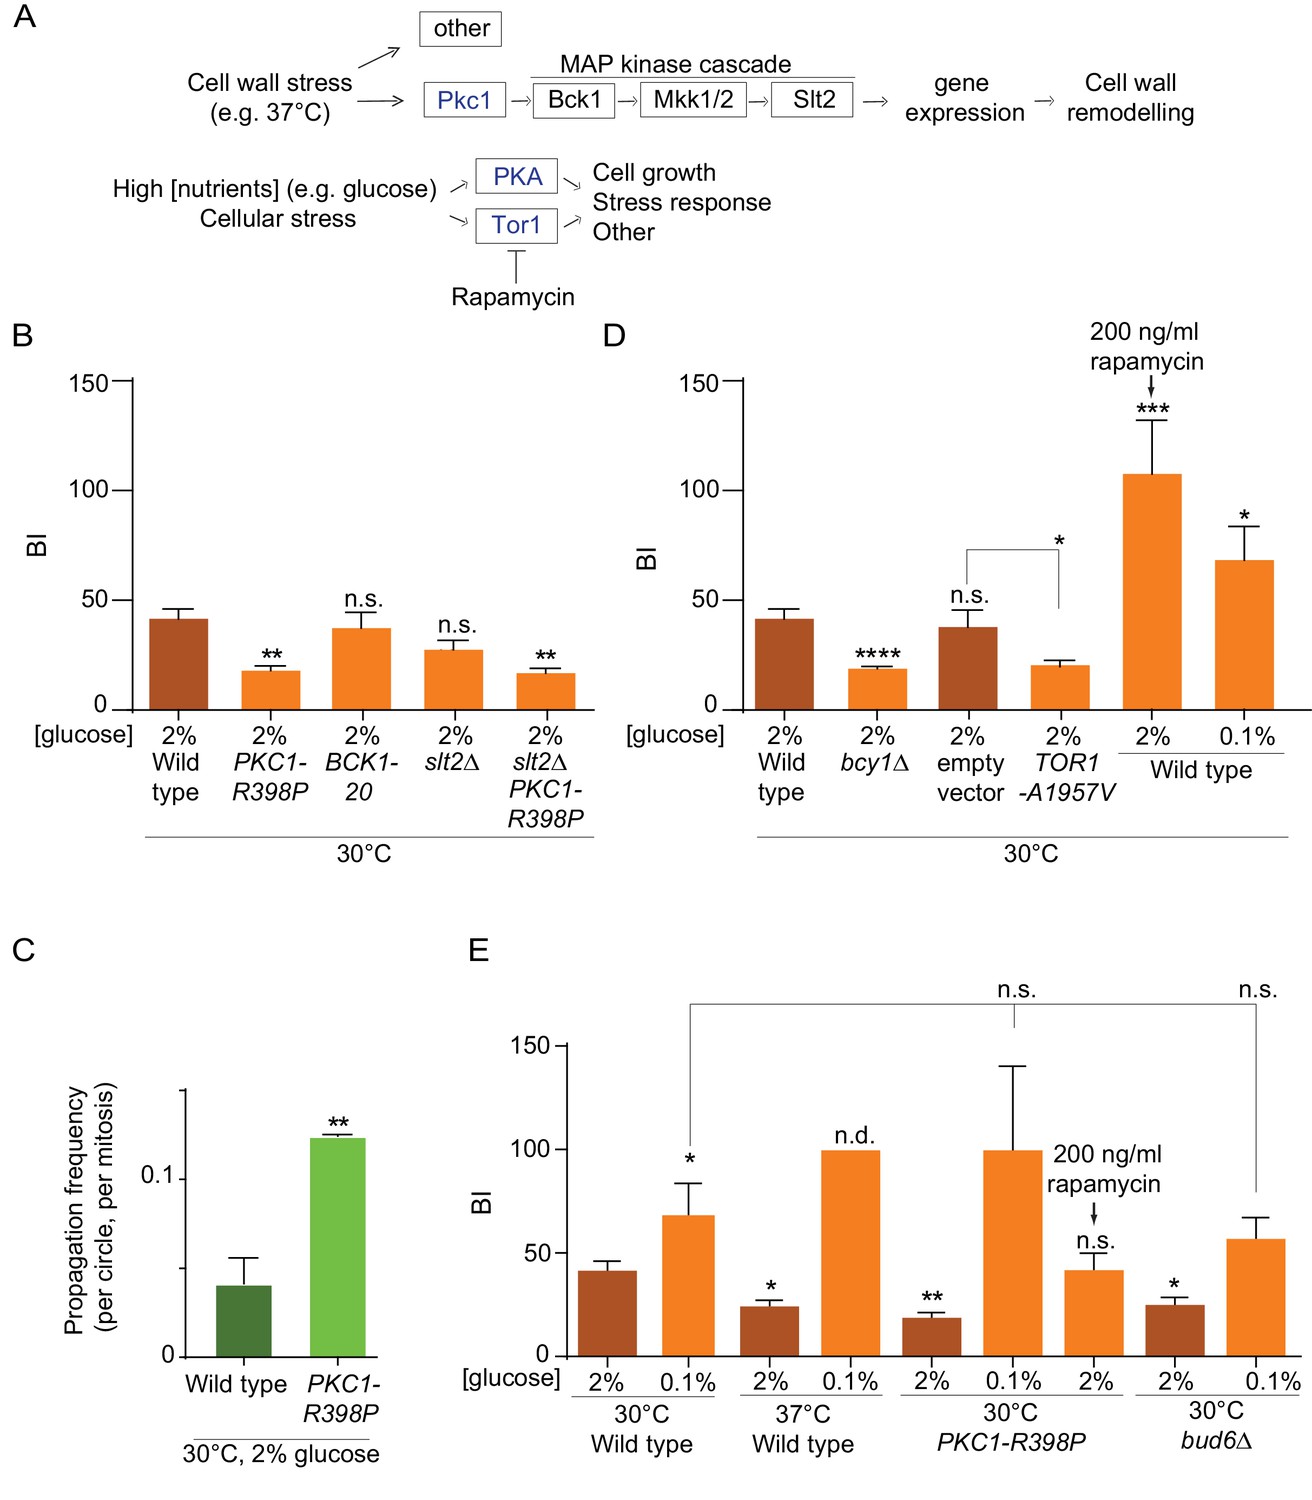
Effect of PKA, Pkc1 and Tor1 stress response kinases on the nuclear diffusion barrier.
(A) Simplified scheme of the Pkc1, Tor1 and PKA stress response pathways. (B) Quantification of BI in nuclear envelope upon perturbations in cell wall integrity pathway. PKC1-R398P and BCK1-20 are constitutive active alleles of Pkc1 and Bck1. (C) Propagation frequency: mean ±SEM of three experiments with 27 ≤ n ≤ 51 cells per experiment; unpaired t-test, **p<0.01. (D) Quantification of BI in the nuclear envelope upon perturbations in PKA and Tor1 pathway (E) and after restoration of the diffusion barrier. TOR1-A1957V is a constitutive active allele of Tor1. For (B), (D), (E): BI ± SEM, 16 ≤ n ≤ 56 cells per condition, unpaired t-test, *p<0.05. For comparison purposes: the BI of wild-type cells (37°C and 0.1% glucose) was arbitrarily set to 100 (n.d., see main text). The BI values of wild type cells (2% and 0.1% glucose, 30°C and 37°C) and of bud6Δ (2% glucose, 30°C) in Figure 5B,D and E are the same as in Figure 4D, the BI of PKC1-R398P mutant cells (2% glucose, 30°C) in Figure 5E is the same as in Figure 5B.
Figure 5—figure supplement 1
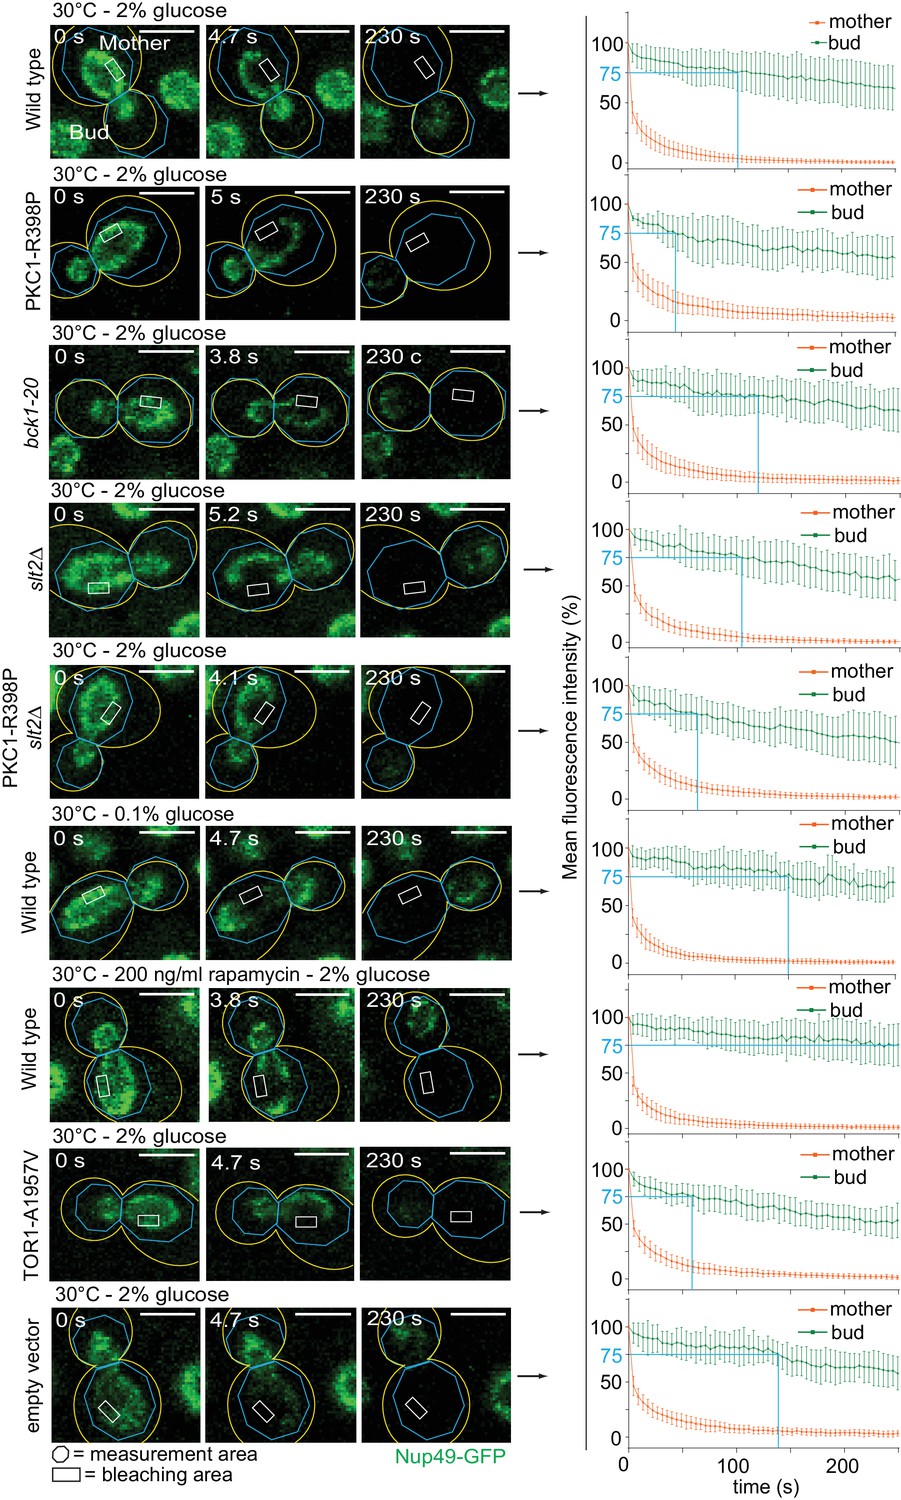
Effect of the CWI and Tor1 pathways on the nuclear diffusion barrier.
Representative dividing nuclei (outline of the cell in yellow, scale bar is 3 µm). Areas of constant bleaching and fluorescence measurement are indicated. Graphs show the mean fluorescence intensity over time (±SD, 16 ≤ n ≤ 19 cells per condition). For comparison purposes: the fluorescence intensity profiles of wild-type cells (2% glucose at 30°C and 2% glucose at 37°C) are the same as in Figure 4B.
Figure 5—figure supplement 2

Effect of PKA and Tor1 on the nuclear diffusion barrier in response to heat stress.
Representative dividing nuclei (outline of the cell in yellow, scale bar is 3 µm). Areas of constant bleaching and fluorescence measurement are indicated. Graphs show the mean fluorescence intensity over time (±SD, 18 ≤ n ≤ 56 cells per condition). For comparison purposes: the fluorescence intensity profiles of wild-type cells (0.1% glucose at 30°C and 2% glucose at 37°C) and of bud6Δ mutant cells (2% glucose, 30°C) are the same as in Figure 4B.
Figure 6
Restoring the nuclear barrier during heat stress rescues DNA circles confinement in the mother cell.
(A) Examples of anaphase cells (max intensity projection, outline of the cell in yellow, scale bar is 3 µm). The arrows indicate DNA circles. The SPBs appear in red due to image processing. (B) Propagation frequency, mean ± SEM of several independent experiments per condition as follows: N = 6 (3 from Figure 1C + 3 new) for both wild type (52 ≤ n ≤ 125 per experiment) and bud6Δ mutant cells (61 ≤ n ≤ 122 per experiment) at 30°C (2% glucose); N = 6 for both wild type (31 ≤ n ≤ 74 per experiment) and bud6Δ mutant cells (32 ≤ n ≤ 156 per experiment) at 30°C (0.1% glucose); N = 5 for wild-type cells at 37°C (0.1% glucose, 72 ≤ n ≤ 184 per experiment); N = 4 (3 from Figure 1C + 1 new) for wild-type cells at 37°C (2% glucose, 74 ≤ n ≤ 98 per experiment). Unpaired t-test, ***p<0.001. For comparison purposes the data of wild-type cells at 30°C (0.1% glucose) is the same as in Figure 1.
Figure 7
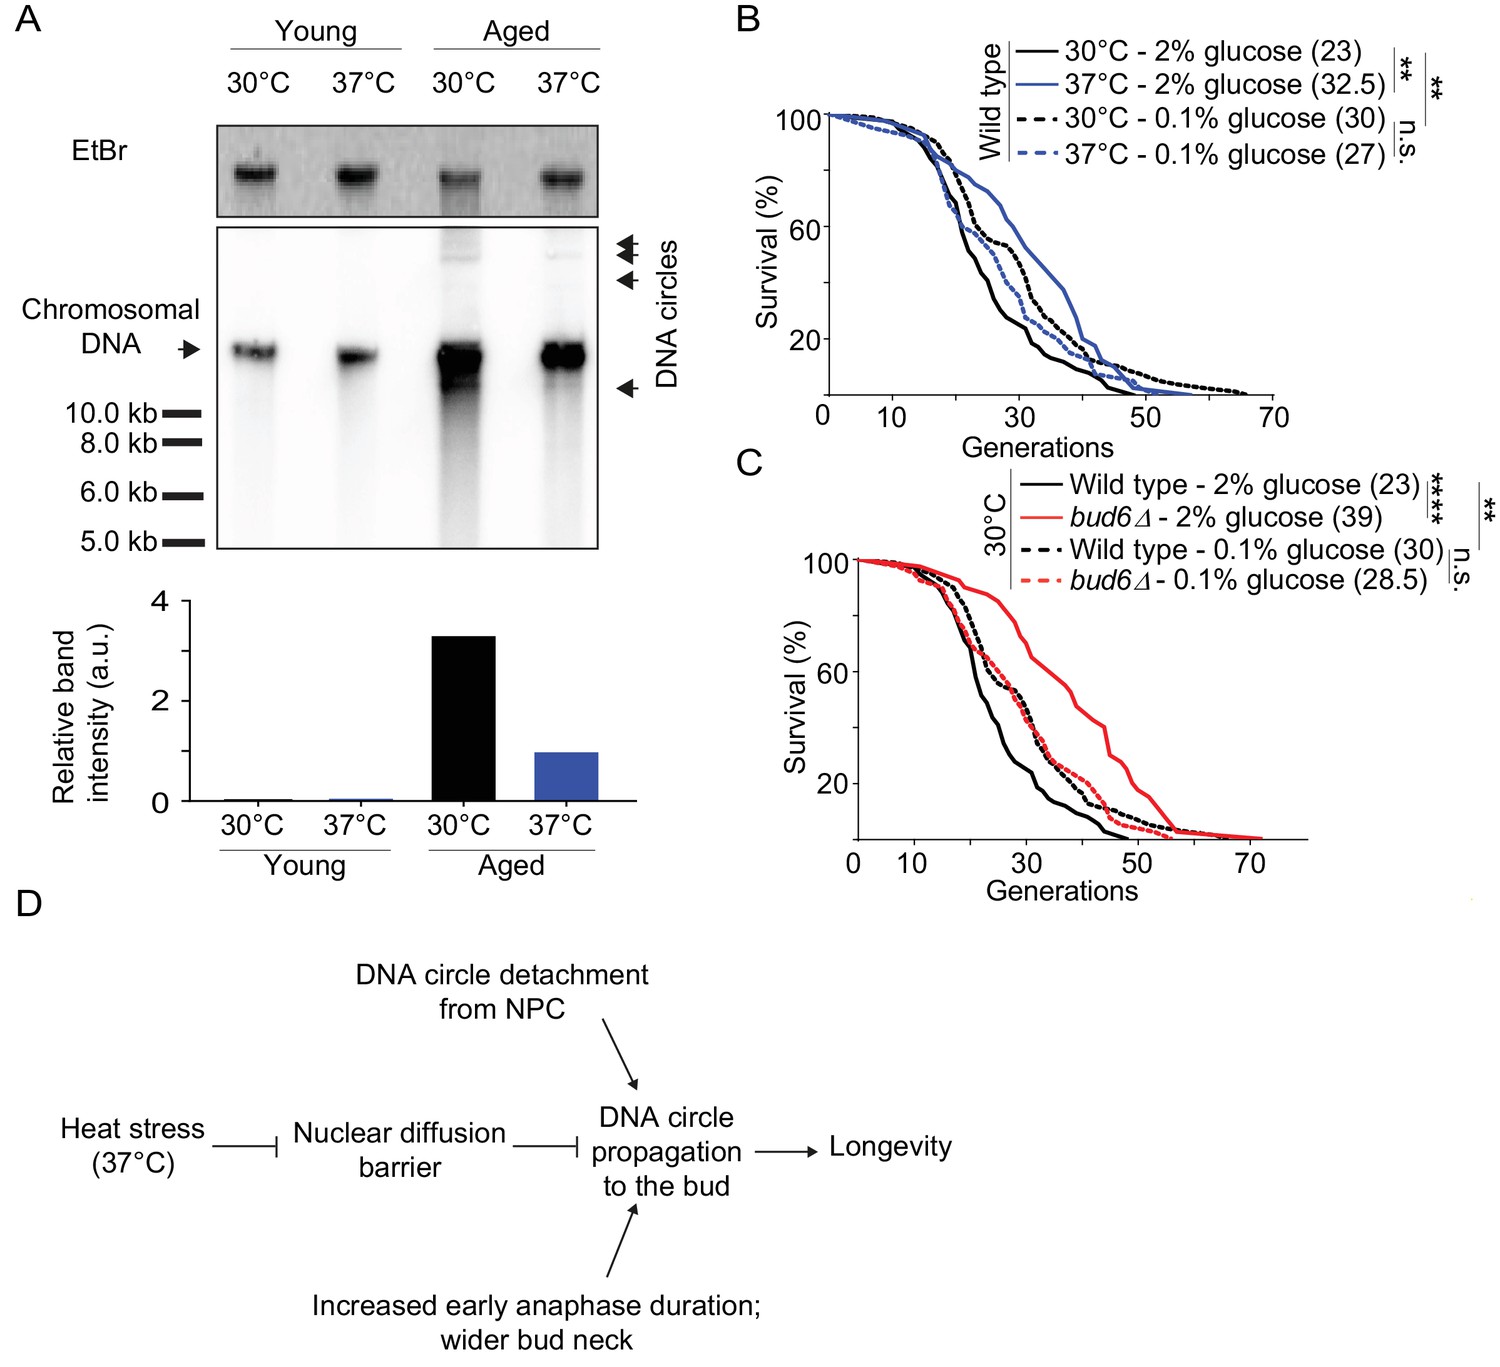
Impaired nuclear barrier strength correlates with an increased lifespan.
(A) Detection of DNA circles by Southern blotting in young and aged cells grown at 30°C and 37°C (2% glucose). Young cells were 0–1 generation and aged cells were 16 generations old. The quantification of the relative band intensity is based on four bands of concatenated DNA circles. Band sizes of a DNA marker are indicated. (B–C) Lifespan analysis. Median lifespan (in brackets) of 40 ≤ n ≤ 79 cells per condition. two independent pooled experiments per condition. For comparison purposes: the lifespan curves of wild type cells (2% and 0.1% glucose, 30°C) in Figure 7A and Figure 7B are the same. Log Rank (Mantel-Cox) test, **p<0.01. (D) Simplified: heat stress specifically weakens the nuclear diffusion barrier, thus fostering a more symmetric segregation of DNA circles to the daughter and accordingly promoting longevity.
Tables
Table 1
Yeast strains used in the study
https://doi.org/10.7554/eLife.28329.016| yYB number | Mating type | Genotype |
|---|---|---|
| 7828 | a | nup49::NUP49-GFP:HIS3; his3∆1 leu2∆0 ura3∆0 met15∆0 |
| 4223 | a | nup49::NUP49-GFP:HIS3; bud6::natNT2; his3∆1 leu2∆0 ura3∆0 met15∆0 |
| 10411 | a | sec61::SEC61-GFP:hpnNT1; his3∆0 leu2∆0 met15∆0 ura3∆0 – clone 1 |
| 10412 | a | sec61::SEC61-GFP:hpnNT1; his3∆0 leu2∆0 met15∆0 ura3∆0 – clone 2 |
| 10413 | a | sec61::SEC61-GFP:hpnNT1; his3∆0 leu2∆0 met15∆0 ura3∆0 – clone 3 |
| 1879 | α | sec61::SEC61-GFP:TRP1; shs1::KAN; his3∆200 trp1∆63 leu2∆0 ura3-52 ade2-101 lys2-801 – clone1 |
| 1880 | a | sec61::SEC61-GFP:TRP1; shs1::KAN; his3∆200 trp1∆63 leu2∆0 ura3-52 ade2-101 lys2-801 – clone2 |
| 6770 | a | nup49::NUP49-GFP:HIS3; tor1::TOR1 A1975V: hpnNT1; his3-∆1 leu2∆0 met15∆0 ura3∆0 |
| 4229 | a | nup49::NUP49-GFP:HIS3; slt2::kanMX4; his3∆1 leu2∆0 ura3∆0 met15∆0 |
| 4231 | a | nup49::NUP49-GFP:HIS3; slt2::kanMX4; his3∆1 leu2∆0 ura3∆0 met15∆0 Plasmid: pYB 1273 (Table 2) carrying PKC1-R398P |
| 10622 | a | nup49::NUP49-GFP:HIS3; bcy1::hphNTI his3∆1 leu2∆0 ura3∆0 met15∆0 – clone 1 |
| 10623 | a | nup49::NUP49-GFP:HIS3; bcy1::hphNTI his3∆1 leu2∆0 ura3∆0 met15∆0 – clone 2 |
| 10624 | a | nup49::NUP49-GFP:HIS3; bcy1::hphNTI his3∆1 leu2∆0 ura3∆0 met15∆0 – clone 3 |
| 4221 | a | spc42::SPC42-CFP:kanMX4; trp1::GAL4-EBD:TRP1; leu2::TETR-GFP:LEU2; his3::pGAL-REC:HIS3; ura3-52 ade2-101 trp1-∆63 Plasmid: pPCM14 (224 tetO-REC-URA3-CEN-REC-LEU2) |
| 6099 | a | spc42::SPC42-CFP:kanMX4; trp1::GAL4-EBD:TRP1; leu2::TETR-GFP:LEU2; his3::pGAL-REC:HIS3; ura3-52 Plasmid: pPCM14 (224 tetO-REC-URA3-CEN-REC-LEU2) |
| 4222 | a | spc42::SPC42-CFP:kanMX4; trp1::GAL4-EBD:TRP1; leu2::TETR-GFP:LEU2; his3::pGAL-REC:HIS3; bud6::natNT2; ura3-52 ade2-101 trp1-∆63 Plasmid: pPCM14 (224 tetO-REC-URA3-CEN-REC-LEU2) – clone 1 |
| 5547 | a | spc42::SPC42-CFP:kanMX4; trp1::GAL4-EBD:TRP1; leu2::TETR-GFP:LEU2; his3::pGAL-REC:HIS3; bud6::natNT2; ura3-52 ade2-101 trp1-∆63 Plasmid: pPCM14 (224 tetO-REC-URA3-CEN-REC-LEU2) – clone 2 |
| 6521 | a | spc42::SPC42-CFP:kanMX4; trp1::GAL4-EBD:TRP1; leu2::TETR-GFP:LEU2; his3::pGAL-REC:HIS3; bud6::natNT2; ura3-52 Plasmid: pPCM14 (224 tetO-REC-URA3-CEN-REC-LEU2) – clone 1 |
| 6522 | a | spc42::SPC42-CFP:kanMX4; trp1::GAL4-EBD:TRP1; leu2::TETR-GFP:LEU2; his3::pGAL-REC:HIS3; bud6::natNT2; ura3-52 Plasmid: pPCM14 (224 tetO-REC-URA3-CEN-REC-LEU2) – clone 2 |
| 6523 | a | spc42::SPC42-CFP:kanMX4; trp1::GAL4-EBD:TRP1; leu2::TETR-GFP:LEU2; his3::pGAL-REC:HIS3; bud6::natNT2; ura3-52 Plasmid: pPCM14 (224 tetO-REC-URA3-CEN-REC-LEU2) – clone 3 |
| 7301 | α | nsg1::NSG1-GFP:HIS3; spc42::SPC42-CFP:kanMX4; trp1::GAL4-EBD:TRP1; leu2::TETR-GFP:LEU2; his3::pGAL-REC:HIS3; ura3-52 Plasmid: pPCM14 (224 tetO-REC-URA3-CEN-REC-LEU2) – clone 1 |
| 7302 | α | nsg1::NSG1-GFP:HIS3; spc42::SPC42-CFP:kanMX4; trp1::GAL4-EBD:TRP1; leu2::TETR-GFP:LEU2; his3::pGAL-REC:HIS3; ura3-52 Plasmid: pPCM14 (224 tetO-REC-URA3-CEN-REC-LEU2) – clone 2 |
| 5532 | a | nsg1::NSG1-GFP:HIS3; his3∆1 leu2∆0 ura3∆0 met15∆0 |
| 6648 | a | nup82::NUP82-3sfGFP:kanMX4; PURA3-TETR-mCherry:kanMX4; spc42::SPC42-yeGFP:hphNT1; his3::PGAL-REC:HIS3; trp1::GAL4-EBD:TRP1; ade2-101; Plasmid: pPCM14 (224 tetO-REC-URA3-CEN-REC-LEU2) – clone 1 |
| 6649 | a | nup82::NUP82-3sfGFP:kanMX4; PURA3-TETR-mCherry:kanMX4; spc42::SPC42-yeGFP:hphNT1; his3::PGAL-REC:HIS3; trp1::GAL4-EBD:TRP1; ade2-101; Plasmid: pPCM14 (224 tetO-REC-URA3-CEN-REC-LEU2) – clone 2 |
| 6765 | a | gcn5::natNT2; nup82::NUP82-3sfGFP:kanMX4; PURA3-TETR-mCherry:kanMX4; spc42::SPC42-yeGFP:hphNT1; his3::PGAL-REC:HIS3; trp1::GAL4-EBD:TRP1; ade2-101; Plasmid: pPCM14 (224 tetO-REC-URA3-CEN-REC-LEU2) – clone 1 |
| 6752 | a | gcn5::natNT2; nup82::NUP82-3sfGFP:kanMX4; PURA3-TETR-mCherry:kanMX4; spc42::SPC42-yeGFP:hphNT1; his3::PGAL-REC:HIS3; trp1::GAL4-EBD:TRP1; ade2-101; Plasmid: pPCM14 (224 tetO-REC-URA3-CEN-REC-LEU2) – clone 2 |
| 3415 | a | ade2::hisG his3 leu2 lys2 ura3Δ0 trp1Δ63 hoΔ::PSCW11-cre-EBD78-NatMX loxP-UBC9-loxP-LEU2 loxP-CDC20-Intron-loxP-HPHMX |
| 3201 | a | bud6::kanMX4; his3Δ1 leu2Δ0 met15Δ0 ura3Δ0 |
| 962 | a | his3Δ1 leu2Δ0 met15Δ0 ura3Δ0 |
| 14902 | a | SPC42-CFP:kanMX4 Gal4-EBD:TRP1 leu2::LEU2 TetR-GFP his::HIS3 pGAL-Cre ura3-52 trp1-∆63 ADE2::NatMX Plasmid: pPCM14 (224 tetO-REC-URA3-CEN-REC-LEU2); pYB1273 |
Table 2
Plasmids used in the study
https://doi.org/10.7554/eLife.28329.017| pYB number | Backbone | Description |
|---|---|---|
| 1309* | pRS315 | LEU2, CEN/ARS, HA3-TOR1-A1957V |
| 1273† | YCp50 | URA3, CEN, PKC1-R398P |
| 1274‡ | pRS316 | URA3, Bck1-20 |
| 1316* | pRS315 | LEU2, CEN/ARS |
-
*originally described in Reinke et al., (2006)
†originally described in Nonaka et al. (1995)
-
‡originally described in Helliwell et al. (1998)
Additional files
-
Transparent reporting form
- https://doi.org/10.7554/eLife.28329.018
Download links
A two-part list of links to download the article, or parts of the article, in various formats.
Downloads (link to download the article as PDF)
Open citations (links to open the citations from this article in various online reference manager services)
Cite this article (links to download the citations from this article in formats compatible with various reference manager tools)
Heat stress promotes longevity in budding yeast by relaxing the confinement of age-promoting factors in the mother cell
eLife 6:e28329.
https://doi.org/10.7554/eLife.28329


