Somatostatin binds to the human amyloid β peptide and favors the formation of distinct oligomers
- University of Toronto, Canada
- The Hospital for Sick Children, Canada
- University of Alberta, Canada
Figures
Figure 1
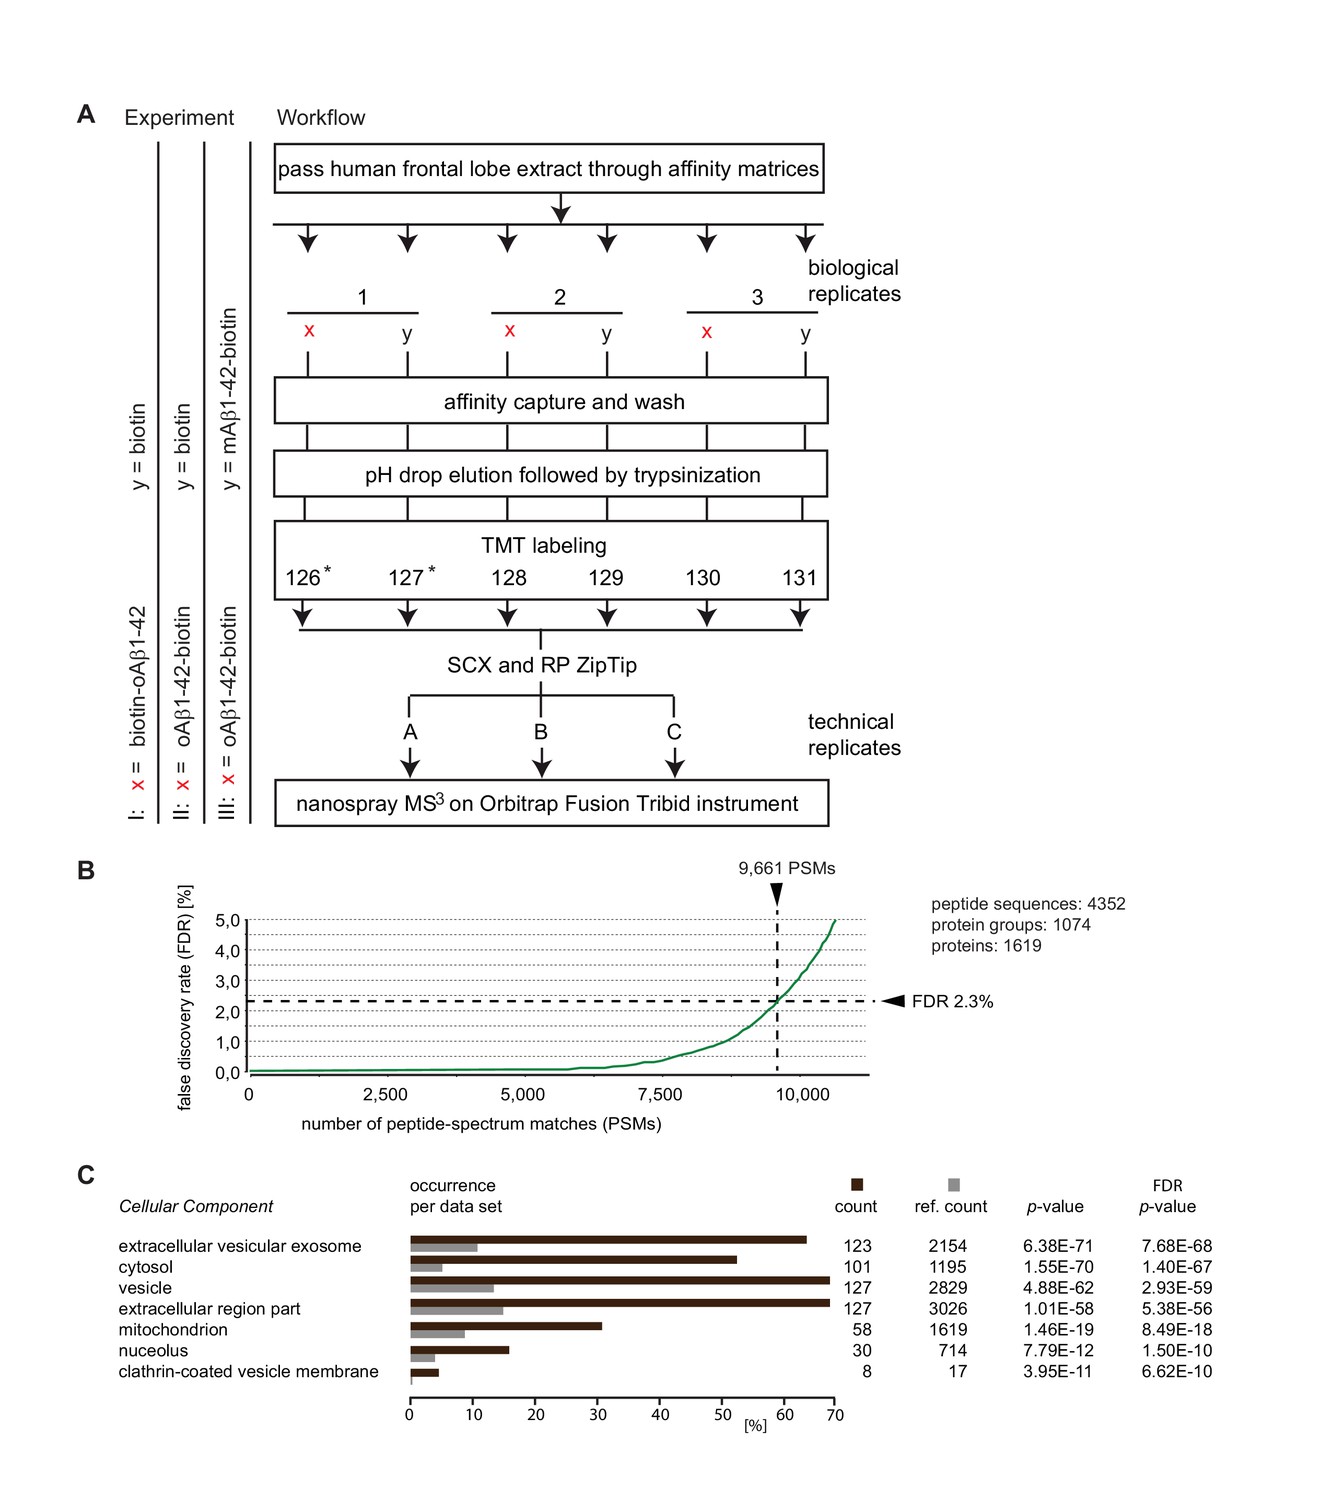
Summary of Aβ1-42 interactome analyses.
(A) Workflow of interactome studies designed to capture binders to oligomeric Aβ1-42 tethered to the streptavidin matrix by N-terminal (Experiment I) or C-terminal (Experiment II) biotin groups, or comparing binders to oligomeric versus monomeric Aβ1-42 (Experiment III). (B) Representative chart from interactome dataset generated in Experiment I, depicting the false discovery rates of peptide-to-spectrum matches and benchmarks of the analysis depth. (C) ‘Cellular Component’ Gene Ontology analysis of top 200 proteins that exhibited the most pronounced oAβ1-42 co-enrichment in Experiment I on the basis of their isobaric signature ion distribution. Asterisks indicate TMT labels that were omitted in a subset of quantitative mass spectrometry experiments.
-
Figure 1—source data 1
Experiment I-III interactome data (alphabetically sorted) (Excel file).
- https://doi.org/10.7554/eLife.28401.004
Figure 2

Discovery of somatostatin as a candidate interactor of oligomeric Aβ1-42.
(A) Sequence alignment of preprocortistatin and preprosomatostatin. The signal sequence and the boundaries of the bioactive cortistatin and somatostatin peptides are indicated by horizontal bars. Identical residues are highlighted by black background shading, and peptide sequences observed by mass spectrometry are shown in colored fonts. (B) Example tandem MS spectrum supporting the identification of a peptide with the amino acid sequence ‘NFFWK’. Fragment masses attributed to B- and Y- ion series are shown in red and blue colors, respectively. (C) Expanded view of MS3 spectrum derived from ‘NFFWK’ parent spectrum in interactome study based on oAβ1-42-biotin bait and biotin only negative control (Experiment II). In this view, the relative intensities of signature ions reflect the relative abundances of the ‘NFFWK’ peptide in the six side-by-side generated affinity purification eluate fractions. (D) SST/CST in human frontal lobe extracts binds to oAβ1-42-biotin but not to N-terminal biotinylated or truncated Aβ baits. iTRAQ signature ion intensity distribution in experiment probing the relative ability of four different biotin baits to capture SST/CST from human brain extract. The exclusive presence of a high intensity 116 ion indicates that the ‘NFFWK’ fragment spectrum, which gave rise to this peak distribution, was dependent on SST/CST exclusively associating with oAβ1-42-biotin. (E) Preferential binding of SST to pre-aggregated oAβ1-42. TMT signature ion intensity distributions of four MS3 spectra assigned to preprosomatostatin based on oligomeric or monomeric Aβ1-42-biotin baits (Experiment III). PSMs derived from SST-14 (‘TFTSC’ and ‘NFFWK’ peptides) had in common signature ion intensity distributions characterized by high intensity even-numbered TMT fragments. In contrast, signature ion intensity distributions of preprosomatostatin-derived tryptic peptides outside of the SST-14 coding region were relatively evenly distributed.
Figure 3
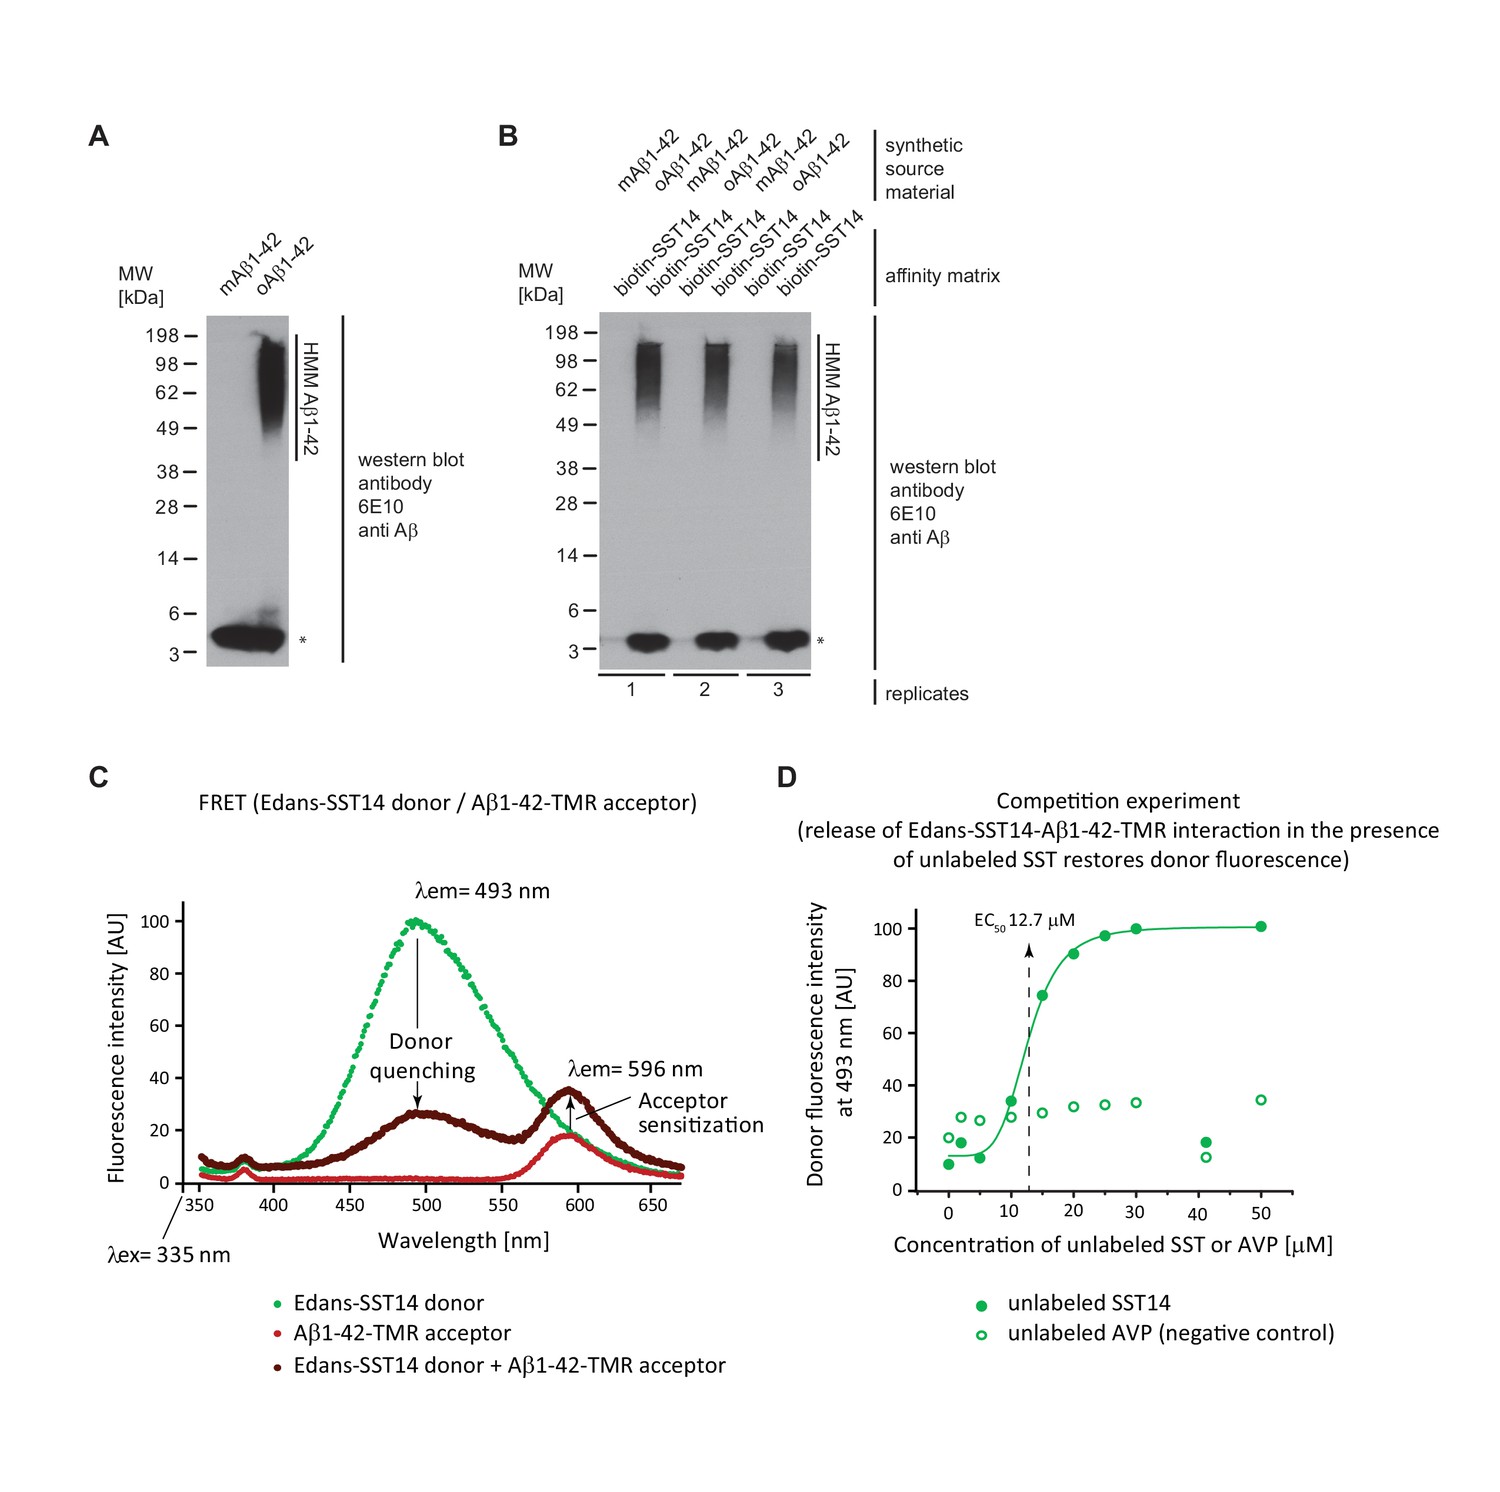
Validation of SST binding to oAβ1-42 but not to mAβ1-42.
(A) Western blot analysis of synthetic mAβ1-42 and oAβ1-42. The asterisk designates a signal caused by the partial release of mAβ1-42 from high molecular mass (HMM) oAβ1-42 in the presence of SDS. (B) Biotin-SST affinity capture of oAβ1-42 but not mAβ1-42. (C) Evidence for fluorescence energy transfer between (FRET) between Edans-SST14 donor and Aβ1-42-TMR acceptor. Samples containing donor and acceptor peptides at 20 μM concentrations were incubated overnight at physiological pH. Note the profound quenching of the donor signal and increase in acceptor fluorescence relative to negative control preparations that contained only donor or acceptor peptides but were otherwise treated identically. (D) Competition FRET analysis based on configuration shown in panel ‘D’ but with unlabeled SST14 or the negative control AVP peptide being added at varying concentrations to the assay mix. Note the rescue of donor fluorescence in the presence of unlabeled SST14 but not AVP.
Figure 4 with 2 supplements
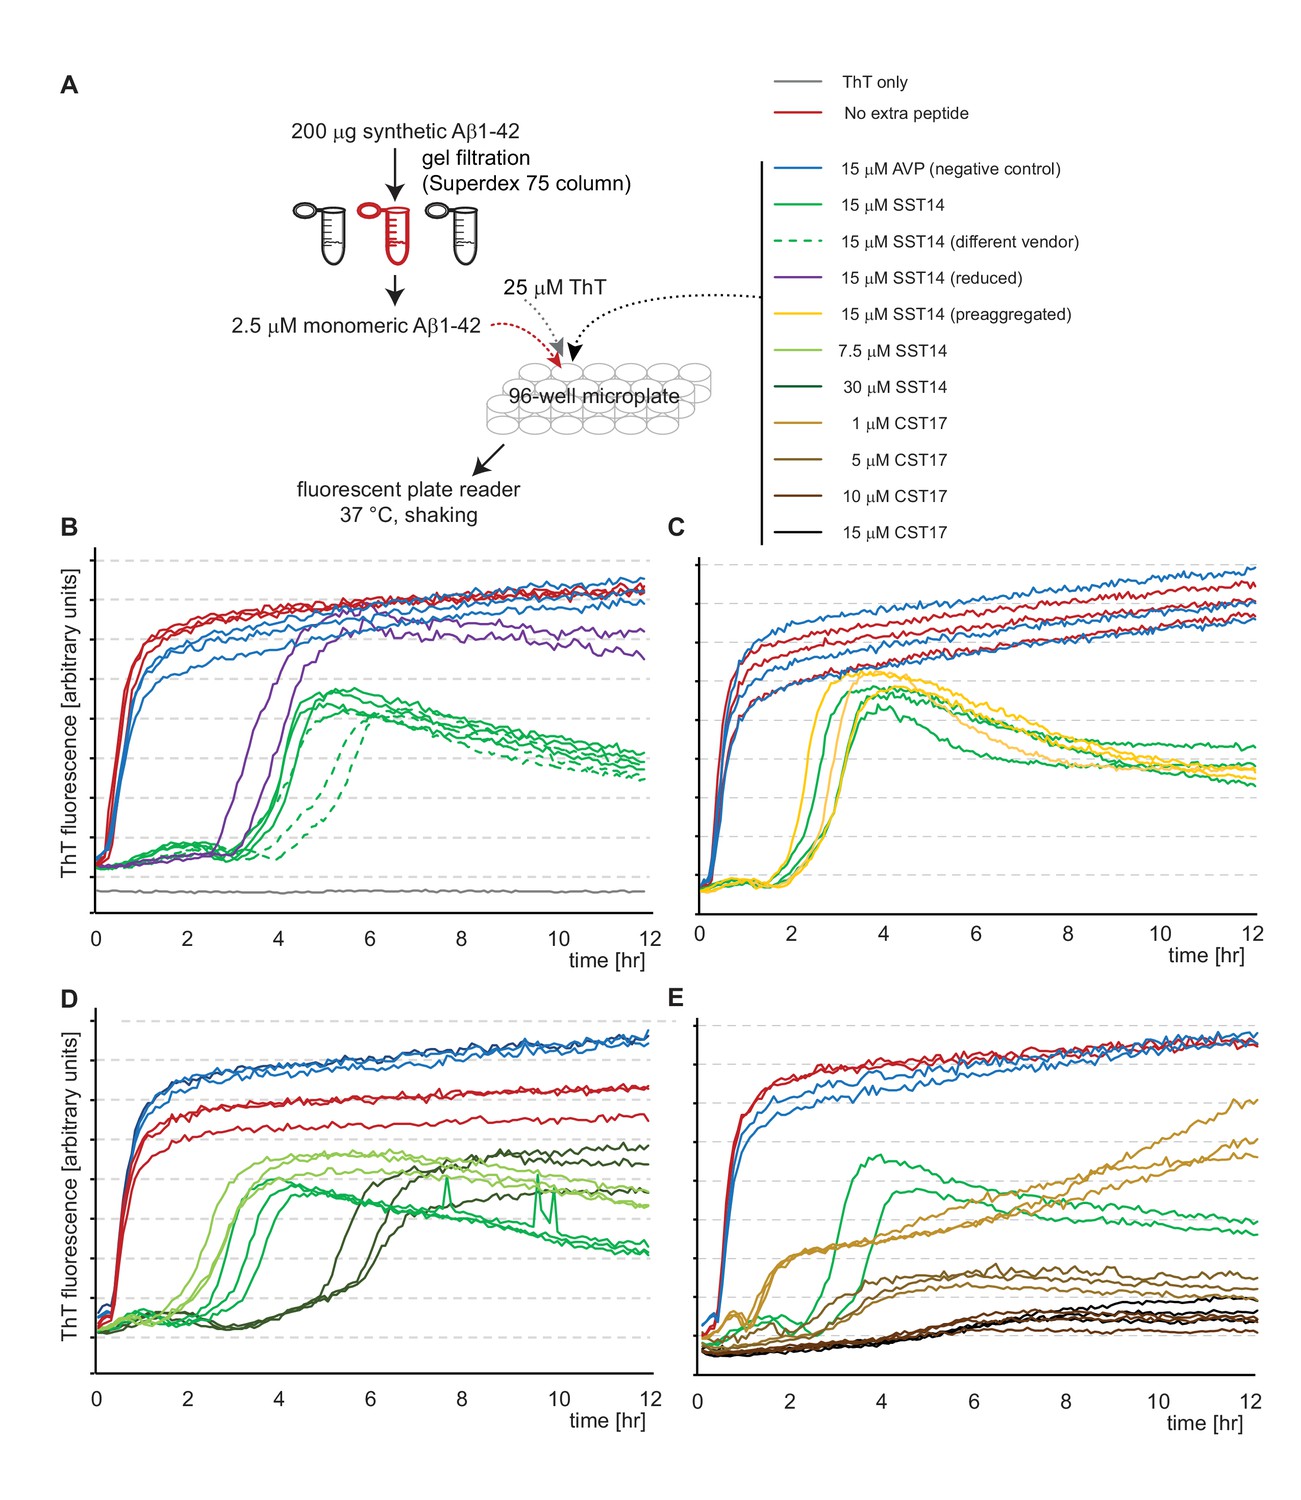
SST14 and CST17 delay Aβ1-42 aggregation in ThT fluorescence assay.
(A) Workflow of ThT-based aggregation assay. (B) Representative ThT fluorescence charts using synthetic Aβ1-42 alone or in combination with SST14 or negative control AVP peptides. Note that SST14 alone does not contribute to ThT fluorescence in this assay at these relatively low concentrations. (C) Pre-aggregation of SST14 did not alter its effect on Aβ1-42 aggregation. (D) Evidence that the SST14-dependent delay in Aβ1-42 aggregation is SST14 concentration dependent. (E) Like SST, CST17 causes a concentration-dependent inhibition of Aβ1-42-dependent ThT fluorescence. Note that at 15 μM concentrations, CST17 appears more potent in this regard than SST14. Please see legend for experimental conditions.
Figure 4—figure supplement 1

Oligomeric, but not monomeric, Aβ1-42 interferes with SST14-dependent ThT incorporation.
(A) Workflow of ThT-based aggregation assay. Aβ1-42 was separated by gel filtration to isolate fractions that contained oligomeric or monomeric Aβ1-42. (B) Representative ThT fluorescence charts monitoring SST14-dependent ThT incorporation. Note that SST14 required concentrations upward of 200 μM before it reliably assembled into aggregates that incorporated ThT. Interestingly, the presence of a 100-fold lower amount pre-aggregated Aβ1-42, but not monomeric Aβ1-42, reliably delayed SST14-dependent ThT incorporation by several hours.
Figure 4—figure supplement 2
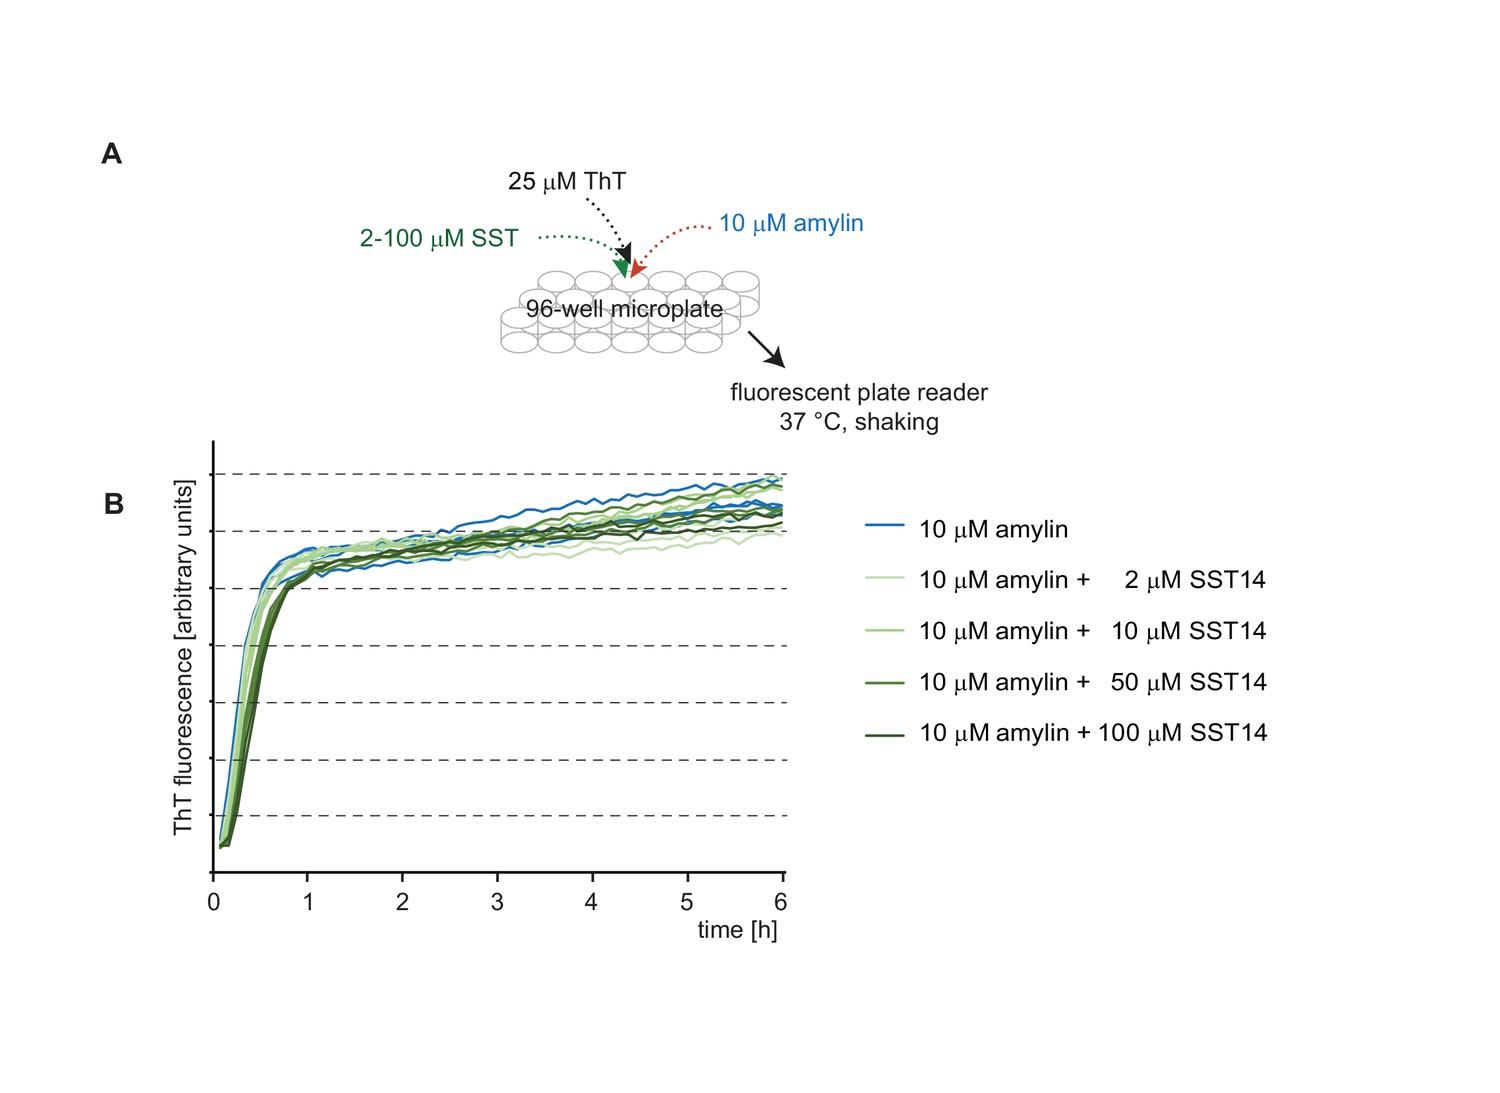
The presence of SST14 does not affect the ThT fluorescence curve of amylin.
(A) Workflow of amylin-dependent ThT fluorecence assay in the presence or absence of SST14. (B) Representative ThT fluorescence charts monitoring amylin-dependent ThT incorporation. Even at concentrations of 100 μM SST14 the aggregation of amylin, measured on the basis of ThT fluorescence, remained unaffected.
Figure 5 with 1 supplement
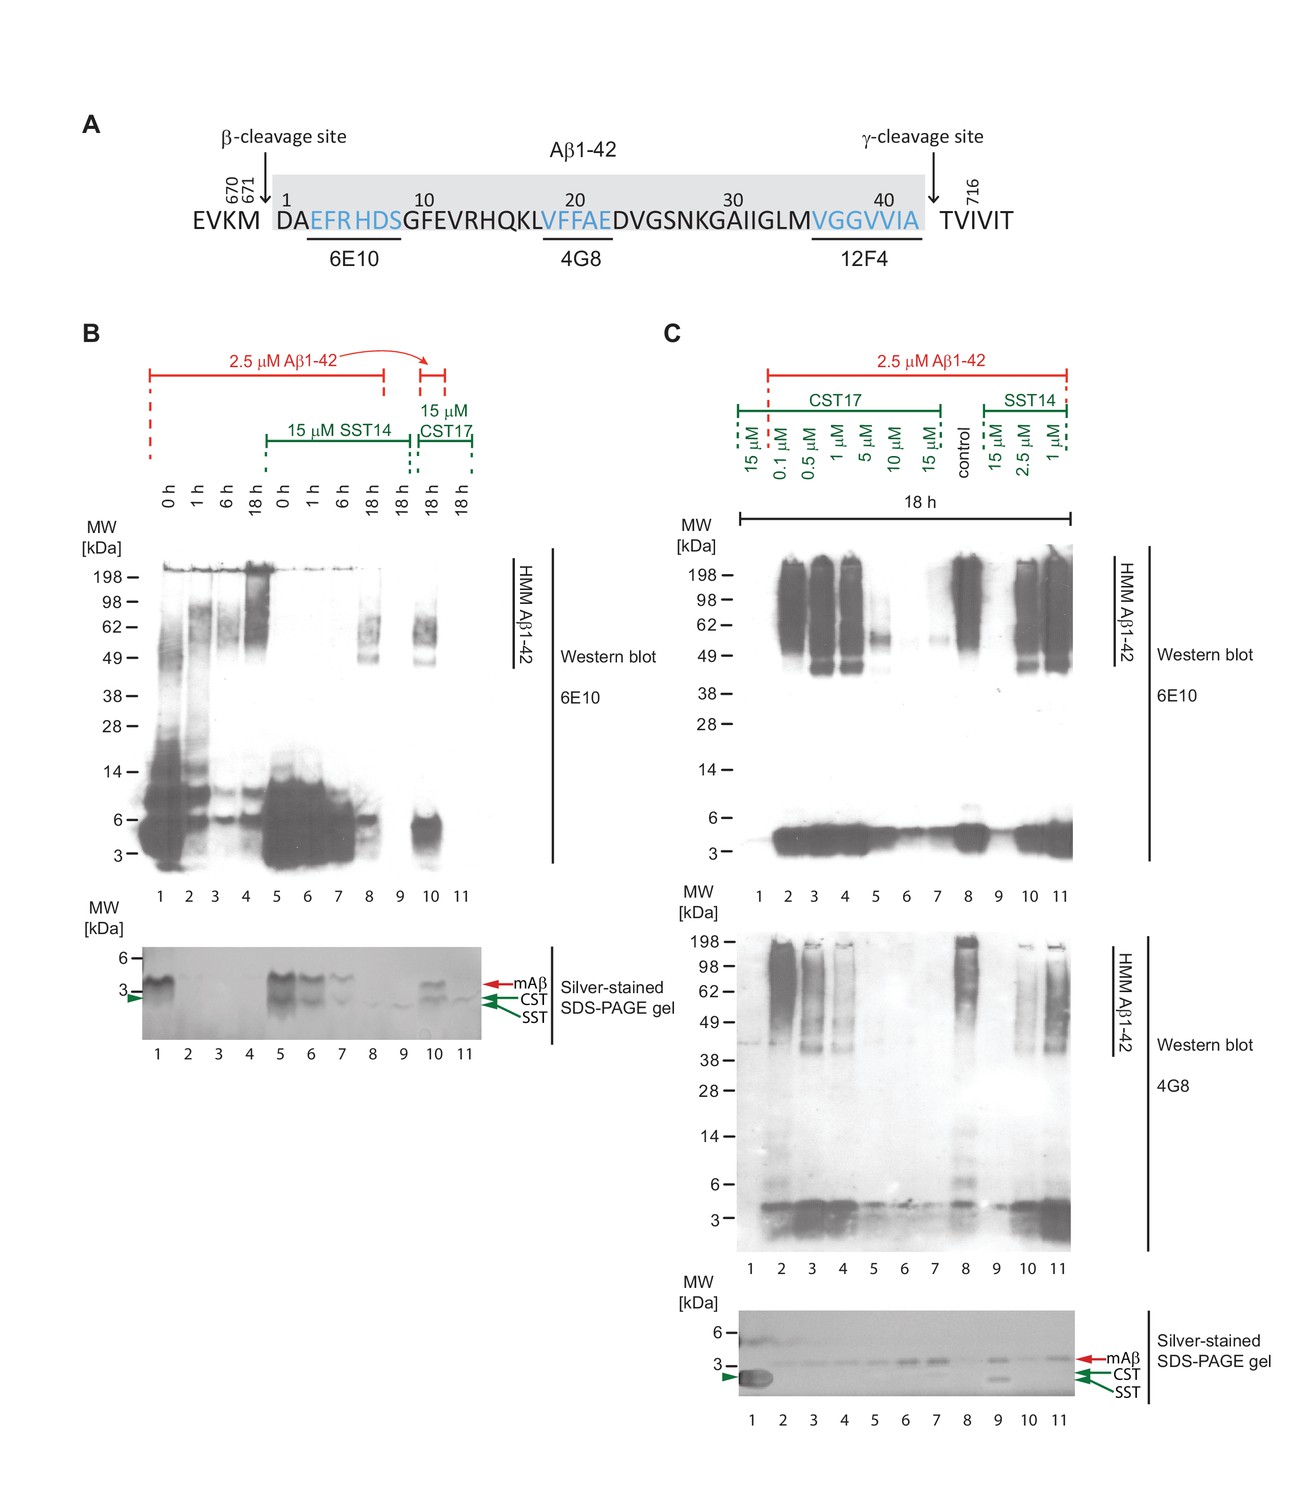
Binding of SST14 or CST17 precludes detection of Aβ1-42 with commonly used antibodies.
(A) Schematic highlighting Aβ1-42 binding epitopes of antibodies used to generate this and the subsequent figure. (B) Western blot-based time-course analysis of Aβ1-42 aggregation in the presence or absence of SST14 or CST17. (C) SST14- and CST17-dependent masking of Aβ1-42 binding epitopes. Note the relatively more intense silver-stained bands of monomeric Aβ1-42 (red arrowhead) in samples containing the highest concentrations of SST14 or CST17 (lanes 6, 7 and 9), yet virtual absence of Aβ-specific immunoblot signals in the corresponding lanes. Note also the faster migrating band (green arrowhead) representing monomeric CST or SST observed in samples, which contained the highest concentrations of CST or SST (lanes 7 and 9).
Figure 5—figure supplement 1
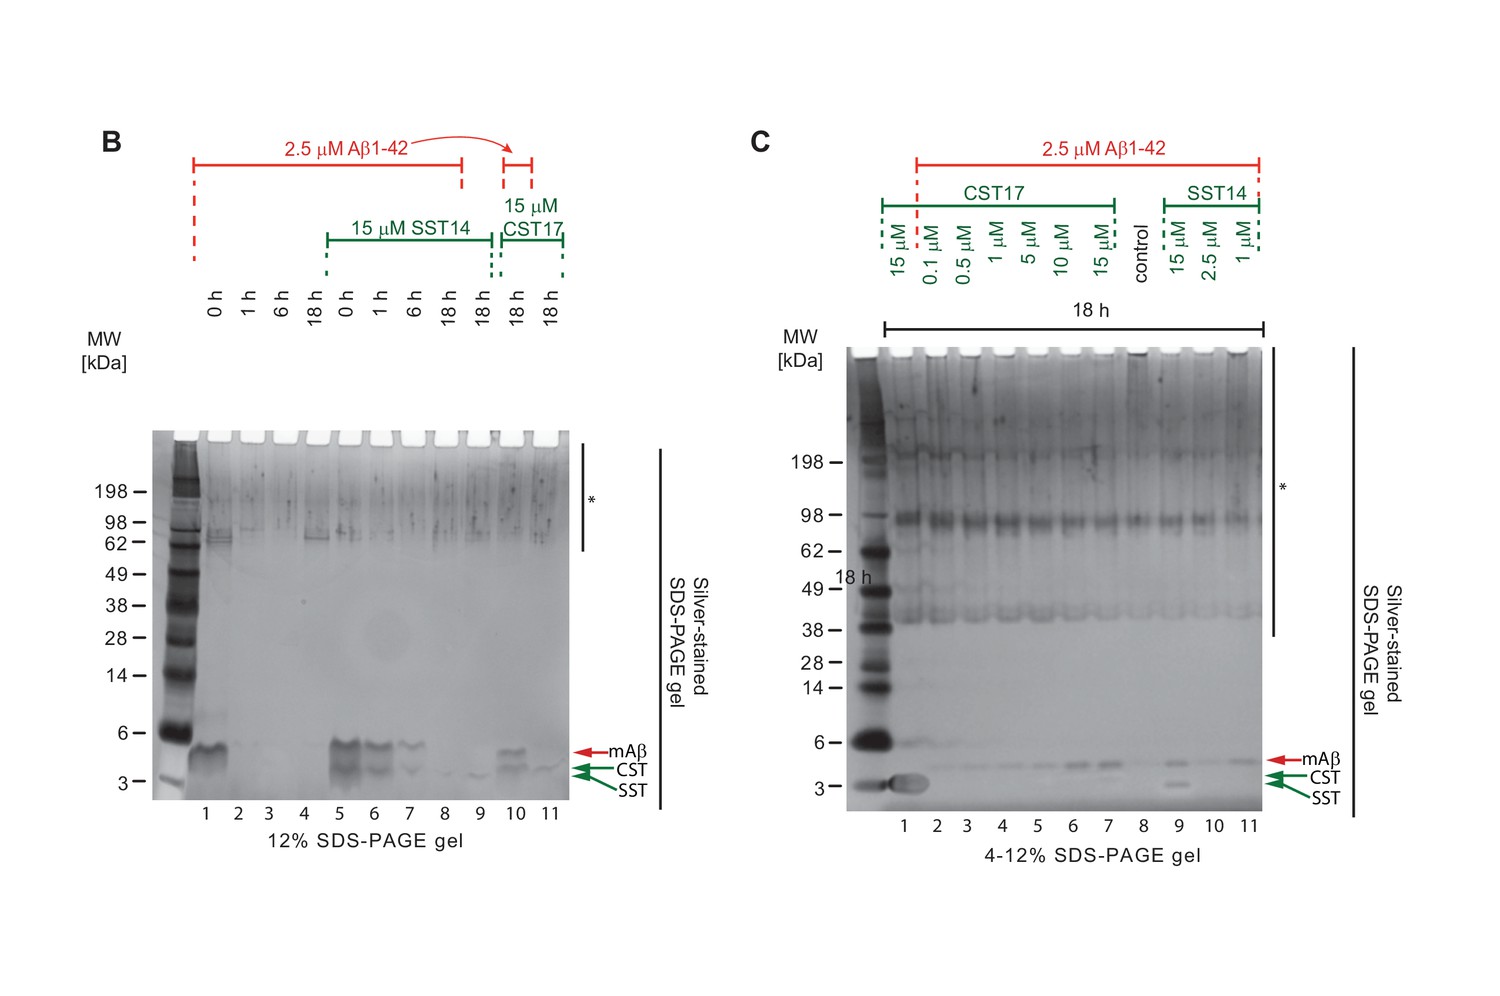
Full view of silver-stained gels depicted in Figure 5, panels B and C.
Note the relatively more intense silver-stained bands of monomeric Aβ1-42 (red arrowhead) in samples containing the highest concentrations of SST14 or CST17 (lanes 6, 7 and 9). Note also the faster migrating band (green arrowhead) representing monomeric CST or SST observed in samples, which contained the highest concentrations of CST or SST (lanes 7 and 9). The asterisk demarks non-specific silver-staining artefacts. Because these signals were not derived from somatostatin, cortistatin or Aβ (as their intensities did not correlate at all with the differences in the amounts of these peptides in the samples) they did not aid in interpreting the binding biology that was the focus of the experiment.
Figure 6
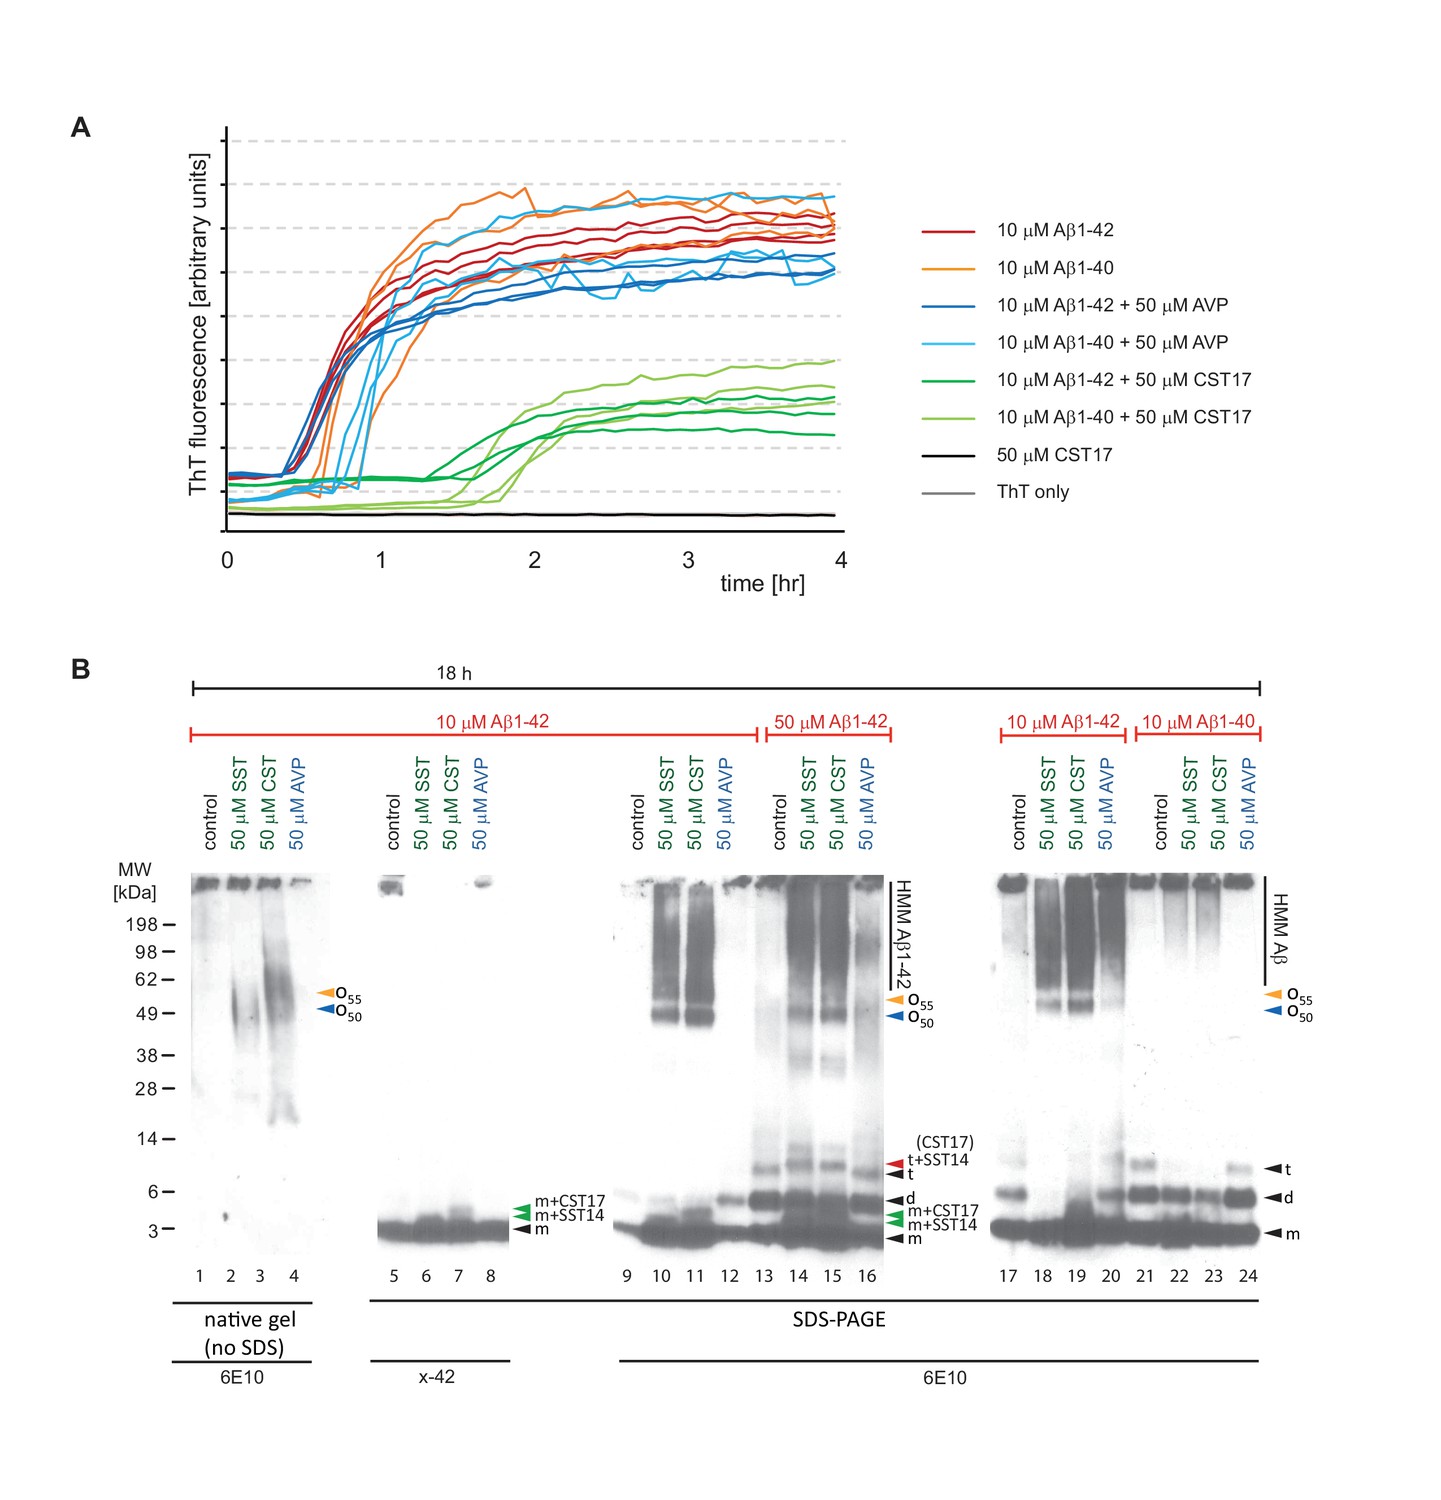
Aβ1-42 forms SDS-stable oligomeric complexes of 50-55 kDa in the presence of SST14 (or CST17).
(A) In the presence of CST17 (or SST14, not shown) the ThT fluorescence curve or Aβ1-42 or Aβ1-40 is characterized by an extension of the lag phase and a reduction in ThT fluorescence. (B) CST17 (or SST14) co-assemble with Aβ1-42 into oligomers of 50-55 kDa that withstand boiling (lanes 2 and 3) but partially disintegrate in the presence of SDS. Immunoblot analyses with antibodies directed against the C-terminus (x-42) (lanes 6 and 7) or an N-terminal epitope (6E10) (lanes 10 and 11) revealed bands of 5-6 kDa, consistent with the existence of SDS-resistant heterodimeric complexes of mAβ1-42 and SST14 (or CST17). Note the well-defined oligomeric bands of 50 and 55 kDa (lanes 10 and 11) that were observed in samples derived from the co-incubation of SST14 (or CST17) with Aβ1-42 (lanes 10, 11, 18, 19). Note also that signals interpreted to represent trimeric Aβ1-42 (t) (lanes 13-16), but not dimeric Aβ1-42 (d), can be seen to migrate slower in the presence of SST14 (or CST17) (lanes 14 and 15). Finally, intensity levels of homodimeric Aβ1-42 bands are reduced in the presence of SST14 (or CST17) (compare lanes 17 and 20 with lanes 18 and 19). Black arrowhead labeled with ‘m’, ‘d’, and ‘t’ designate bands interpreted to consist of monomeric, dimeric and trimeric Aβ1-42. Green and red arrowheads were used to label bands interpreted to represent SDS-stable heteromeric building blocks consisting of SST14 (or CST17) bound to monomeric and trimeric Aβ1-42, respectively.
Figure 7 with 2 supplements
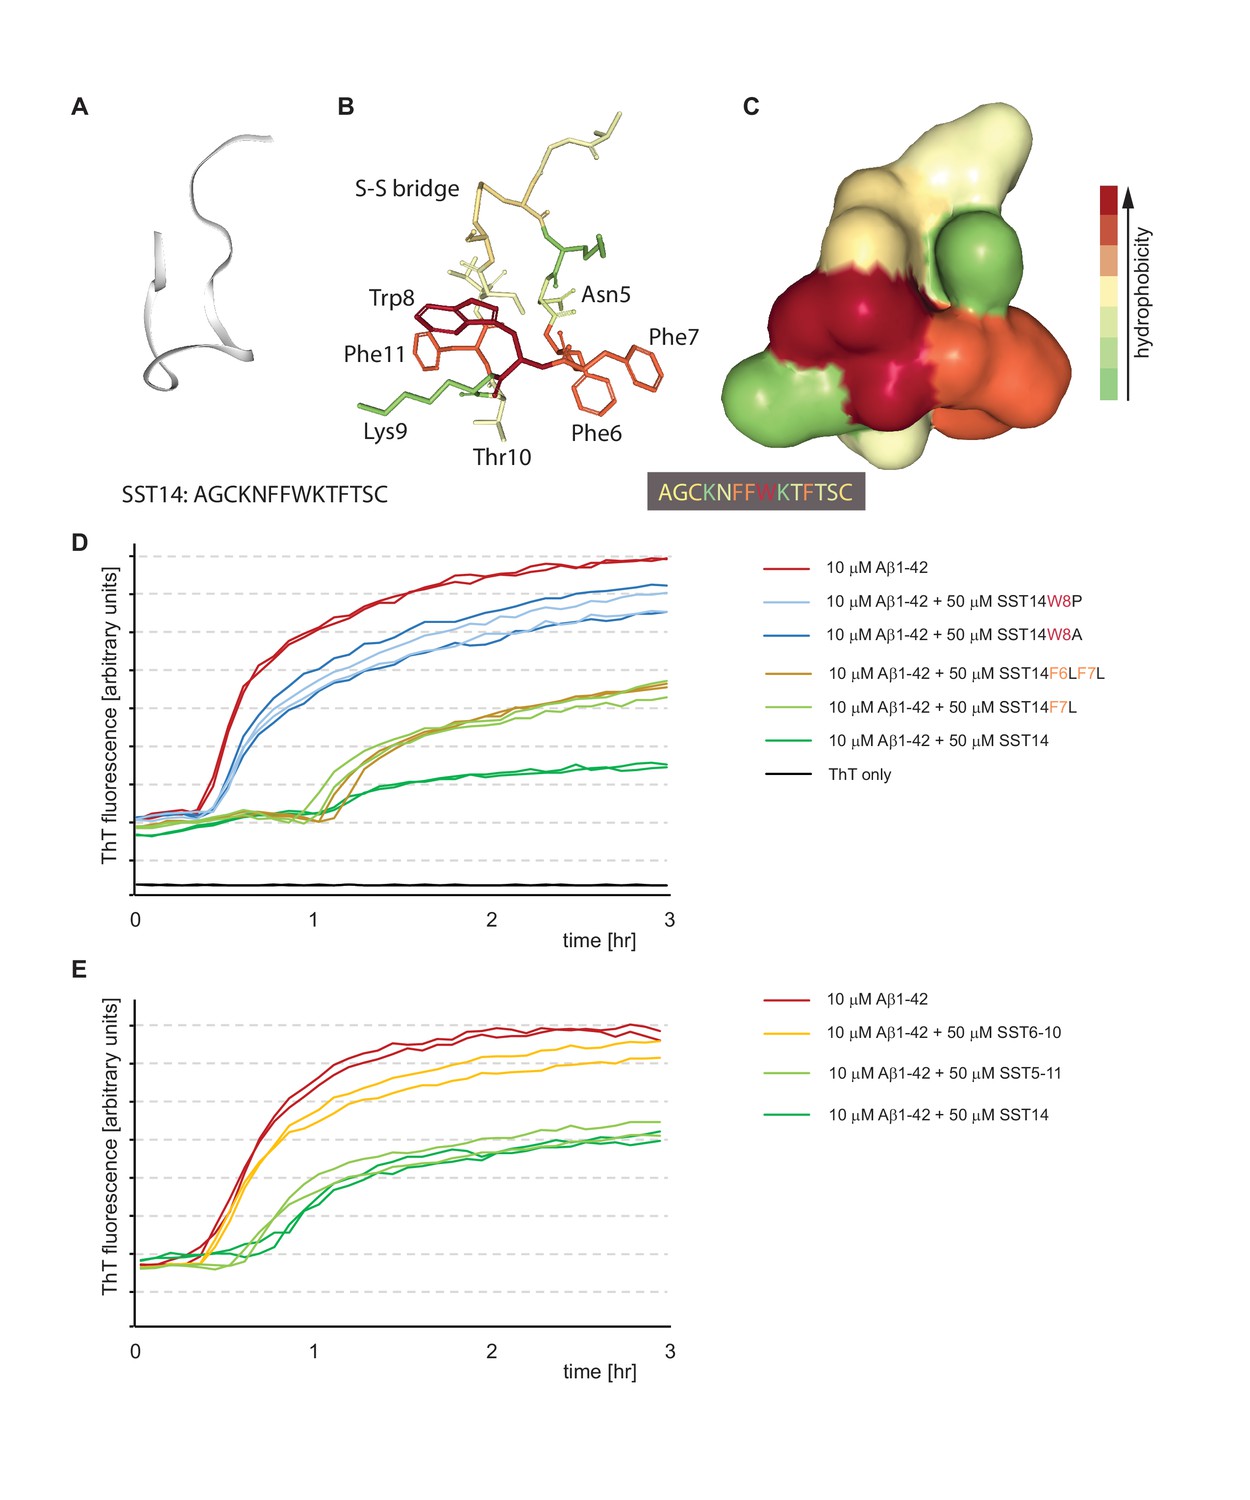
Tryptophan-8 in SST14 sequence is essential for lag phase extension of Aß1-42 in ThT incorporation assay.
(A–C) NMR-structure of SST14 in 5% D-mannitol (RCSF PDB structure ID: 2MI1, Model 1), adapted from Anoop et al. (2014). Renderings were generated in NGL 3D viewer (powered by MMTF). (A) Backbone of SST14 emphasizing secondary structure. (B) and (C) Stick and surface models of SST14 with coloring emphasizing relative hydrophobicity. (D) and (E) Thioflavin T absorbance assay data based on SST point mutants and deletion constructs, respectively. Please see legend for sample compositions.
Figure 7—figure supplement 1
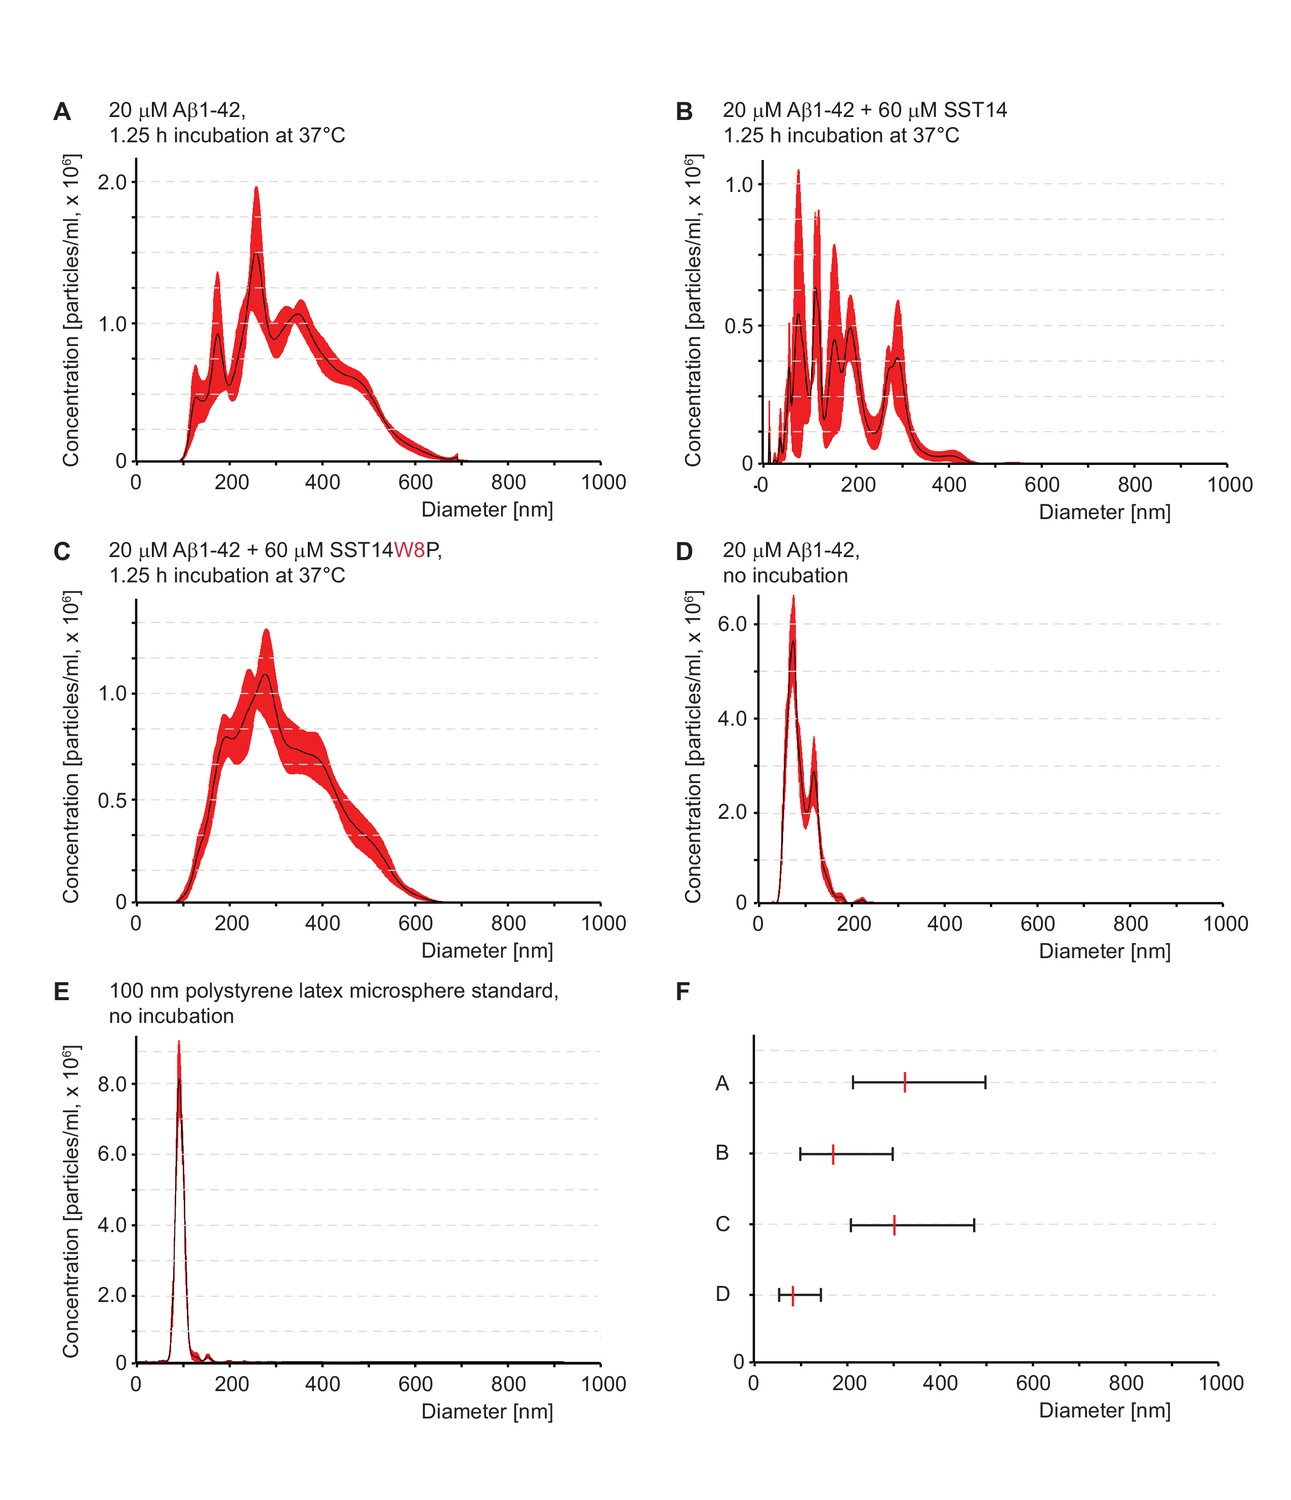
In the presence of SST, Aß1-42 forms smaller quaternary assemblies.
(A–E) Particle size distributions determined by nanoparticle tracking analysis. Traces represent averages of particle size distributions determined in five consecutive analyses. Note that the analysis buffer without peptides or preparations of SST alone did not give rise to measurable particles in this analysis (not shown). (E) Nanotracking analysis of 100 nm polystyrene latex microsphere standard. (F) D10-D90 summary of particle size distributions. The centre line represents D50, corresponding to data in panels ‘A’ to ‘D’.
Figure 7—figure supplement 2
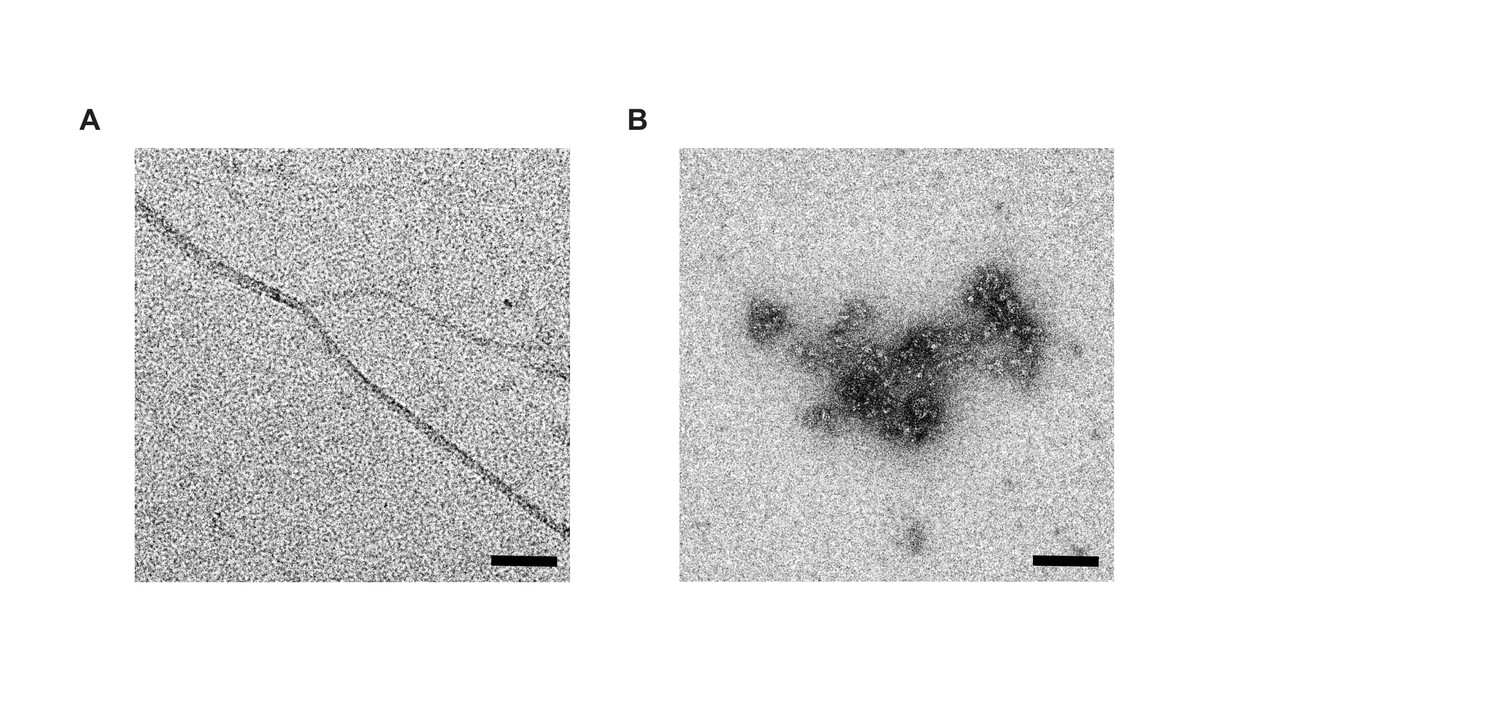
Negative stain electron microscopy of Aβ1-42 and Aβ1-42–SST14 complexes.
(A) Aβ1-42 was fibrillized in PBS at a concentration of 50 μM. Individual Aβ1-42 amyloid fibrils and small clusters were visualized. (B) Incubation of equimolar concentrations (50 μM) of Aβ1-42 and SST14 under identical conditions resulted in oligomeric assemblies only. No amyloid fibrils were observed. Magnification bars = 100 nm.
Figure 8
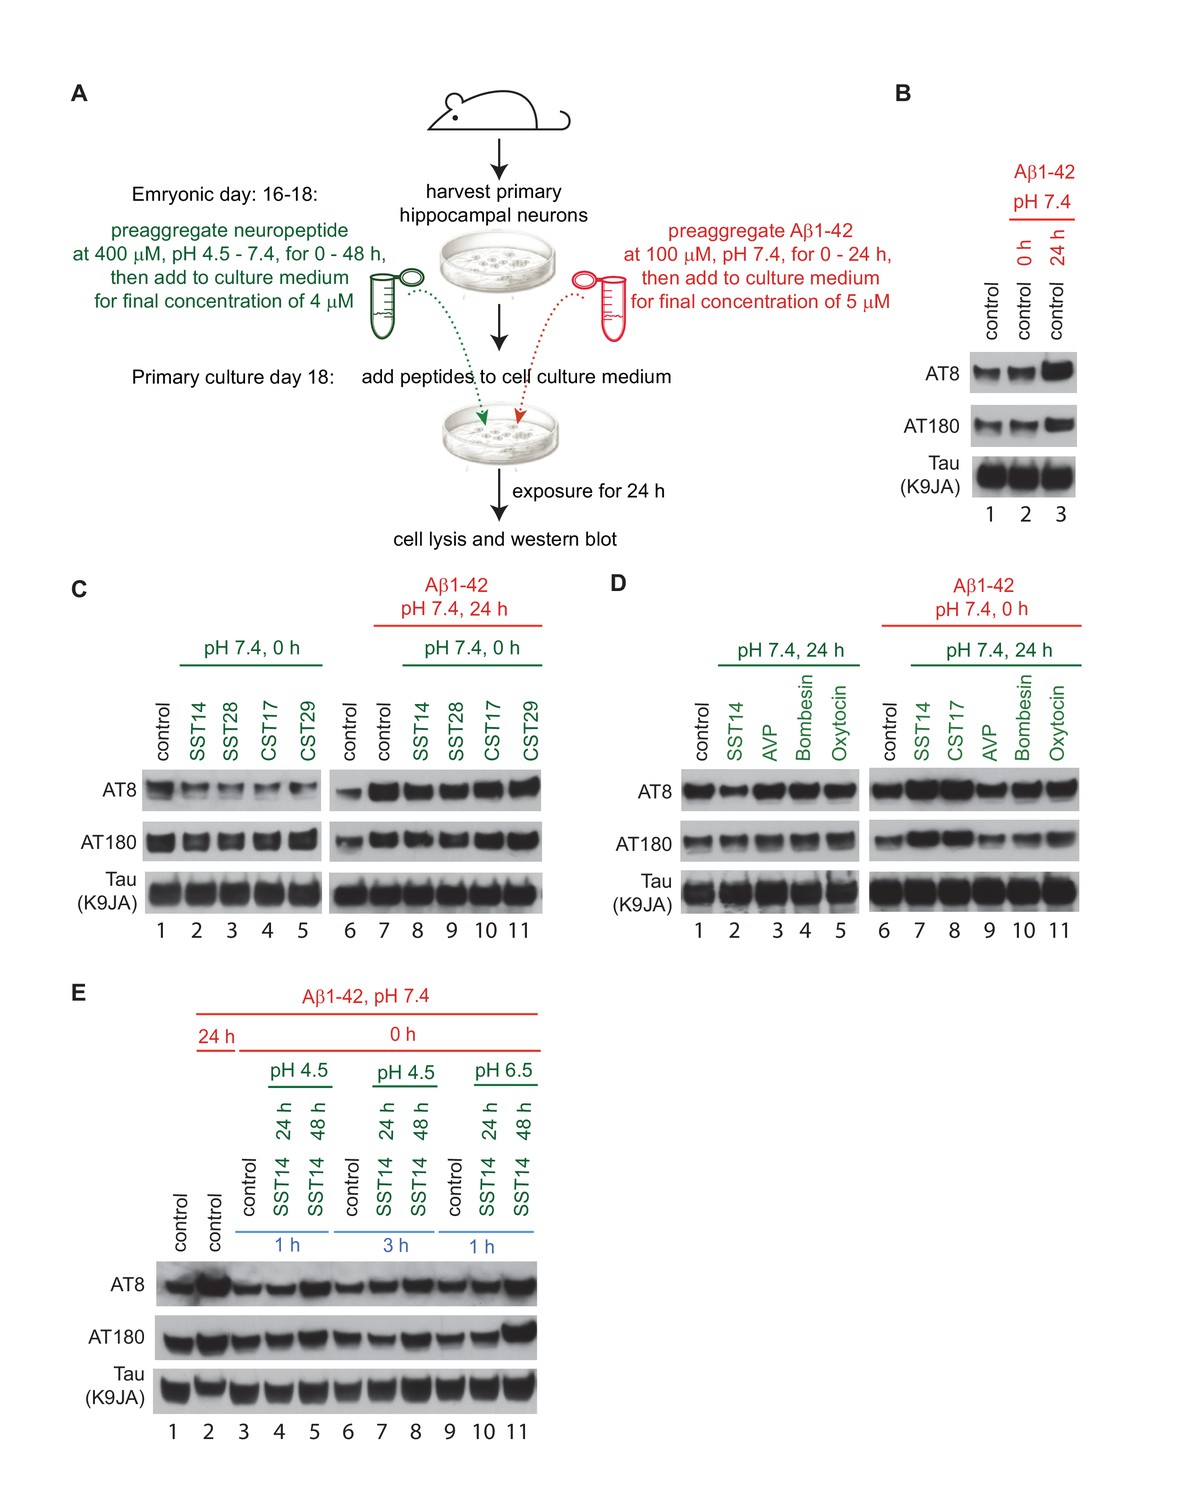
Exposure of primary hippocampal neurons to SST14 and Aβ1-42 can potentiate phosphorylation of tau at sites known to undergo hyperphosphorylation in AD.
(A) Workflow of primary hippocampal neuron assay. Please see methods section for details on peptide preparation. (B) Addition of preaggregated (24 hr) but not monomeric (0 hr) Aβ1-42 to primary hippocampal neurons causes within 24 hr an increase in tau phospho-occupancy at AT8 and AT180 phosphorylation sites, in the absence of an effect on total tau levels (K9JA). (C) Addition of SST or CST bioactive peptides in the absence of Aβ1-42, leads to a reduction in tau phospho-occupancy. (D) Addition of SST14 or CST17, but not negative control cyclic peptides, can potentiate tau phospho-occupancy in the presence of monomeric Aβ1-42. (E) Tau hyperphosphorylation observed following addition of SST14 and mAβ1-42 to the cell culture appears to depend on conducive SST14 pre-incubation conditions. In all panels red and green font designates parameters (pH and pre-aggregation periods) applied to the preparation of Aβ1-42 and other neuropeptides, respectively. Peptides were added separately to the cell culture medium except for samples 3-11, Panel E, when peptides were mixed and pre-incubated for an additional 1 or 3 hr. Exposures of cells to peptides were for 24 hr.
Tables
Table 1
Top-listed 50 interactors of biotin-Aβ1-42 observed in Experiment I. Except for the Aβ1-42 bait, which is shown in first position, proteins are listed by their enrichment (relative to the biotin-only saturated negative control matrix) observed in Experiment I. Note the extensive amino acid sequence coverage exceeding 44% for all proteins listed. Whenever the same proteins were also observed in Experiments II and III, their corresponding enrichment ratios and counts of peptides quantified are shown in additional columns on the right. (see also Figure 1—source data 1 and Supplementary file 1).
| Peptides | Experiment I B-oAβ1-42/B | Experiment II oAβ1-42-B/B | *Experiment III oAβ1-42-B/ mAβ1-42-B | ||||||||
|---|---|---|---|---|---|---|---|---|---|---|---|
| Accession | Description | Coverage | Unique | Total | Ratio | Count | Ratio | Count | Ratio | Count | AAs |
| IPI00006608.1 | APP770 of Amyloid beta A4 protein (Fragment) | 62.34% | 2 | 48 | 8.33 | 18 | 5.77 | 13 | 2.80 | 37 | 770 |
| IPI00024915.3 | Peroxiredoxin-5, mitochondrial | 86.45% | 8 | 18 | 12.23 | 3 | 2.15 | 3 | 5.90 | 23 | 214 |
| IPI00005719.1 | Ras-related protein Rab-1A | 80.49% | 4 | 18 | 10.52 | 3 | 3.28 | 6 | 205 | ||
| IPI00219217.3 | L-lactate dehydrogenase B chain | 74.55% | 6 | 26 | 9.87 | 9 | 2.46 | 3 | 334 | ||
| IPI00218493.7 | Hypoxanthine-guanine phosphoribosyltransferase | 64.22% | 7 | 22 | 9.00 | 12 | 2.45 | 8 | 218 | ||
| IPI00303476.1 | ATP synthase subunit beta, mitochondrial | 83.55% | 14 | 48 | 8.59 | 3 | 2.61 | 21 | 529 | ||
| IPI00395769.2 | ATP synthase subunit gamma, mitochondrial | 59.60% | 6 | 25 | 8.57 | 3 | 3.29 | 19 | 297 | ||
| IPI00219452.1 | Cytosolic acyl CoA thioester hydrolase | 76.60% | 12 | 31 | 8.38 | 31 | 4.03 | 31 | 329 | ||
| IPI00027223.2 | Isocitrate dehydrogenase [NADP] cytoplasmic | 62.56% | 5 | 30 | 8.20 | 4 | 414 | ||||
| IPI00743713.4 | Pyruvate kinase | 64.77% | 3 | 41 | 7.95 | 5 | 1.89 | 7 | 4.50 | 8 | 599 |
| IPI00029469.1 | Centractin, beta | 76.06% | 3 | 26 | 7.87 | 7 | 3.25 | 39 | 376 | ||
| IPI00003482.1 | 2,4-dienoyl-CoA reductase, mitochondrial | 88.06% | 12 | 37 | 7.74 | 21 | 4.32 | 28 | 335 | ||
| IPI00000949.1 | Mu-crystallin homolog | 80.25% | 11 | 22 | 7.65 | 11 | 2.41 | 17 | 314 | ||
| IPI00028520.2 | NADH dehydrogenase flavoprotein 1 | 77.59% | 12 | 31 | 7.52 | 32 | 3.48 | 4 | 4.08 | 20 | 464 |
| IPI00018352.1 | Ubiquitin carboxyl-terminal hydrolase L1 | 63.68% | 9 | 17 | 7.49 | 38 | 1.87 | 2 | 1.39 | 19 | 223 |
| IPI00478231.2 | Transforming protein RhoA | 51.30% | 5 | 11 | 7.48 | 7 | 5.74 | 8 | 193 | ||
| IPI00028091.3 | Actin-related protein 3 | 54.78% | 6 | 24 | 7.45 | 9 | 1.81 | 4 | 418 | ||
| IPI00029468.1 | Centractin, alpha | 72.34% | 7 | 36 | 7.34 | 15 | 3.94 | 3 | 3.11 | 38 | 376 |
| IPI00335509.3 | Dihydropyrimidinase-related protein 5 | 77.13% | 8 | 42 | 7.05 | 6 | 3.79 | 8 | 564 | ||
| IPI00479186.7 | Pyruvate kinase isozymes M1/M2 | 93.03% | 3 | 70 | 7.04 | 138 | 1.68 | 100 | 4.33 | 123 | 531 |
| IPI00219018.7 | Glyceraldehyde-3-phosphate dehydrogenase | 98.21% | 35 | 50 | 6.96 | 160 | 2.36 | 121 | 2.62 | 251 | 335 |
| IPI00873027.2 | Carbohydrate kinase domain-containing protein | 95.68% | 15 | 31 | 6.95 | 18 | 2.17 | 3 | 1.72 | 32 | 347 |
| IPI00179187.4 | DnaJ homolog subfamily A member 3 | 74.17% | 6 | 31 | 6.93 | 3 | 9.57 | 8 | 453 | ||
| IPI00216456.5 | Histone H2A type 1 C | 92.31% | 3 | 21 | 6.83 | 15 | 2.03 | 10 | 0.59 | 54 | 130 |
| IPI00016801.1 | Glutamate dehydrogenase 1, mitochondrial | 85.13% | 13 | 46 | 6.82 | 16 | 2.99 | 22 | 558 | ||
| IPI00218448.4 | Histone H2A.Z | 83.59% | 5 | 14 | 6.78 | 4 | 1.88 | 5 | 0.51 | 30 | 128 |
| IPI00220301.5 | Peroxiredoxin-6 | 80.80% | 12 | 18 | 6.69 | 7 | 1.42 | 2 | 1.54 | 22 | 224 |
| IPI00472047.1 | NAD-dependent deacetylase sirtuin-2 | 78.32% | 7 | 28 | 6.68 | 4 | 2.58 | 15 | 369 | ||
| IPI00169383.3 | Phosphoglycerate kinase 1 | 92.09% | 18 | 51 | 6.61 | 48 | 1.38 | 13 | 1.73 | 21 | 417 |
| IPI00895801.1 | Medium-chain specific acyl-CoA dehydrogenase | 69.41% | 8 | 39 | 6.39 | 3 | 1.82 | 12 | 425 | ||
| IPI00026268.3 | Guanine nucleotide-binding protein beta-1 | 83.82% | 7 | 35 | 6.38 | 4 | 2.58 | 30 | 340 | ||
| IPI01015522.1 | Actin, cytoplasmic 1 | 96.83% | 8 | 37 | 6.25 | 33 | 2.07 | 26 | 4.71 | 129 | 347 |
| IPI00909207.1 | Peroxiredoxin-2 | 92.35% | 9 | 23 | 6.00 | 13 | 1.51 | 14 | 2.40 | 13 | 183 |
| IPI00970967.1 | GSTT2 protein | 51.64% | 5 | 14 | 6.00 | 7 | 244 | ||||
| IPI00298547.3 | DJ-1 | 95.24% | 11 | 22 | 5.87 | 17 | 1.42 | 4 | 1.84 | 30 | 189 |
| IPI00796462.1 | GTP-binding nuclear protein Ran | 90.60% | 13 | 24 | 5.82 | 26 | 4.82 | 14 | 4.42 | 46 | 234 |
| IPI00784154.1 | Heat shock protein, 60 kDa, mitochondrial | 94.76% | 35 | 71 | 5.68 | 69 | 2.27 | 17 | 4.21 | 73 | 573 |
| IPI00003362.3 | 78 kDa glucose-regulated protein | 58.72% | 6 | 44 | 5.65 | 20 | 1.39 | 1 | 2.42 | 7 | 654 |
| IPI00011229.1 | Cathepsin D | 84.95% | 11 | 35 | 5.52 | 15 | 2.10 | 26 | 412 | ||
| IPI00013683.2 | Tubulin beta-3 chain | 84.44% | 10 | 43 | 5.39 | 5 | 1.18 | 1 | 2.04 | 85 | 450 |
| IPI00032406.1 | DnaJ homolog subfamily A member 2 | 90.29% | 10 | 38 | 5.28 | 5 | 6.10 | 19 | 412 | ||
| IPI00419802.4 | 3-hydroxyisobutyryl-CoA hydrolase | 64.25% | 5 | 22 | 5.27 | 7 | 386 | ||||
| IPI00219037.5 | Histone H2A.x | 92.31% | 5 | 23 | 5.23 | 3 | 1.69 | 9 | 0.67 | 48 | 143 |
| IPI00556376.2 | Dihydropyrimidinase-related protein 1 | 89.21% | 21 | 60 | 5.21 | 57 | 1.39 | 27 | 3.71 | 67 | 686 |
| IPI00000792.1 | Quinone oxidoreductase | 68.69% | 3 | 18 | 5.18 | 4 | 329 | ||||
| IPI00295400.1 | Tryptophanyl-tRNA synthetase, cytoplasmic | 66.67% | 6 | 33 | 5.17 | 9 | 3.97 | 2 | 471 | ||
| IPI00440493.2 | ATP synthase subunit alpha, mitochondrial | 99.46% | 38 | 89 | 5.17 | 62 | 2.16 | 32 | 4.88 | 131 | 553 |
| IPI00029111.3 | Dihydropyrimidinase-related protein 3 | 80.99% | 4 | 49 | 5.13 | 15 | 1.42 | 10 | 3.40 | 19 | 684 |
| IPI00019171.1 | Endophilin-A1 | 78.41% | 10 | 37 | 5.03 | 7 | 1.28 | 1 | 1.07 | 40 | 352 |
| IPI00005198.2 | Interleukin enhancer-binding factor 2 | 44.36% | 3 | 13 | 4.98 | 4 | 1.41 | 6 | 390 | ||
| IPI00030363.1 | Acetyl-CoA acetyltransferase, mitochondrial | 86.65% | 19 | 50 | 4.81 | 33 | 2.64 | 10 | 2.45 | 43 | 427 |
| IPI00413344.3 | Cofilin-2 | 90.96% | 6 | 22 | 4.79 | 25 | 1.81 | 13 | 6.93 | 11 | 166 |
| IPI00007068.1 | Actin-related protein 3B | 50.96% | 4 | 21 | 4.77 | 11 | 418 | ||||
| IPI00012011.6 | Cofilin-1 | 93.98% | 15 | 29 | 4.67 | 56 | 1.75 | 37 | 5.34 | 56 | 166 |
-
*Note that SST14 is not included in this list because this protein only came to the fore as the most selective oAβ1-42-B interactor when the ≥6 amino acids and ≥3 peptides per protein requirements were waived.
Additional files
-
Supplementary file 1
Subset of Aβ1-42 interactors sorted by protein category.
- https://doi.org/10.7554/eLife.28401.018
Download links
A two-part list of links to download the article, or parts of the article, in various formats.
Downloads (link to download the article as PDF)
Open citations (links to open the citations from this article in various online reference manager services)
Cite this article (links to download the citations from this article in formats compatible with various reference manager tools)
Somatostatin binds to the human amyloid β peptide and favors the formation of distinct oligomers
eLife 6:e28401.
https://doi.org/10.7554/eLife.28401


