Single-cell transcriptome analysis of avian neural crest migration reveals signatures of invasion and molecular transitions
- Stowers Institute for Medical Research, United States
- University of Nebraska Medical Center, United States
- University of Kansas School of Medicine, United States
Figures
Figure 1 with 1 supplement
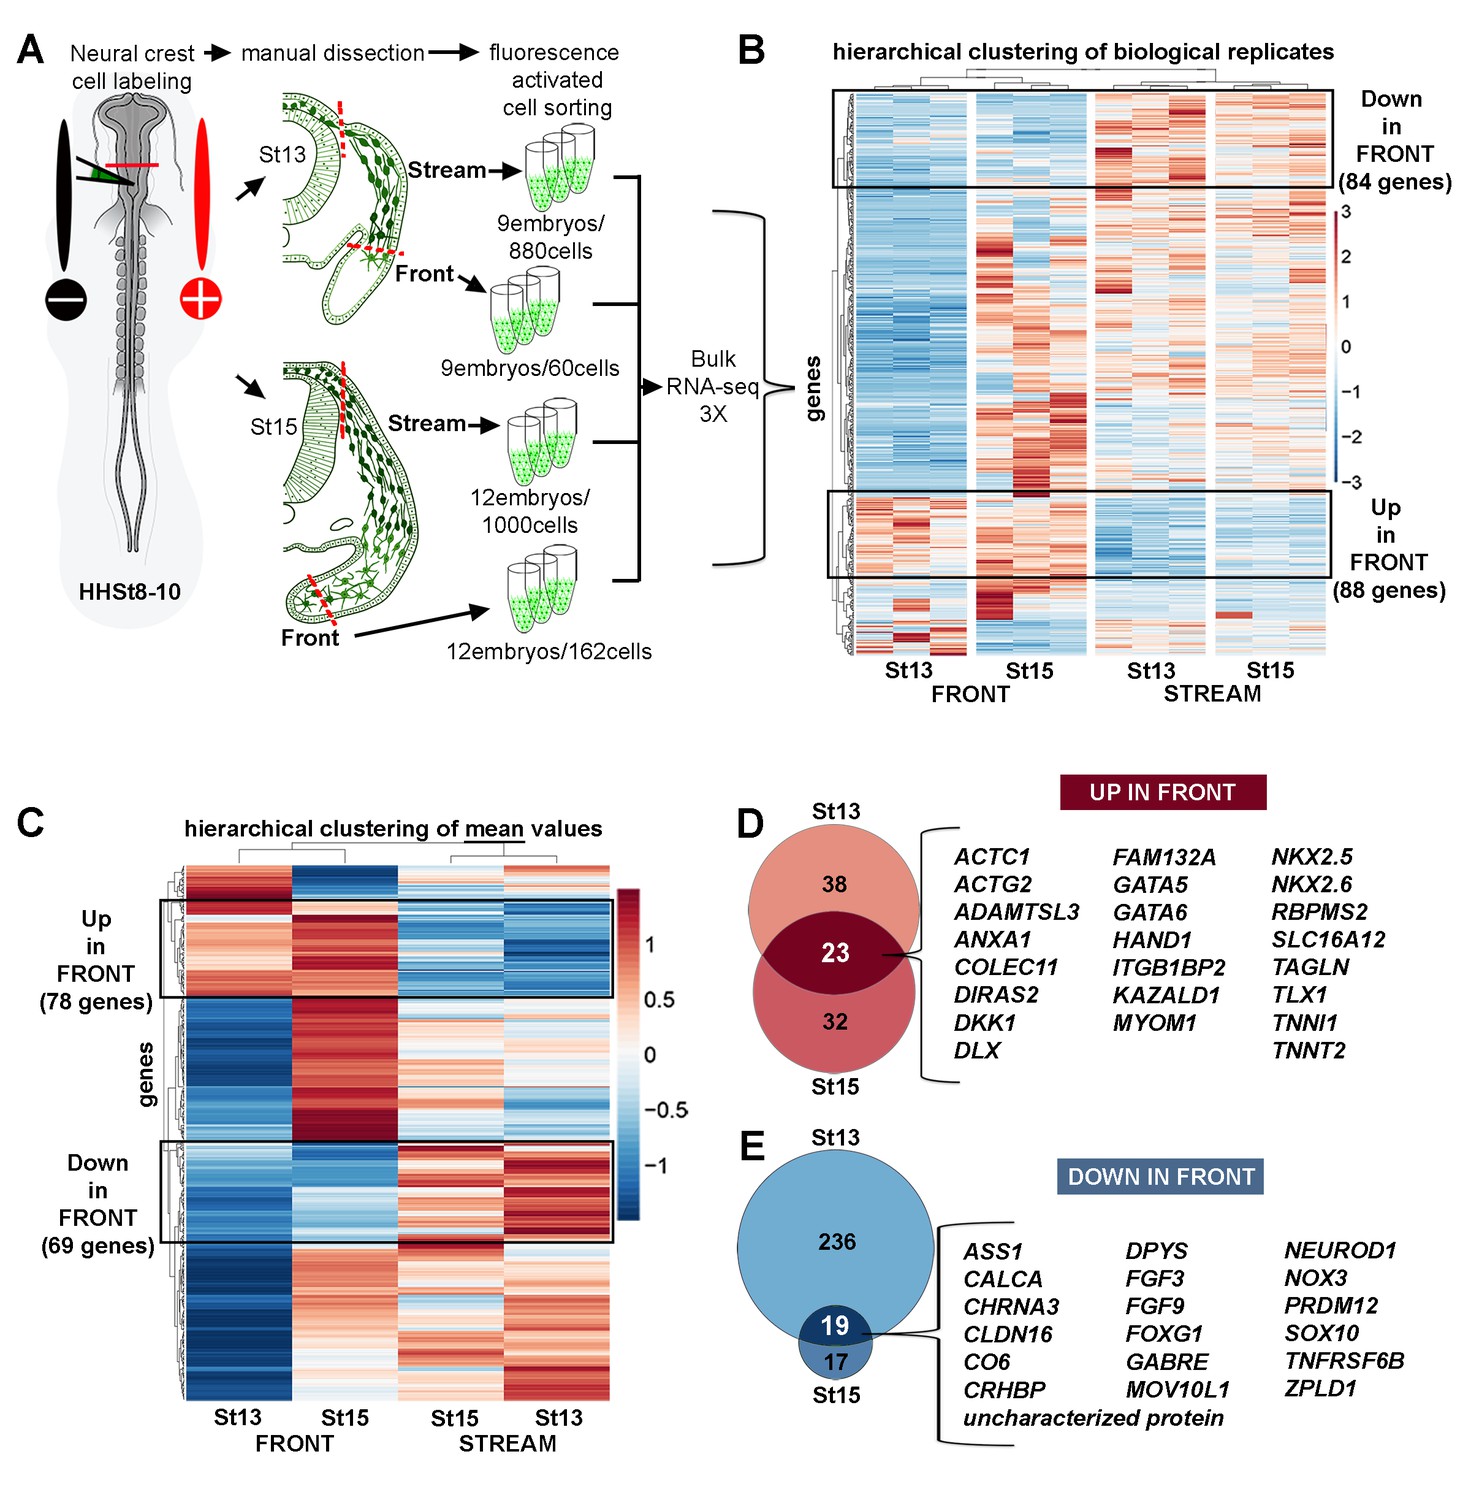
Bulk RNA-seq confirms the unique molecular profile of cells at the invasive front of the neural crest stream.
(A) Schematic representation of method used for harvesting samples from the cranial NC stream. Invasive front (Front) is the ventral-most 5% of NC cells. Stream is the remaining 95% of NC cells. n values as shown. (B) Heatmap of biological replicates of differentially expressed genes in HHSt13 and 15 Front and Stream (n = 477 genes). Black boxes contain gene clusters expressed at significantly higher and lower levels by the Front. (C) Heatmap of mean values of differentially expressed genes in HHSt13 and 15 Front and Stream samples (n = 477 genes). Black boxes contain gene clusters expressed at significantly higher and lower levels by the Front. (D) Venn diagram displaying the numbers of genes enriched at the Front of the NC stream at both HHSt13 and 15 with a union of 23 genes enriched in both comparisons. (E) Venn diagram displaying the numbers of genes reduced at the front of the NC stream at both HHSt13 and 15 with a union of 19 genes reduced in both comparisons. Hamburger and Hamilton (1951); St, stage.
-
Figure 1—source data 1
Bulk RNA-seq differential expression gene lists.
All differential expression thresholds were set at log2 fold-change (FC) greater than 2 or less than −2 and False Discovery Rate (FDR) less than 0.05. Individual pairwise comparisons are displayed as individual tabs within the spreadsheet.
- https://doi.org/10.7554/eLife.28415.004
Figure 1—figure supplement 1
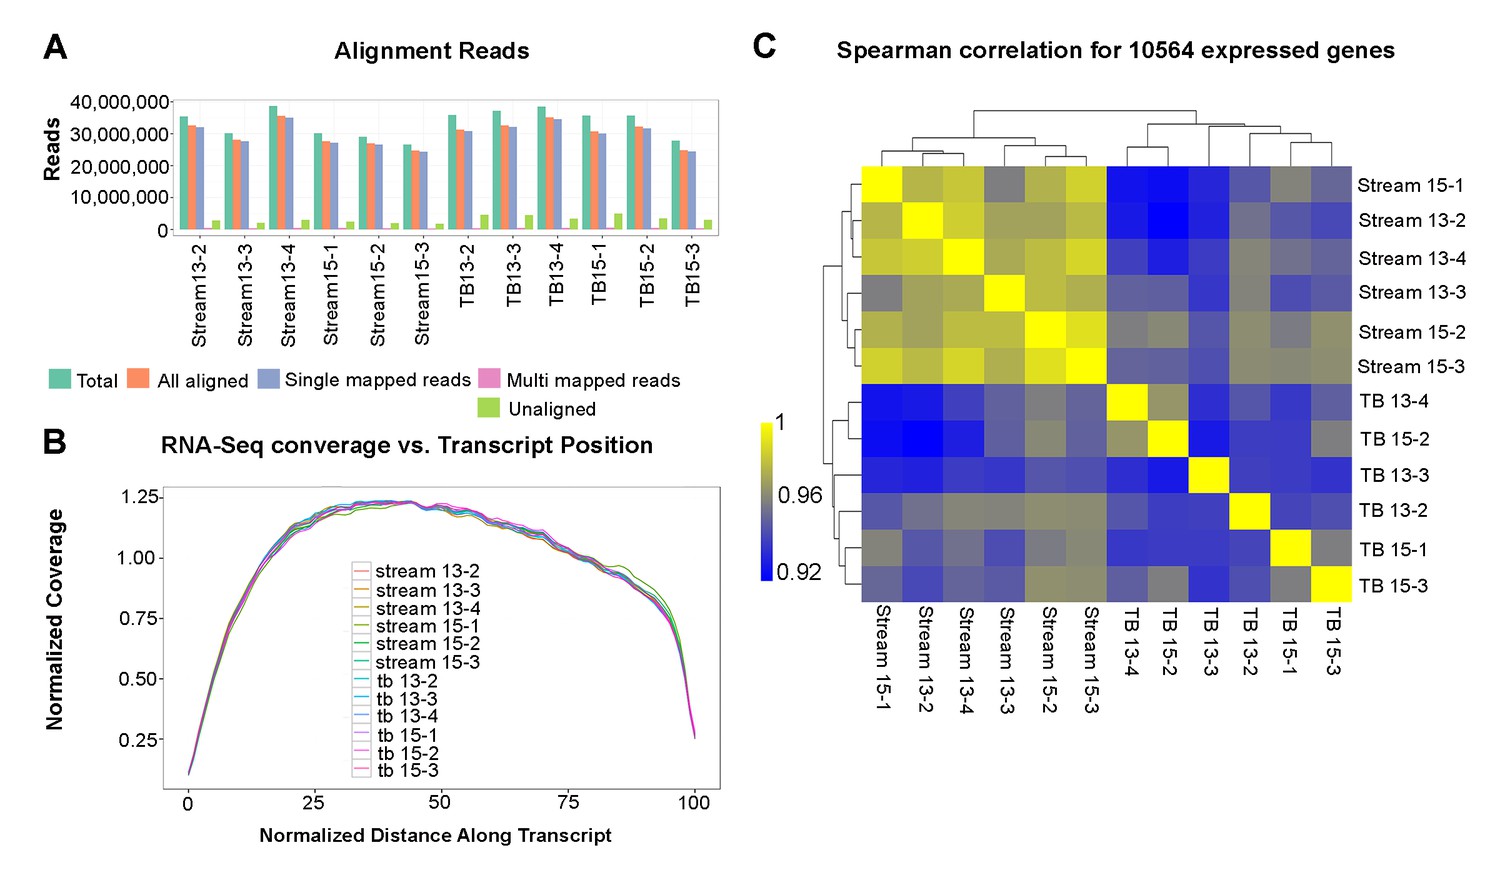
Bulk RNA-seq quality control analyses.
(A) Bulk RNA-seq sample alignment metrics, where ‘Total aligned’ represents the number of fragments in FASTQ files and ‘All aligned’ is the sum of single- and multi-mapped reads. (B) Average normalized coverage calculated using Picard for the top 1000 expressed transcripts to measure the evenness of coverage. The plot shows the coverage versus position on the transcript for all samples, with all transcripts scaled to a length of 100. (C) Clustered Spearman correlation between all sample biological replicates based upon genes expressed at FPKM > 2 in at least one sample. Note all correlations are greater than 0.9.
Figure 2 with 2 supplements

Single-cell RNA-seq shows in vitro and in vivo neural crest have distinct molecular signatures.
(A) Schematic representation of method used for harvesting samples from the cranial NC stream. Front is the ventral-most 5% of NC cells. Lead is the 25% of NC cells immediately following the Front cells. Trail is the remaining dorsal-most 70% of NC cells. Neural crest cells grown in vitro overnight from isolated neural tubes were also isolated for this analysis. (B) Numbers of single cells isolated from different subpopulations. (C) Pearson correlation matrix of the average expression profiles, based upon all differentially expressed genes all subpopulations analyzed (n = 1355 genes). (D) Principal Component Analysis (PCA) of all in vitro and in vivo single cells using all differentially expressed genes (n = 1355 genes). (E) Condensed Gene Ontology (GO) analysis of genes upregulated in in vivo NC cells compared to in vitro NC cells (n = 806 genes). (F) Bar chart displaying NC relevant genes increased in in vivo NC cells compared to in vitro NC cells. HH, Hamburger and Hamilton (1951); St, stage.
-
Figure 2—source data 1
Single-cell RNA-seq differential expression gene lists for all spatiotemporal subpopulation pairwise comparisons.
All differential expression thresholds were set at log2 FC greater than 2 or less than −2 and adjusted p value less than 0.05. Individual pairwise comparisons are displayed as individual tabs within the spreadsheet.
- https://doi.org/10.7554/eLife.28415.008
-
Figure 2—source data 2
Single-cell RNA-seq differential expression gene list comparing in vitro and in vivo cells.
Differential expression threshold was set at log2 FC greater than 2 or less than −2 and adjusted p value less than 0.05.
- https://doi.org/10.7554/eLife.28415.009
Figure 2—figure supplement 1
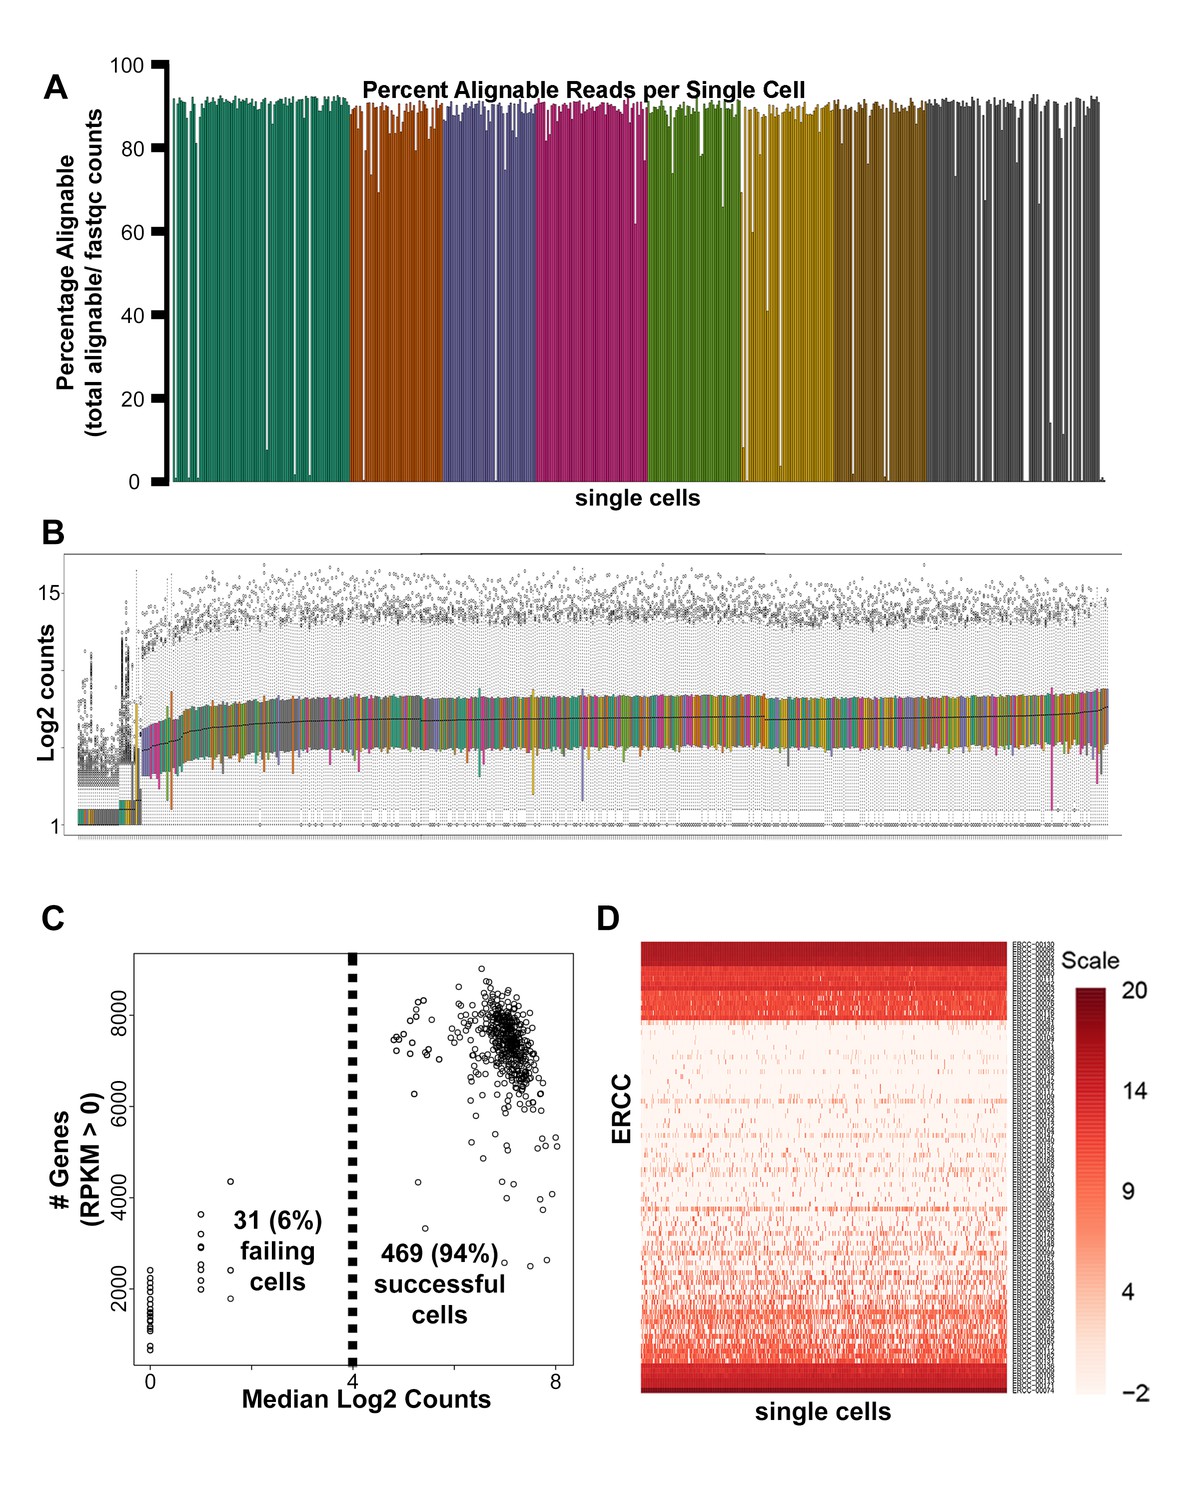
Single-cell RNA-seq quality control analyses.
(A) Mapped read percentages for all single cells sequenced (n = 500). Two cells of the 502 cells harvested (0.4%) failed cDNA quality control measures and were not subsequently sequenced. (B) Box plots of log2 counts for 500 sequenced single cells. (C) Scatter plot of median log2 read count versus number of genes detected for each single cell sequenced. 31 (6.2%) of the 500 single cells sequenced were removed from downstream analysis due to distinctly lower counts (B–C). (D) Heatmap of log2 RPKM obtained for all External RNA Controls Consortium (ERCC) spike-ins across all single cells sequenced.
Figure 2—figure supplement 2
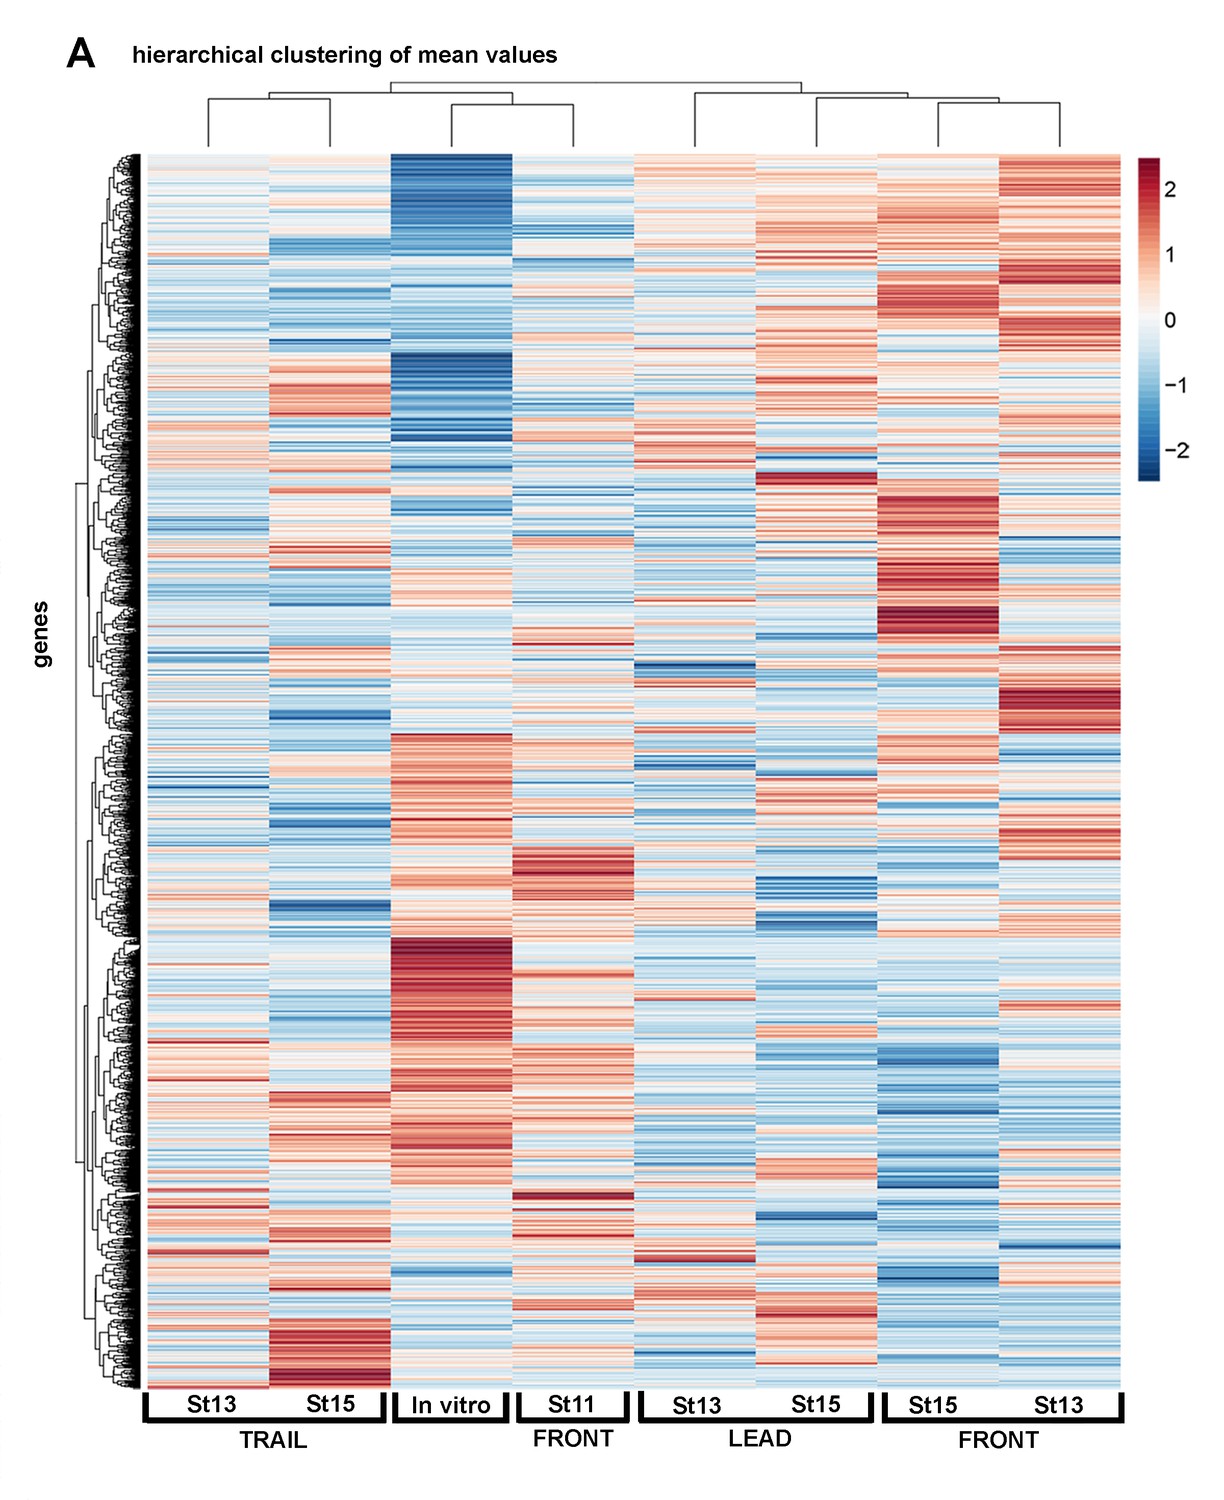
Single-cell RNA-seq averages show regional and temporal expression differences within the neural crest stream.
Heatmap of single cell mean values of differentially expressed genes of all cell subpopulations analyzed (n = 1355 genes).
Figure 3 with 1 supplement
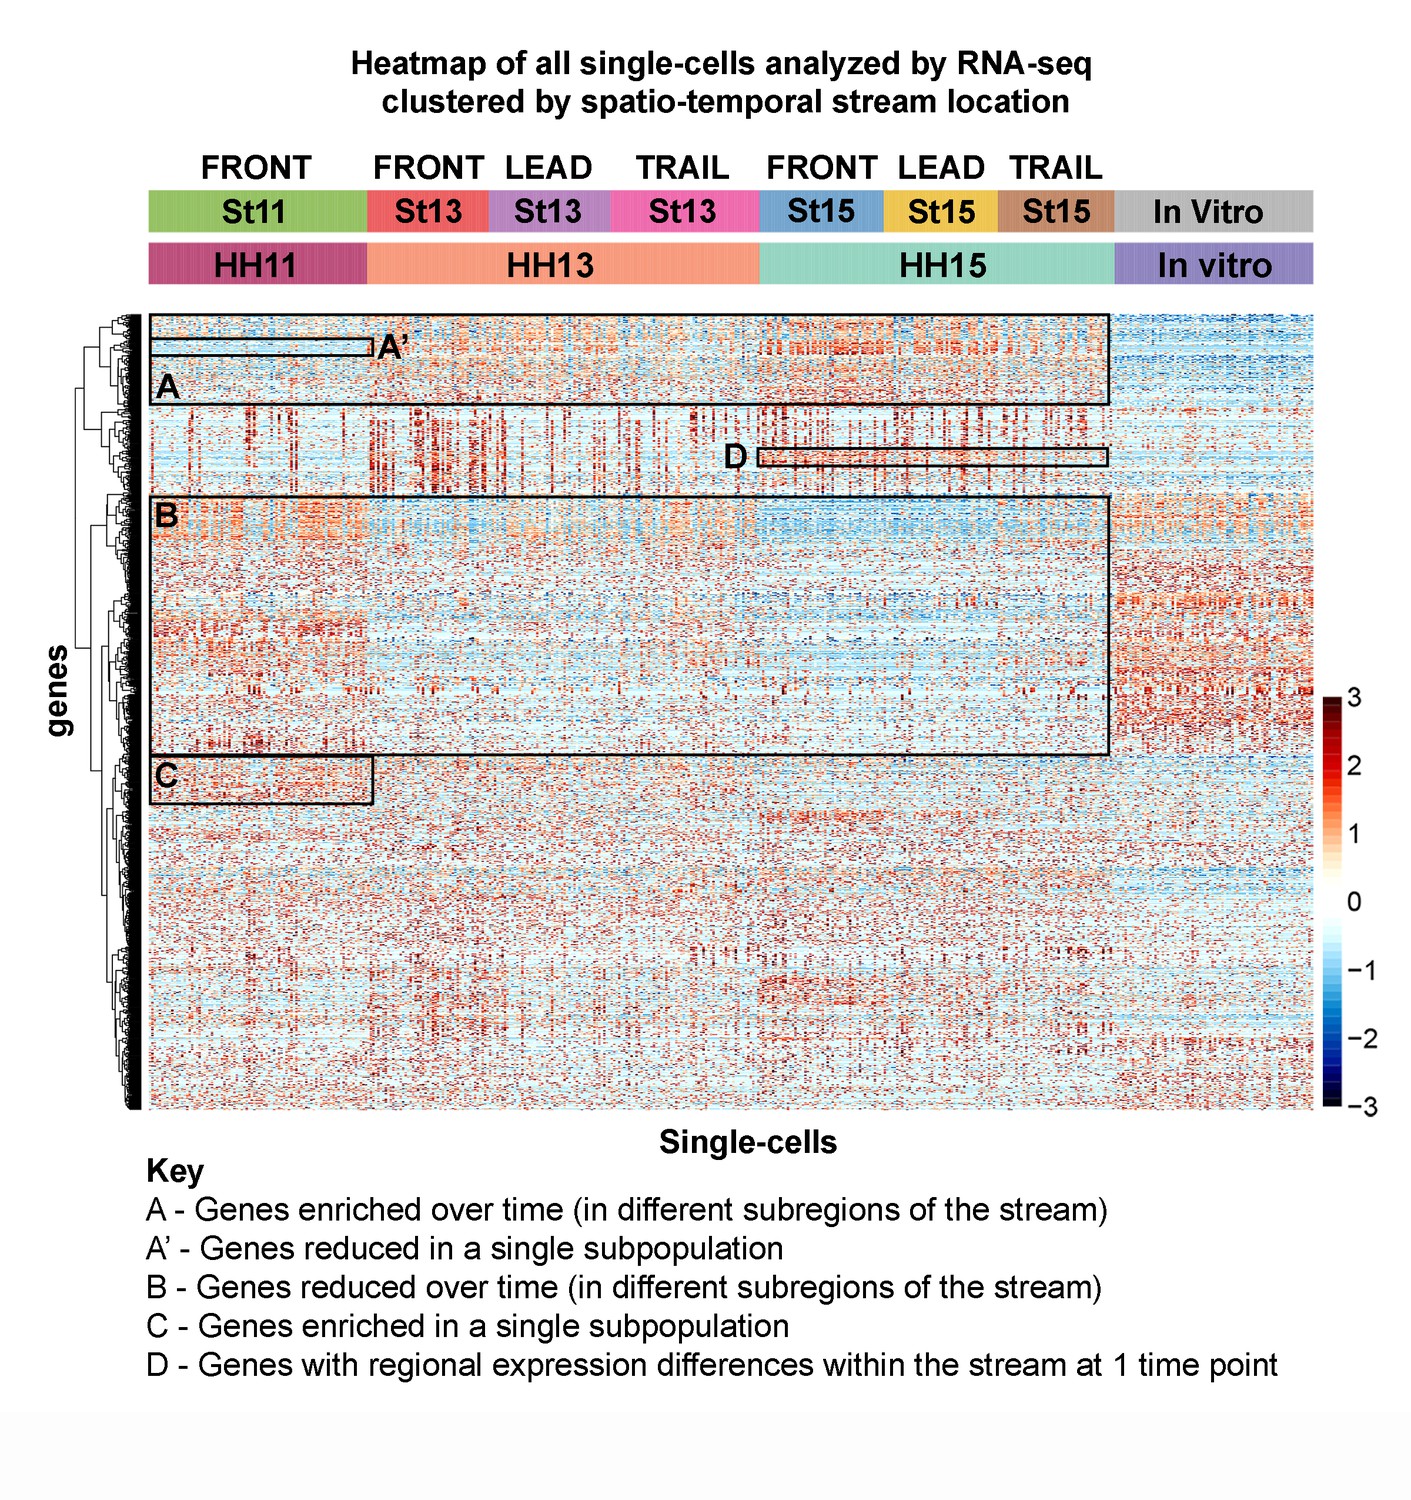
Single-cell RNA-seq exposes novel subpopulations within the neural crest stream.
Heatmap of all single cells (n = 469 single cells, 1355 genes) analyzed by RNA-seq with single cells clustered by spatiotemporal location. (Box A) Genes increased with developmental time and spatial location. (Box A’) Example of genes uniquely downregulated by an individual subpopulation. (Box B) Genes decreased with developmental time and spatial location. (Box C) Example of genes uniquely upregulated by an individual subpopulation. (Box D) Example of regional differences within one developmental stage.
Figure 3—figure supplement 1
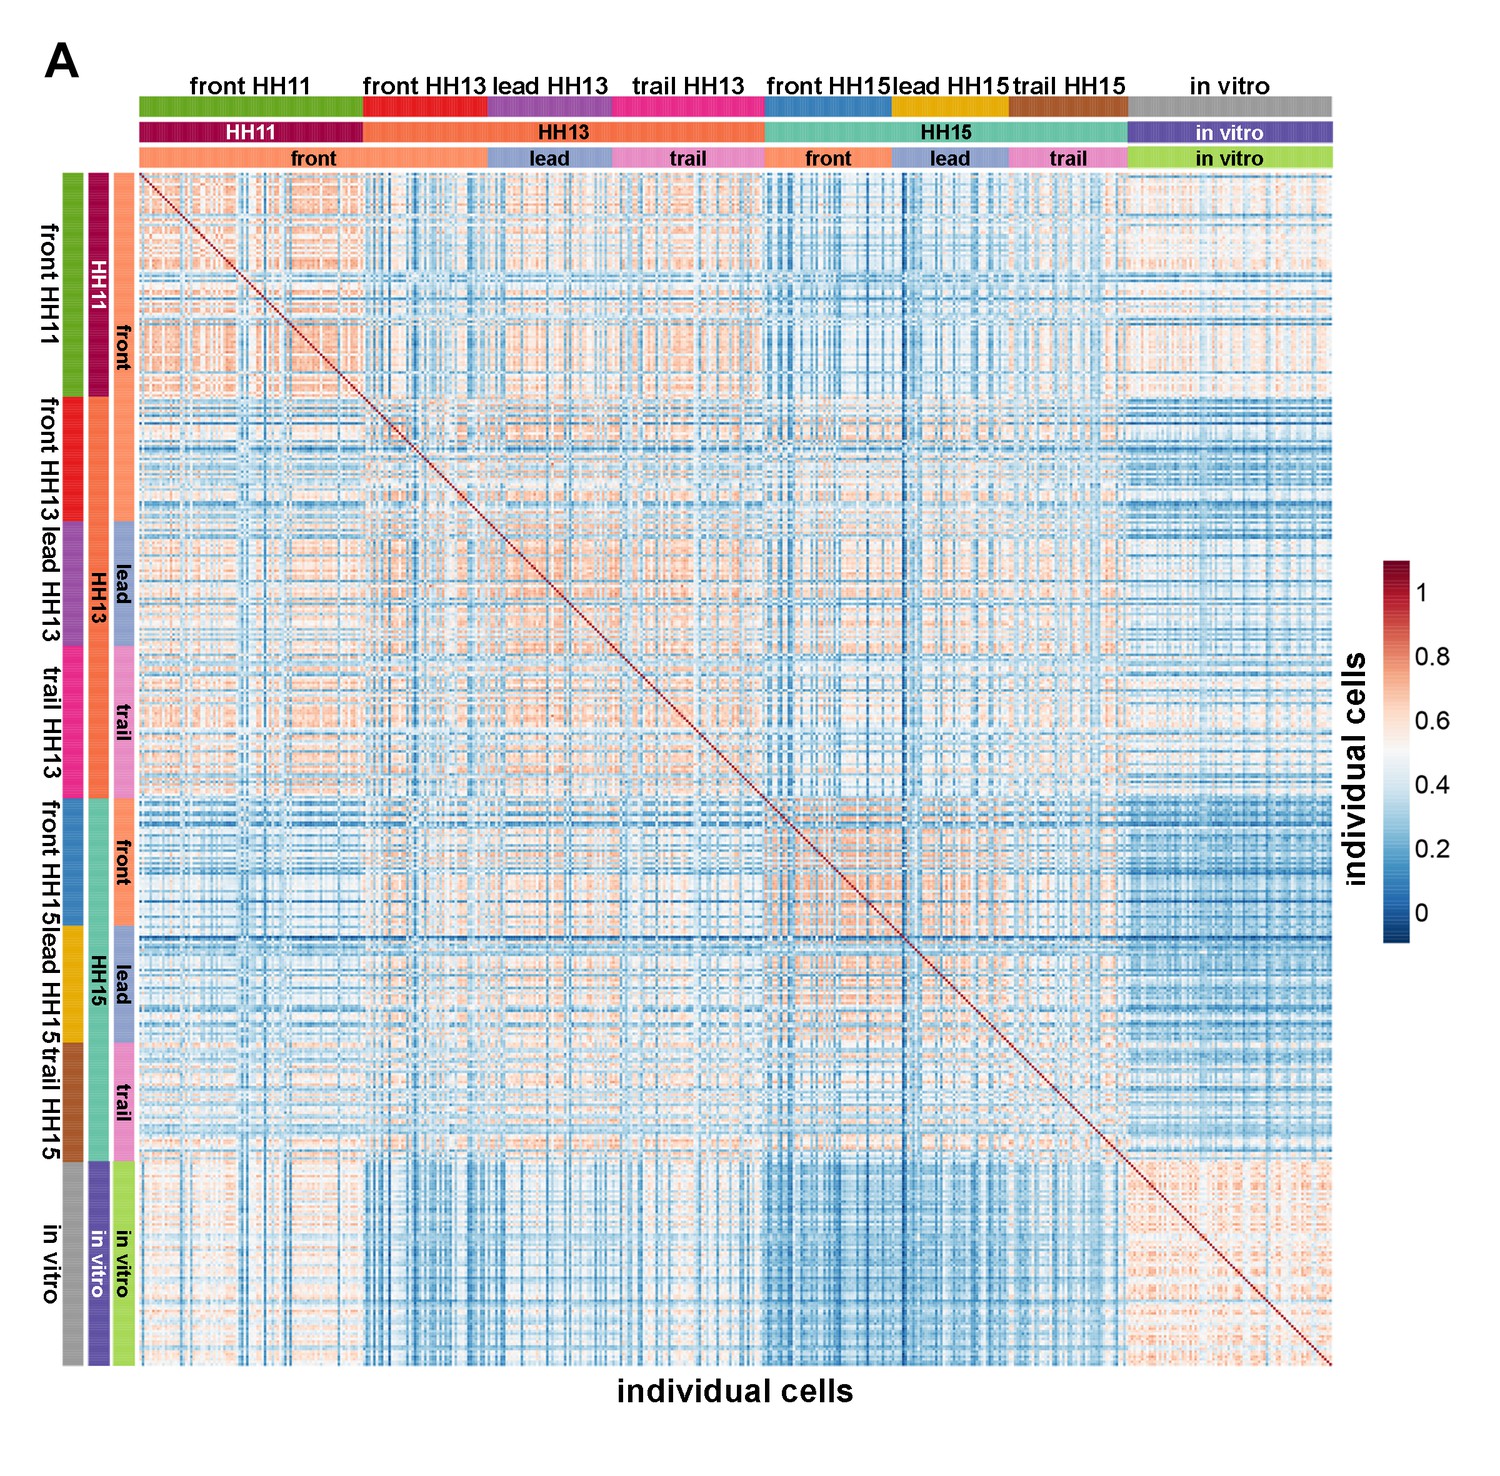
Pearson correlation matrix comparing the similarity of single-cell transcriptomes.
All genes differentially expressed in any pairwise comparison of single-cell spatiotemporal subpopulations were used to display the similarity of transcriptomes.
Figure 4
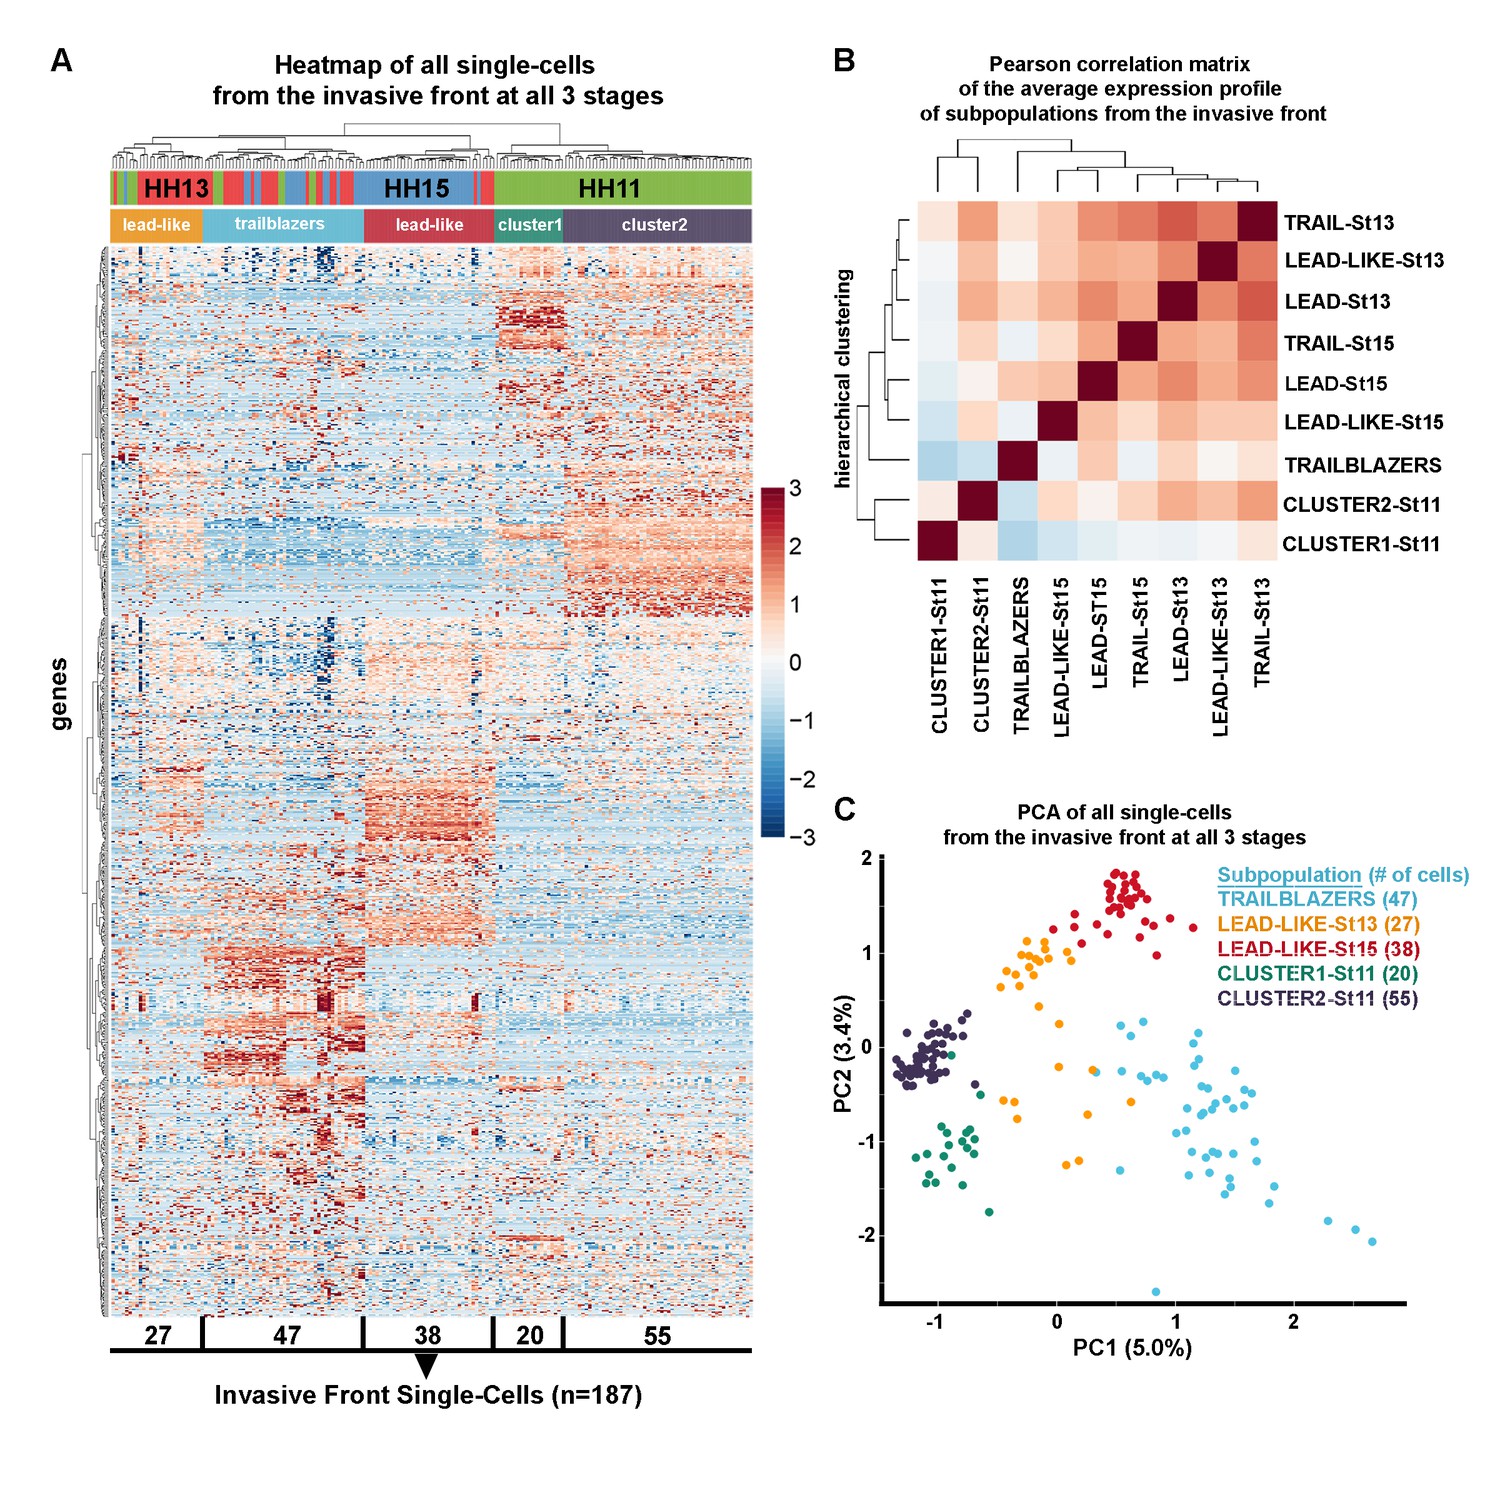
Trailblazers are a small subpopulation of cells with a distinct expression signature that exist at the invasive front of the neural crest stream, regardless of developmental stage.
(A) Heatmap with hierarchical clustering of all single cells from the invasive front at HHSt11, 13 and 15 (n = 187 cells), based upon differentially expressed genes from all invasive front comparisons and invasive front compares to stream at HHSt13 and HHSt15 (n = 760 genes). (B) Pearson correlation matrix of the average expression profile of all subpopulations based upon differentially expressed genes from all invasive front comparisons and comparisons between clusters and all other in vivo cells (n = 3555 genes). (C) PCA of all single cells from the invasive front at all three developmental time points, based upon differentially expressed genes from all invasive front comparisons and invasive front compares to stream at HHSt13 and HHSt15 (n = 760 genes).
-
Figure 4—source data 1
Single-cell RNA-seq differential expression gene lists for all invasive front subpopulation comparisons.
All differential expression thresholds were set at log2 FC greater than 2 or less than −2 and adjusted p value less than 0.05. Individual comparisons of invasive front subpopulations to all other cells isolated in vivo are displayed as individual tabs within the spreadsheet. Mean RPKM and the percentage of cells within each subpopulation that express each gene are also listed.
- https://doi.org/10.7554/eLife.28415.013
Figure 5
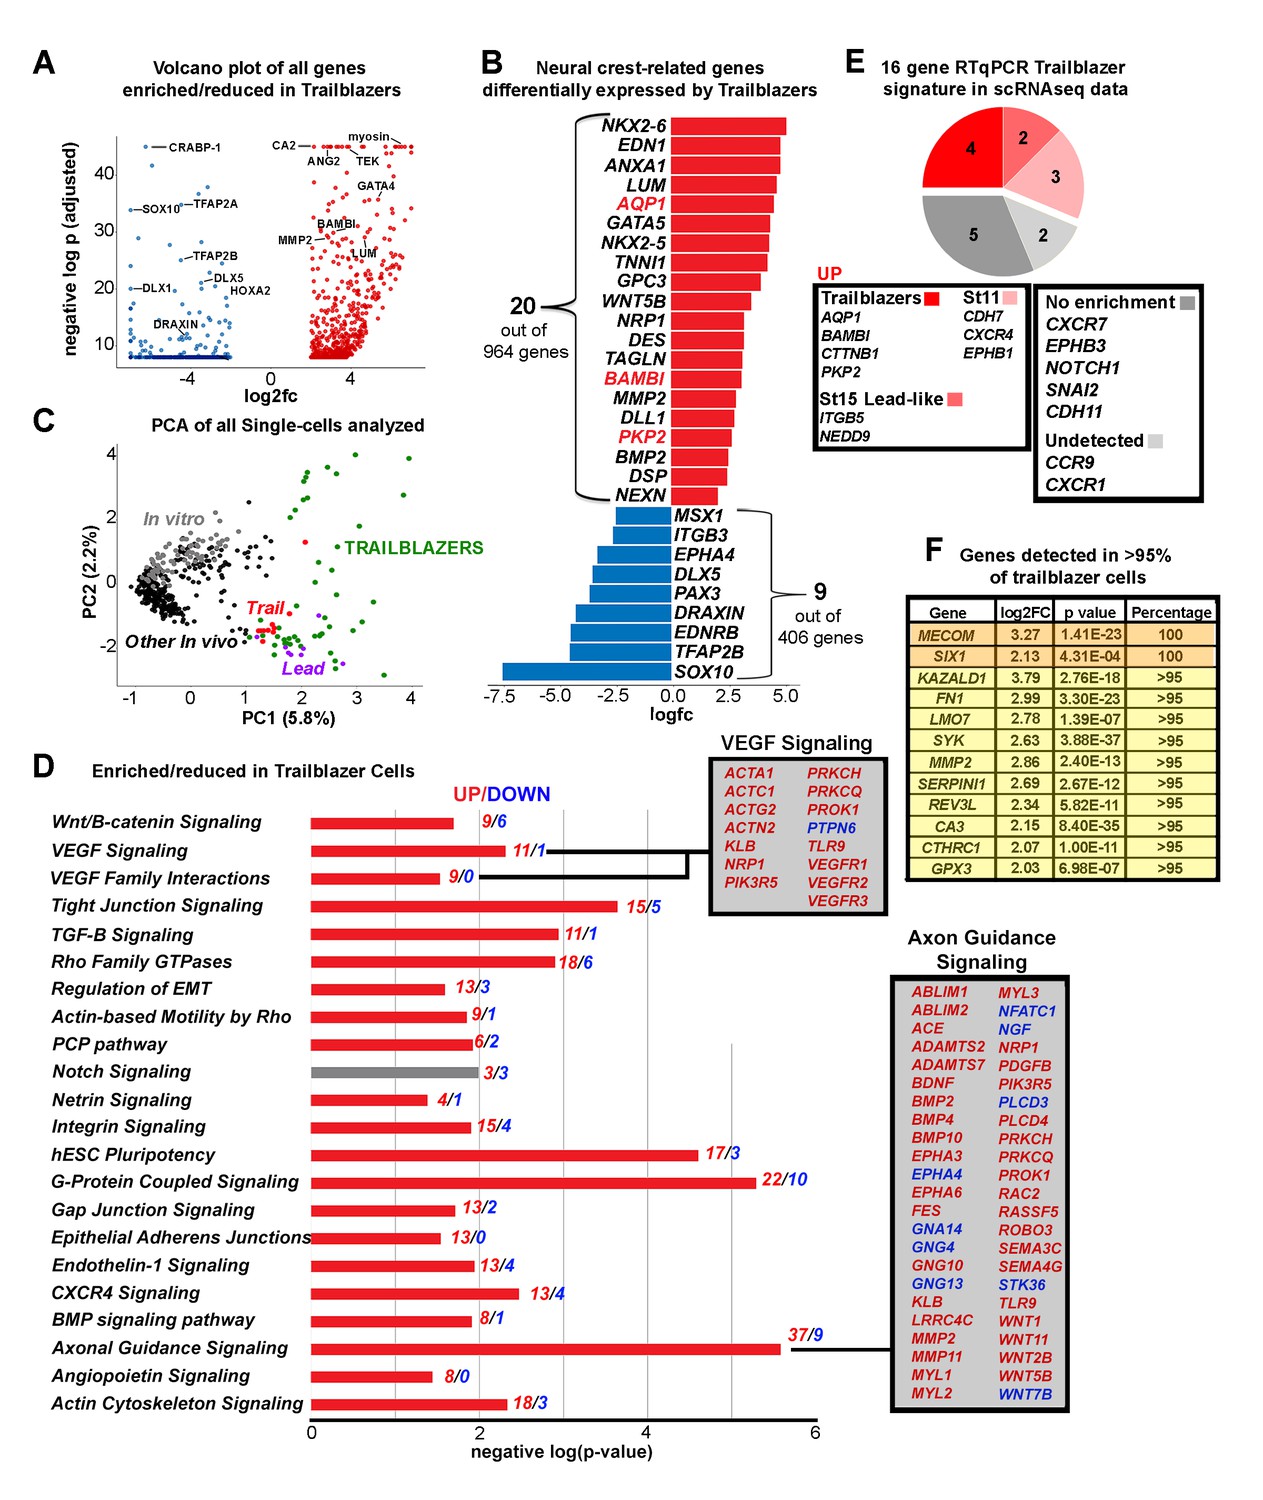
The Trailblazer signature represents tissue development, adhesion and a lack of differentiation.
(A) Volcano plot of all genes statistically enriched or reduced in Trailblazers (n = 47 cells, 1370 genes). (B) Bar chart showing examples of neural crest-related differentially expressed genes in Trailblazers (red designates previously identified in McLennan et al., 2015). (C) PCA of all single cells analyzed showing minimal overlap of other in vivo (black dots) and in vitro (gray dots) with the Trailblazers (green dots) (n = 1370 genes). (D) Significant signaling pathways predicted to be enriched (red) or reduced (blue) in Trailblazers. VEGF and axonal guidance signaling are highlighted. The statistical significance was set at log (−1.3) [p<0.05]. (E) Comparison to previous RT-qPCR generated trailblazer signature. (F) Genes enriched and detected in >95% of trailblazer cells.
-
Figure 5—source data 1
Unbiased signaling pathways enriched in single cell subpopulations.
Differentially expressed genes (log2 FC greater than 2 or less than −2 and adjusted p value less than 0.05) used to identify enriched (-log(p-value) greater than 1.3; p value less than 0.05) signaling pathways.
- https://doi.org/10.7554/eLife.28415.015
Figure 6 with 3 supplements

Expression and functional perturbations of selected genes enriched in Trailblazers.
(A–M) Typical cranial neural crest cell migratory streams at HHSt13 adjacent to rhombomere 4 (r4) with HNK-1-positive cells color coded by the number of PKP2 (Plakophilin 2; A), Desmin (B), KAZALD1 (Kazal Type Serine Peptidase Inhibitor Domain1; C), Tescalcin (D), Troponin I1 (E), Annexin1 (F), Glypican 3 (G), BDNF (Brain Derived Neurotrophic Factor; H), Nexilin (I), BAMBI (BMP and Activin Membrane Bound Inhibitor; J), Desmoplakin (K), TFPI2 (Tissue Factor Pathway Inhibitor 2; L), and CDH5 (Cadherin 5; M). RNAscope spots detected per cell. (A’–M’) Single cells outlined with expression were selected from each neural crest cell migratory stream and (A”–M”) the number of RNAscope spots per cell volume for a cell with high expression and adjacent neighboring cells is shown in the bar graphs. (N) Schematic representation of morpholino and electroporation procedure. (O) Morpholino transfected migrating cranial neural crest migration at HHST15 (n = 16 control MO embryos, n = 20 EDN1 MO embryos, n = 20 PKP2 MO embryos, n = 20 MMP2 MO embryos, n = 7 GATA5 MO embryos, n = 5 WNT5B MO embryos, n = 10 GPC3 MO embryos, n = 7 ANXA1 MO embryos, n = 22 LUM MO embryos). (P) Correlation plot of distance migrated and expression in trailblazers. Circle size correlates with statistical significance: PKP2 MO, p=0.017, EDN1 MO, p=0.0004, MMP2 MO, p=0.0032, GATA5 MO, p=0.022, WNT5B MO, p=0.0001 (Q) Box plot of the distance migrated of morpholino transfected neural crest cells as a percentage of the distance from the neural tube to the tip of the branchial arch. HH, Hamburger and Hamilton (1951); St, stage; OV, otic vesicle; MO, morpholino. Bar = 20 um (A–G). Bar = 15 um (H–M). Bar = 50 um (O).
-
Figure 6—source data 1
Primer sequences used to test activity of splice blocking morpholinos.
The three morpholinos tested as well as the gene Ensemble IDs and primer sequences used to test morpholino activity are shown. Primers were also designed and used for sequence upstream of the region targeted by morpholino for controls.
- https://doi.org/10.7554/eLife.28415.020
Figure 6—figure supplement 1
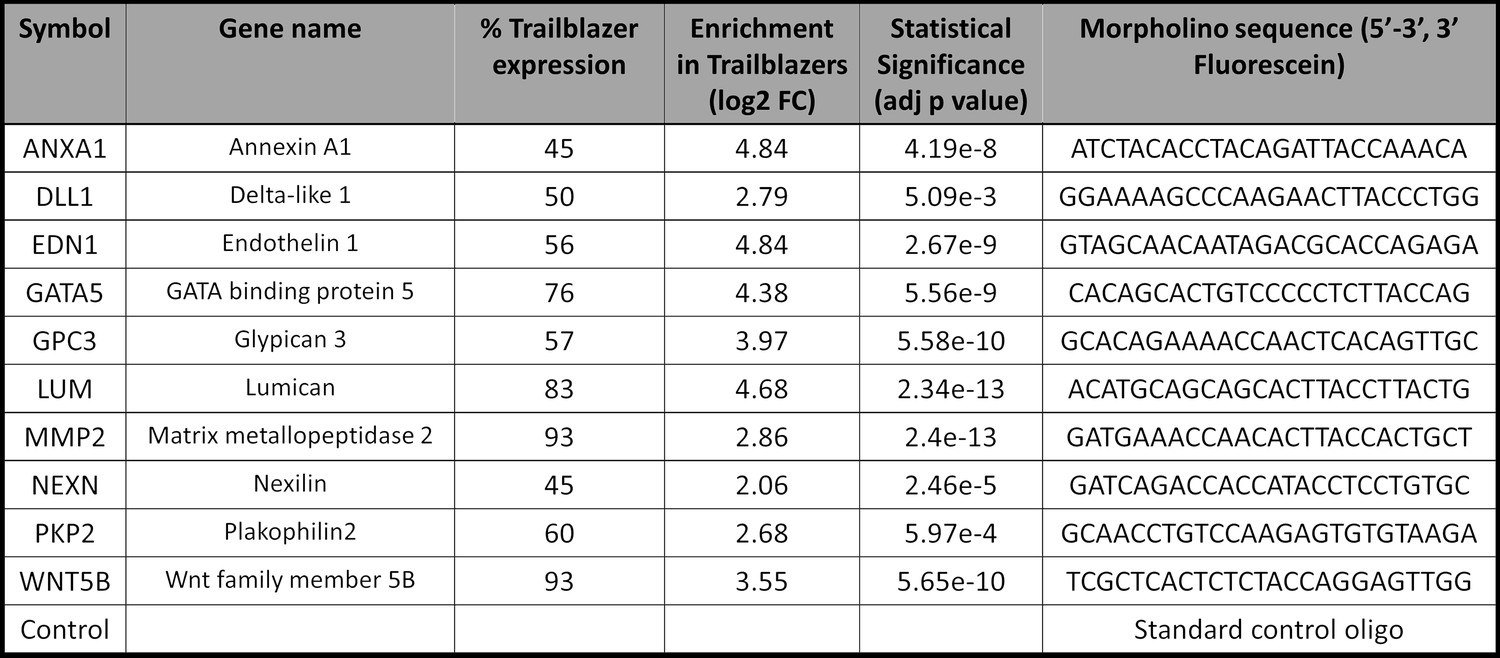
Trailblazer genes chosen for perturbation experiments.
Genes were chosen for perturbation experiments based on percentage of trailblazers expression, level of expression, significance and relevance to neural crest cell migration.
Figure 6—figure supplement 2
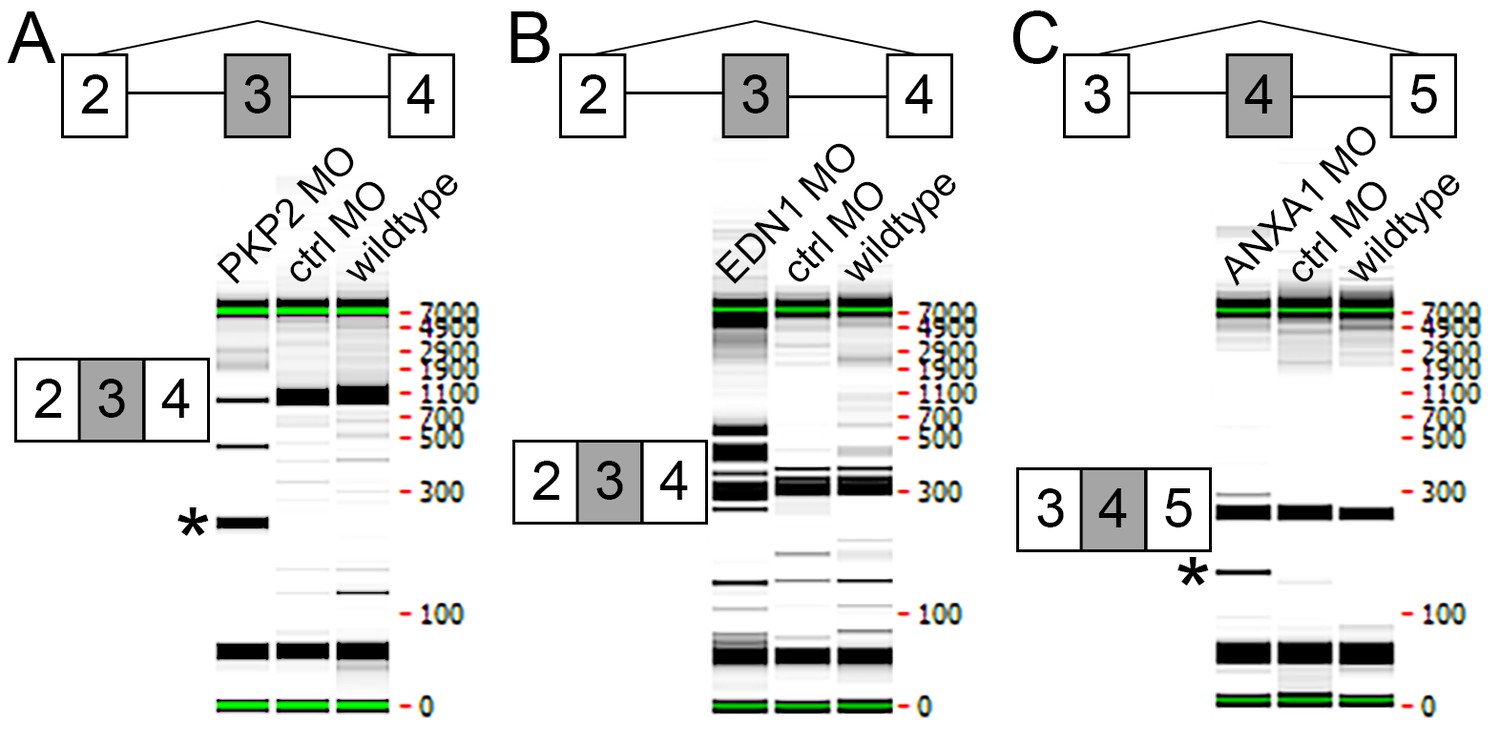
Testing of splice blocking morpholinos.
LMH chicken cell line was transfected with control or experimental morpholinos. RT-PCR primers flanking the region affected by each morpholino were then used to demonstrate perturbation of translation. (A) Transfection with PKP2 MO lead to an excision of exon 3 as determined using primers designed within exons 2 and 4 (*). (B) Transfection with EDN1 MO lead to an excision of some of the gene as well as larger fragments, probably due to inclusion of intron 3 and/or frameshift effects. (C) Transfection with ANXA1 MO lead to an excision of exon 4 as determined using primers designed within exons 3 and 5 (*).
Figure 6—figure supplement 3
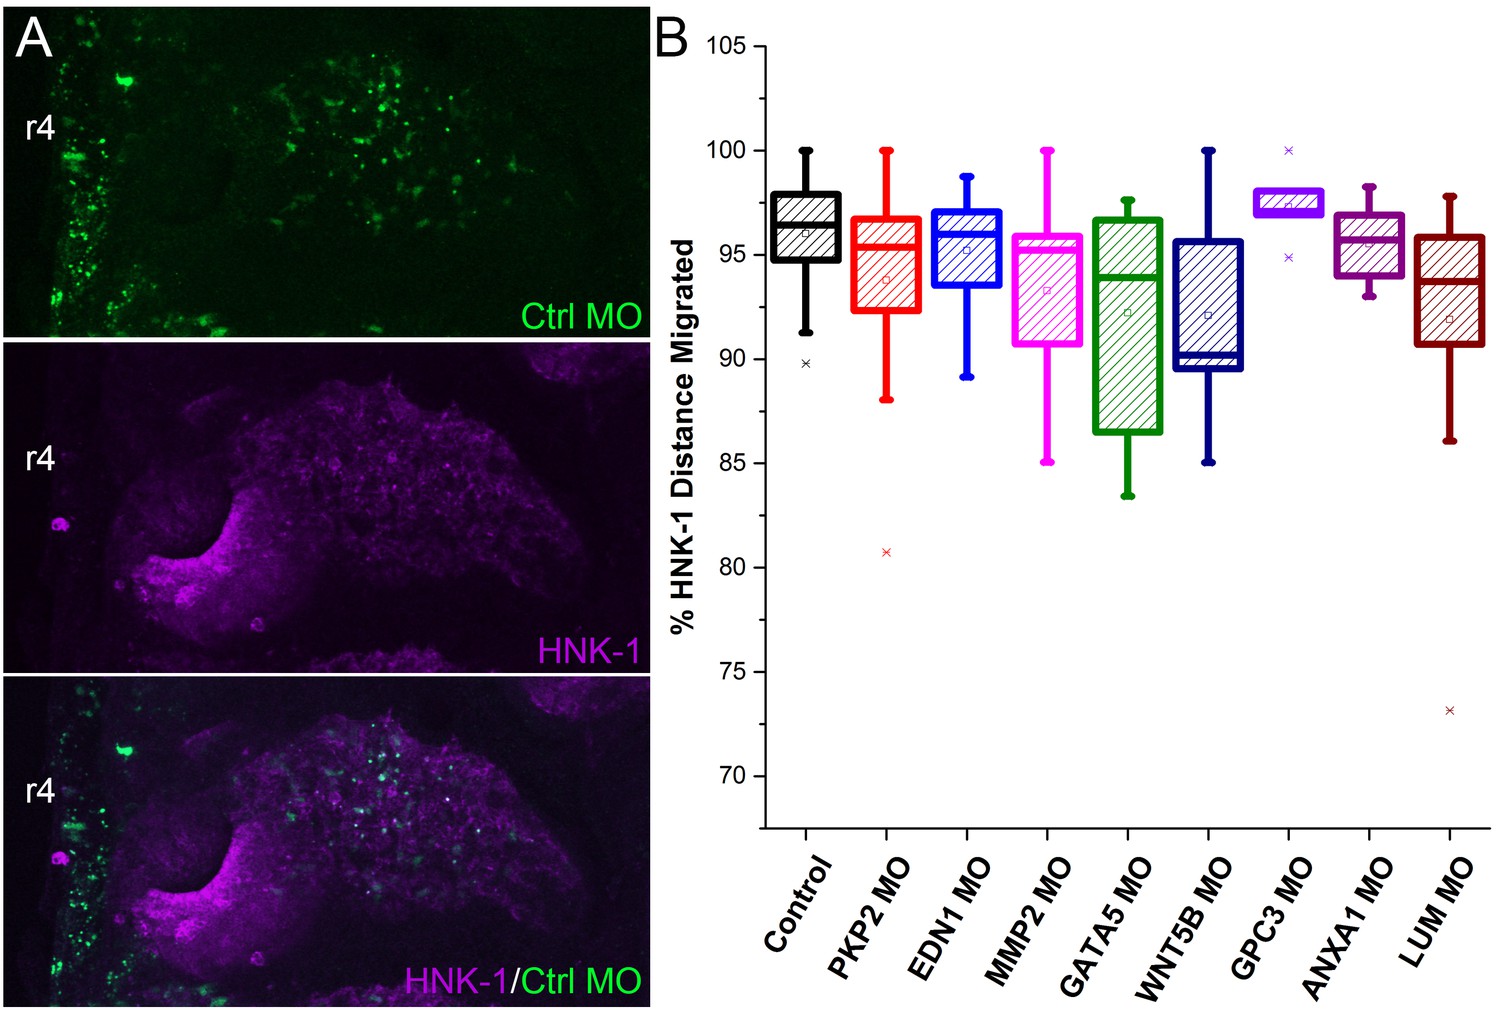
Analysis of stream neural crest migration after morpholino transfections in a subset of neural crest.
(A) Example images on which analysis was performed showing morpholino (green) and HNK-1 (purple). (B) Box plot of the distance migrated of HNK1 positive neural crest cells as a percentage of the distance from the neural tube to the tip of the branchial arch after morpholino transfection. HNK1 distance measurements were made on the same embryos as analyzed in Figure 6Q. n = 16 control MO embryos, n = 20 EDN1 MO embryos, n = 20 PKP2 MO embryos, n = 20 MMP2 MO embryos. MMP2 MO, p=0.028, GATA5 MO, p=0.02, WNT5B MO, p=0.05, LUM MO, p=0.02.
Figure 7
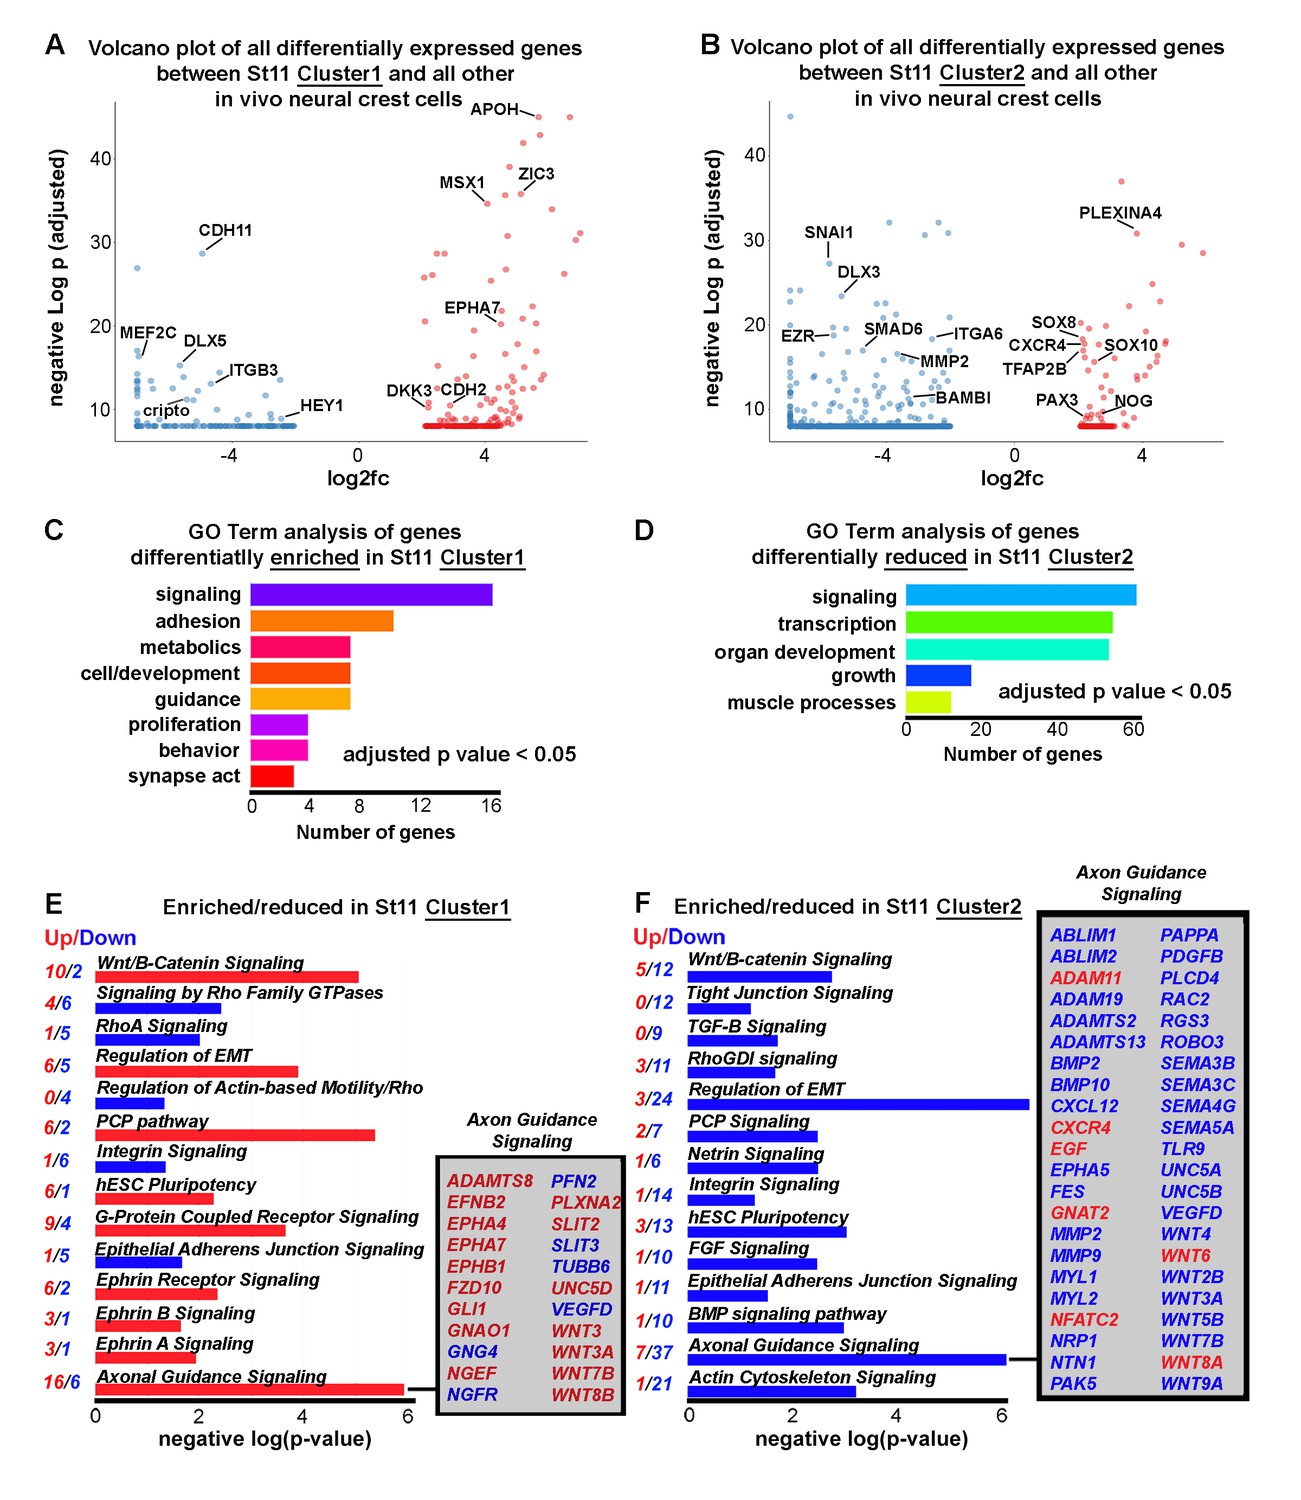
Newly emerging neural crest segregate into discrete groups representing a transition from EMT to directed migration.
(A) Volcano plot of all genes statistically enriched or reduced in St11 Cluster1 (n = 20 cells, 381 genes). (B) Volcano plot of all genes statistically enriched or reduced in St11 Cluster2 (n = 55 cells, 1040 genes). (C) GO Term analysis of genes differentially enriched by HHSt11 cluster1. No GO terms were reduced. (D) GO Term analysis of genes differentially reduced by HHSt11 cluster2. No GO terms were enriched. (E) Significant signaling pathways predicted to be enriched (red) or reduced (blue) in St11 Cluster1. Axonal guidance signaling is highlighted. (F) Significant signaling pathways predicted to be enriched (red) or reduced (blue) in St11 Cluster2. Axonal guidance signaling is highlighted. GO terms with a p-value<0.05 and a q-value <0.1 were considered significant. Significant GO terms were considered using the simplify function with an adjusted p-value cutoff of 0.05.
Figure 8
Lead and trailing subpopulations exhibit high degrees of heterogeneity.
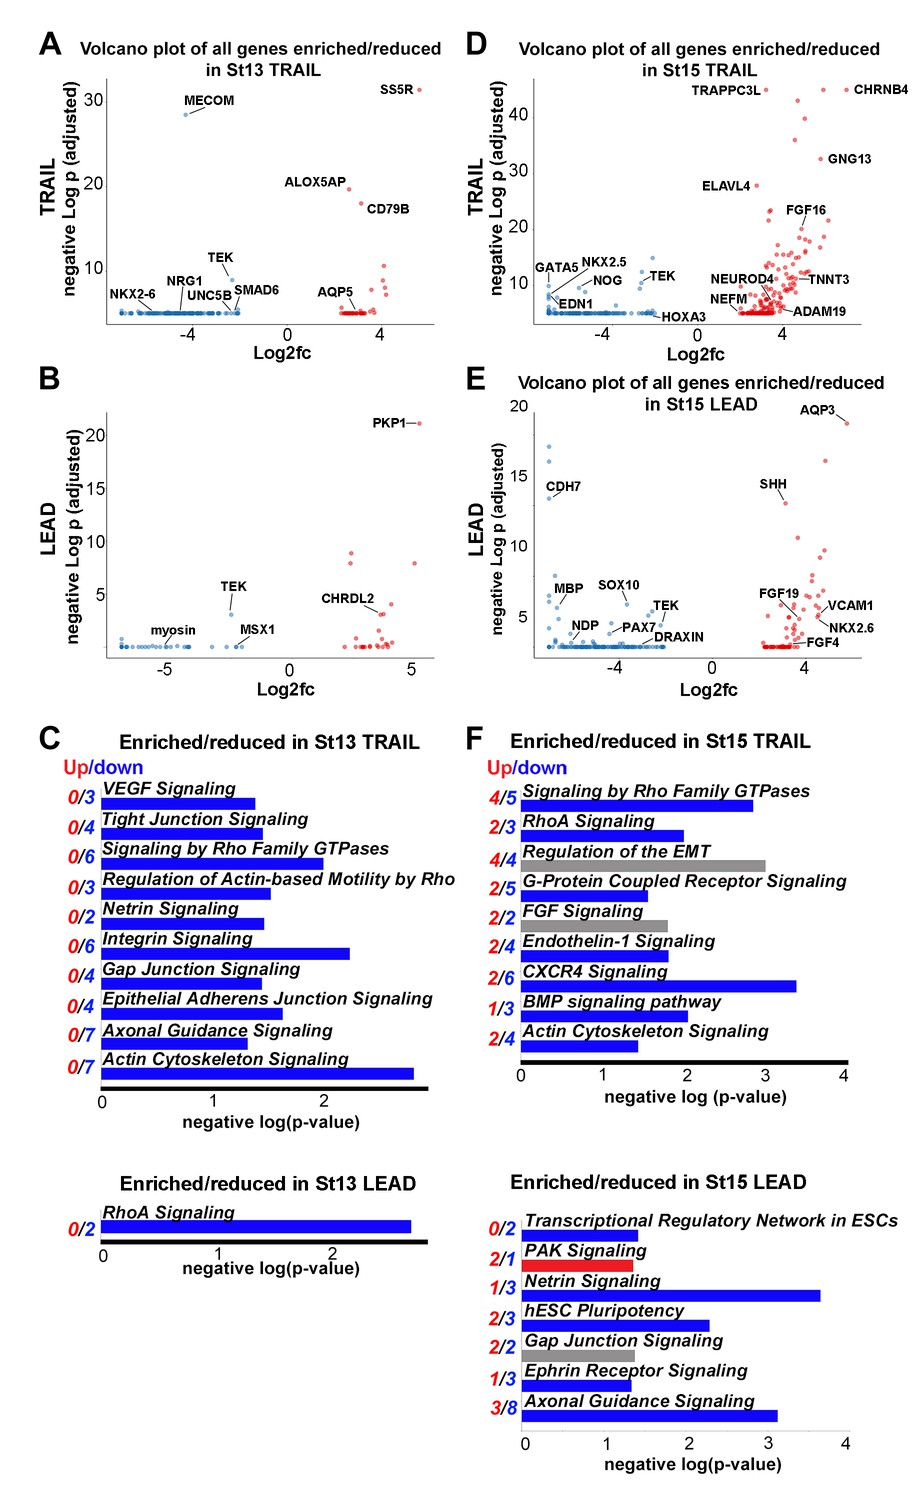
(A) Volcano plot of all genes statistically enriched or reduced in St13 Trail (n = 60 cells, 196 genes). (B) Volcano plot of all genes statistically enriched or reduced in St13 Lead (n = 49 cells, 61 genes). (C) Significant signaling pathways predicted to be enriched (red) or reduced (blue) in St13 Trail and Lead. (D) Volcano plot of all genes statistically enriched or reduced in St15 Trail (47 cells, n = 306 genes). (E) Volcano plot of all genes statistically enriched or reduced in St15 Lead (n = 46 cells, 215 genes). (F) Significant signaling pathways predicted to be enriched (red) or reduced (blue) in St15 Trail and Lead.
-
Figure 8—source data 1
Single-cell RNA-seq differential expression gene lists for HH13 and 15 Leader and Trailer subpopulations.
All differential expression thresholds were set at log2 FC greater than 2 or less than −2 and adjusted p value less than 0.05. Individual comparisons of HH13 and 15 Leader and Trailer subpopulations to all other cells isolated in vivo are displayed as individual tabs within the spreadsheet.
- https://doi.org/10.7554/eLife.28415.024
Videos
Video 1
RNAscope fluorescence signal of Tescalcin expression
A typical 3D confocal image z-stack of a HHSt13 chick embryo highlighting the neural crest cell migratory stream adjacent to rhombomere four with cells labeled for Tescalcin by RNAscope and neural crest cells marked by HNK1 immunohistochemistry. The HNK1 membrane label was used to mark the boundaries of neural crest cells and mask the Tescalcin channel in 3D. The locations of RNAscope label for Tescalcin were detected and assigned to individual cells using the HNK1 boundaries. The cells were then colored by the number of detected Tescalcin RNAscope label spots with red being the highest and blue the lowest. A typical cell is approximately 20–30 um in diameter.
Additional files
-
Supplementary file 1
Annotated code for all bioinformatic analysis
- https://doi.org/10.7554/eLife.28415.025
-
Transparent reporting form
- https://doi.org/10.7554/eLife.28415.026
Download links
A two-part list of links to download the article, or parts of the article, in various formats.
Downloads (link to download the article as PDF)
Open citations (links to open the citations from this article in various online reference manager services)
Cite this article (links to download the citations from this article in formats compatible with various reference manager tools)
Single-cell transcriptome analysis of avian neural crest migration reveals signatures of invasion and molecular transitions
eLife 6:e28415.
https://doi.org/10.7554/eLife.28415


