Uncoupling evolutionary changes in DNA sequence, transcription factor occupancy and enhancer activity
- European Molecular Biology Laboratory, Genome Biology Unit, Germany
- University of Illinois, United States
Figures
Figure 1 with 2 supplements

Conservation in TF occupancy across developmental and evolutionary time-scales.
(a) The regulatory network linking 5 mesodermal transcription factors essential for mesoderm specification. (b) D. melanogaster and D. virilis ChIP were performed using species-specific antibodies for Twi, Tin, Bap and Bin. Colored boxes illustrate TFs and time points analyzed, with developmental stages on the x-axis. (c) The scale illustrates equivalent time points for corresponding stages between D. melanogaster and D. virilis. Axis labels correspond to hours of development, after egg laying (AEL) and numbers below axis correspond to developmental stages and Time Points (TP 1–5). Confocal images of embryos with Mef2 immuno-stains at the most representative stage for each time-point, orientated anterior-left, dorsal-up. Barplots show percentage of embryos at each stage (x-axis) for each TP, averaged over two replicates. (d) Number of significant ChIP peaks in each condition in both species. TP1, TP2, etc, correspond to Time point 1, Time point 2 etc. D. melanogaster peaks are from (Zinzen et al., 2009). (e) Percentage of conserved peaks between D. melanogaster and D. virilis. (f) Peak summits in close proximity were used to define cis-regulatory modules (CRMs, see Materials and methods). (g) Venn diagram of orthologous CRMs conserved between both species; 3,497 CRMs (D. mel CRMs overlapping more than one D. vir CRMs are counted once).
Figure 1—figure supplement 1
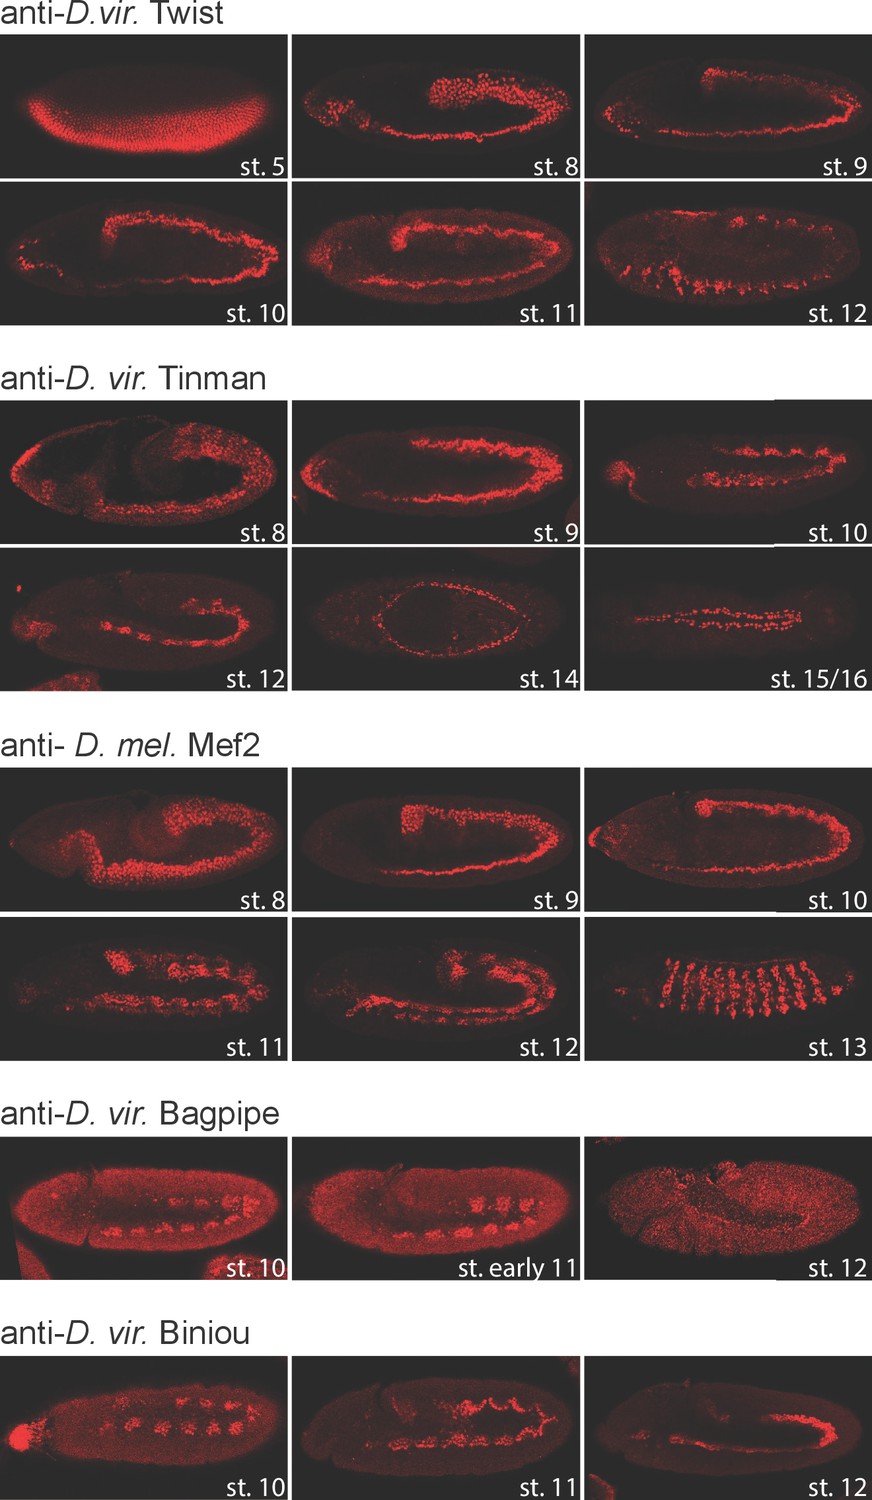
TF expression pattern in D. virilis embryos.
Fluorescent immunostaining of D. virilis embryos at the indicated stages using the same antibodies used for ChIP-seq experiments. With the exception of Mef2, all antibodies were generated specifically for this study directed against the D. virilis protein: anti-Dmel Mef2 (DRE5, second bleed), anti-Dvir for Twi (DNOH, third bleed), Tin (EJRI, third bleed), Bap (EJSJ, second bleed) and Bin (EHUD, third bleed). Developmental stages are shown in white. All embryos are oriented anterior-left.
Figure 1—figure supplement 2
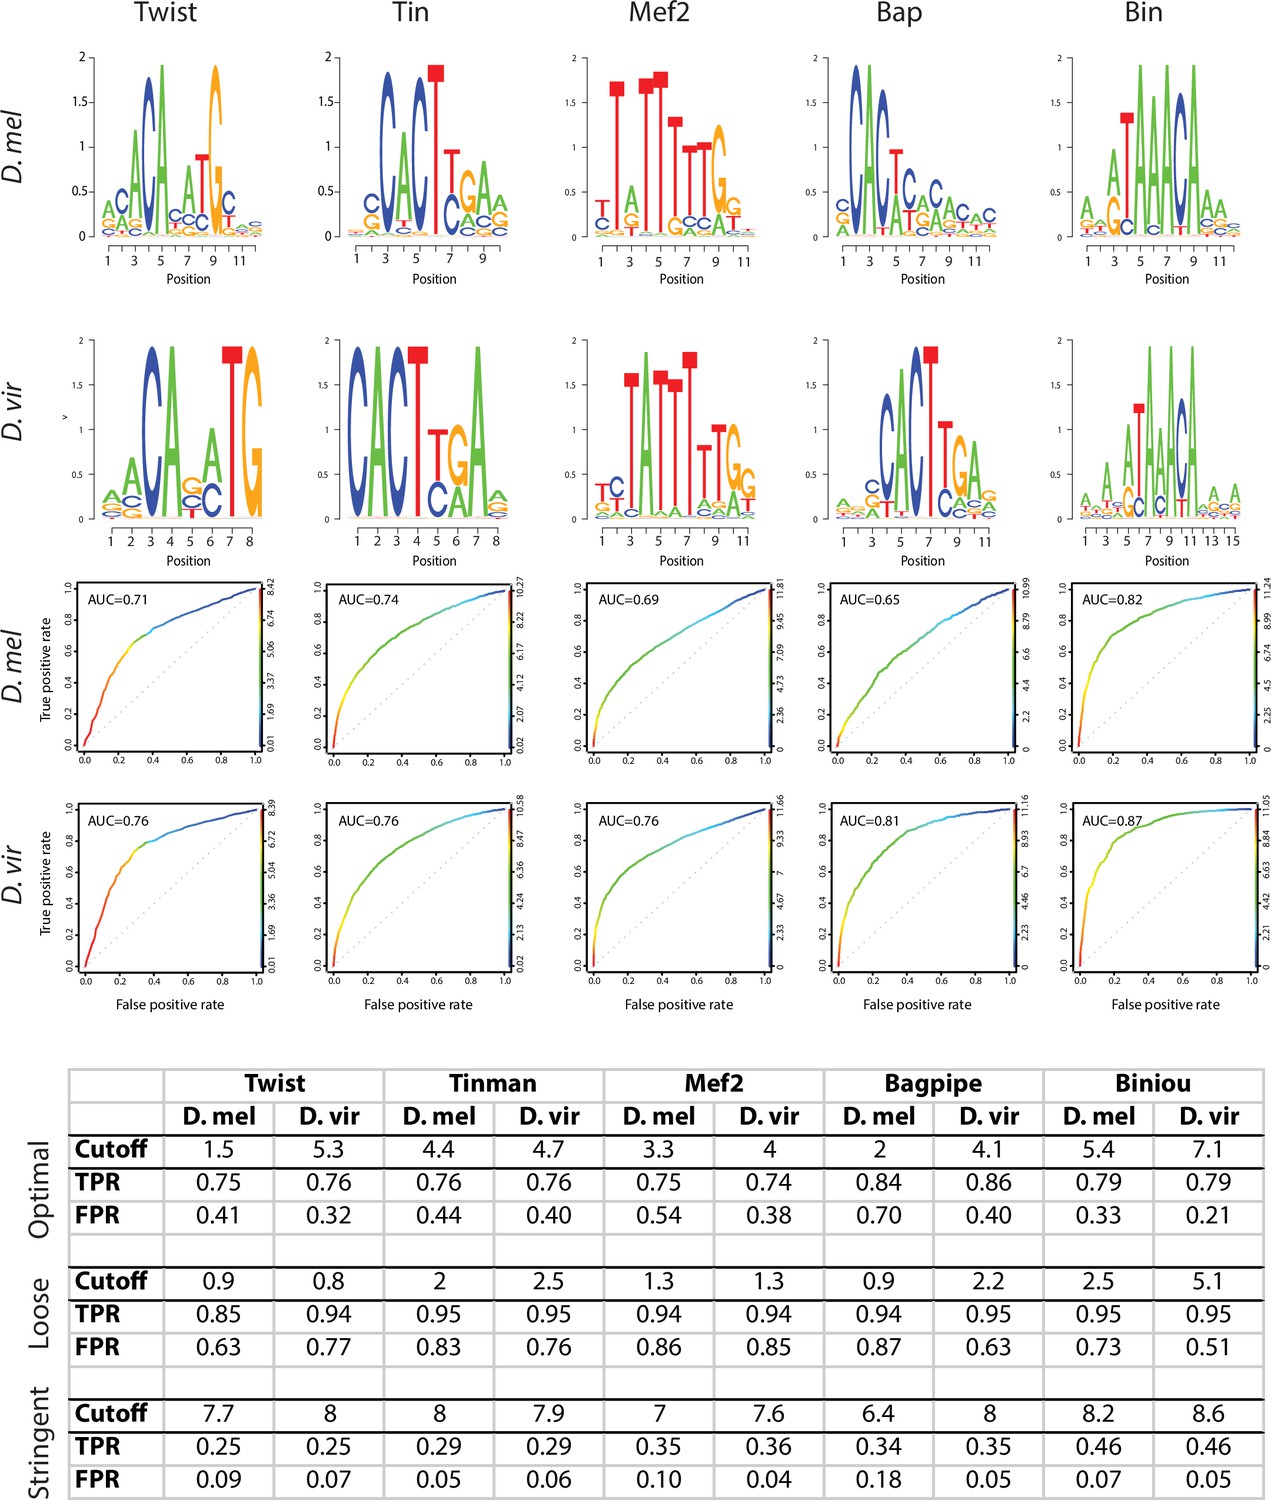
PWMs of orthologous transcription factors are highly similar.
For each TF, D. melanogaster and D. virilis position weight matrices (PWMs) are shown in the form of sequence logos (upper panels). ROC plots represent true positive and false positive rates gained from the whole range of Patser scores (0 and higher, ROC curve color) (Hertz and Stormo, 1999). Table represents True Positive Rate (TPR) and False Positive Rate (FPR) obtained at different cutoffs for the 5 transcription factors. Equivalent Patser thresholds used for TFBS definition (bottom table) were determined as (1) the Patser score giving a TPR of 70–80% and a FPR of 40% maximum on the best performing organism (as evaluated by the ROC) and (2) the Patser score giving the same TPR for the other organism.
Figure 2
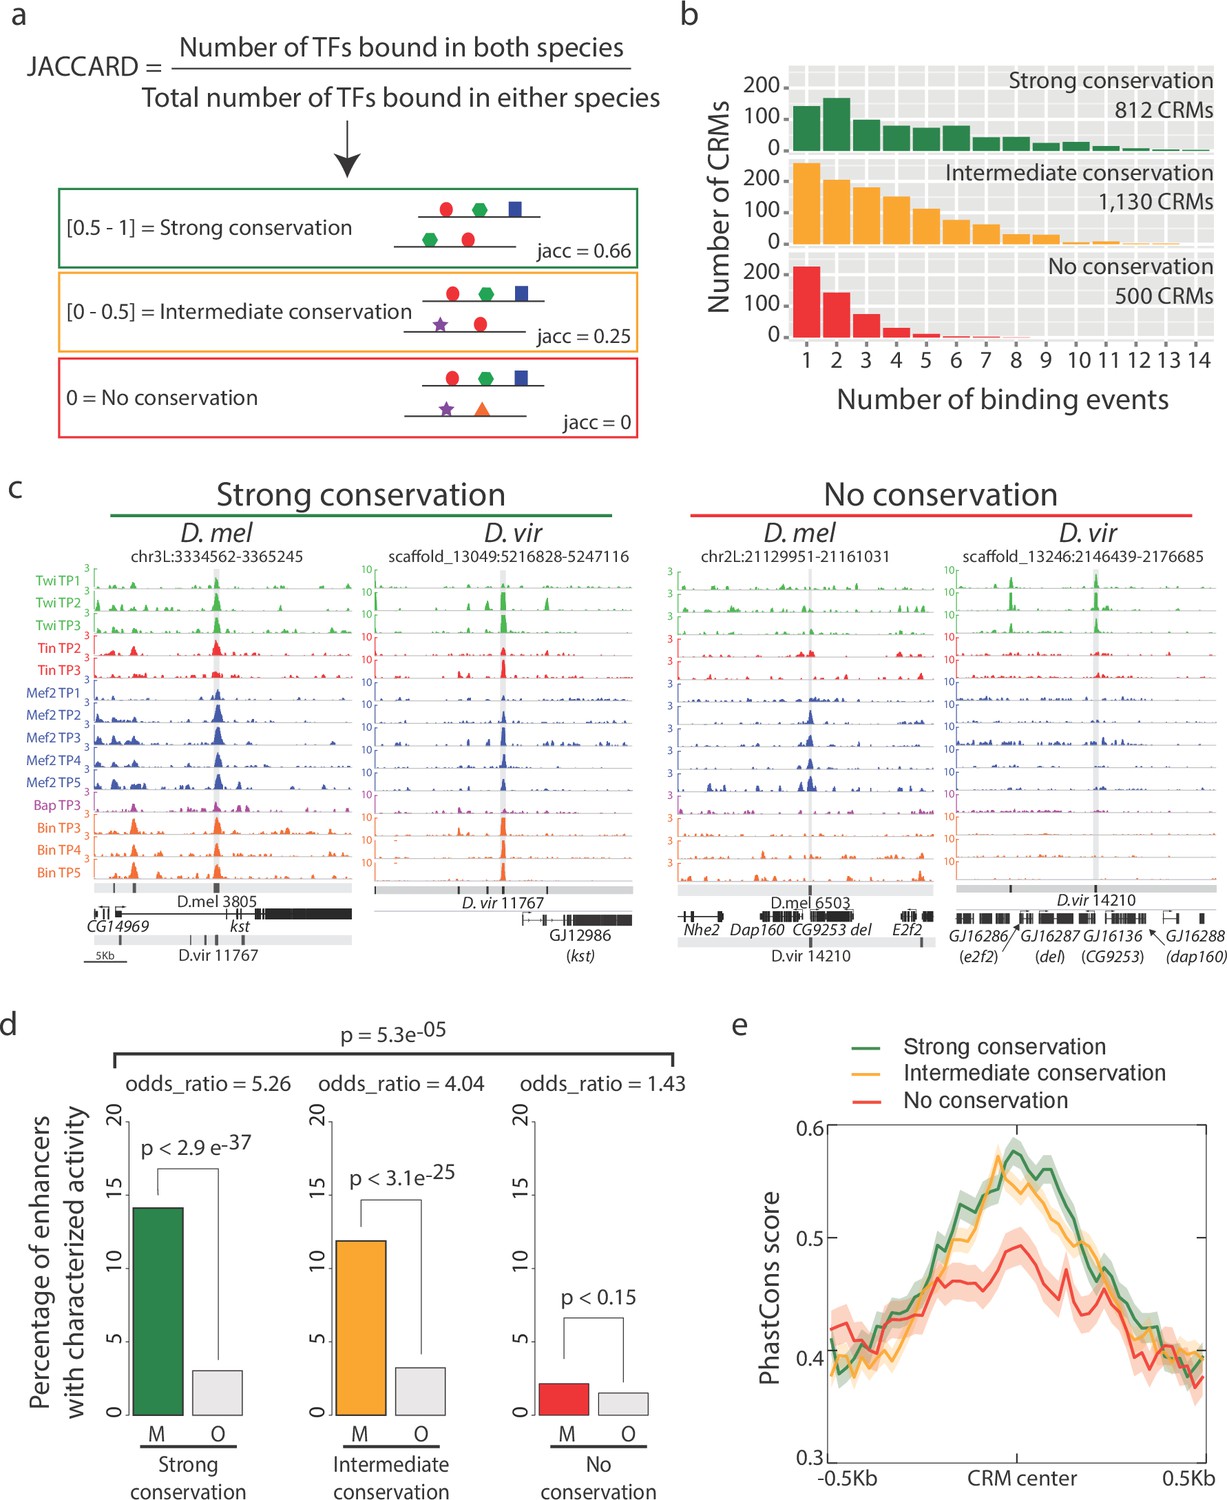
Enhancers with conserved binding are associated with functional elements.
(a) Jaccard similarity index was used to categorize CRMs into three groups based on their TF binding conservation. The schematic represents CRM pairs for each of the three groups with hypothetical combinatorial binding and the associated Jaccard Index. (b) Barplot representing the complexity of D. melanogaster CRMs, in term of number of binding events (x-axis), for each CRM binding conservation category. (c) Genome browser visualization of strongly conserved (left) and non-conserved (right) CRM pairs. D. virilis (D. vir) tracks display RPM normalized, input subtracted ChIP-seq signal. D. melanogaster (D. mel) tracks show log2(IP/mock) ChIP-chip signal. In D. mel, both D. mel and translated D. vir CRMs are shown along with D. mel gene models. In D. vir, D. vir CRMs and genes are shown with D. mel orthologous gene name depicted between parenthesis. The same genomic window size was used for both species, indicated in the lower left corner. (d) Fraction of mesodermal (‘M’, coloured) and non-mesodermal (‘O’ for ‘Other tissues’, gray) enhancers overlapping CRMs from the three categories defined in (a). Overall p-value corresponds to a two-sided proportions test, p-values within categories correspond to Fisher exact test. (e) CRMs with strong or intermediate conservation in their TF binding events have stronger sequence constrains than those with no conserved binding, based on their average PhastCons conservation scores. Solid lines represent the mean and shading delineates standard error.
Figure 3 with 1 supplement
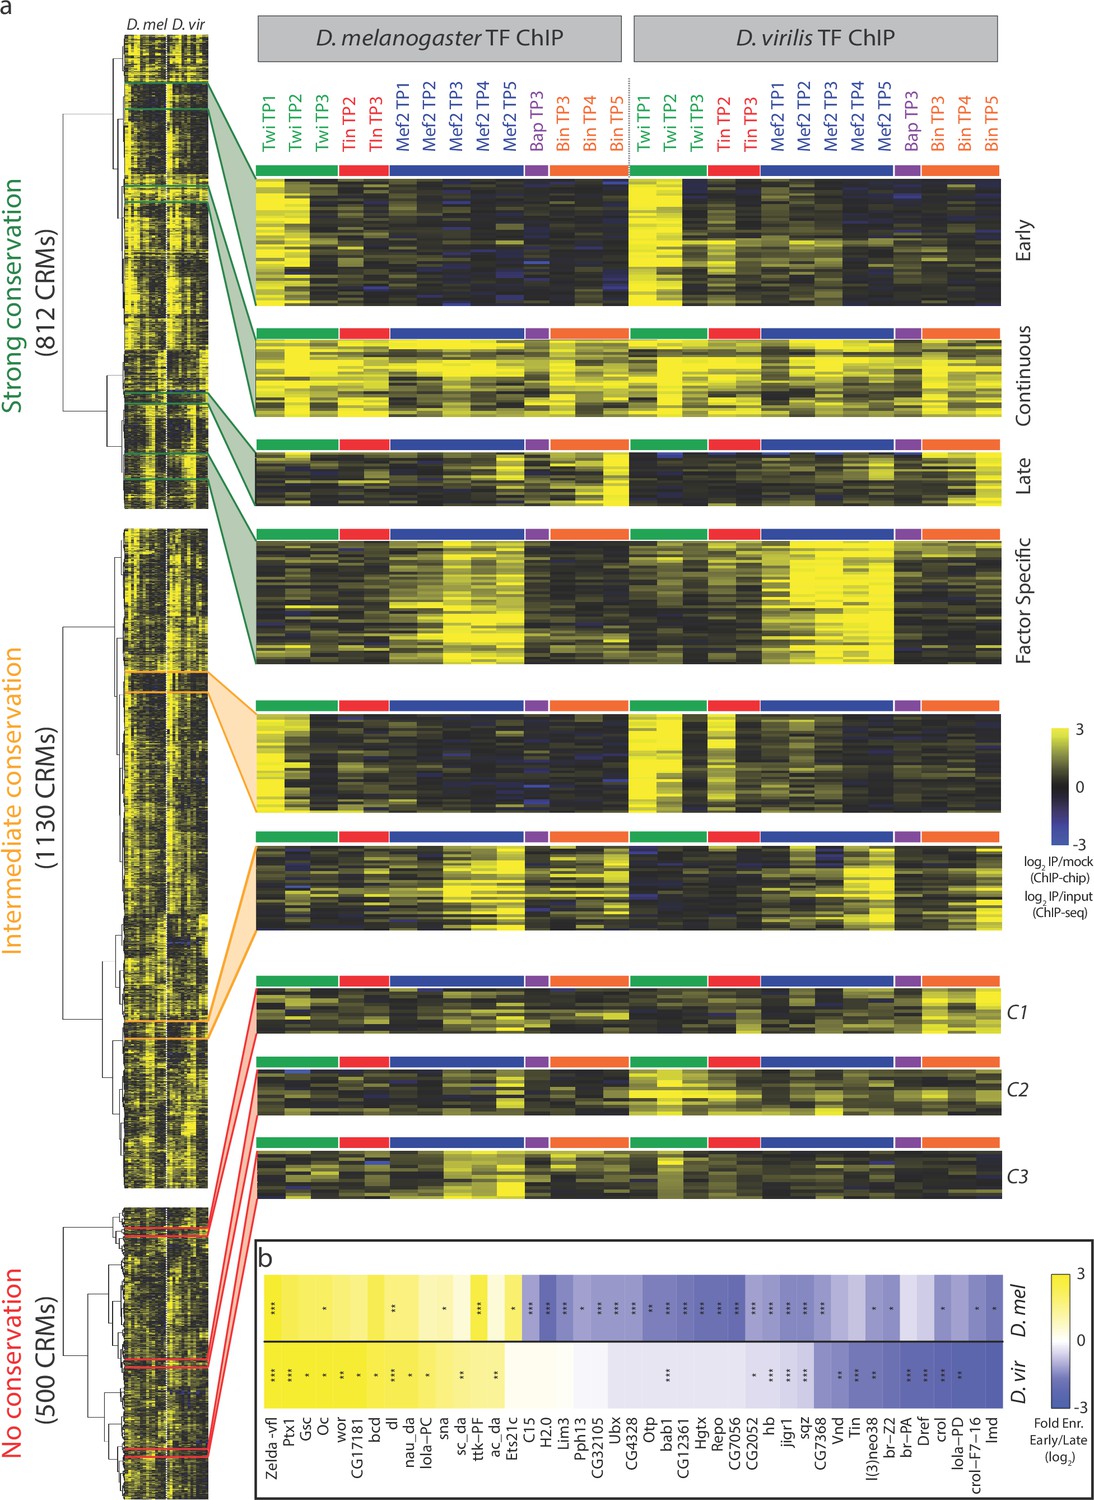
Dynamic patterns of developmental enhancer occupancy across distantly related species.
(a) Hierarchical clustering of ChIP signal of CRMs with high, intermediate and low binding conservation, as classified using Jaccard distance (Figure 2). Each row corresponds to an orthologous CRM, and each column to a condition, with 14 D. melanogaster conditions followed by their equivalent 14 D. virilis conditions. The vertical dashed line delimits data from both species, while the horizontal colored bars indicate the TF. All three heatmaps are visualized using the quantitative ChIP-signal shown in the scale in lower right. (b) Differential motif analysis on early vs late Twi bound enhancers indicates that the regulation of these elements is largely conserved. Heatmap shows fold enrichment (early vs late bound enhancers, log2) of all motifs with >2 fold significant enrichment in one of the two species. *p<0.05; **p<0.01; ***p<0.001 indicates significance in that species. Color indicates motif enrichment, which is generally in the same direction in both species, even when significant in only one species.
Figure 3—figure supplement 1
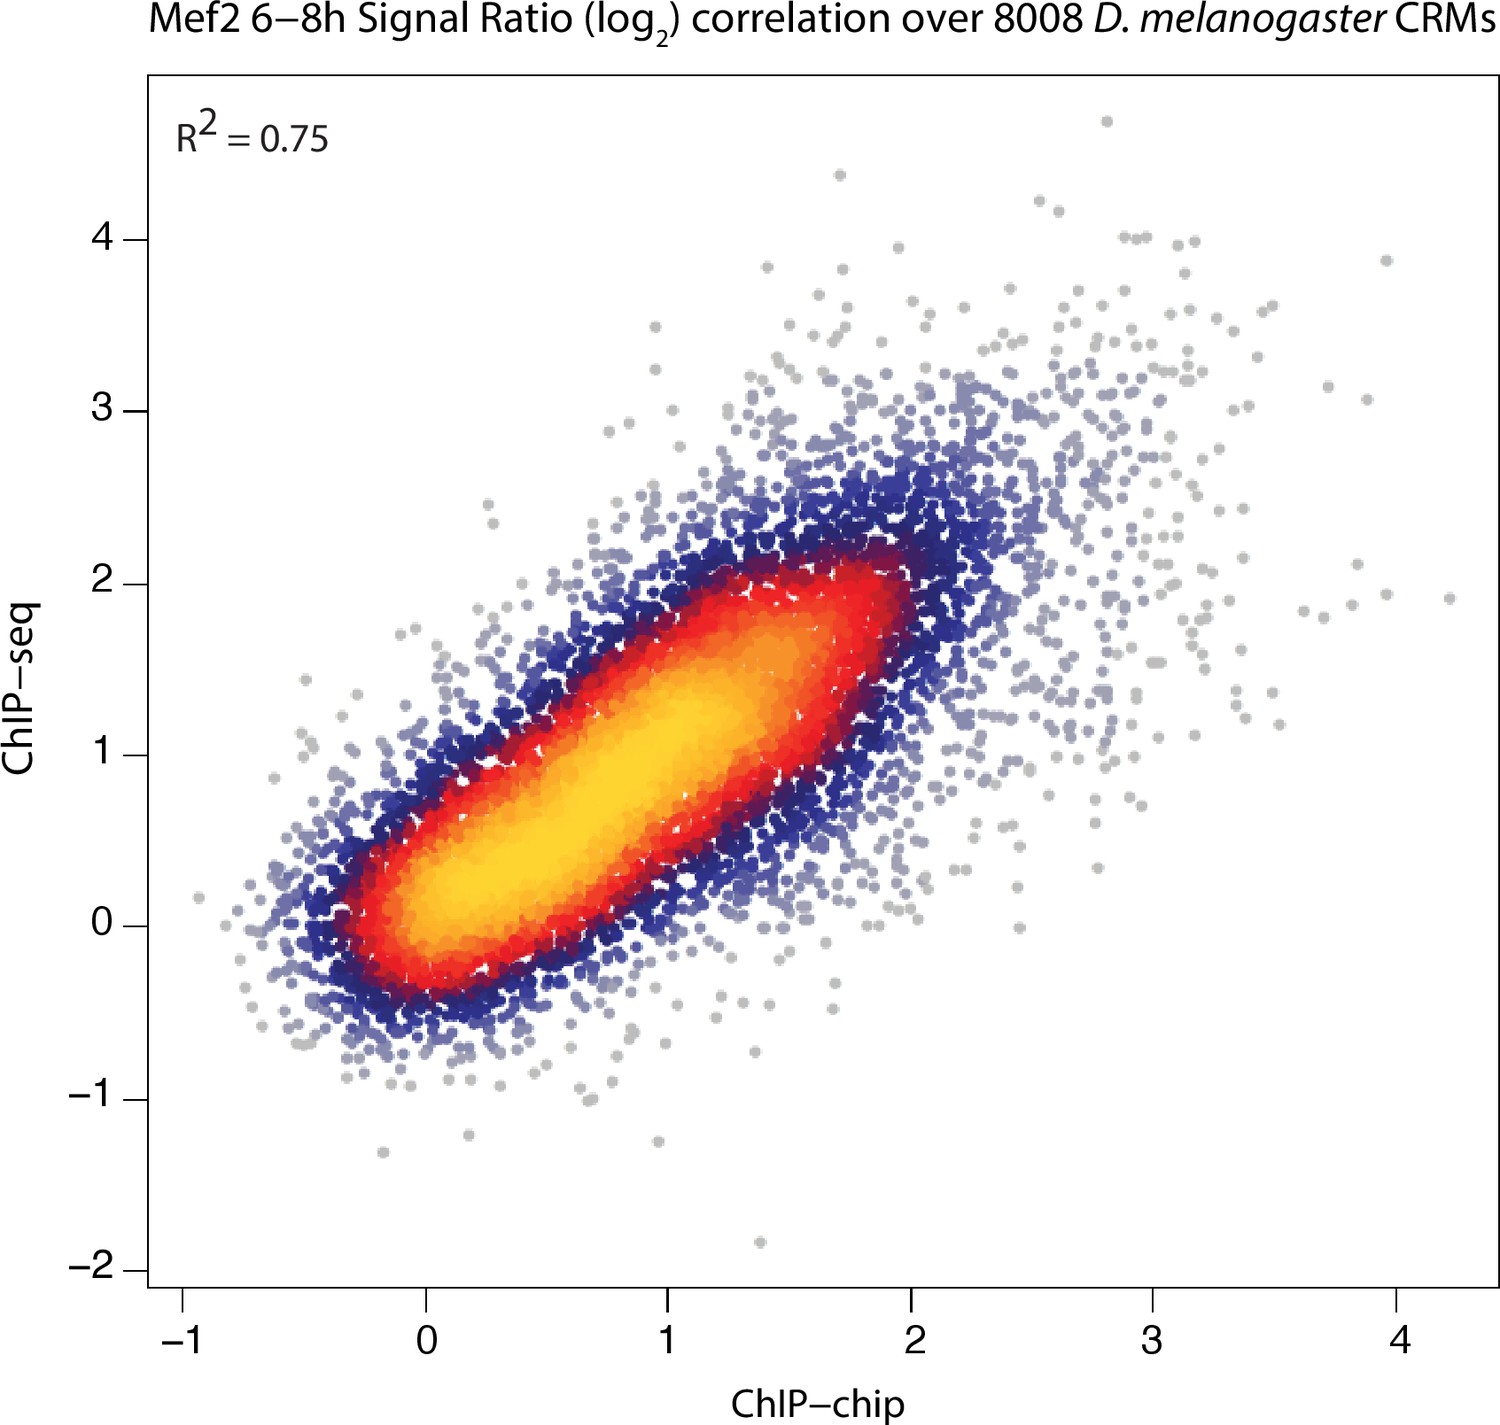
ChIP-chip and ChIP-seq signals are highly correlated.
ChIP-chip and ChIP-seq signal for Mef2 over all D. melanogaster CRMs are plotted here. ChIP-chip signals correspond to mean ChIP-chip intensity signals calculated over 200 bp sliding window with 35 bp steps along the CRM length. ChIP-seq signals correspond to Log2(IP/input). Mef2 ChIP-seq signals over D. melanogaster 8,008 CRMs were generated previously (Bonn et al., 2012). Pearson correlation coefficient between both sets is shown.
Figure 4

The relationship between TF binding conservation and motif conservation depends on enhancer context.
(a) Orthologous CRMs between D. melanogaster (D. mel) and D. virilis (D. vir) were divided into 3 categories based on their occupancy in D. mel; CRMs bound by 1 TF (Singletons), 2 or 3 TFs (Low Bound) or by 4 or 5 TFs (High Bound). CRMs in each category were divided into CRMs with conserved occupancy (circle) and non-conserved occupancy (triangle) in D. vir and the density of transcription factor binding sites (TFBS) for the corresponding factor in D. vir was calculated (Materials and methods). Asterisks depict the differences in TFBS density between CRMs with conserved and non-conserved binding, while horizontal lines indicate average densities across the genome for comparison. The lack of conserved binding for Bap singleton CRMs results in the missing value for conserved Bap TFBS (also in [b]). (b) Spearman correlation between interspecies variation in motif presence (ΔSTAP) and variation in TF occupancy (ΔChIP) at orthologous CRMs for each TF, in the different occupancy classes. A high Spearman correlation indicates inter-species changes in TF binding due to inter-species changes in the presence of the TF’s motif (i.e. binding changes are highly sequence-dependent). (c) Relationship between scaled ΔSTAP and ΔChIP for Singletons (left, 150 peaks) and High Bound (right, 488 peaks) orthologous enhancer pairs bound by Tin in D. melanogaster. Highlighted in red (0 and 28 peaks for Singletons and High Bound, respectively) are enhancer pairs with little changes in Tin occupancy (low ΔChIP) but high changes in Tin motifs (ΔSTAP) and in green (2 and 21 peaks for Singletons and High Bound, respectively) are enhancer pairs with high changes in Tin occupancy (high ΔChIP) with little changes in their Tin motifs (ΔSTAP). The former (red) are consistent with TF collective occupancy, while the latter (green) are consistent with Tin cooperative recruitment by other partner TFs. Dashed lines delineate the thresholds used. Note, many orthologous enhancers fulfill these criteria in the high-bound enhancers while very few or none do in the singletons class (p=0.06 and 0.0005 comparing (High Bound greater than Singletons) green and red populations (one sided Fisher test), respectively).
Figure 5

Co-divergence in TF occupancy across evolution can reveal potential cooperative interactions.
(a) Pair-wise co-association of TF/time point in D. melanogaster (left) and D. virilis (right). Co-association significances correspond to Z-Score denoting deviation from random expectation ranging from red (lower than random expectation denoting lack of co-association) to blue (higher than random expectation denoting strong co-association). (b) Above table, schematic representation of the 4 categories of binding events affecting orthologous CRM pairs. Below, table indicates the number of CRM pairs in each category with p-values (Fisher exact tests). Significant cases (p<=0.05) are highlighted in red. (c) Association test between the loss of TF1 occupancy (TF1 ChIP, rows) and the loss of TF2 motifs (TF2 STAP, column). Significant associations between pairs are indicated (Fisher exact tests). (d) Occupancy of orthologous enhancers with co-divergent binding. Binding of both Tin and Bap are lost in D. vir (right) compared to D. mel (left). Track descriptions are as in Figure 2c. Orthologous CRM region is highlighted in gray.
Figure 6 with 1 supplement
Relationship between divergence in TF occupancy and enhancer activity.
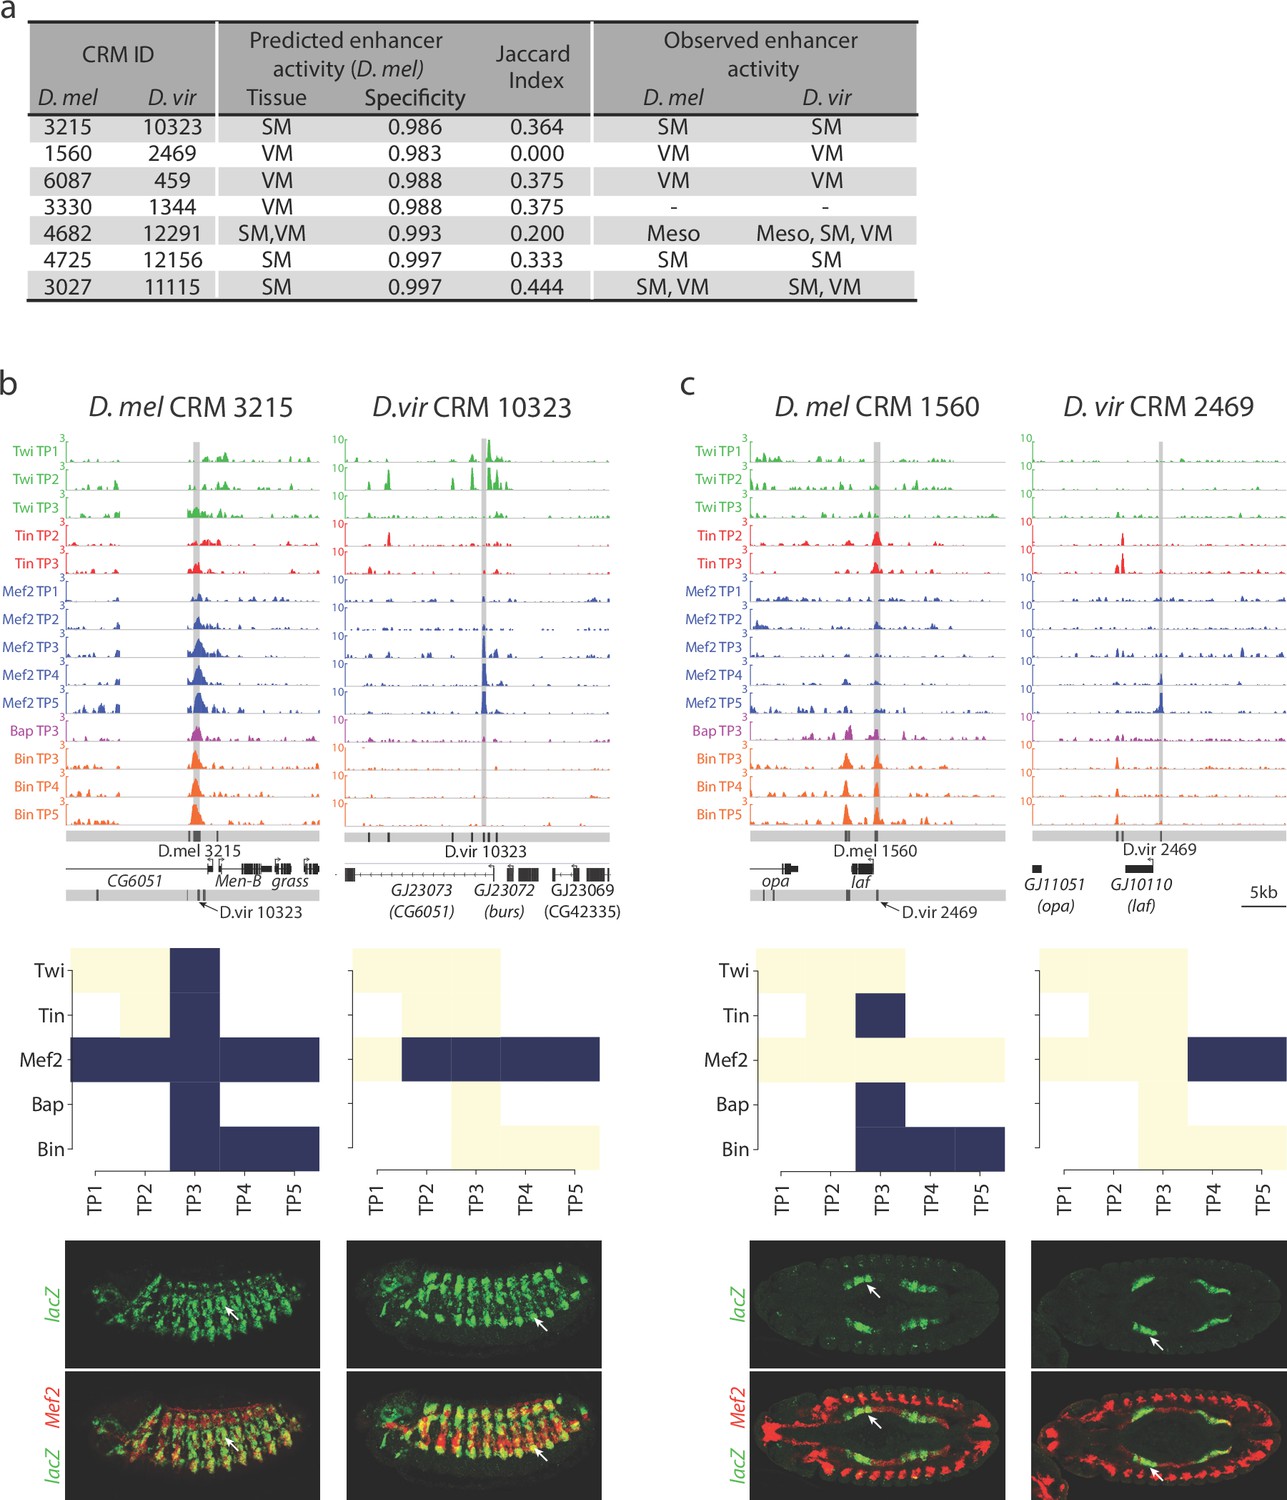
(a) Table summarizing the orthologous D. melanogaster (D. mel) and D. virilis (D. vir) CRMs tested for in-vivo activity in D. mel embryos. The enhancer’s predicted tissue activity, and SVM specificity score, for the D. mel enhancer is indicated (from Zinzen et al., 2009). The observed enhancer activity for both the D. mel and orthologous D. vir enhancers are indicated. SM = somatic muscle, VM = visceral muscle, Meso = mesoderm. (b–c) Upper panel, TF occupancy (ChIP signal) of two orthologous CRM pairs representing the quantitative binding profiles along the 14 conditions in both species. D. mel data corresponds to log2(IP/mock) ChIP-chip signal. D. vir data corresponds to RPM normalized, input subtracted ChIP-Seq signal. In D. mel, both D. mel and translated D. vir CRMs are shown along with D. mel gene models. In D. vir, D. vir CRMs and D. mel orthologous gene models are shown. Middle panel shows TF binding logos, where blue represents significant ChIP peaks at the indicated time point (columns = Time Point (TP) and rows = factor). Lower panel shows double in-situ hybridization of transgenic embryos for each orthologous enhancer (lacZ reporter driven by the enhancer, green channel) and a mesodermal marker (Mef2, red). White arrow indicates the somatic muscle (b) and visceral muscle (c) of an embryo in a lateral or dorsal view, respectively.
Figure 6—figure supplement 1
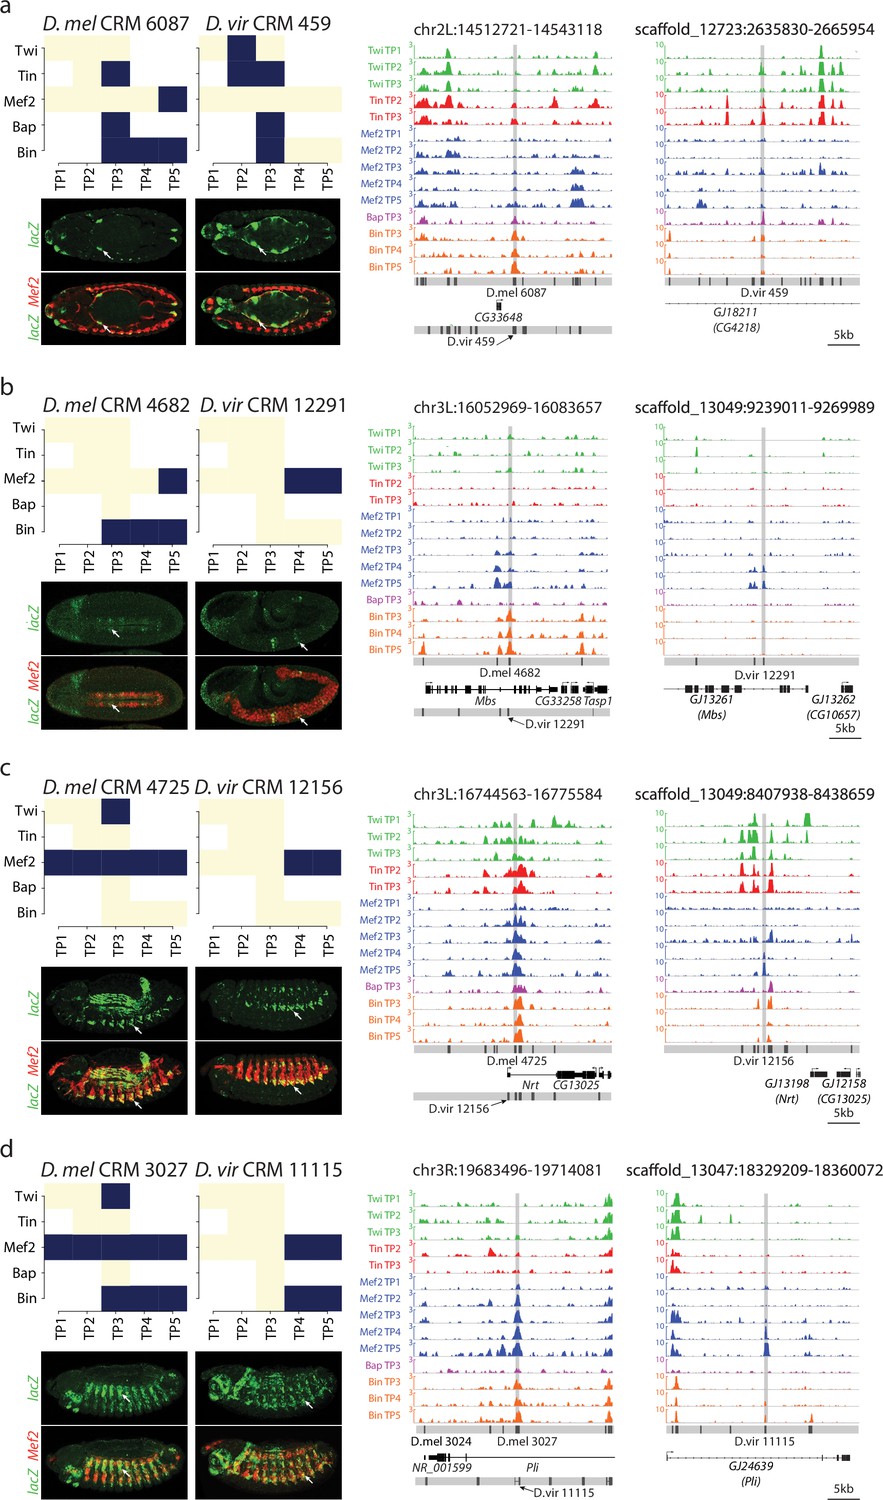
Binding logo, in vivo data and browser screenshots for tested CRMs with mesodermal activity.
(a–d) Upper left panel, shows TF binding logos, where blue represents significant ChIP peaks at the indicated time point (rows = Time Point (TP), columns = Transcription Factor (TF). Right panel shows TF occupancy (ChIP signal) of the two orthologous CRM pairs representing the quantitative binding profiles along the 14 conditions in both species. D. melanogaster data corresponds to log2(IP/mock) ChIP-chip signal. D. virilis data corresponds to RPM normalized, input subtracted ChIP-Seq signal. In D. melanogaster, both D. melanogaster and translated D. virilis CRMs are shown along with D. melanogaster gene models. In D. virilis, D. virilis CRMs and genes are shown with D. melanogaster orthologous depicted between parenthesis. The same scale was used for both species and indicated below D. virilis panel. Lower left panel double in-situ hybridization of transgenic embryos for each orthologous enhancer (lacZ, reporter, green channel) and a mesodermal marker (Mef2, red).
Figure 7
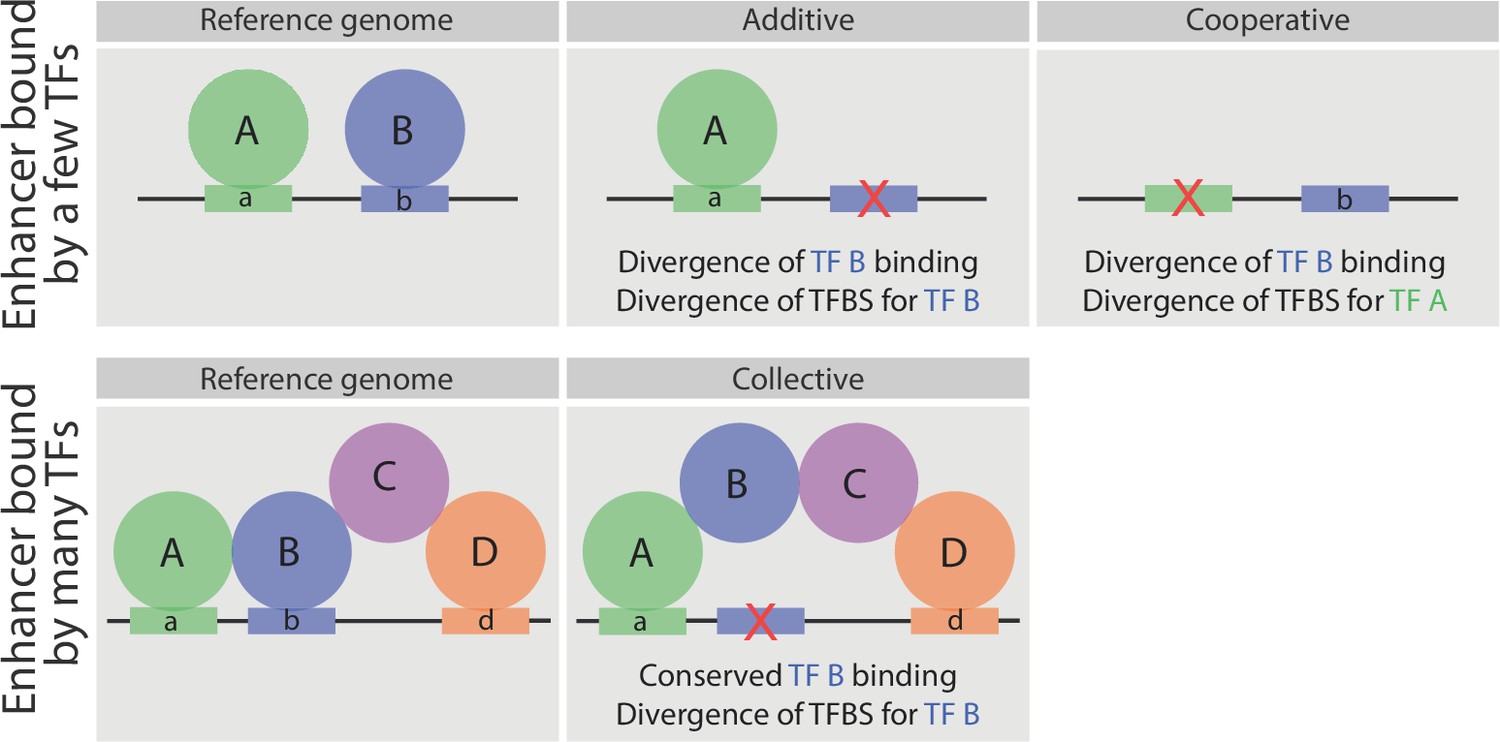
Schematic representation of the relationship between sequence divergence and TF occupancy on enhancer elements.
Upper panel, indicates an enhancer bound directly by two factors, A and B. In some enhancers the loss of TF binding (e.g. TF B) is associated with the loss of that TF’s binding site (motif b - middle). In other enhancers (right), the loss of a partner TF’s motif (motif a) will result in the loss of binding of TF B, indicating that TF B occupies the enhancer cooperatively (either directly or indirectly) with TF A. Both cases have been observed in inter- and intra- species analysis of TF occupancy, and are also observed here with these mesodermal developmental TFs. Lower panel, represents an enhancer bound by a TF collective. Here, the loss of motif b does not result in loss of TF B binding (middle panel), unlike the situation in enhancers with purely additive occupancy (depicted above). Rather the divergence in the TF binding site is tolerated as the TF’s binding is stabilized through protein-protein interactions.
Author response image 1

Boxplots represent the distribution of distances to closest peaks (in logarithmic scale) for each of the 14 conditions assayed.
The distribution of distances of a TF binding event lost in D. mel (BindingLostInDmel) at the indicated condition (i.e. Twi_TP1) to the closest peak for the identical condition in another CRM. Similarly, BindingLostInDvir shows the distance distribution of a TF binding event lost in D. virilis at the indicated condition to the closest peak for the identical condition in another CRM. BindingConsDmelCoor shows distance distribution for D. melanogaster CRMs that have their binding conserved and similarly for BindingConsDvirCoor..
Author response image 2
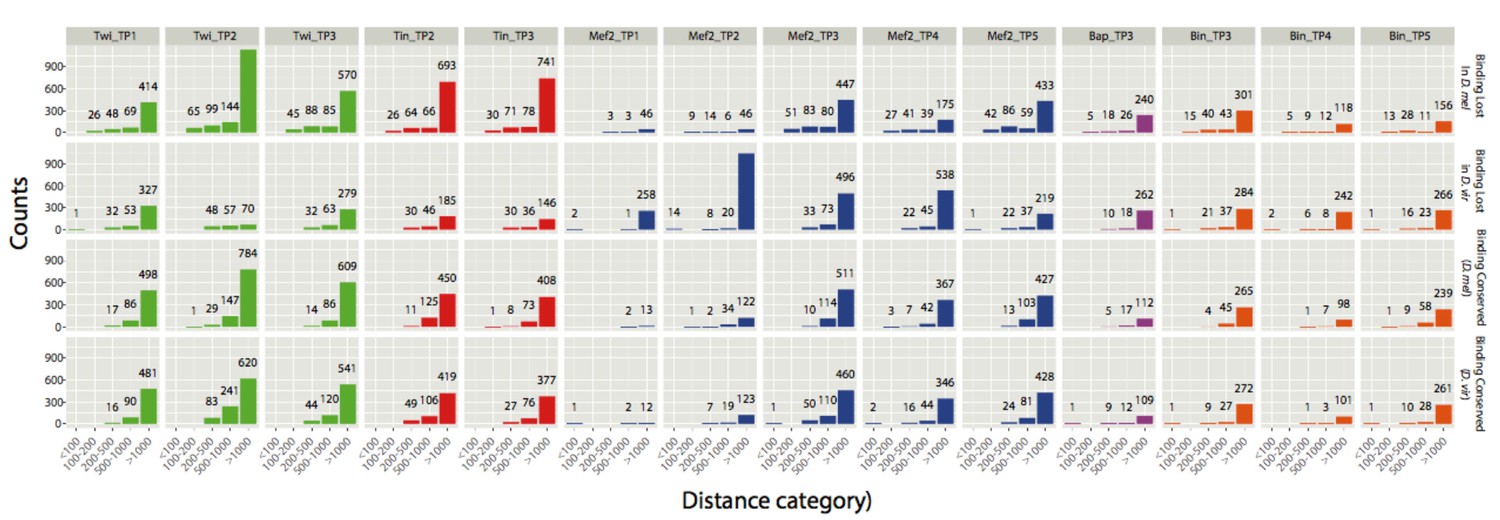
Count of CRMs with a close binding event falling in one of the five distance categories.
y-axis shows absolute counts (also displayed as numbers above corresponding bars) and x-axis the 5 distance categories. The analysis was done for all 4 categories of CRMs: Binding lost in D. mel, binding lost in D. virilis, binding conserved (for D. mel CRMs) and binding conserved (for D. virilis CRMs).
Additional files
-
Supplementary file 1
Number of reads and peaks called in D. virilis and translated.
Shown are number of reads used for both replicates, number of peaks called using IDR of 1% (Materials and methods) on D. virilis along with the number of peaks translated per condition using pslmap (Materials and methods). D.melanogaster peaks are from a previous study from our lab (Zinzen et al., 2009). Intersect corresponds to the number of peaks that intersect between both species along with their corresponding percentages according to both species.
- https://doi.org/10.7554/eLife.28440.013
-
Supplementary file 2
List of 14385 CRMs identified in D. virilis.
Coordinates correspond to D. virilis flybase-R1.2 assembly version (or droVir3 in UCSC)
- https://doi.org/10.7554/eLife.28440.014
-
Supplementary file 3
List of D. virilis CRMs translated to D. melanogaster.
Listed are the coordinates on D. melanogaster (dm3) for the set of D. virilis CRMs that were translated using pslmap (Materials and methods). Format is in bed12. For CRMs that map in two locations upon translation, their names were appended by ‘_x’, where x increases from 1 to the number of split events.
- https://doi.org/10.7554/eLife.28440.015
-
Supplementary file 4
Set of 812 highly conserved CRMs (Multi-ChIP-peak CRMs; Jaccard >= 0.5).
Each row correspond to a pair of CRMs with D. melanogaster coordinates and ID followed by the corresponding orthologous D. virilis coordinates and ID. Coordinates corresponds to dm3 in both cases (as translated D. virilis CRMs are compared to their orthologous D. melanogaster)
- https://doi.org/10.7554/eLife.28440.016
-
Supplementary file 5
Same as Supplementary file 4 for the set of 1130 CRMs with intermediate conservation (Multi-ChIP-peak CRMs; 0 < Jaccard < 0.5).
- https://doi.org/10.7554/eLife.28440.017
-
Supplementary file 6
Same as Supplementary file 4 for the set of 500 CRMs with no conservation (Multi-ChIP-peak CRMs; Jaccard = 0).
- https://doi.org/10.7554/eLife.28440.018
-
Supplementary file 7
List of CAD enhancers used for functional analysis.
Listed are in BED format the set of CAD enhancers (Materials and methods) classified as active in the mesoderm (CAD meso) or in any other tissue excluding the mesoderm (CAD Non-meso).
- https://doi.org/10.7554/eLife.28440.019
-
Supplementary file 8
Evaluation of trained STAP models on 28 TF-ChIP data sets.
Pearson correlation coefficient (PCC) between ChIP scores and STAP scores for each TF- and stage-specific model reported.
- https://doi.org/10.7554/eLife.28440.020
-
Supplementary file 9
Correlations between ΔChIP and ΔSTAP for orthologous CRM pairs and for each corresponding TF and condition.
- https://doi.org/10.7554/eLife.28440.021
-
Supplementary file 10
Extended description of the 7 orthologous CRMs tested in-vivo for activity in the mesoderm.
- https://doi.org/10.7554/eLife.28440.022
-
Supplementary file 11
List of primers used to clone D. melanogaster and D. virilis CRMs.
- https://doi.org/10.7554/eLife.28440.023
-
Supplementary file 12
List of qPCR primers used for ChIP-qPCR enrichment analysis on D. virilis embryos.
- https://doi.org/10.7554/eLife.28440.024
Download links
A two-part list of links to download the article, or parts of the article, in various formats.
Downloads (link to download the article as PDF)
Open citations (links to open the citations from this article in various online reference manager services)
Cite this article (links to download the citations from this article in formats compatible with various reference manager tools)
Uncoupling evolutionary changes in DNA sequence, transcription factor occupancy and enhancer activity
eLife 6:e28440.
https://doi.org/10.7554/eLife.28440


