Evolutionary routes to biochemical innovation revealed by integrative analysis of a plant-defense related specialized metabolic pathway
- Michigan State University, United States
Figures
Figure 1 with 6 supplements
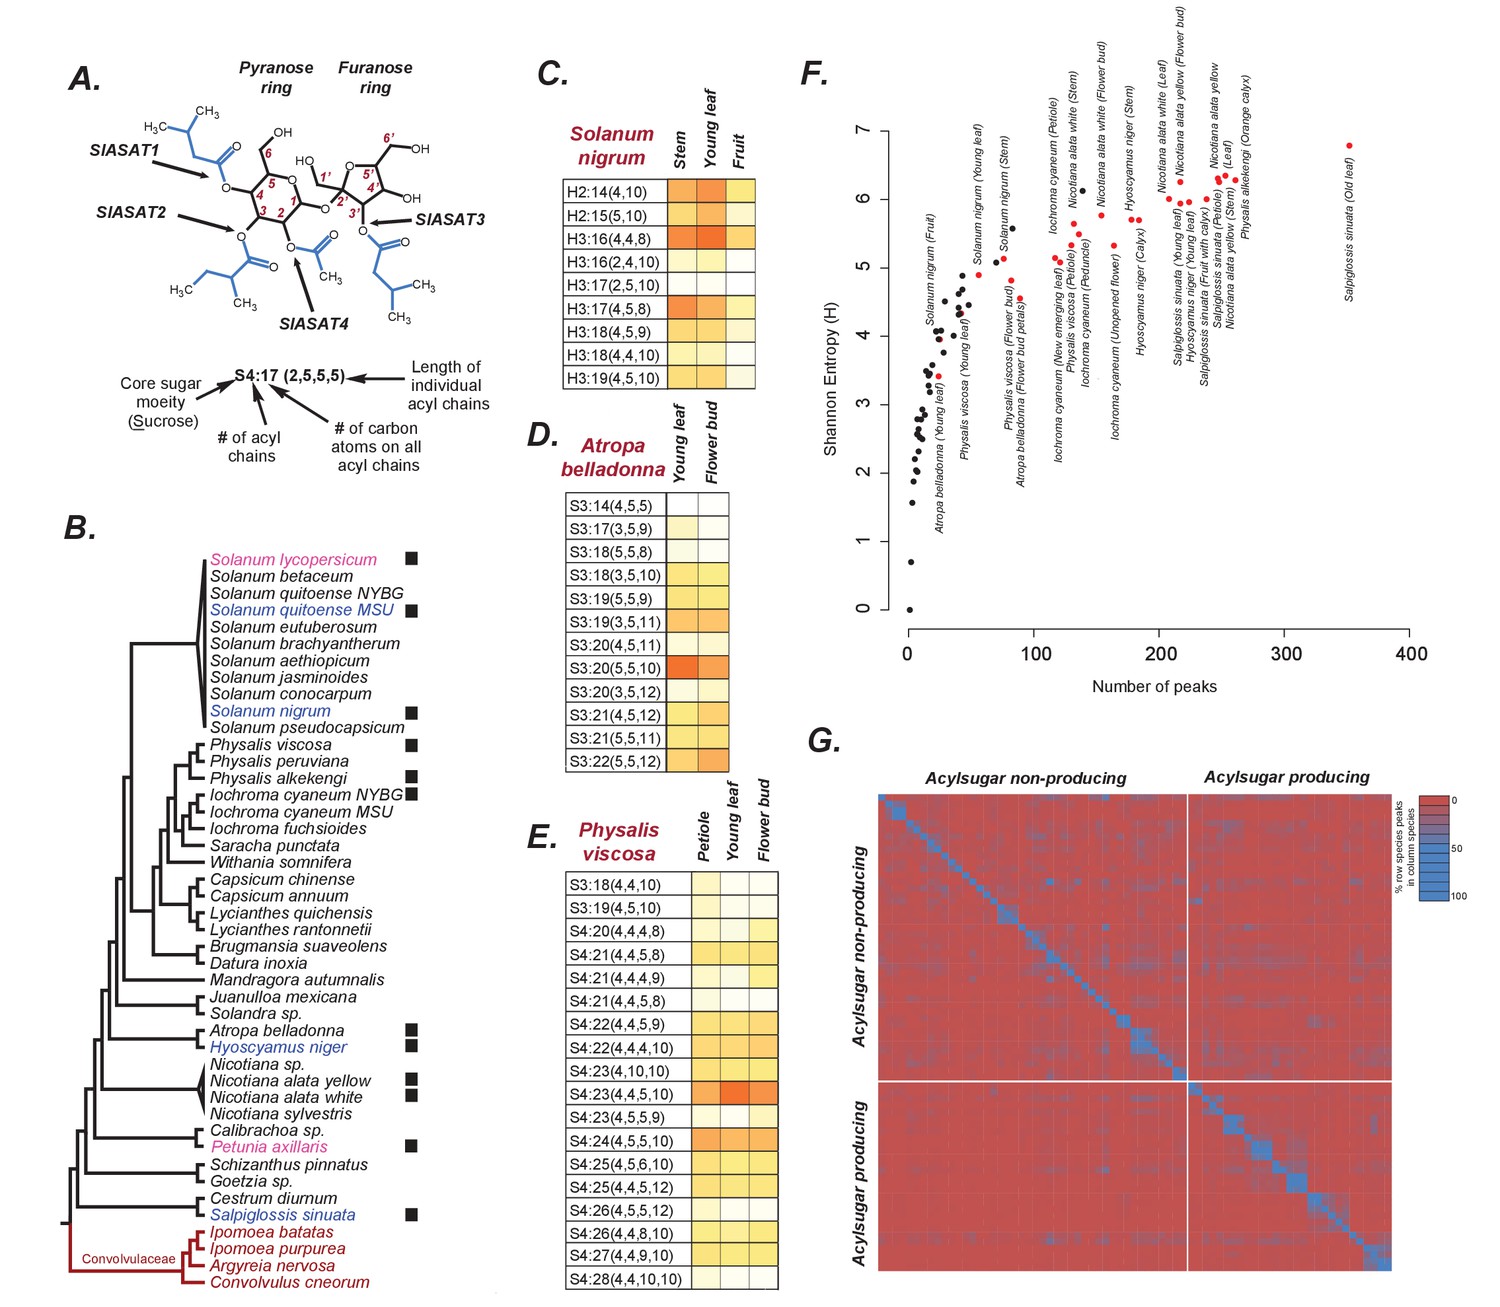
Acylsugars in solanaceae.
(A) An example acylsugar from tomato. The nomenclature of acylsugars and the ASAT enzymes responsible for acylation of specific positions are described. Carbon numbering is shown in red. Sl refers to S. lycopersicum. The phylogenetic position of the ASAT enzymes is shown in Figure 1—figure supplement 1. (B) Species sampled for acylsugar extractions. Phylogeny is based on the maximum likelihood tree of 1075 species (Särkinen et al., 2013). Species with black squares show presence of acylsugars in mass spectrometry. Species highlighted in blue were cultivated for RNA-seq. Species in red are Convolvulaceae species. Species in pink were not sampled in this study but have been extensively studied in the context of acylsugar biosynthesis (see main text). More information about these species sampled at the NYBG is provided in Figure 1—source data 1,2. (C,D and E): Individual acylsugars from three representative species. Color scale ranges from no acylsugar (white) to maximum relative intensity in that species (orange). Peak areas of isomeric acylsugars were combined. S. nigrum produced acylsugars consistent with a hexose (H) core. Acylsugars identified from other species are described in Figure 1—figure supplements 2 and 3, and the raw peak intensity values obtained from different species are provided in Figure 1—source data 2,3. Figure 1—figure supplement 4 shows fragmentation patterns of select acylsugars under positive ionization mode. (F) Shannon Entropy as a function of number of peaks identified. Red dots represent acylsugar producing species. Parameters used for Shannon Entropy determination and the final output are provided in Figure 1—source data 5. (G) Peaks shared between samples. Each row and each column represent a unique sample, with different tissues from the same species clustered together (see Figure 1—source data 5). Values in each cell refer to percentage of total peaks in row sample shared with the column sample. LC gradients used for all LC/MS experiments in this study are described in Figure 1—figure supplement 6.
-
Figure 1—source data 1
Species sampled at the NYBG and analysis of their trichome types.
Tissues sampled are described.
- https://doi.org/10.7554/eLife.28468.010
-
Figure 1—source data 2
Values used to generate the figures in Figure 1C–E and Figure 1—figure supplement 2.
Values indicate normalized peak areas where Normalized peak area = [(Acylsugar peak area)/(Area of internal standard)]/Dry weight of tissue.
- https://doi.org/10.7554/eLife.28468.011
-
Figure 1—source data 3
Raw data and parameter files used to analyze Solanaceae species samples.
zip file includes dry weights of all samples, QuanLynx method files and the output files used to make Figure 1C,D,E and Figure 1—figure supplement 2.
- https://doi.org/10.7554/eLife.28468.012
-
Figure 1—source data 4
mzmine 2 parameter file and peak lists.
These files were used to process RAW mass spectrometric files for the calculation of Shannon Entropy (Figure 1G, Figure 1—figure supplement 5).
- https://doi.org/10.7554/eLife.28468.013
-
Figure 1—source data 5
Data used to make Figure 1H.
Sheet 5A shows the numerical counts of peaks shared between samples while Sheet 5B shows the percentage values centered on the row sample, as described in the legend.
- https://doi.org/10.7554/eLife.28468.014
Figure 1—figure supplement 1
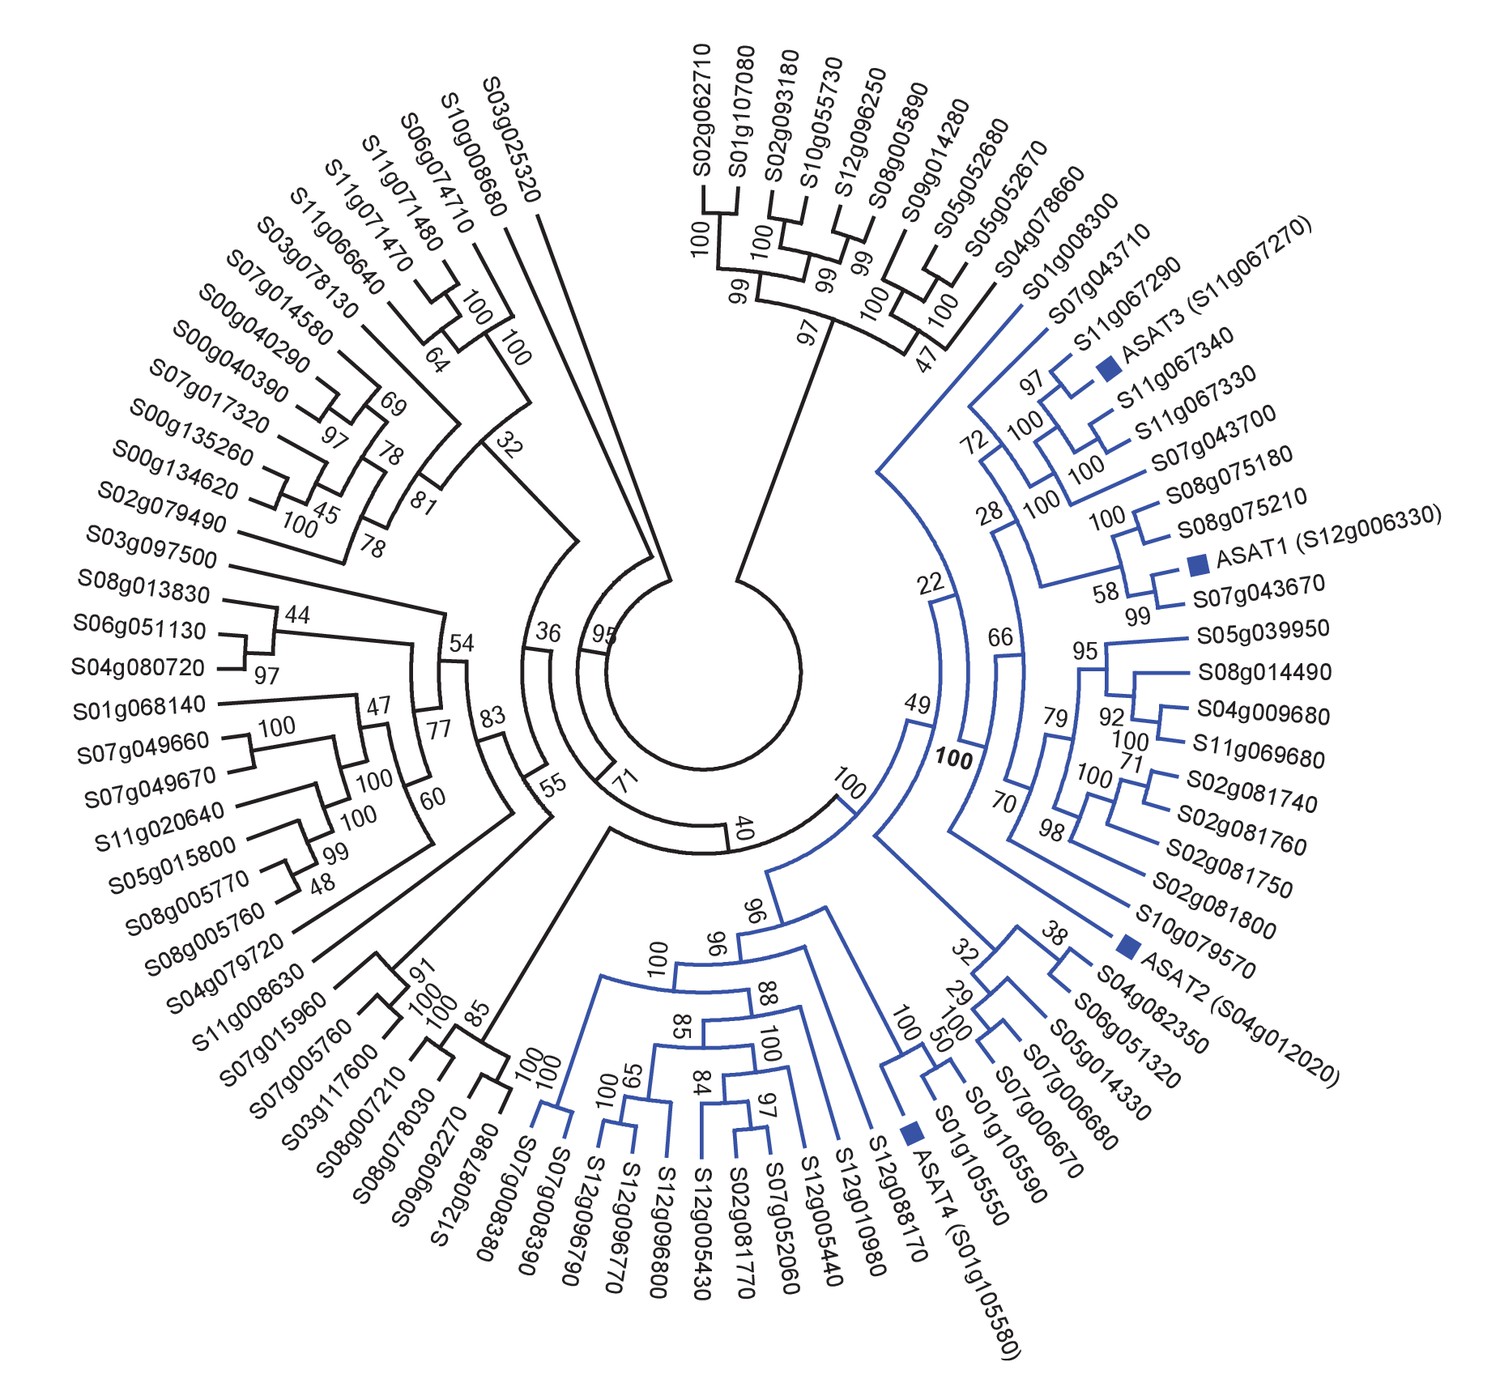
Tomato ASATs are members of the BAHD enzyme family.
(A) SlASATs shown in a phylogenetic tree with all other BAHDs in cultivated tomato genome. The ‘Solyc’ in the gene names has been shortened to ‘S’. BAHD is an acronym for four acyltransferase enzymes: benzyl alcohol O-acetyltransferase (BEAT), anthocyanin O-hydroxycinnamoyltransferase (AHCT), N-hydroxycinnamoyl/benzoyltransferase (HCBT), deacetylvindoline 4-O-acetyltransferase (DAT) - the first discovered members of this family. Please refer to Figure 1 for the biochemical activities of SlASATs. Only sequences > 200 aa in length were used in this analysis. Tree was constructed using Maximum Likelihood with the PROTGAMMAJTT model in RAxML v8.0.6 with 1000 rapid bootstrap replicates specified.
Figure 1—figure supplement 2
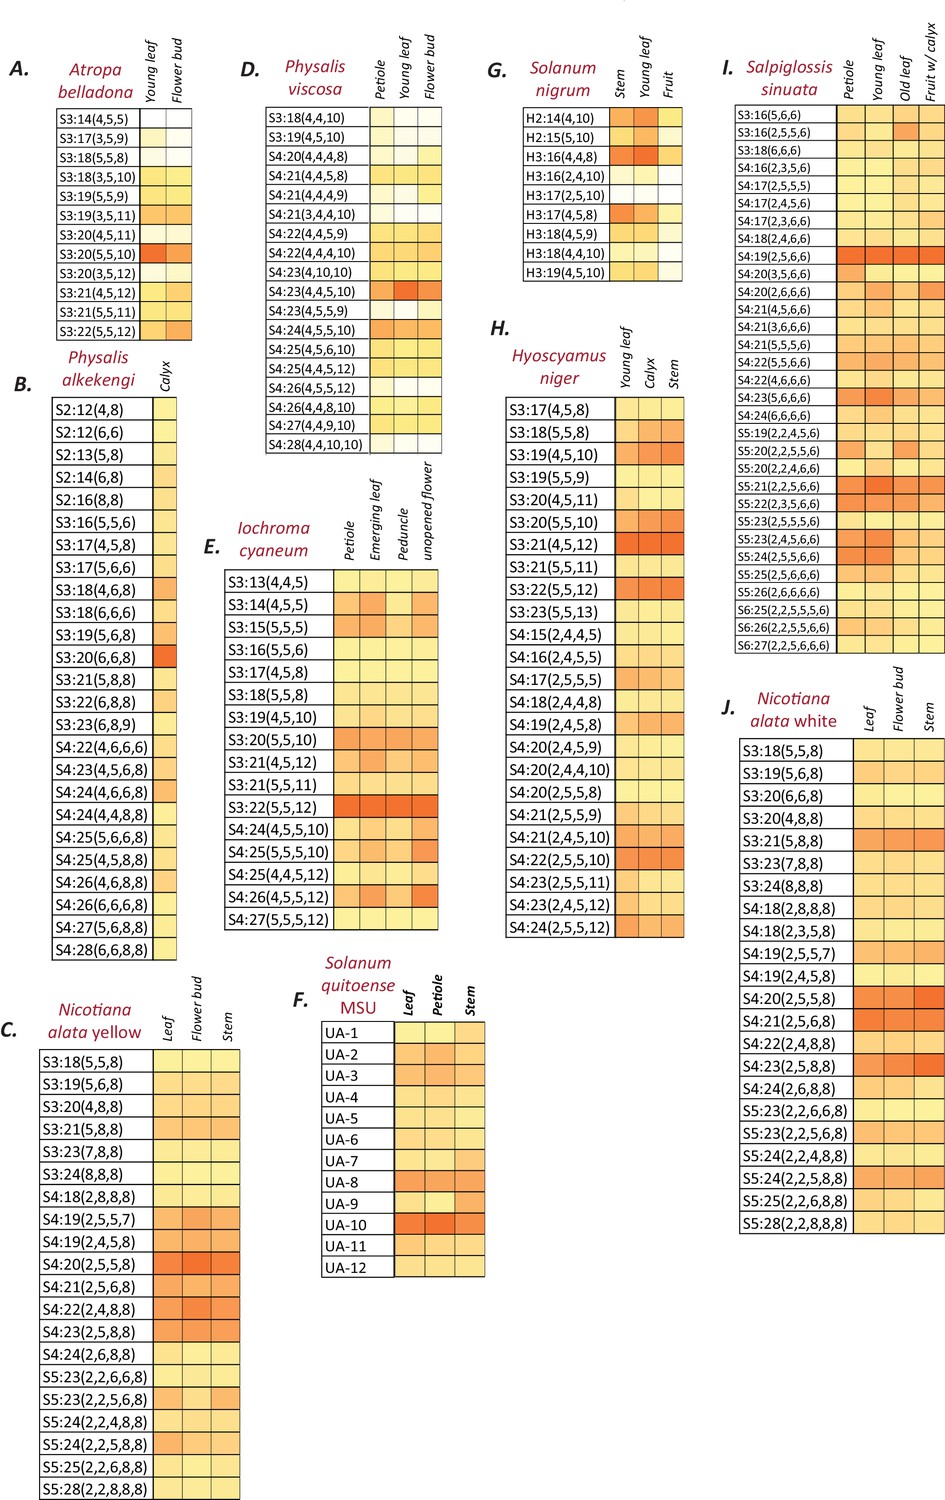
Normalized and integrated acylsugar peak areas in different species.
(A–J) Peak area of each acylsugar was normalized using the internal standard peak area and dry weight, and were summed across different isomers of the same acylsugar. Colors represent % normalized peak area of a given acylsugar compared to the total normalized acylsugar peak area in the given tissue. The color scale ranges from no acylsugars (white square) to the species-specific maximum peak area (orange square). The described acylsugars are only a subset of all the detectable acylsugar-like peaks in the plant extract. UA: Unidentified acylsugar, H:Hexose.
Figure 1—figure supplement 3
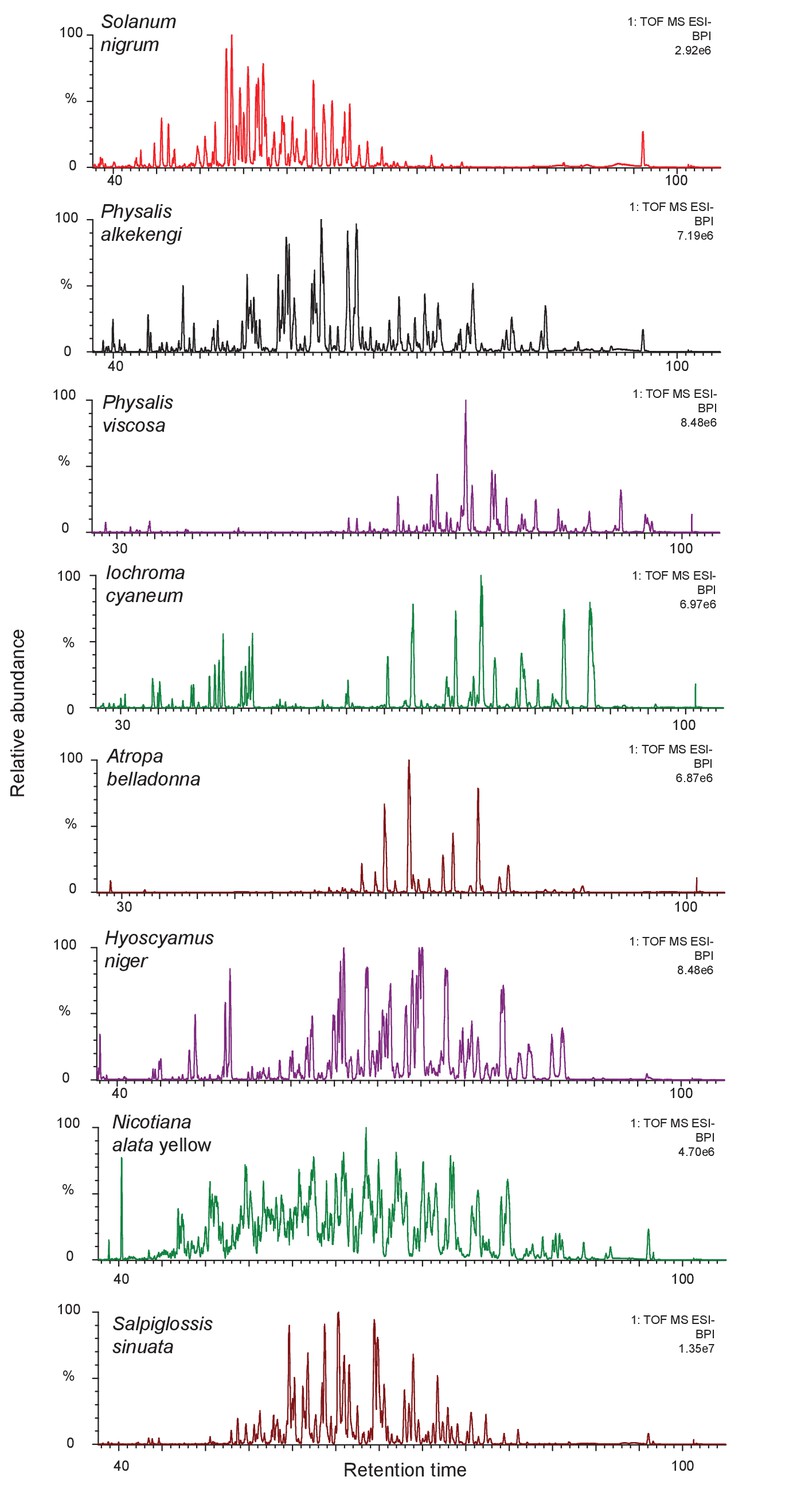
The complexity of acylsugar phenotype across multiple acylsugar producing species.
Undiluted trichome extracts collected from plants at the NYBG were run on a 110 min gradient on a C18 column as described in the Methods (Figure 1—figure supplement 6). Peaks consistent with acylsugar masses and fragmentation patterns eluted between 30/40 min and 100 min for all species. Most of the peaks shown in chromatograms above have m/z and fragmentation patterns consistent with being acylsugars with aliphatic acyl chains. The most abundant peaks were identified, and have been described in Figure 1—figure supplement 2.
Figure 1—figure supplement 4
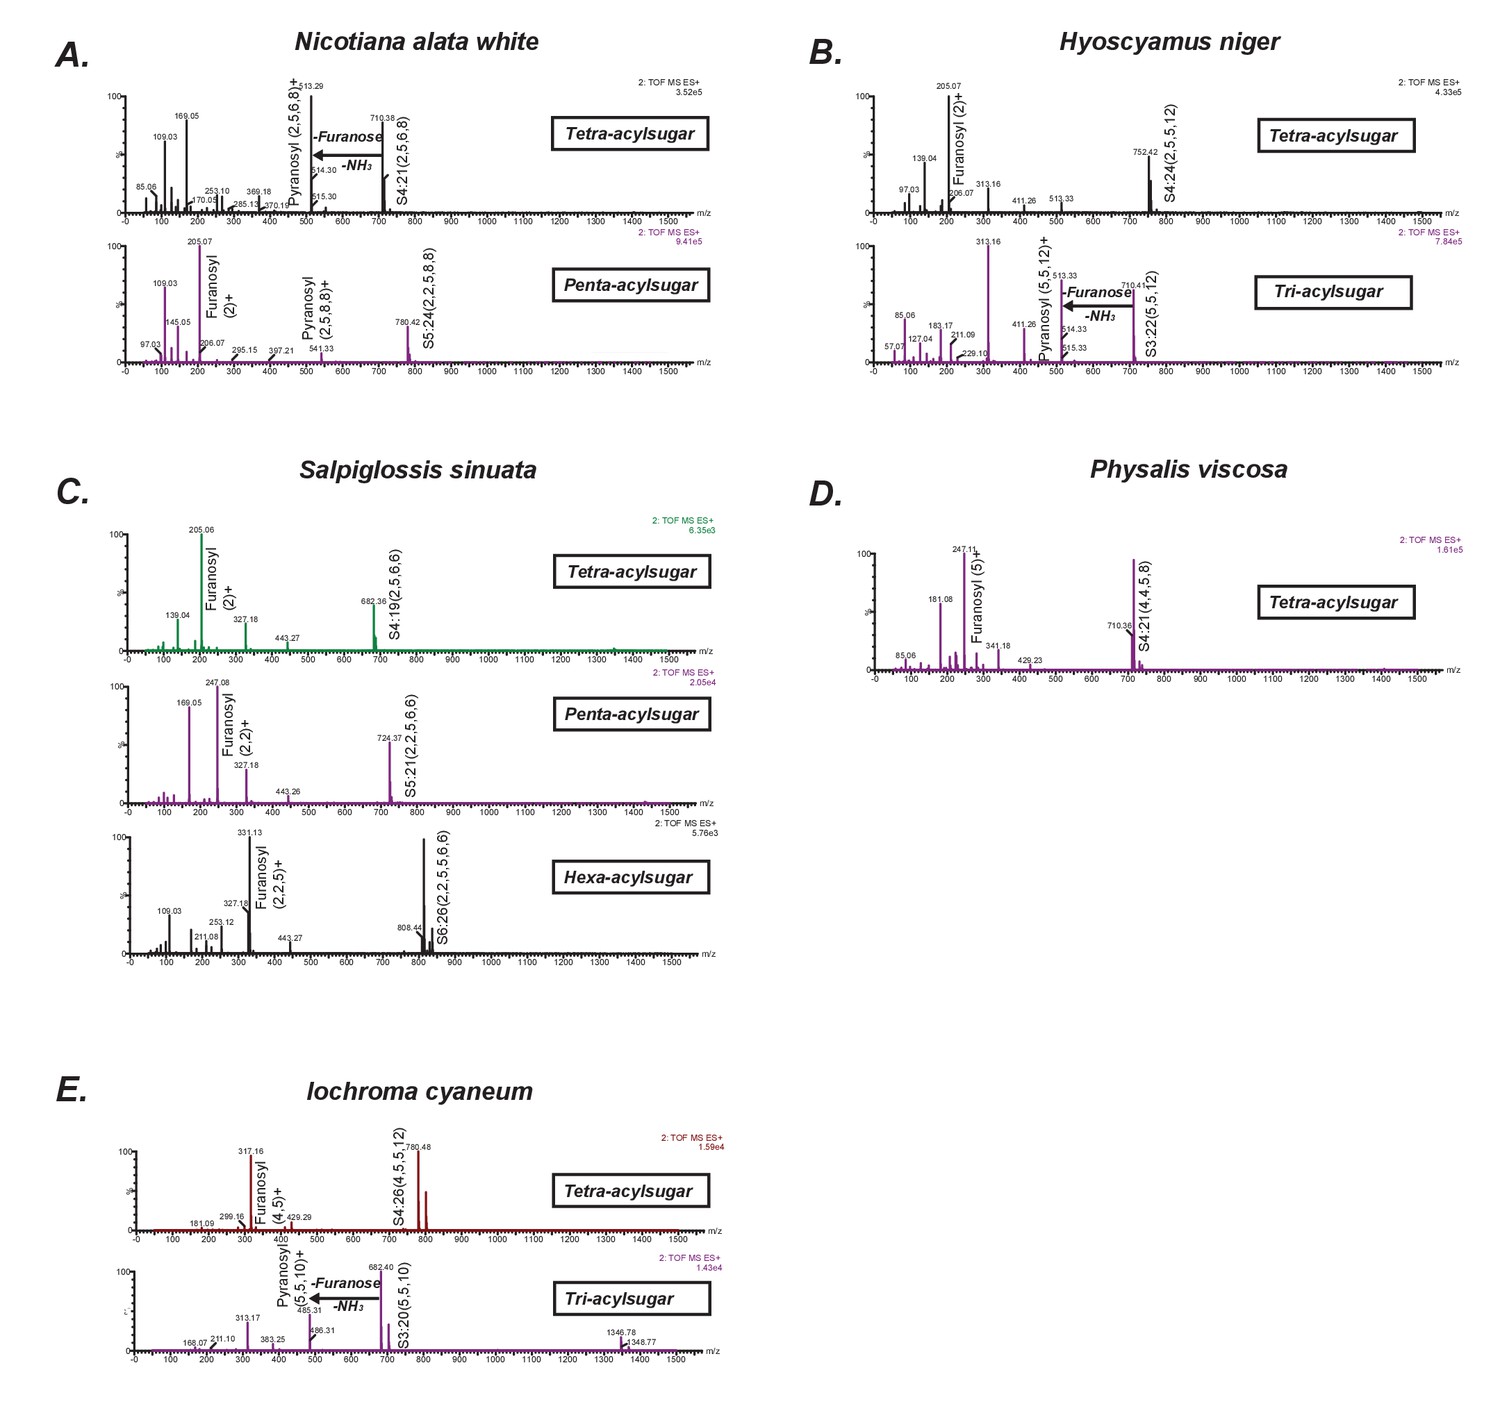
Positive mode CID mass spectra of select representative acylsugars from five species.
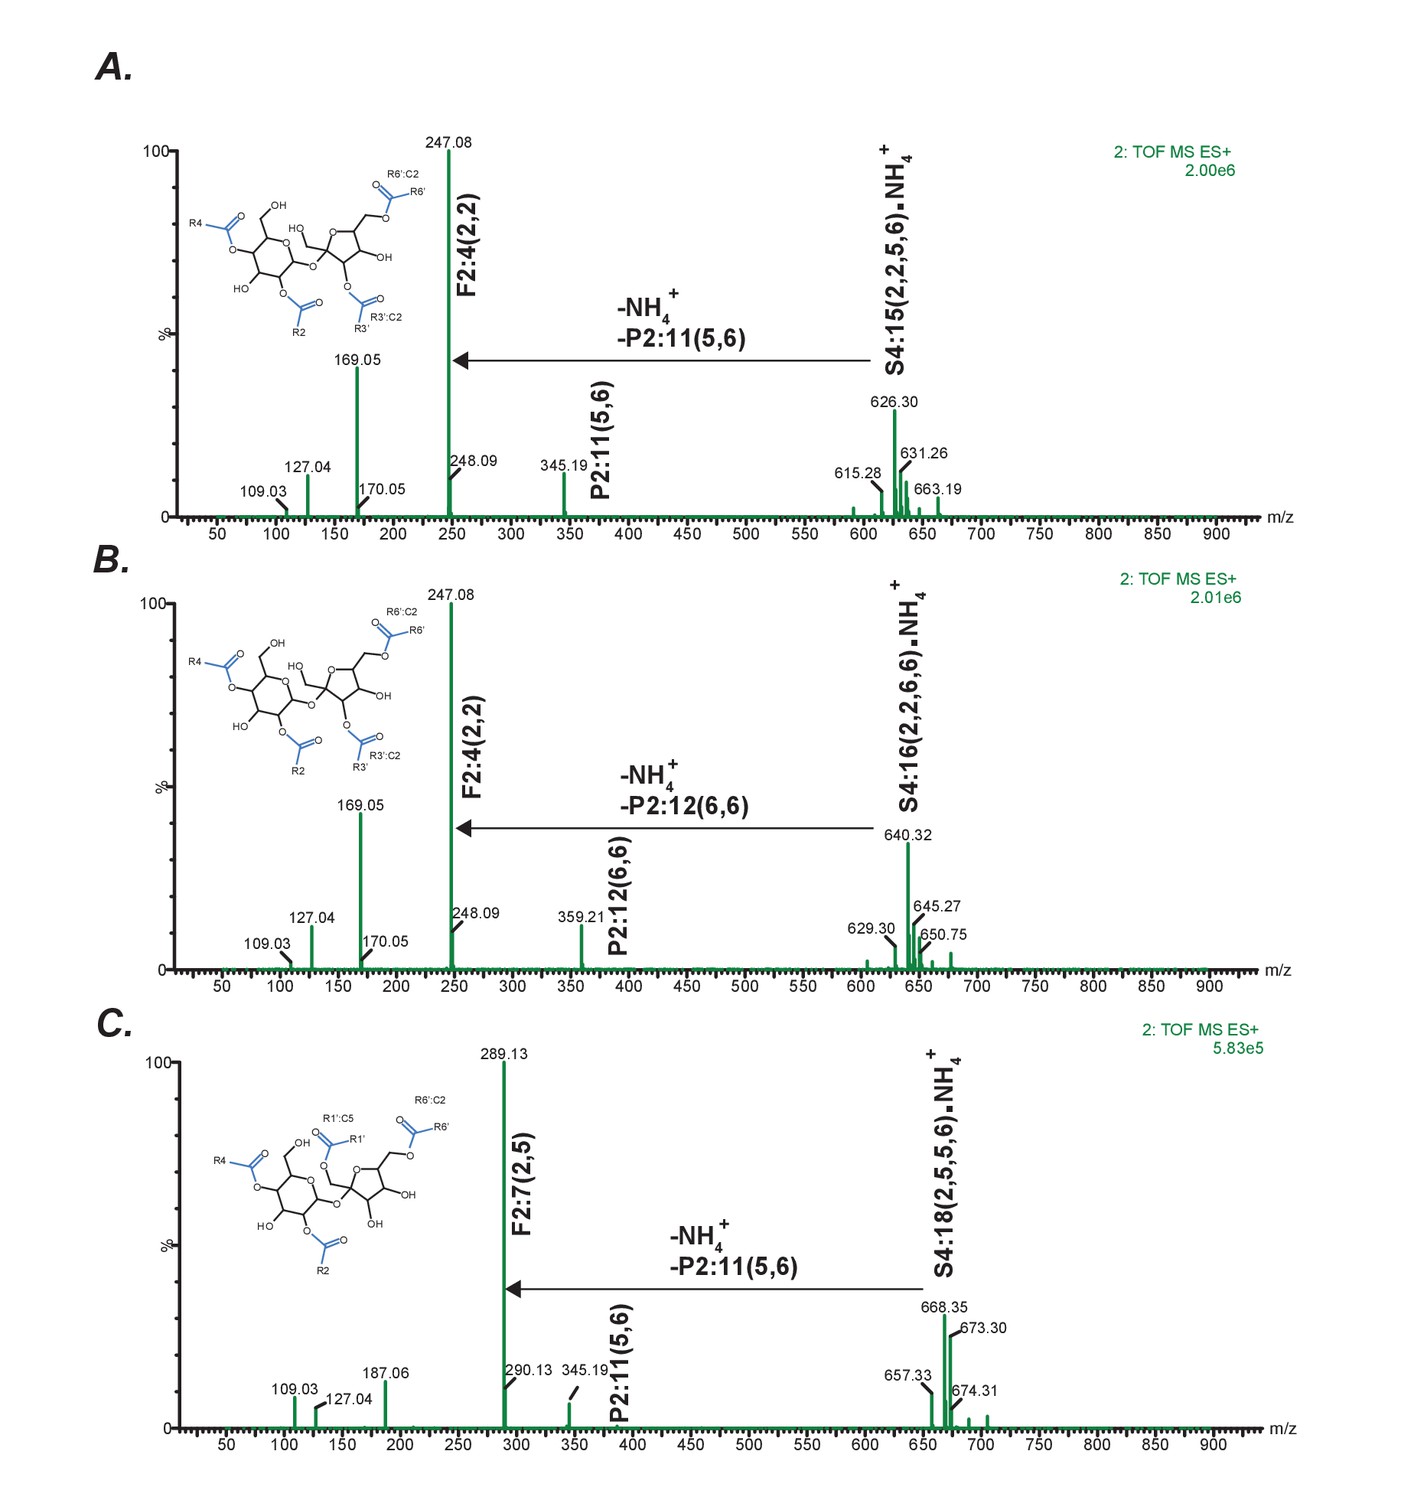
(A–E) Each spectrum was generated at elevated collision energy to generate fragment ions. Selected fragment ions obtained at the same retention time as the assigned pseudomolecular ion of the acylsugar are annotated. The pseudomolecular ion masses are masses of the adducts of the depicted acylsugars ([M + NH4]+). The mass difference between the pseudomolecular ion (intact acylsugar) and the fragment ion provides information about the number of acyl carbon atoms on each of the pyranose and furanose rings. We interpreted the losses and the fragment ions as involving the pyranose vs. furanose ring based on knowledge about their fragmentation patterns derived from previous studies.
Figure 1—figure supplement 5
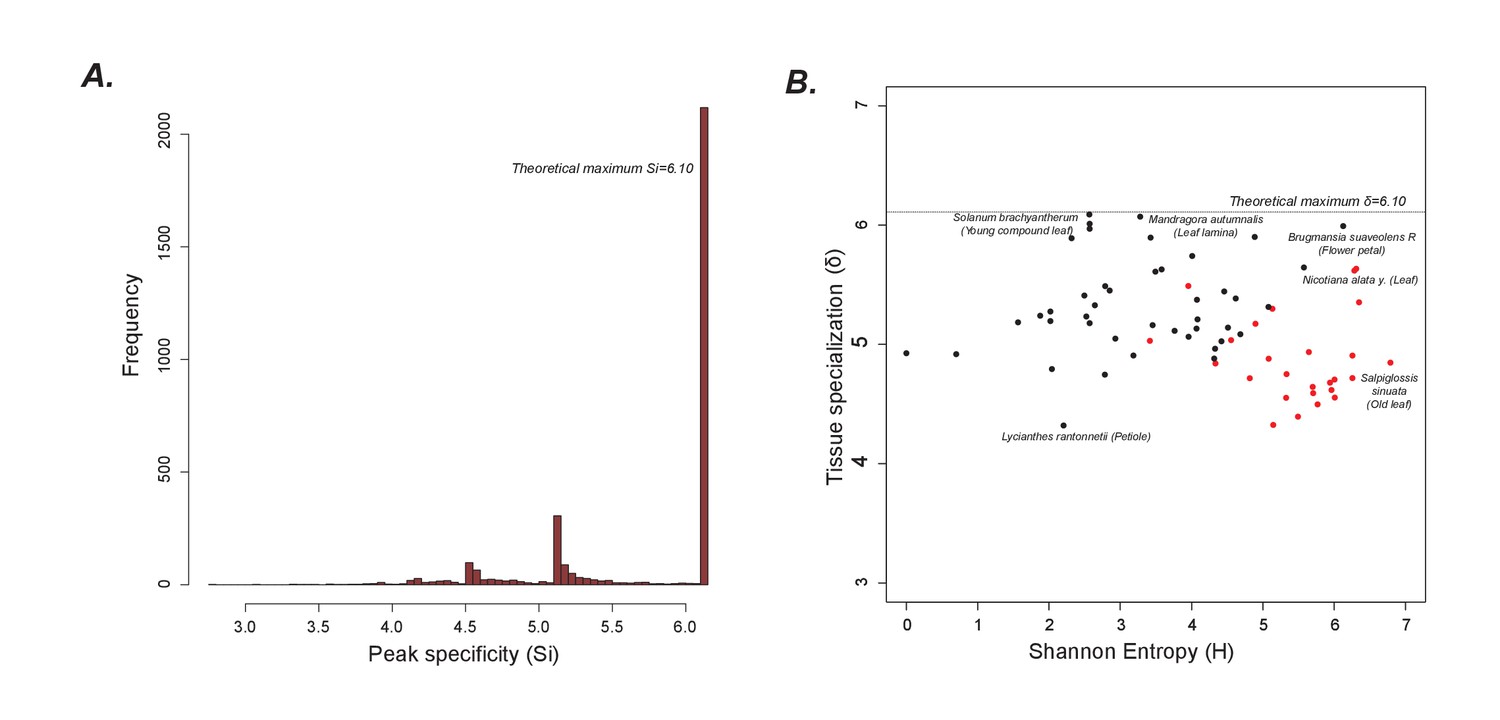
Peak and tissue specialization
(A) As shown in Figure 1G, the peaks are largely limited to single samples. Hence, the peak specificity (Si) is at the theoretical maximum. (B) A plot of tissue specialization vs Shannon Entropy shows that in general, tissue specialization is quite high, consistent with the results in Figure 1G. However, acylsugar producing species (red dots) have a slightly lower specialization than non-producers likely because overall, more peaks are shared between acylsugar producing species than non-producers, as can be seen in Figure 1—source data 5.
Figure 1—figure supplement 6
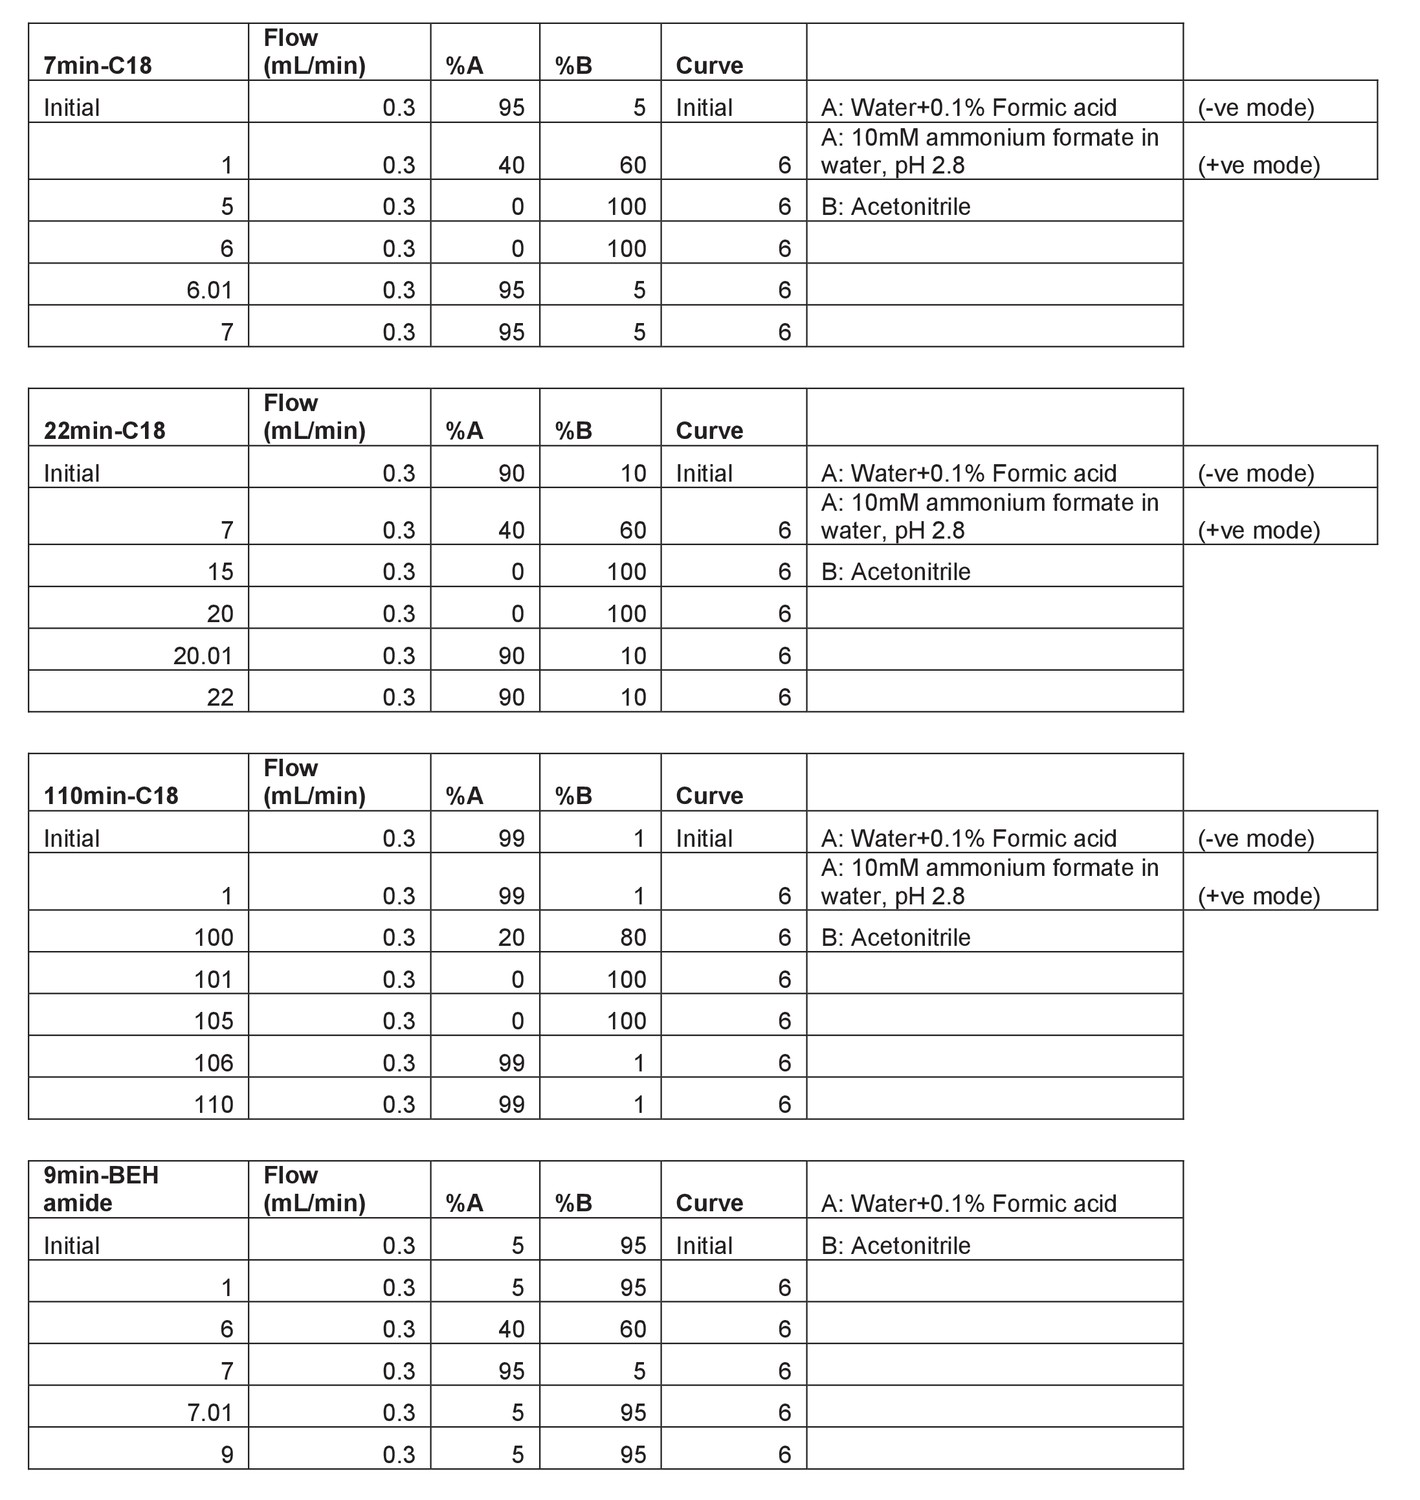
Description of the LC gradients used in this study.
First column includes the method run time and the column used.
Figure 2 with 8 supplements
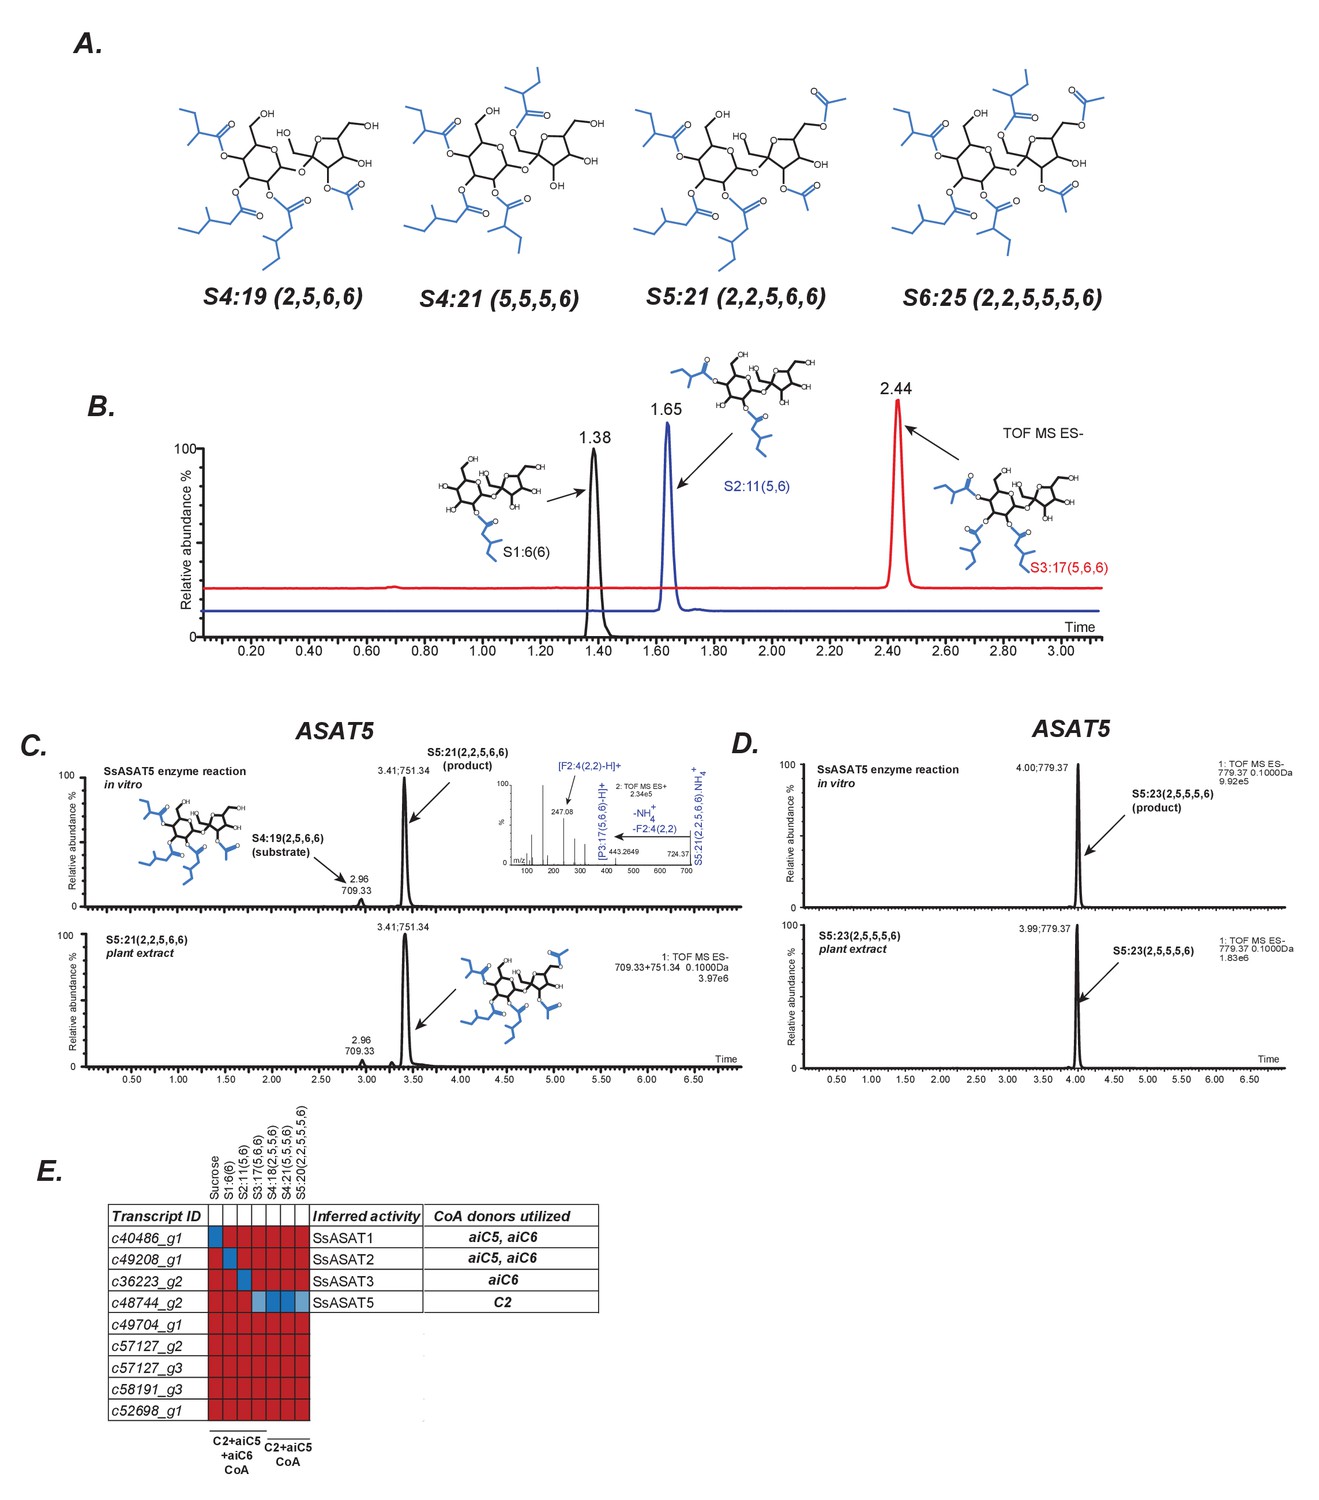
In vitro validation of Salpiglossis ASAT candidates.
(A) NMR derived structures of three Salpiglossis acylsugars. NMR resonances used to interpret the first three structures are described in Figure 2—source data 1. We verified the plant under study as Salpiglossis using genetic markers. These results are shown in Figure 2—figure supplement 1A,B. (B) Results of enzyme assays for SsASAT1 (black), SsASAT2 (blue) and SsASAT3 (red). Numbers above the peaks represent the retention times of the individual compounds (see Materials and methods), whose predicted structures are shown alongside. Validation of trichome-high expression of candidate enzymes (Figure 2—figure supplement 2) is shown in Figure 2—figure supplement 3. Additional validation of the in vitro results is described in Figure 2—figure supplements 4–7. (C,D) The SsASAT5 reactions, whose products have the same retention time as in planta compounds. Inset in panel C shows positive mode fragmentation and predicted acyl chains on pyranose [P] and furanose [F] rings. SsASAT5 also performs additional acylation activities as shown in Figure 2—figure supplement 8. (E) Testing various ASAT candidates with different acceptor (top) and donor (bottom) substates. Red indicates no activity seen by LC/MS, dark blue indicates a likely true activity, which results in a product usable by the next enzyme and/or a product that co-migrates with the most abundant expected compound. Light blue color indicates that the enzyme can acylate a given substrate, but the product cannot be used by the next enzyme or does not co-migrate with the most abundant expected compound. The relationships of the enzymes with each other are shown in Figure 2—figure supplement 1C.
-
Figure 2—source data 1
NMR chemical shifts for four acylsugars purified from Salpiglossis plants.
This data was used to infer Figure 2A.
- https://doi.org/10.7554/eLife.28468.025
Figure 2—figure supplement 1
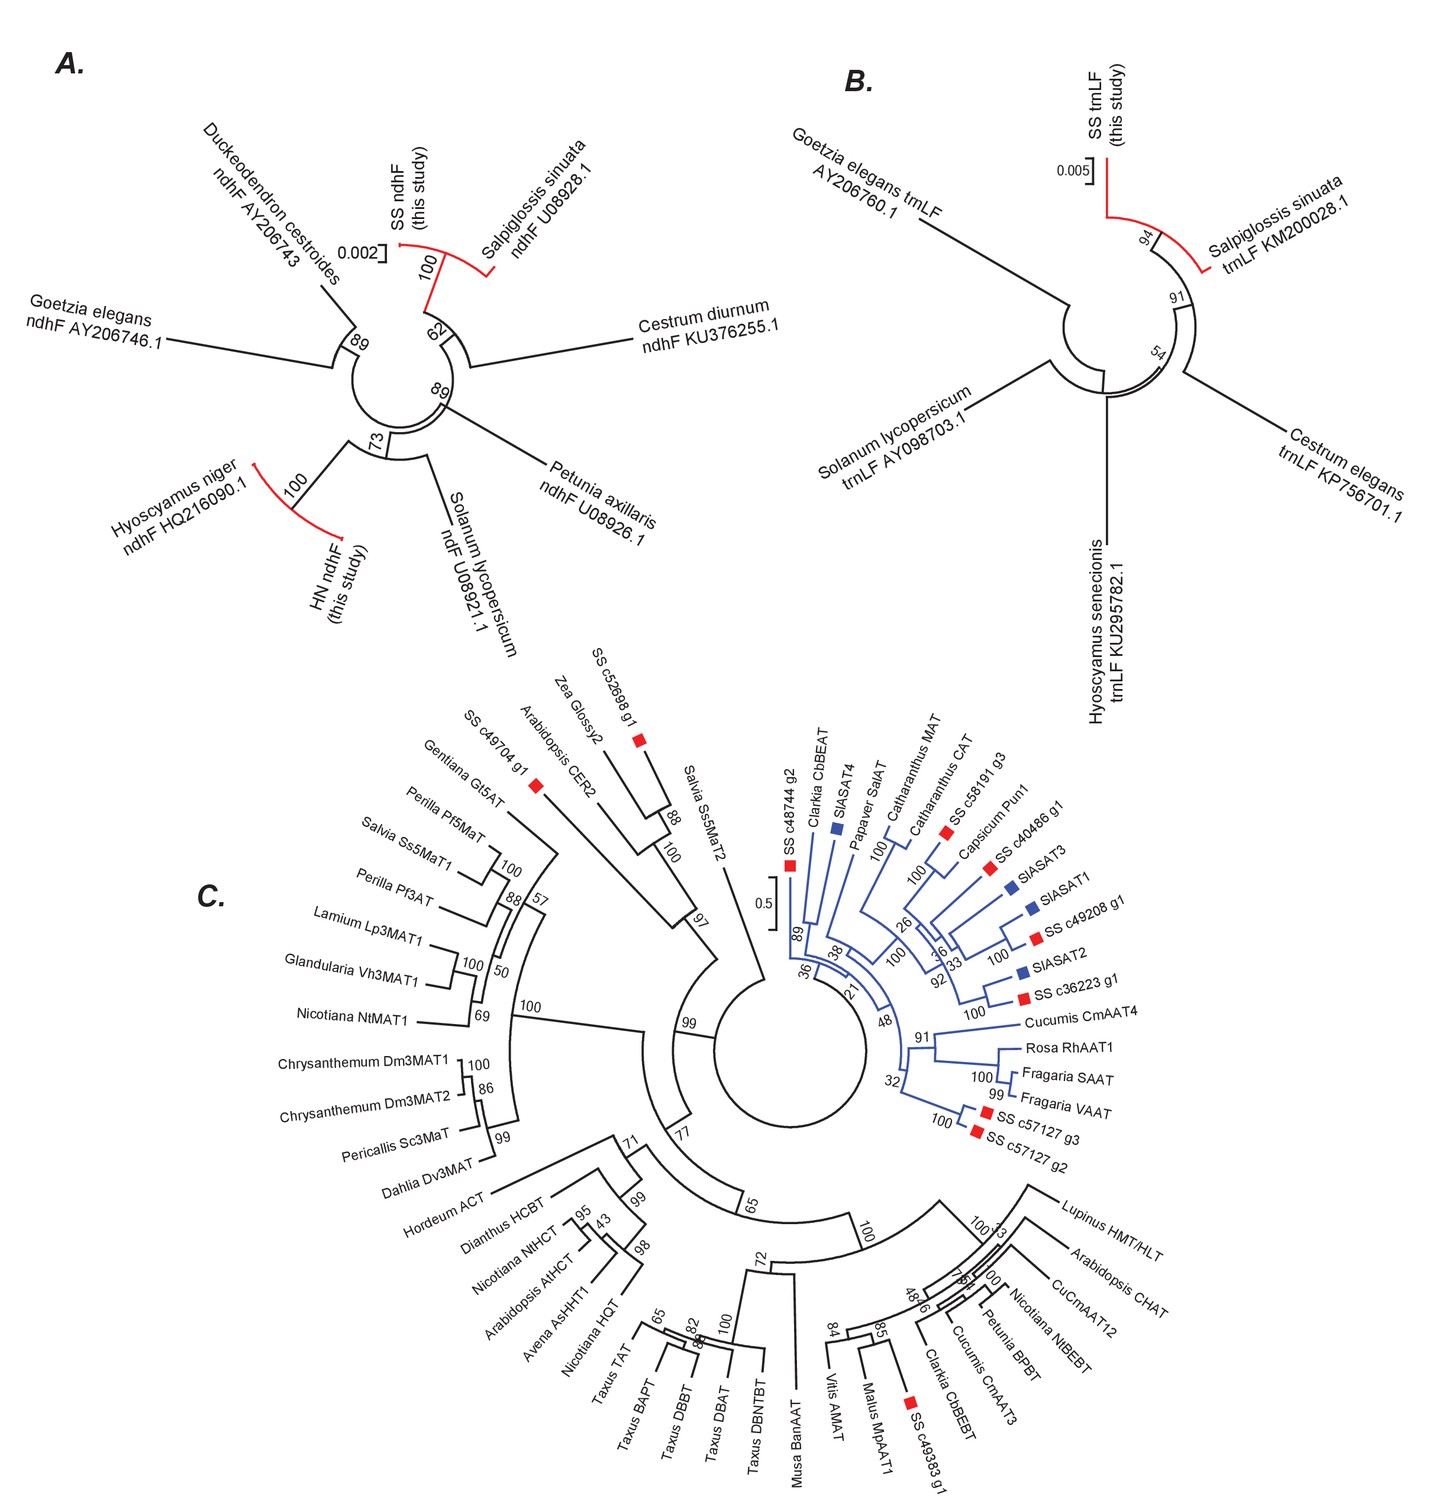
Phylogenetic positions of Salpiglossis, Hyoscyamus and Salpiglossis candidate enzymes.
(A,B) Phylogeny based on the ndhF (A) and trnLF spacer (B) sequence amplified from Salpiglossis and Hyoscyamus DNA (this study) and other sequences downloaded from NCBI. Accession numbers of NCBI sequences are noted. Trees were constructed using maximum likelihood approach using the GTRGAMMA model with five rate categories and with 1000 bootstrap replicates. (C) Maximum likelihood tree obtained using PROTGAMMAJTT model in RAxML v8.0.6, with BAHD enzymes described in D'Auria (2006), SlASAT protein sequences (blue squares) and protein sequences of candidate Salpiglossis enzymes (red squares). 1000 bootstraps were specified with bootstopping based on majority rule, and all sites with <70% coverage were discarded. The blue clade represents Clade III as described by D'Auria (2006).
Figure 2—figure supplement 2
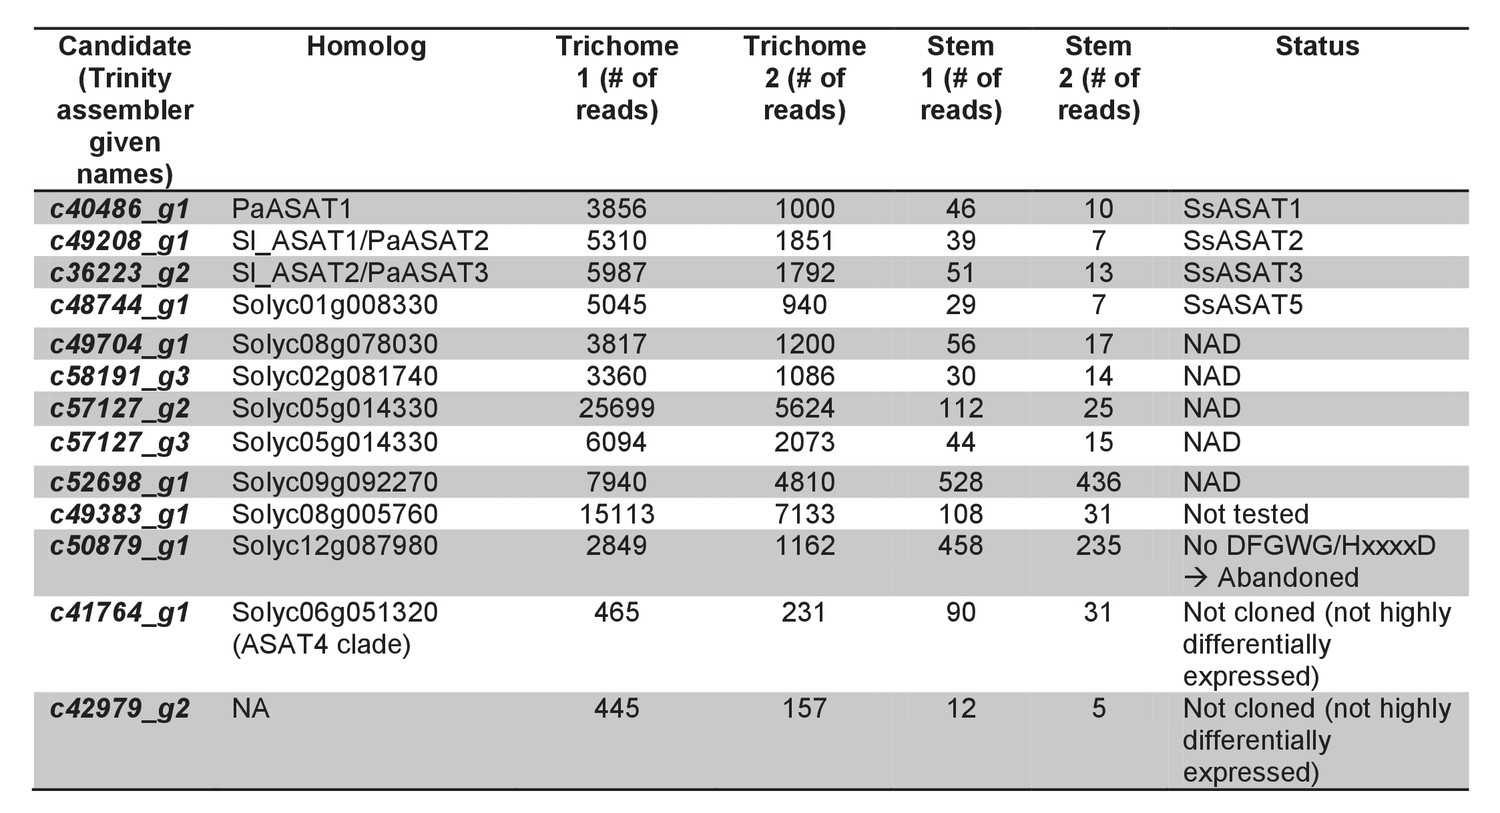
Trichome preferentially expressed BAHD enzymes.
Additional information about the transcripts is provided.
Figure 2—figure supplement 3
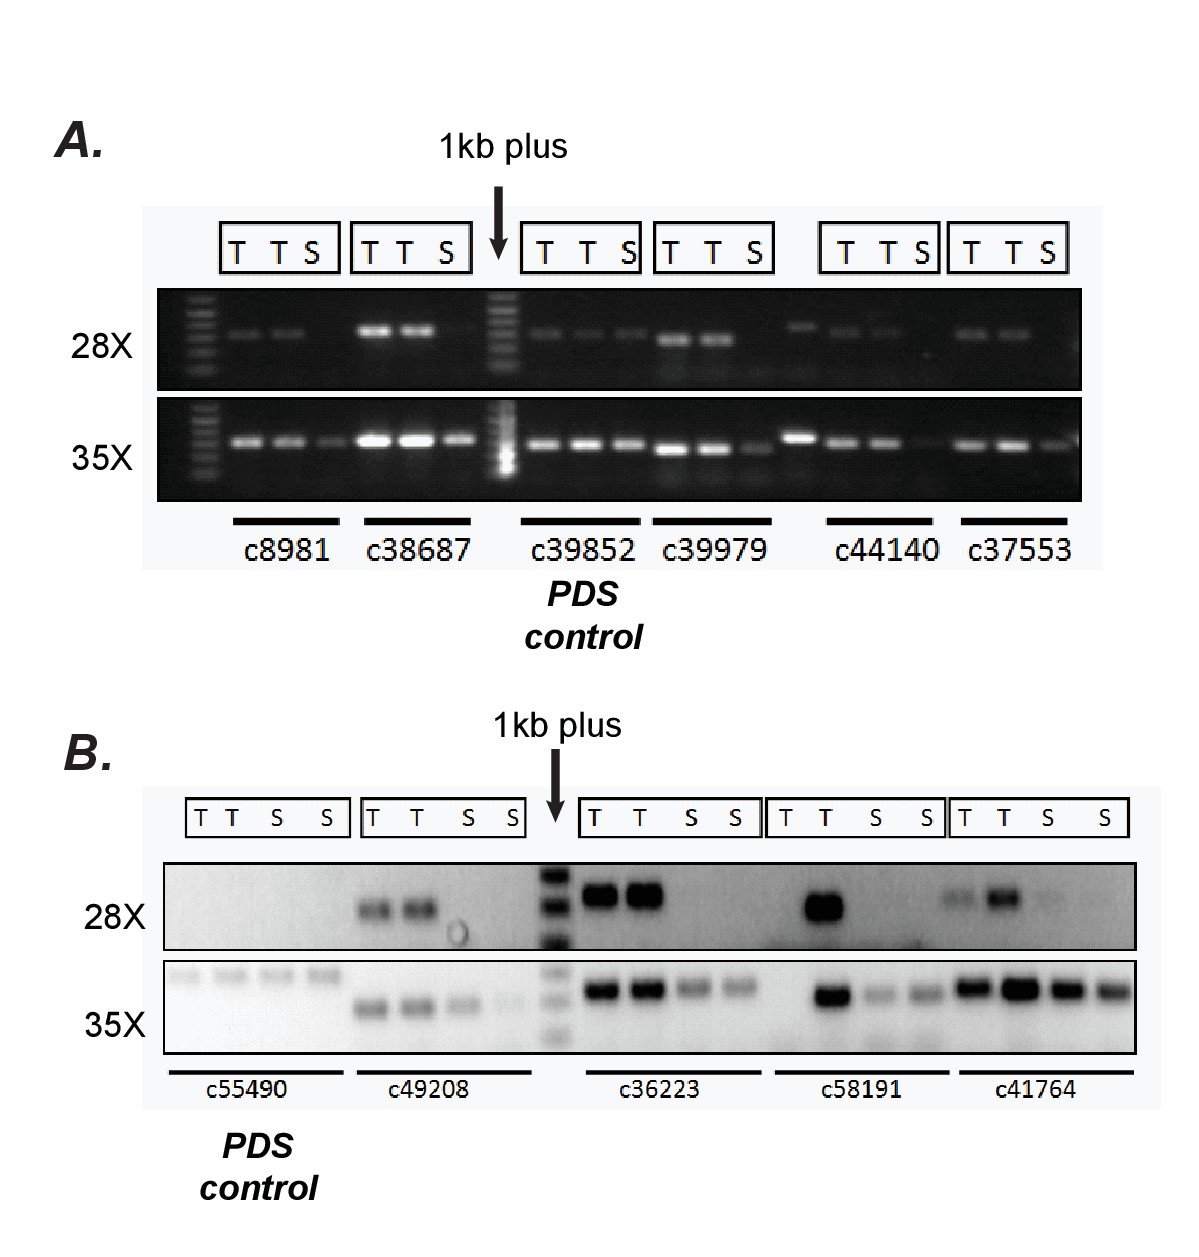
Confirmation of differential expression results from RNA-seq using semi-quantitative RT-PCR.
(A, B) Verification of trichome high expression of certain transcripts using semi-quantitative RT-PCR in S.quitoense (A) and Salpiglossis (B). The comparisons between Trichome (T) and Shaved stem (S) tissues involved using the same amount of starting cDNA, stopping the reactions after 28 or 35 cycles of PCR and running them on an agarose gel. Phytoene desaturase (PDS) which was not estimated to be differentially expressed based on RSEM/EBSeq analysis was used as control.
Figure 2—figure supplement 4
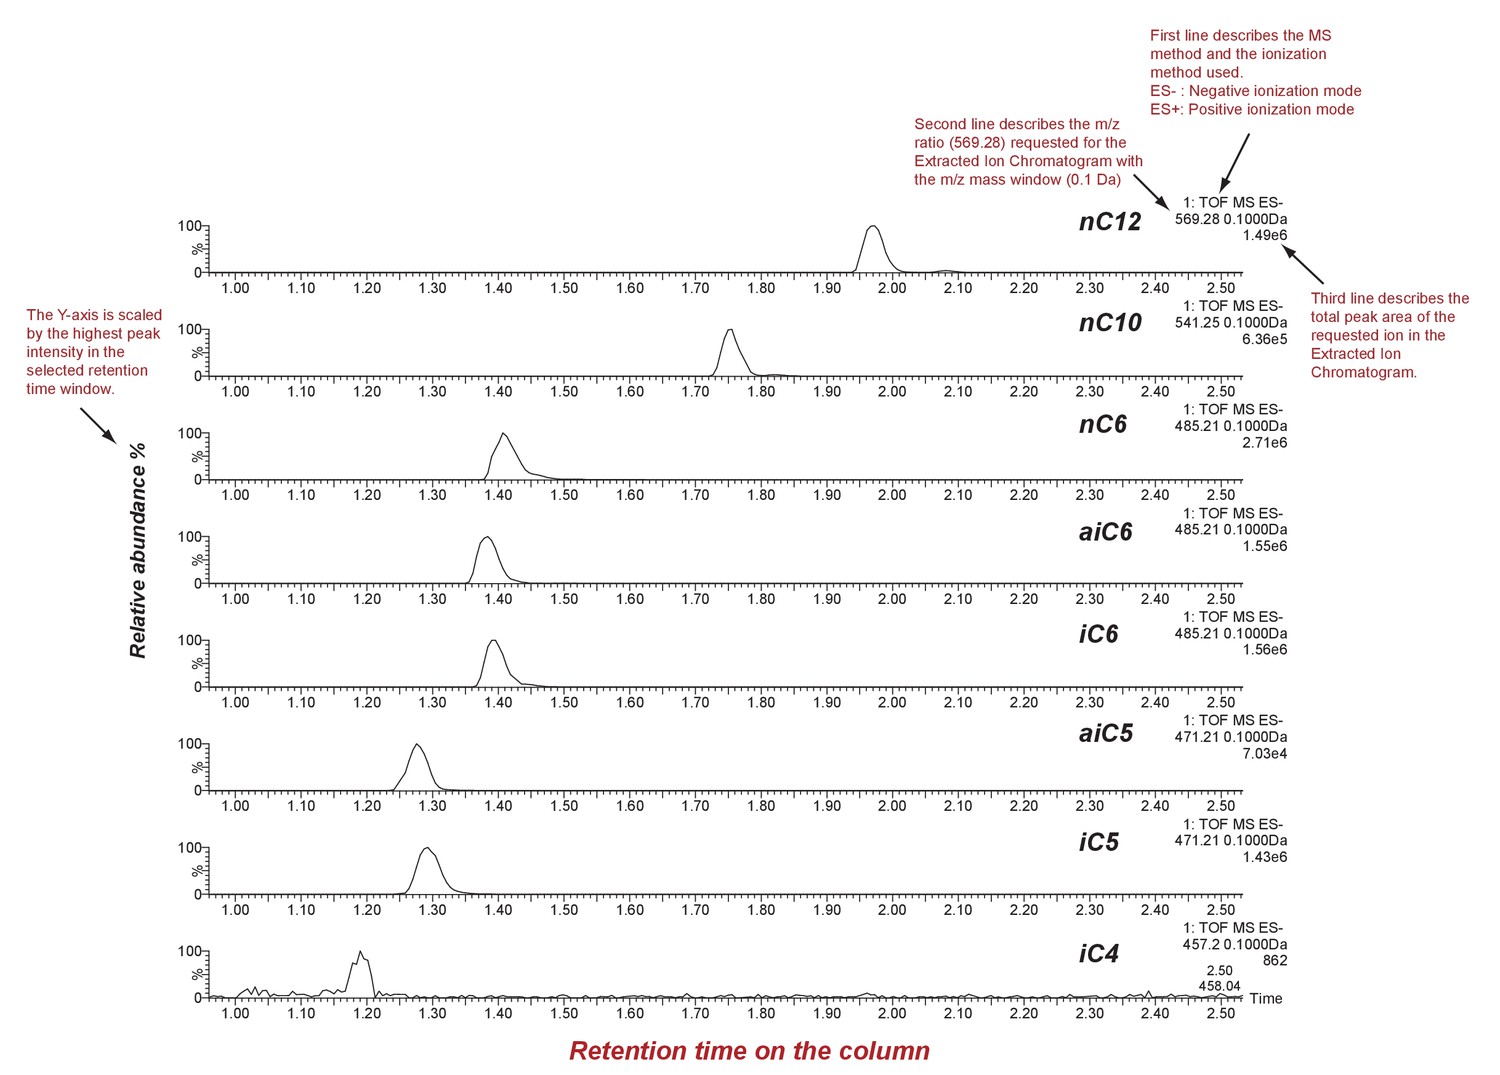
SsASAT1 reactions with different acyl CoA substrates.
Shown are extracted ion chromatograms of SsASAT1 reactions using sucrose as the substrate and various acyl CoAs as donors. No product was found with acetyl CoA as donor. LC/MS analyses were conducted using a C18 column in the negative ionization mode as described in the Methods. Descriptions of different parts of the chromatogram that aid in understanding the chromatogram are highlighted in red.
Figure 2—figure supplement 5
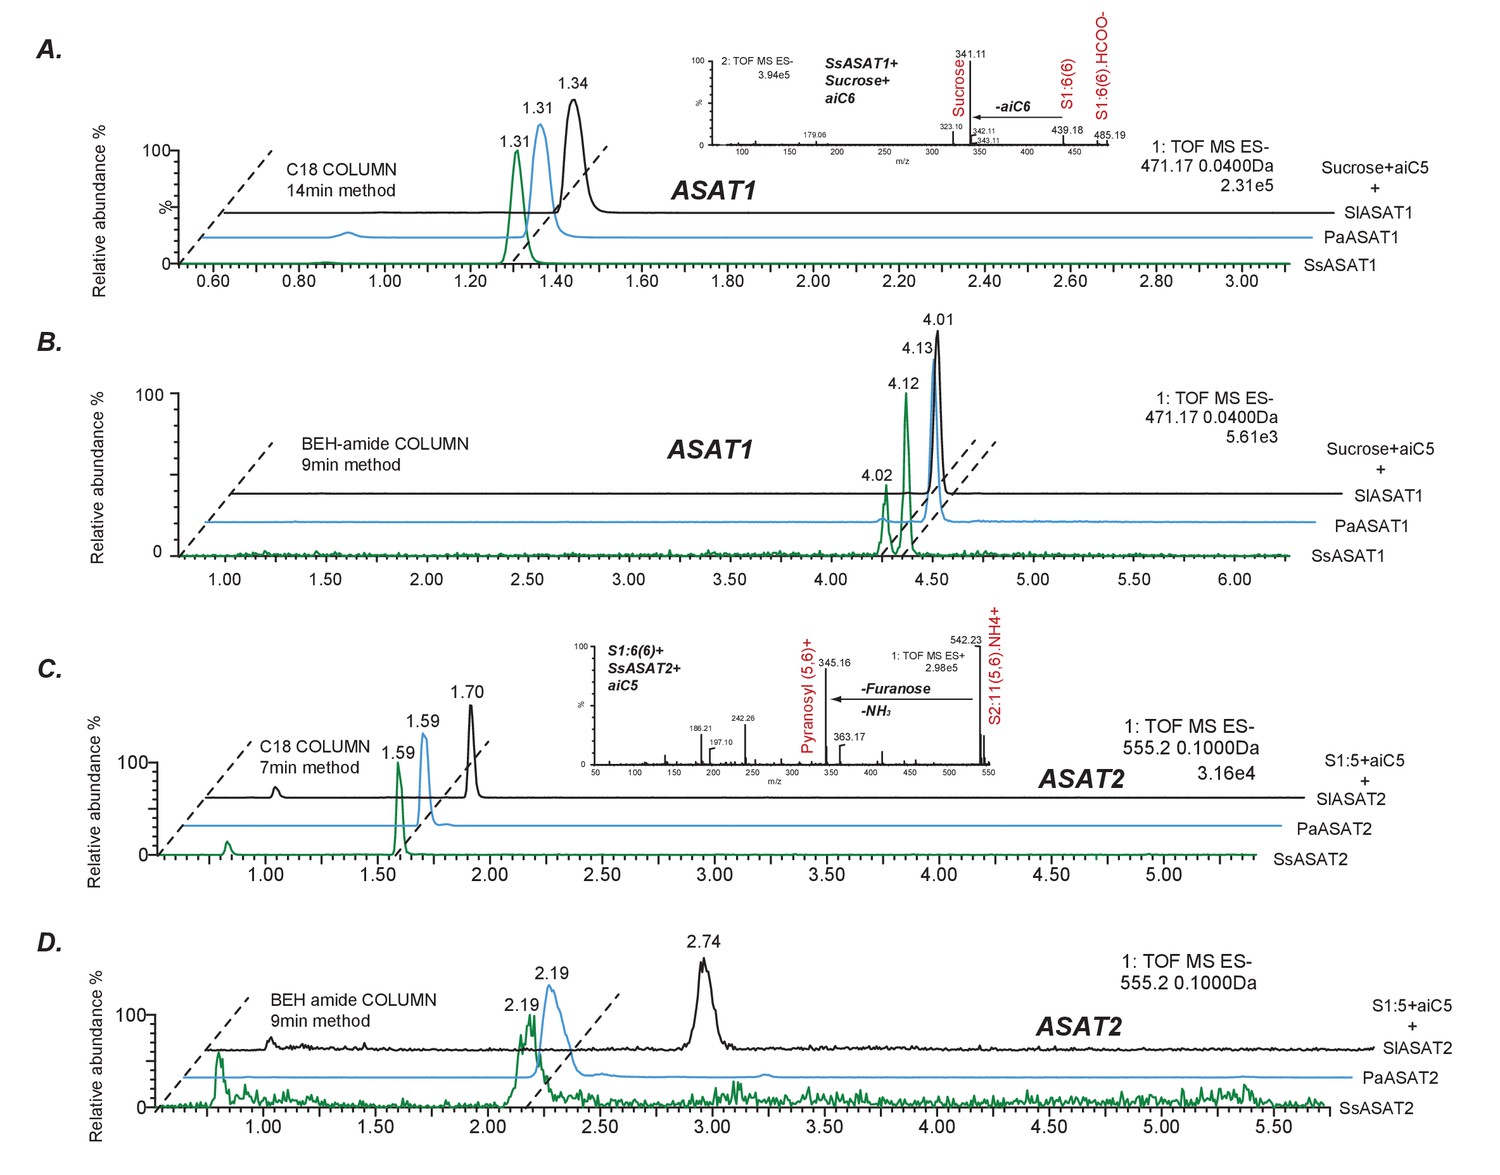
Comparative analyses of LC/MS retention times of enzyme reaction products.
(A,B) Comparison between S1:5(5) produced by SsASAT1, PaASAT1 and SlASAT1 on the C18 (A) and the BEH amide (B) column. The dashed line connect the peaks aligned based on their retention times, and shows that the SsASAT1 product peaks align precisely with the PaASAT1 product peaks with two different chromatographic methods (A,B), suggesting structural identity. (C,D) Comparisons between SsASAT2, PaASAT2 and SlASAT2 enzymes similar to those shown above, suggest that SsASAT2 and PaASAT2 acylate the same positions on the sucrose molecule. Inset in (A) shows negative ion mode fragmentation of S1:6(6) product of the SsASAT1 reaction using aiC6 CoA as donor. Inset in (C) shows positive ion mode fragmentation of S2:11(5,6) product of SsASAT2 using S1:6(6) produced by SsASAT1 as substrate. Inset in (C) shows that both aiC5 and aiC6 are added on the same (pyranose) ring.
Figure 2—figure supplement 6
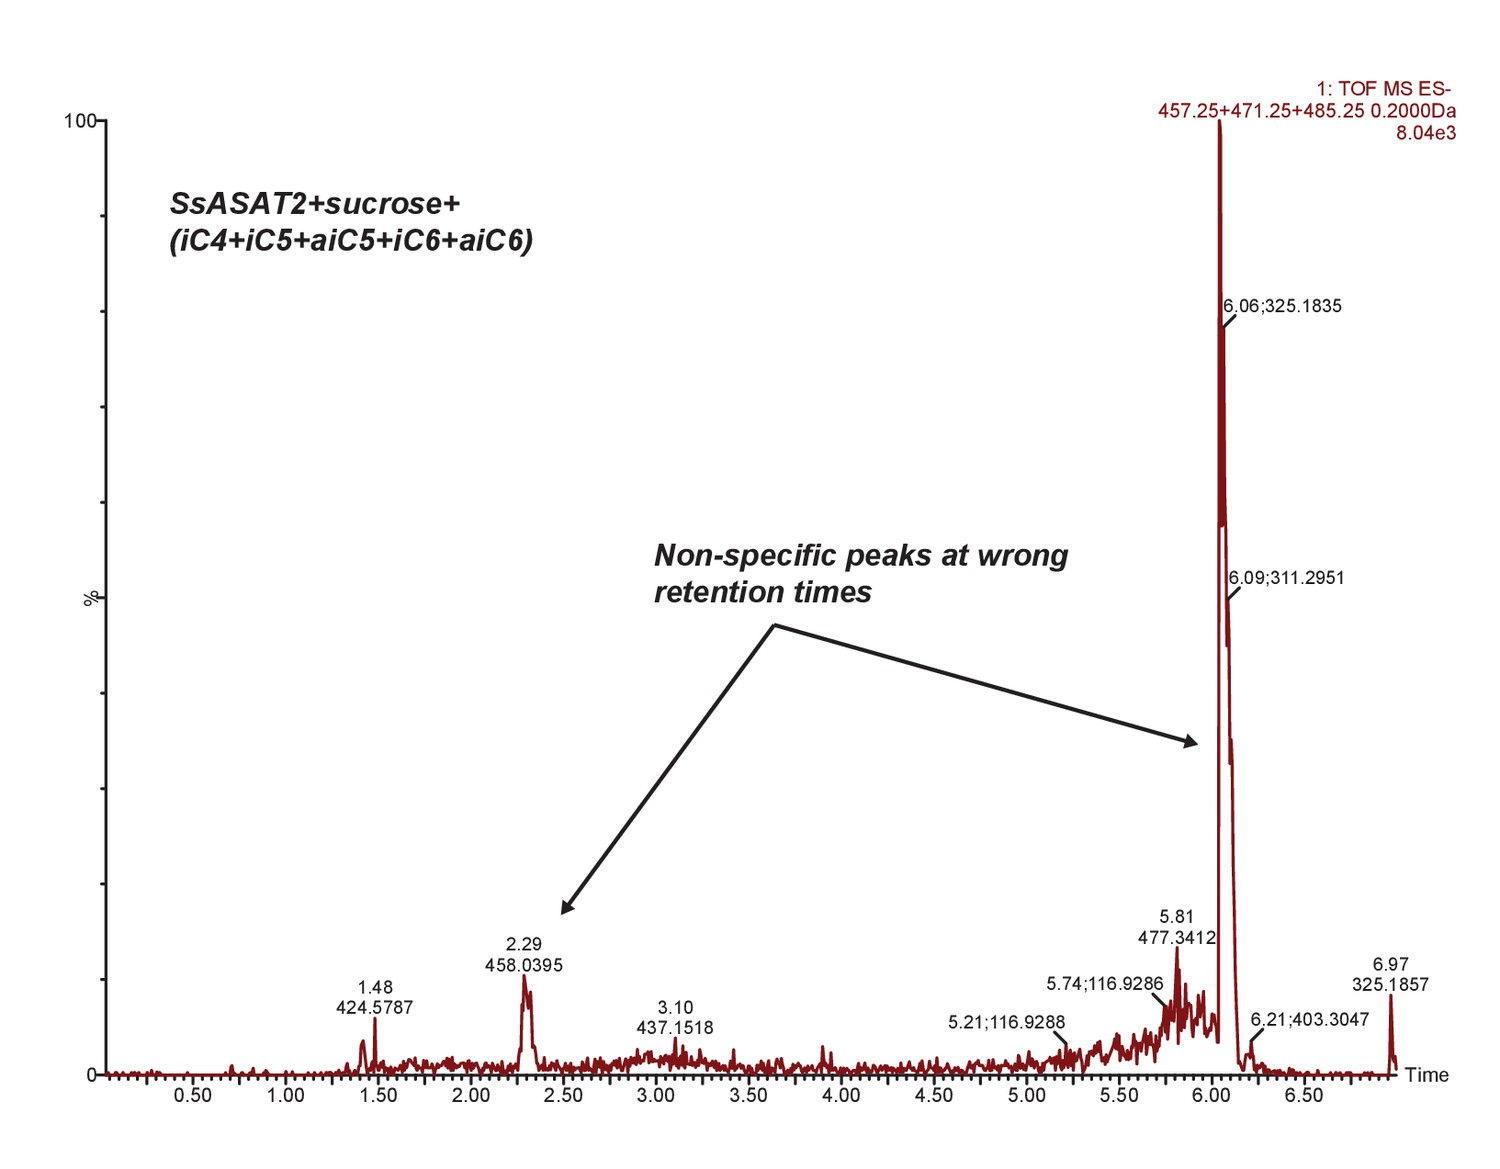
SsASAT2 does not acylate sucrose.
Extracted ion chromatogram of masses corresponding to S1:4(4), S1:5(5) and S1:6(6). No peaks corresponding to these products are seen. Additional reactions with individual CoAs -- aiC6 CoA and nC12 CoA -- are shown in Figure 7—figure supplement 1.
Figure 2—figure supplement 7
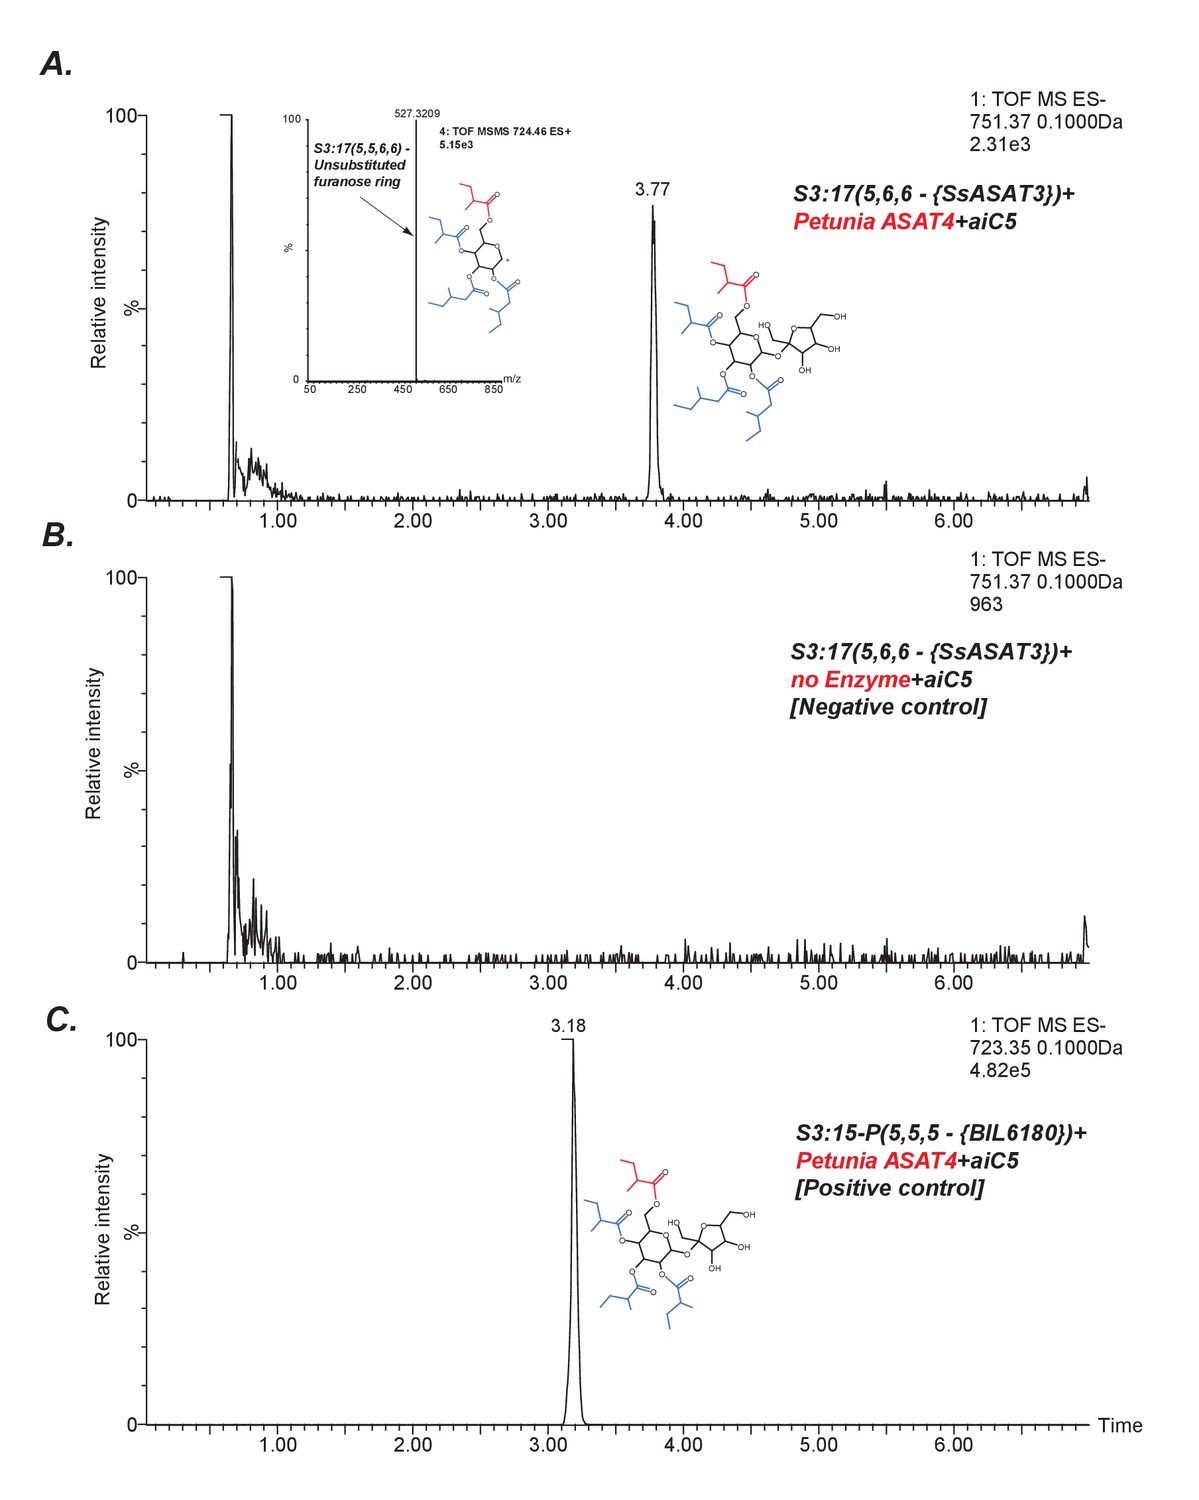
SsASAT3 acylates at the R3 position.
An indirect assessment of SsASAT3 positional specificity using Petunia ASAT4, which acylates at the pyranose R6 position (A) The chromatogram shows that Petunia ASAT4, which is known to acylate at the R6 position, can acylate the tri-acylated sugar S3:17(5,6,6) produced by SsASAT3 using the SsASAT2 product S2:10(5,5). The inset shows positive mode data suggesting all four chains are on the same ring. Given R6 is the only free hydroxyl group available on the pyranose ring in S3:17(5,6,6), and since SsASAT1 and SsASAT2 acylate R2 and R4 positions, the only position SsASAT3 can acylate without inhibiting PaASAT4 is R3. (B) Negative control with no enzyme (C) Positive control with S3:15 P(5,5,5) purified from BIL6180, with R2, R3 and R4 positions substituted by C5 chains based on NMR data (unpublished data).
Figure 2—figure supplement 8
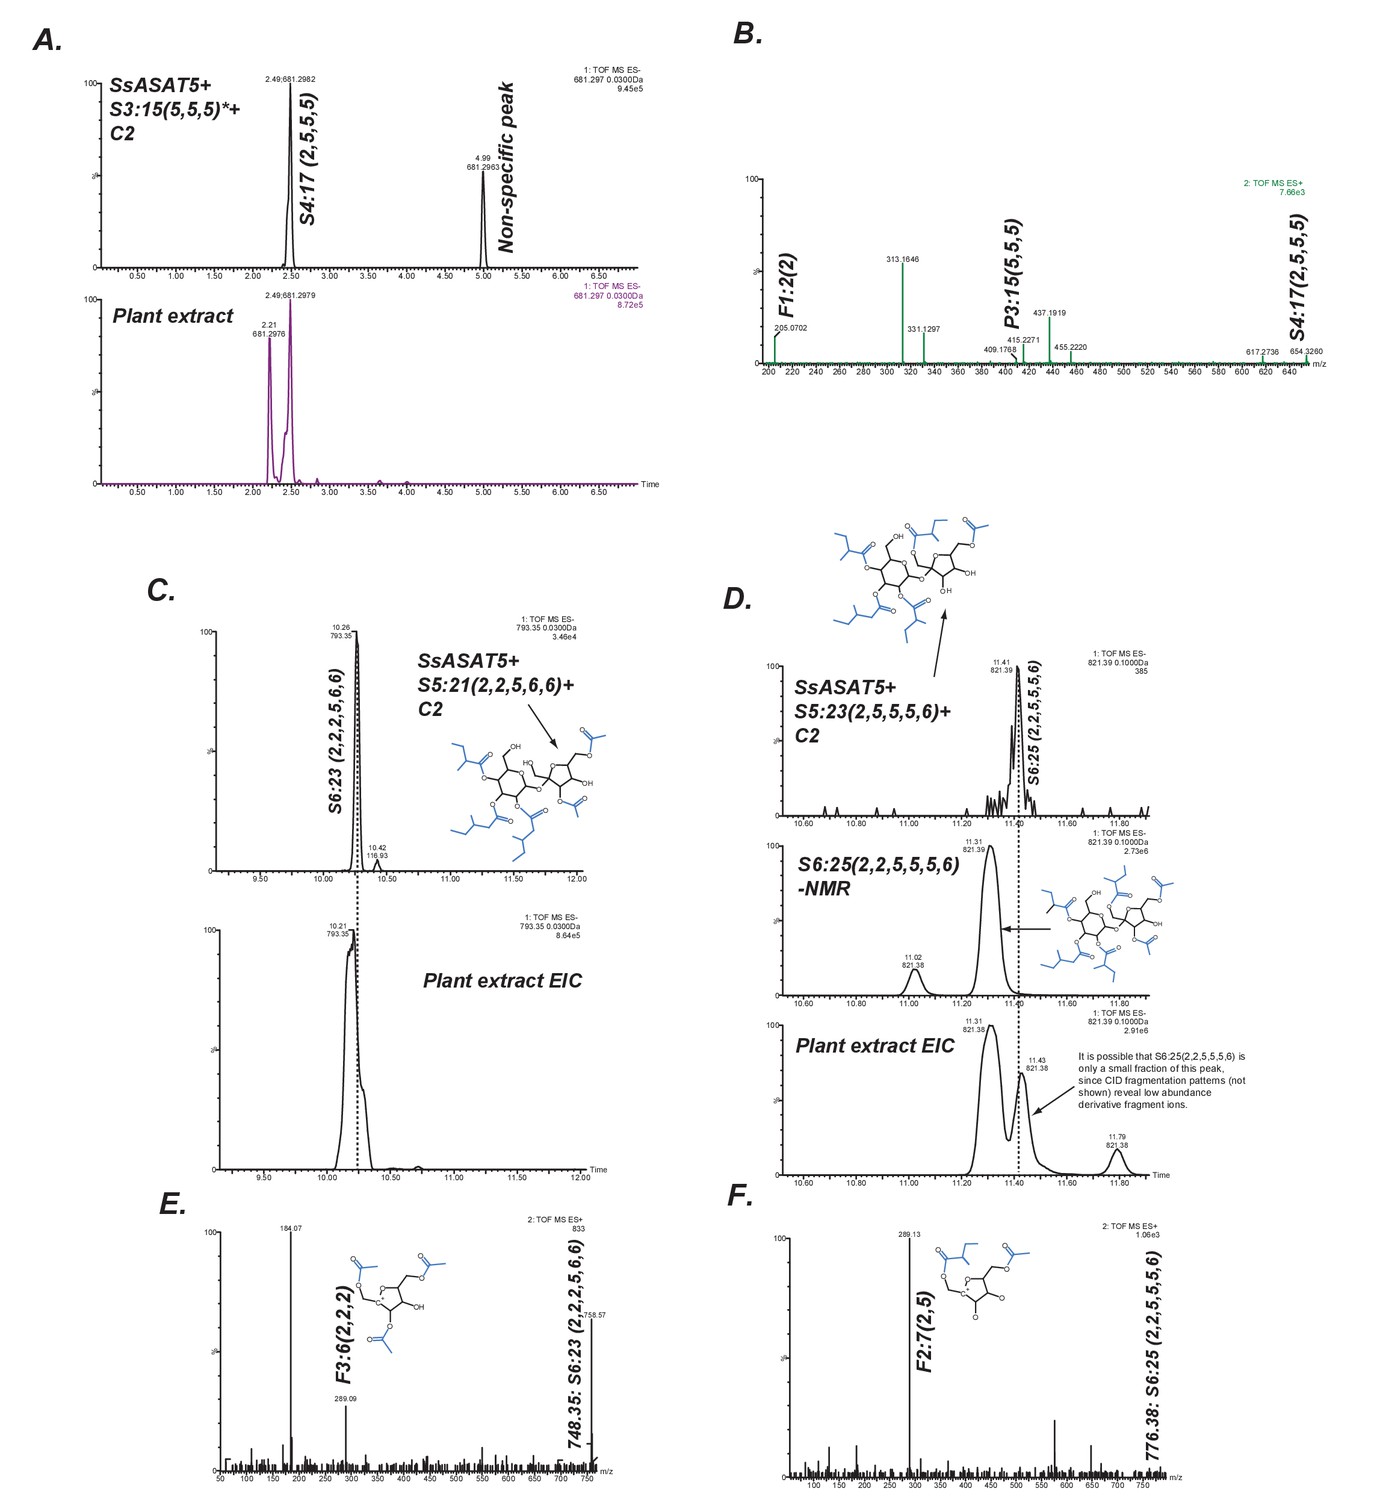
SsASAT5 putative secondary activities.
(A) SsASAT5 can transfer C2 to S3:15 (5,5,5) isolated from Solanum pennellii-derived Backcross Inbred Line BIL6180 (unpublished data; Ofner et al., 2016), which has the three acyl chains on the R2, R3 and R4 pyranose (abbr: P) ring, same as Salpiglossis. (B) The C2 addition likely occurs on the furanose (abbr: F) ring, as seen by the presence of the m/z 205.07 in the positive-ion mode elevated collision energy mass spectrum. (C,D) SsASAT5 can transfer C2 to penta-acylated sucroses, and the product co-migrates with an acylsugar of the same molecular mass produced in the plant. Co-migrating peaks are aligned by the dashed line. Central panel in (D) shows that the S6 sugar produced by SsASAT5 is not the same as the most abundant acylsugar produced by the plant purified for NMR, which has two C2s on the furanose ring. Shown are extracted ion LC/MS chromatograms for the expected masses. (E,F) The most abundant fragment ions (m/z: 289.09, 289.13) are consistent with C2 addition occurring on the furanose and pyranose rings, respectively.
Figure 3 with 2 supplements

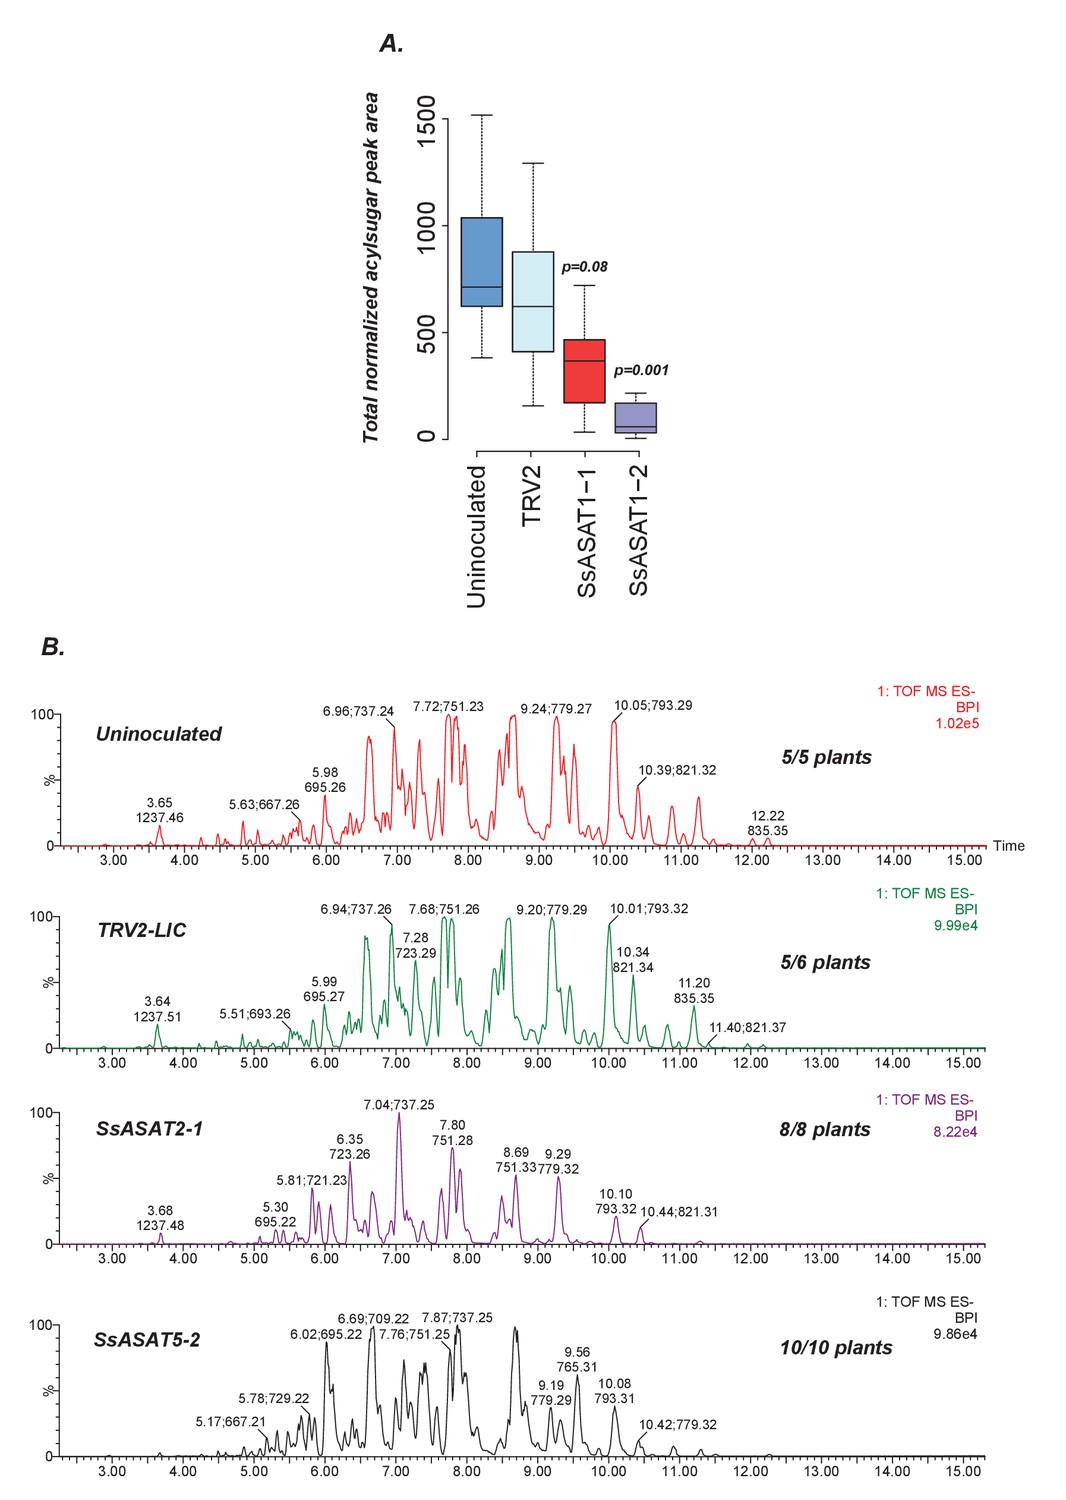
In planta validation of SsASAT1 and SsASAT2 candidates.
(A) Two representative plants with the phytoene desaturase gene silenced using VIGS shown with 18% reflectance gray card. SsPDS-1 and SsPDS-2 have two different regions of the SsPDS transcript targeted for silencing. (B) qPCR results of SsASAT VIGS lines. Relative fold change in ASAT transcript abundance in VIGS knockdown plants compared to empty vector plants. Error bars indicate standard error obtained using three technical replicates. Expression level of the phytoene desaturase (PDS) gene was used as the reference control. Figure 3—source data 1 includes values obtained from qPCR analysis. (C,D) SsASAT1 knockdown using two different constructs (SsASAT1-1, SsASAT1-2) shows reduction in acylsugar levels. The SsASAT1-1 phenotype is more prominent than the ASAT1-2 phenotype, being significantly lower (p=0.05; KS test). One construct for SsASAT2 (SsASAT2-1) also showed significant decrease in acylsugar levels (p=0.03; KS test). Note that the Y-axis total ion intensity in (C) is different for each chromatogram. (E,F) SsASAT2 knockdown leads to drops in levels of higher molecular weight acylsugars. In (C–F), number of plants used for statistical analysis is noted. Figure 3—source data 2 describes normalized peak areas from VIGS plants used for making these inferences. Results of the second set of biological replicate experiments performed at a different time under a different set of conditions -- as described in Supplementary file 4 -- is shown in Figure 3—figure supplement 1. Figure 3—figure supplement 2 is a more detailed analysis of the SsASAT2 knockdown phenotype showing the individual acylsugar levels under the experimental conditions.
-
Figure 3—source data 1
Raw and processed values obtained through qPCR.
Data was used to make Figure 3B.
- https://doi.org/10.7554/eLife.28468.029
-
Figure 3—source data 2
Normalized peak areas calculated for VIGS experiments.
Individual worksheets describe data obtained from independent experiments. This data was used to make Figures 3D, F, 4B and D.
- https://doi.org/10.7554/eLife.28468.030
Figure 3—figure supplement 1
Results of knockdown of SsASAT1, SsASAT2 and SsASAT5 transcripts in a distinct replication of VIGS experiments.
(A) SsASAT1 knockdown shows reduction of acylsugar levels. (B) SsASAT2 and SsASAT5 knockdown causes substantial changes in Salpiglossis acylsugar profiles. The accumulating acylsugars in these two knockdowns are different, as seen by the co-eluting m/z ratios. Number of plants showing depicted phenotype out of the total number of analyzed plants is noted on the right side of each chromatogram.
Figure 3—figure supplement 2
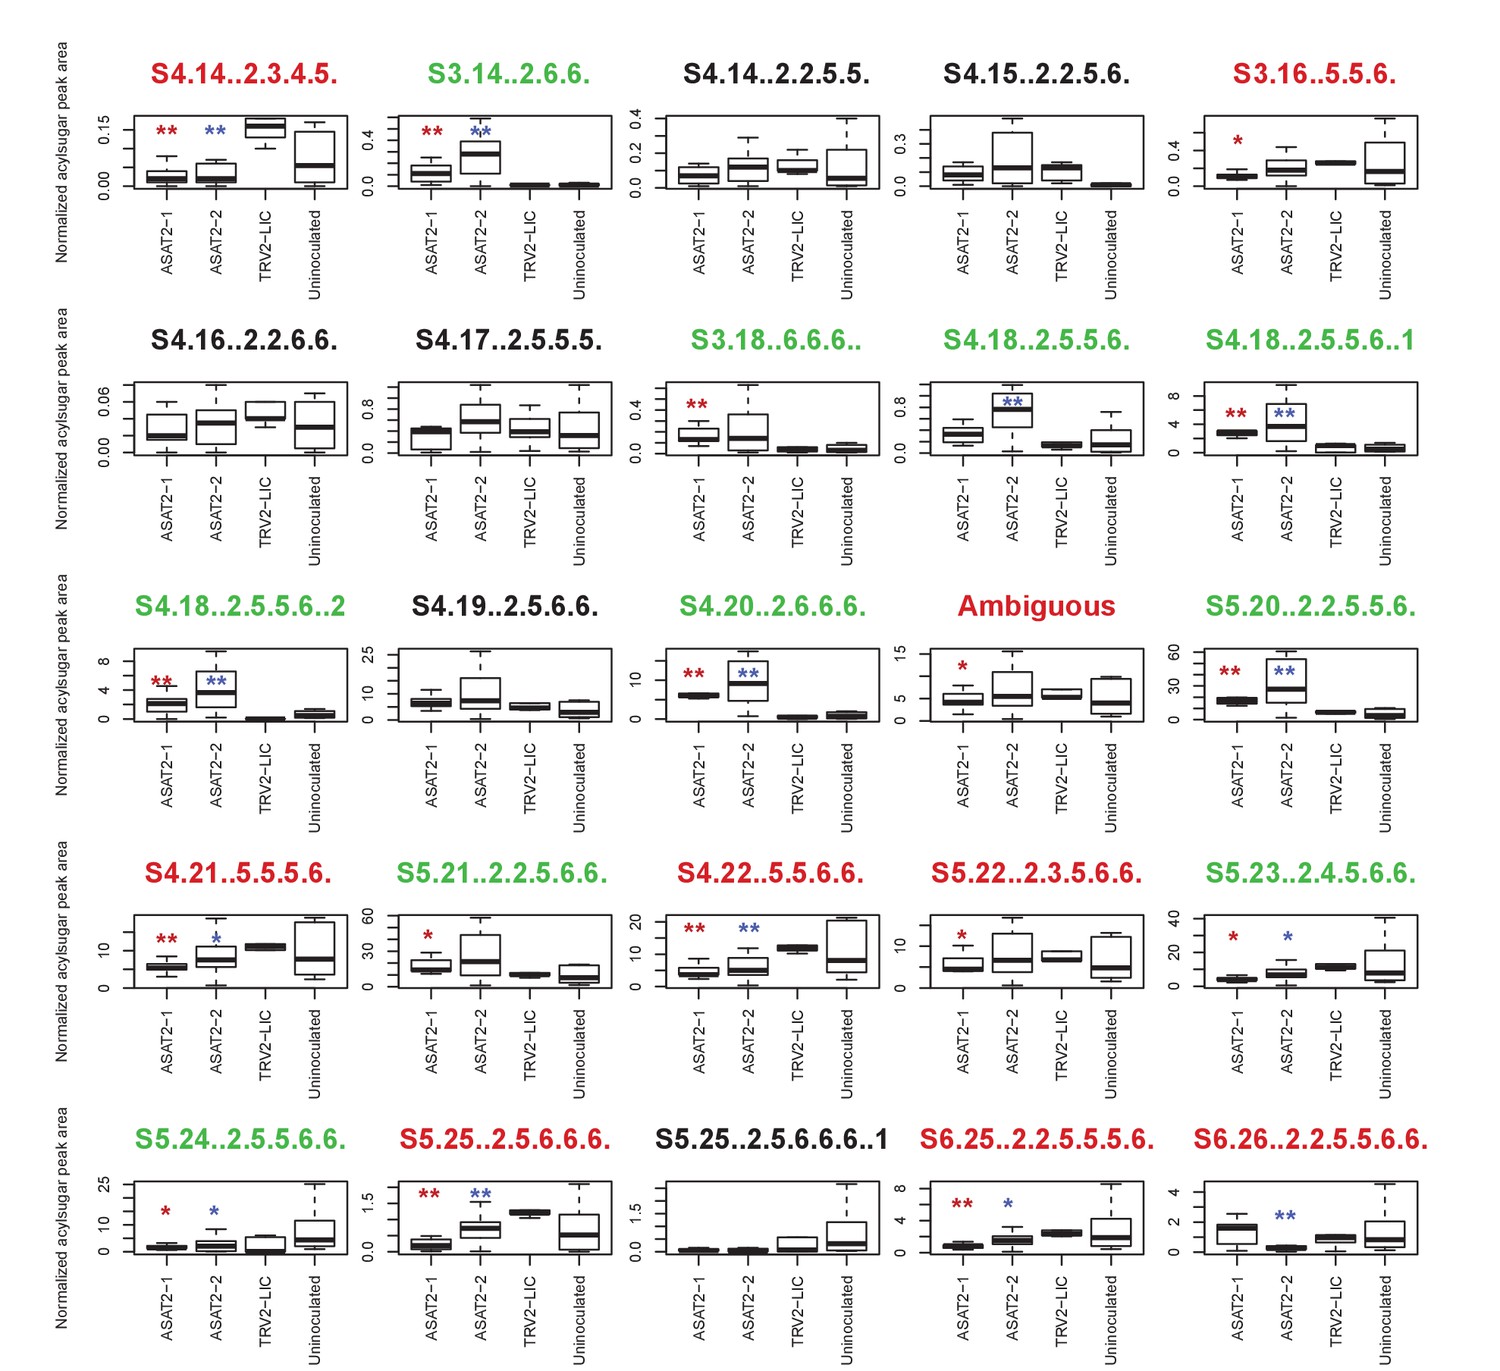
Individual acylsugar levels in SsASAT2 VIGS replicate 1.
The boxplots denote the summed normalized acylsugar peak areas, obtained using the LC/MS extracted ion chromatograms, across all plants in the experiment. Blue and red asterisks indicate significant changes in SsASAT2-1_TRV2-LIC and SsASAT2-2_TRV2-LIC comparisons, respectively. *p<0.05; **p<0.01 using the KS test. Acylsugar names in green show significant increases and the names in red show significant decreases compared with the TRV2-LIC control. These results show that C2 acylated derivatives of S3:16(5,5,6), S3:17(5,6,6) and S3:18(6,6,6) [e.g.: S4:18(2,5,5,6); S5:20(2,2,5,5,6)] increased significantly, while C5 derivatives of these acylsugars [eg: S4:21(5,5,5,6); S5:25(2,5,6,6,6)] decreased significantly in the silenced lines. One possible explanation for this result is that another transcript was silenced in addition to SsASAT2. However, the single Salpiglossis transcript with 100% identity to the silencing fragment over 18 nucleotides is not preferentially expressed in the trichomes of uninfected Salpiglossis (~360 reads in trichome;~550 reads in shaved stem) and is annotated as an ion channel. Thus, the reason for this unusual phenotype is still unclear.
Figure 4 with 3 supplements
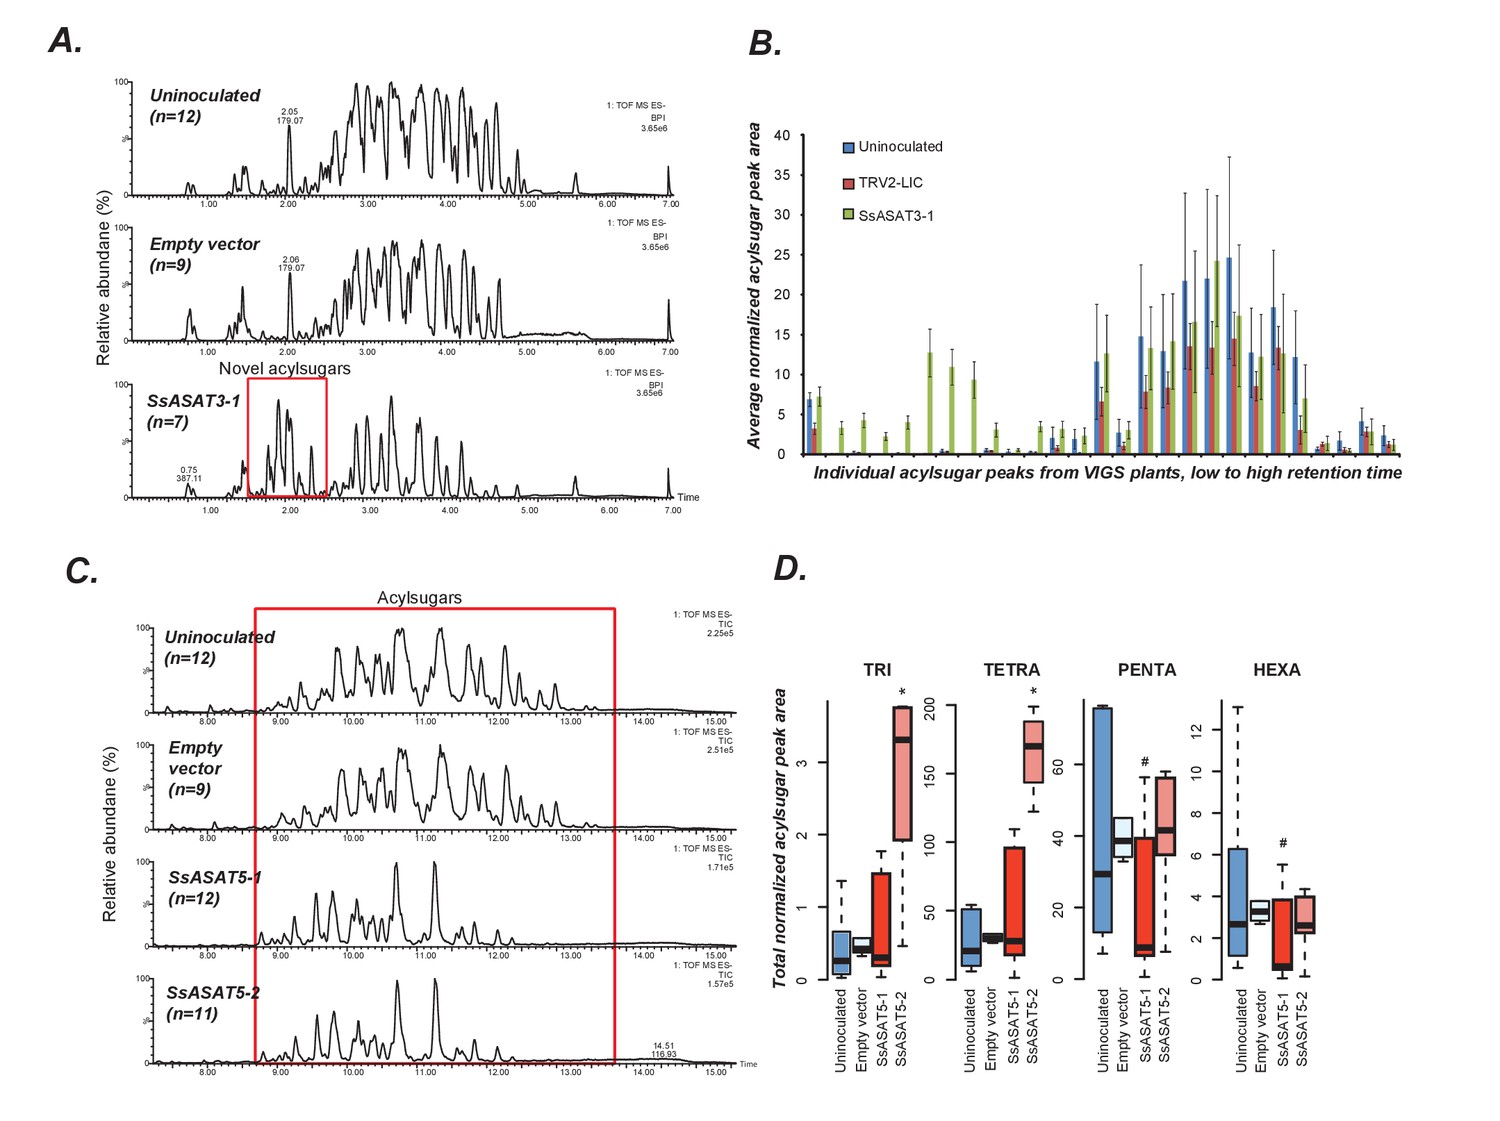
VIGS phenotypes of SsASAT3 and SsASAT5 knockdown plants.
In each sub-figure, the left hand panel shows a representative chromatographic phenotype while the right hand panel shows distributions of the aggregated peak areas of all plants of the tested genotypes. (A,B) SsASAT3 VIGS knockdown experiment using a single targeting fragment SsASAT3-1 resulted in appearance of novel acylsugar peaks whose levels are significantly higher (p<0.05, KS test) vs. control. Error bars indicate standard error. Individual acylsugar peak areas are shown in Figure 4—figure supplement 1, while positive mode fragmentation patterns of the novel acylsugars are shown in Figure 4—figure supplement 2. (C) SsASAT5-1 and SsASAT5-2 chromatograms are from individual plants with two different regions of the SsASAT5 transcripts targeted for silencing. (D) Distributions of the aggregated peak areas of all plants of the tested genotypes. The boxplots show that SsASAT5 knockdown leads to a significant (*: KS test p<0.05; #: KS test 0.05 < p < 0.1) accumulation of tri-and tetra-acylsugars, and the effect is prominent in the SsASAT5-2 construct. A graphical explanation of the SsASAT3 and SsASAT5 knockdown results is presented in Figure 4—figure supplement 3.
Figure 4—figure supplement 1
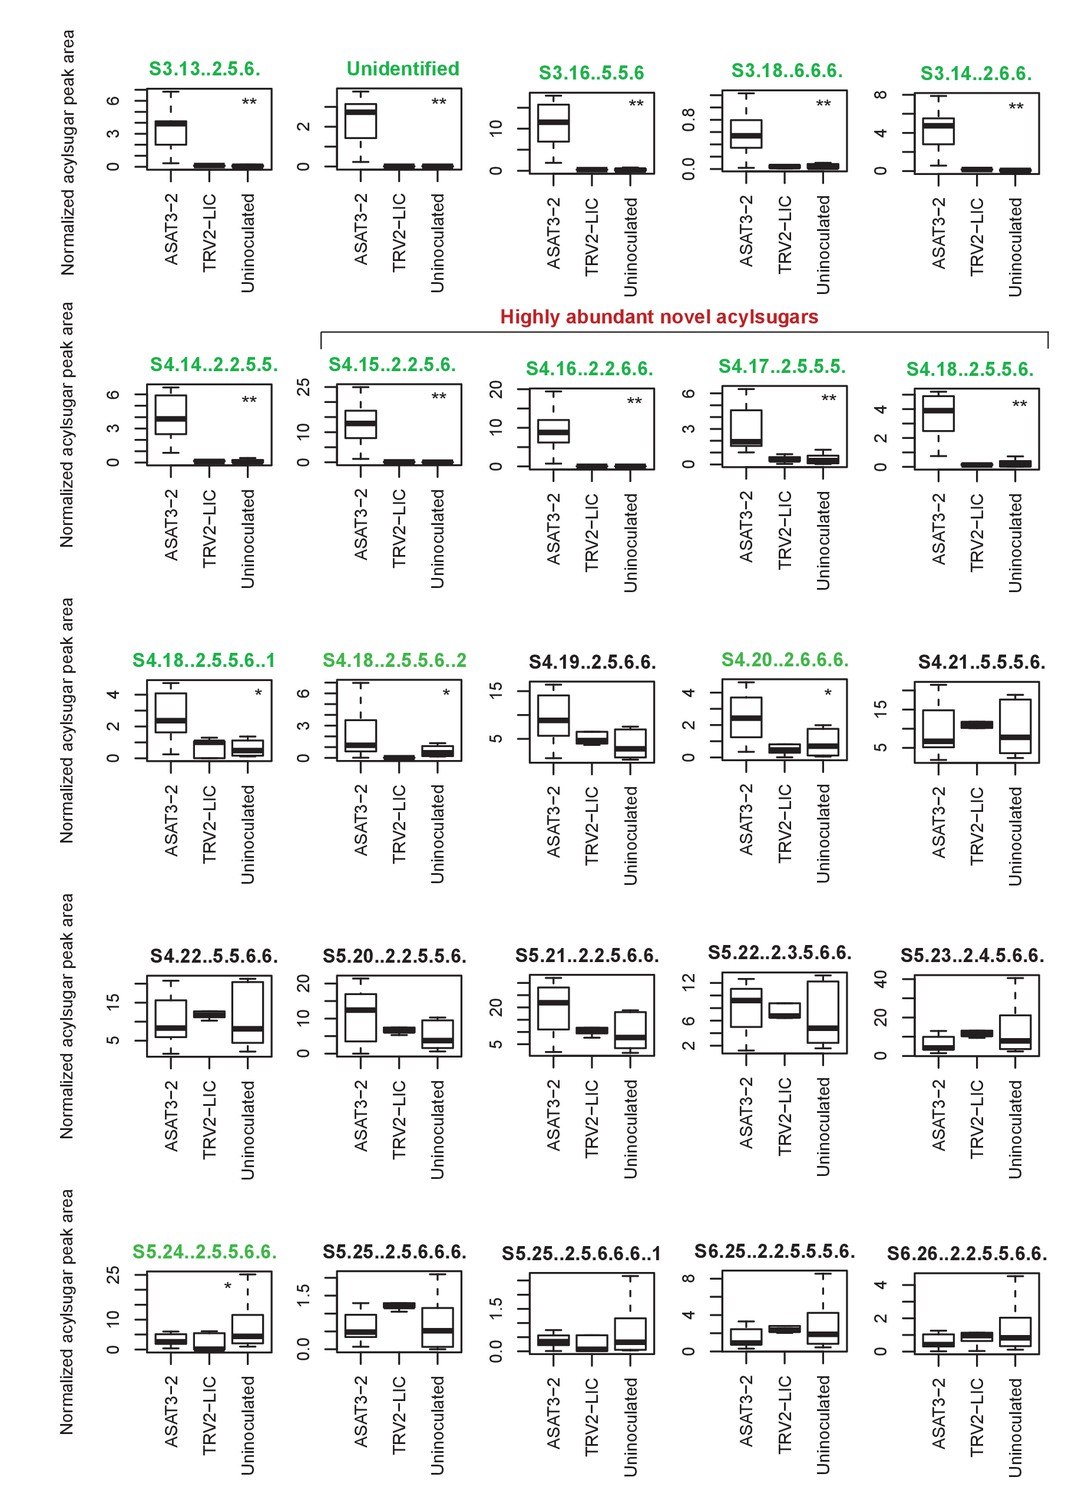
SsASAT3 knockdown boxplots for levels of individual acylsugars.
Statistical significance of the difference between TRV2-LIC and ASAT3-2 was tested using Kolmogorov-Smirnov test. ** represents p<0.01 and * represents p<0.05. Boxes where the acylsugars had significantly different levels compared to TRV2-LIC are highlighted in green. Acylsugar peak area was normalized as described in the Methods.
Figure 4—figure supplement 2
Positive mode fragmentation patterns of novel acylsugars found in SsASAT3 VIGS knockdown plants.
In (A,B,C), mass spectra obtained at elevated collision energies of three different novel acylsucrose peaks are shown. We make the assumption that fragment ions and the most abundant pseudomolecular ions appearing at the same retention time are associated. In all three cases, assuming that the original mono- and di-acylations occurred on the pyranose (P) ring, we can infer that the subsequent C2 and C5 additions giving rise to the tri- and tetra-acylated sugars occurred on the furanose (F) ring.
Figure 4—figure supplement 3
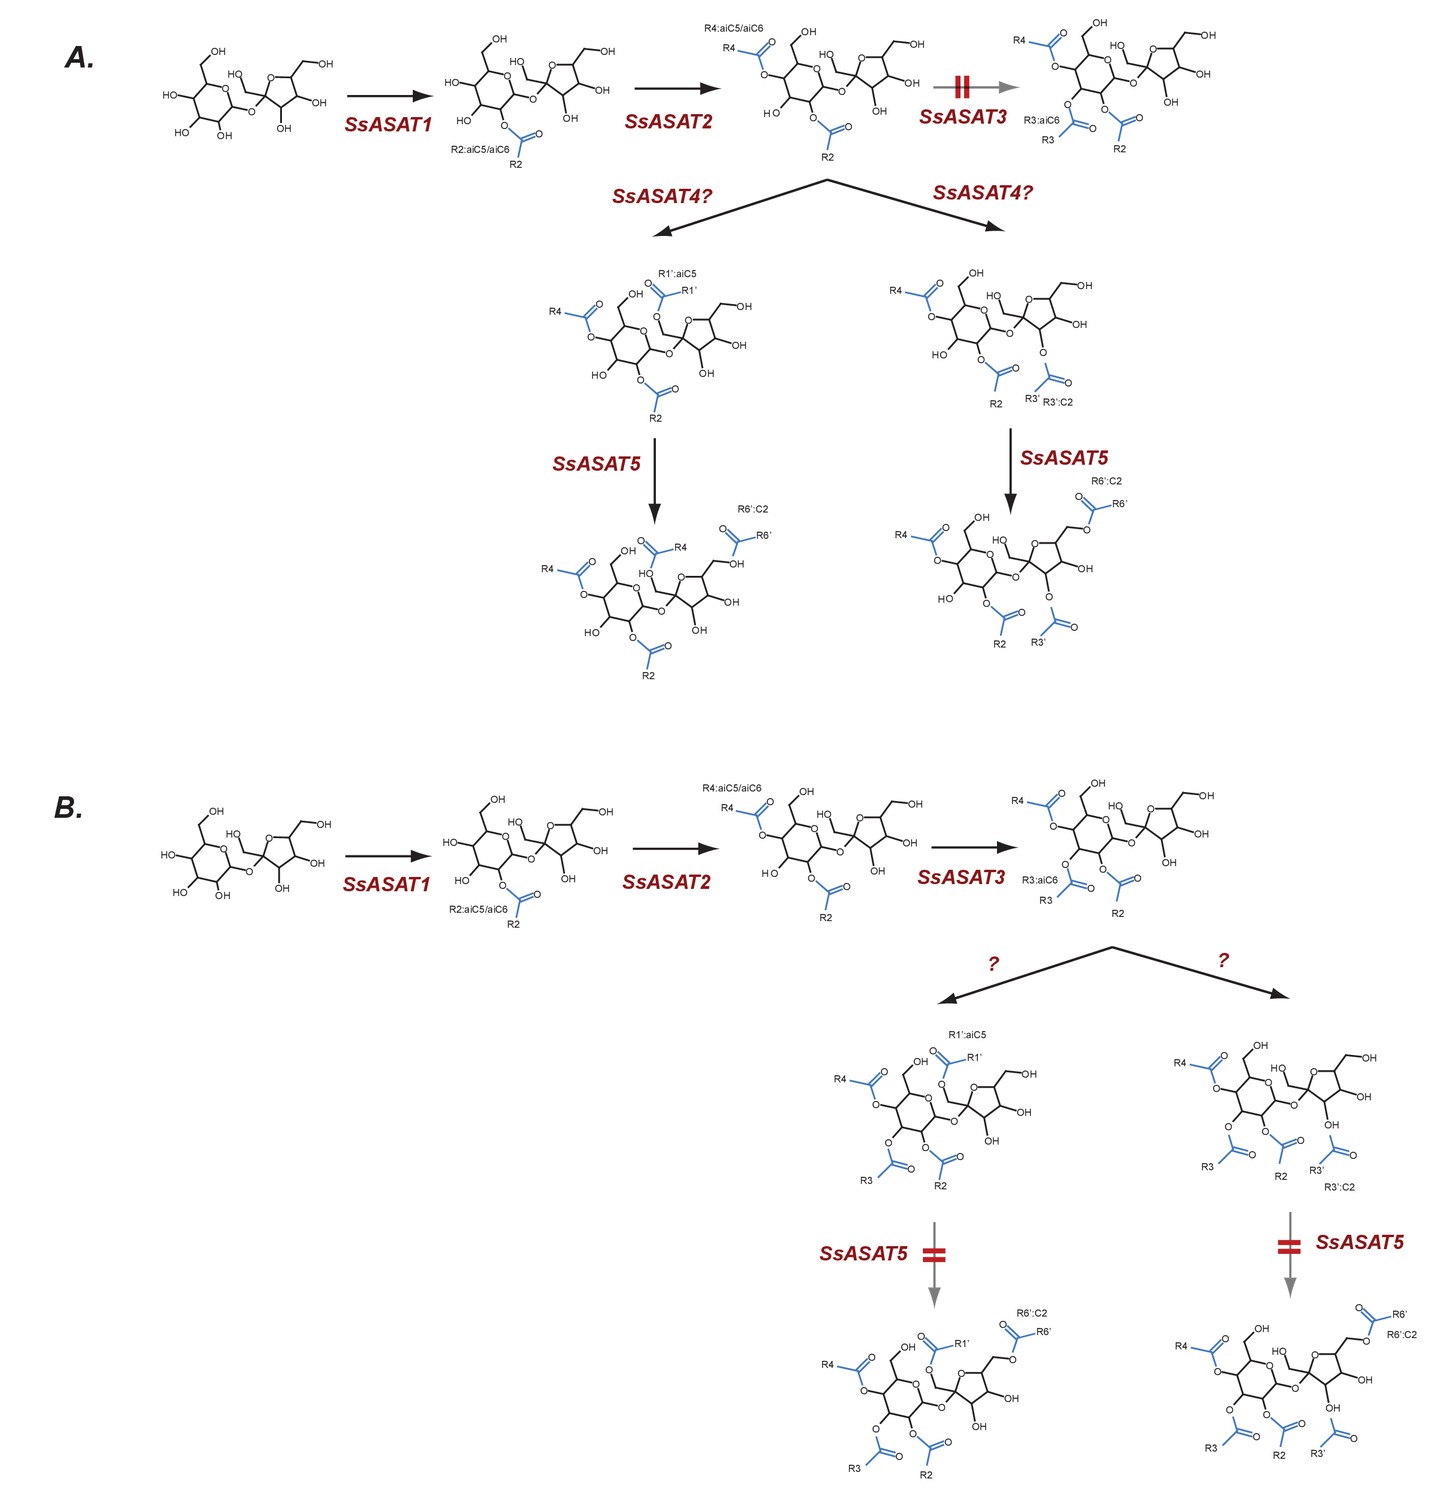
Hypothesized routes of metabolite flow in VIGS knockdown plants.
(A) SsASAT3 knockdown and (B) SsASAT5 knockdown. The perturbed pathway steps are denoted by a blurred arrow and two red lines. All acylation positions are hypothesized based on in vitro data and knowledge of the enzyme activities.
Figure 5
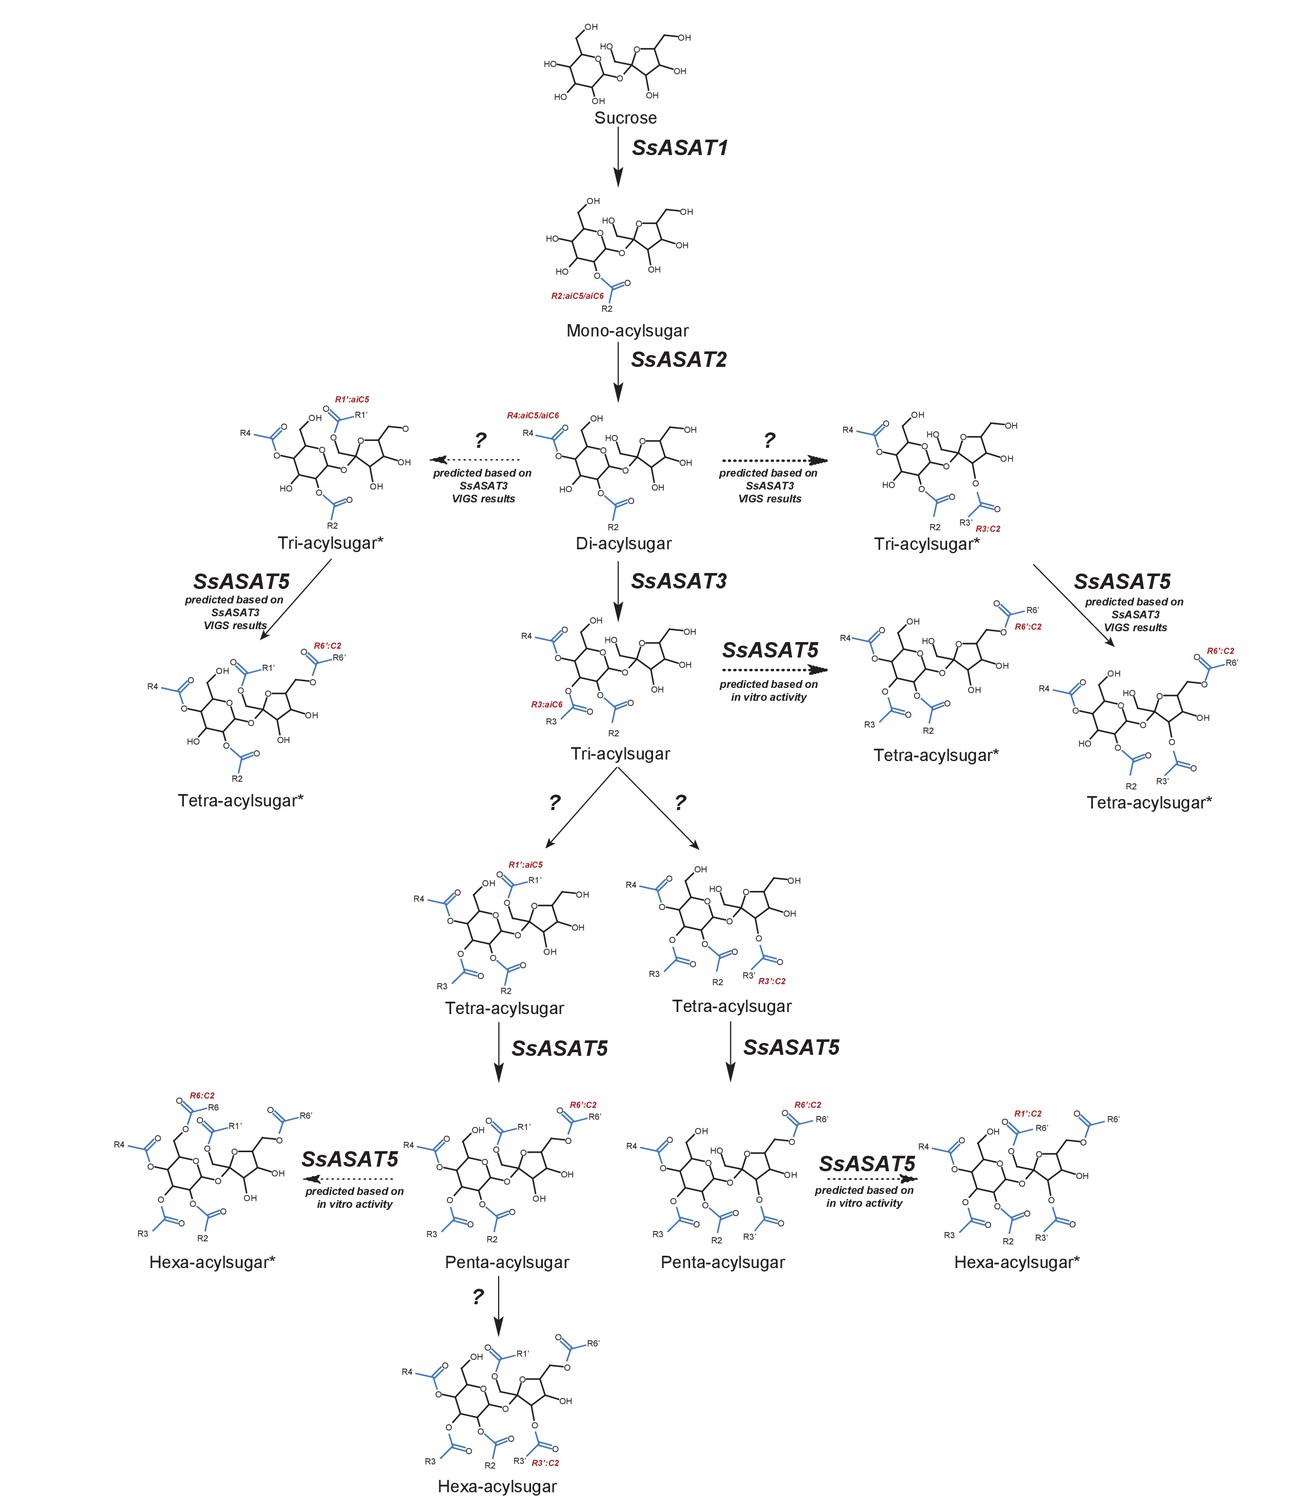
Model for the Salpiglossis acylsugar biosynthetic pathway.
The question marks indicate unidentified enzymes. The blue colored acyl chains are positioned on the sucrose molecule based on results of positive mode fragmentation characteristics, co-elution assays, and comparisons with purified acylsugars. Main activities are shown in solid arrows and potential alternate activities - where acylation positions and enzymatic activities are hypothesized based on in vitro and in vivo findings - are shown in dashed arrows. An asterisk (*) next to the acylsugar names indicates no NMR structure is available for the acylsugar in Salpiglossis or Petunia, and the acyl chain positions are postulated based on their fragmentation patterns in positive and/or negative mode, and on hypothesized enzyme activities as described in the main text.
Figure 6 with 4 supplements
The origins of acylsugar biosynthesis.
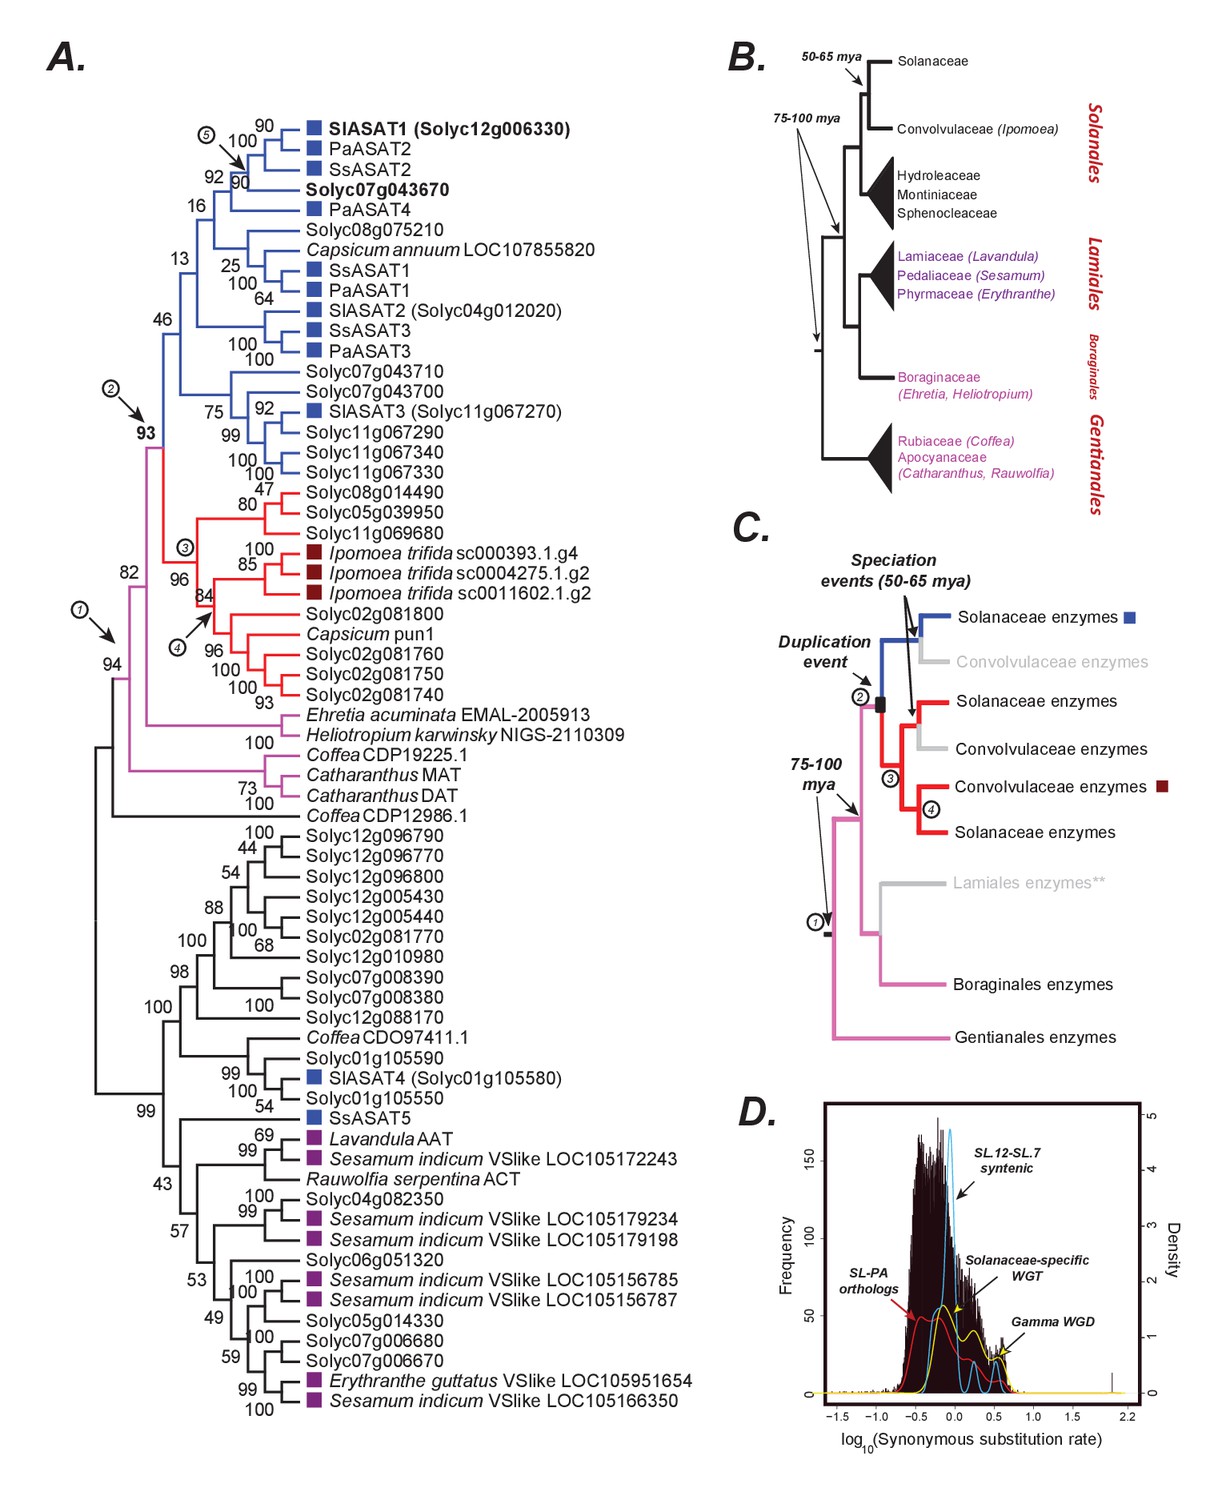
(A) Gene tree showing the characterized ASATs (blue squares) and other BAHDs in Clade III of the BAHD family of enzymes (D'Auria, 2006). Only Lamiid species are included in this tree, given significantly similar ASAT sequences were not detected elsewhere in the plant kingdom, as shown in Figure 6—figure supplement 1. The blue sub-clade is where most ASAT activities lie, while the red monophyletic sub-clade with high bootstrap support does not contain ASAT activities. Pink sub-clade includes enzymes present in outgroup species beyond Solanales. The purple squares highlight the closest homologs in the Lamiales order. Numbers in circles are used to denote important evolutionary events and track with the circled numbers used in (panel C), except for (5), which refers to the whole genome duplication event (panel D) that occurred prior to Solanaceae emergence. The robustness of this topology was also tested using additional tree reconstruction approaches showed in Figure 6—figure supplements 2 and 3. Alignment file in the MEGA mas format used for making this tree is provided in Supplementary file 5. Figure 6—source data 1 shows the results of BLAST against the 1kp database. (B) Known relationships between different families and orders included in the study, based on Refulio-Rodriguez and Olmstead (2014). The times indicated are based on a range of studies as described in the main text. (C) Reconciled evolutionary history of the blue ASAT sub-clade based on (panels A and B). Grey color indicates loss or lack of BLAST hits in the analyzed sequence datasets from that lineage. Species in this clade also do not produce acylsugars, as shown in Figure 6—figure supplement 4. ** is shown next to Lamiales to state the uncertainty in this inference given some uncertainty in the relationships between Lamiidae orders. Our inference is based on the strongly supported relationships in Refulio-Rodriguez and Olmstead (2014)(D) Synonymous substitution rate (dS) distribution of all Petunia axillaris (PA) - Solanum lycopersicum (SL) homologs. The red line plot shows the density of the histogram. The green curve shows the density of all SL-SL gene pairs in syntenic blocks. The blue curve is derived from dS of only those SL-SL gene pairs in the syntenic block encompassing SlASAT1 and Solyc07g043670, showing most gene pairs were derived using the Solanaceae-specific WGT event.
-
Figure 6—source data 1
Results of BLAST against 1kp database.
The ‘Sequences’ sheet shows the Petunia sequences used for TBLASTN against the Asterids database of 1kp (Nadakuduti et al., 2017). Other sheets show the tabular output of TBLASTN using individual ASATs as the query. The best matching non-Solanaceae sequences were used for making the phylogenetic trees shown in Figure 6 and Figure 6—figure supplement 3A.
- https://doi.org/10.7554/eLife.28468.041
Figure 6—figure supplement 1
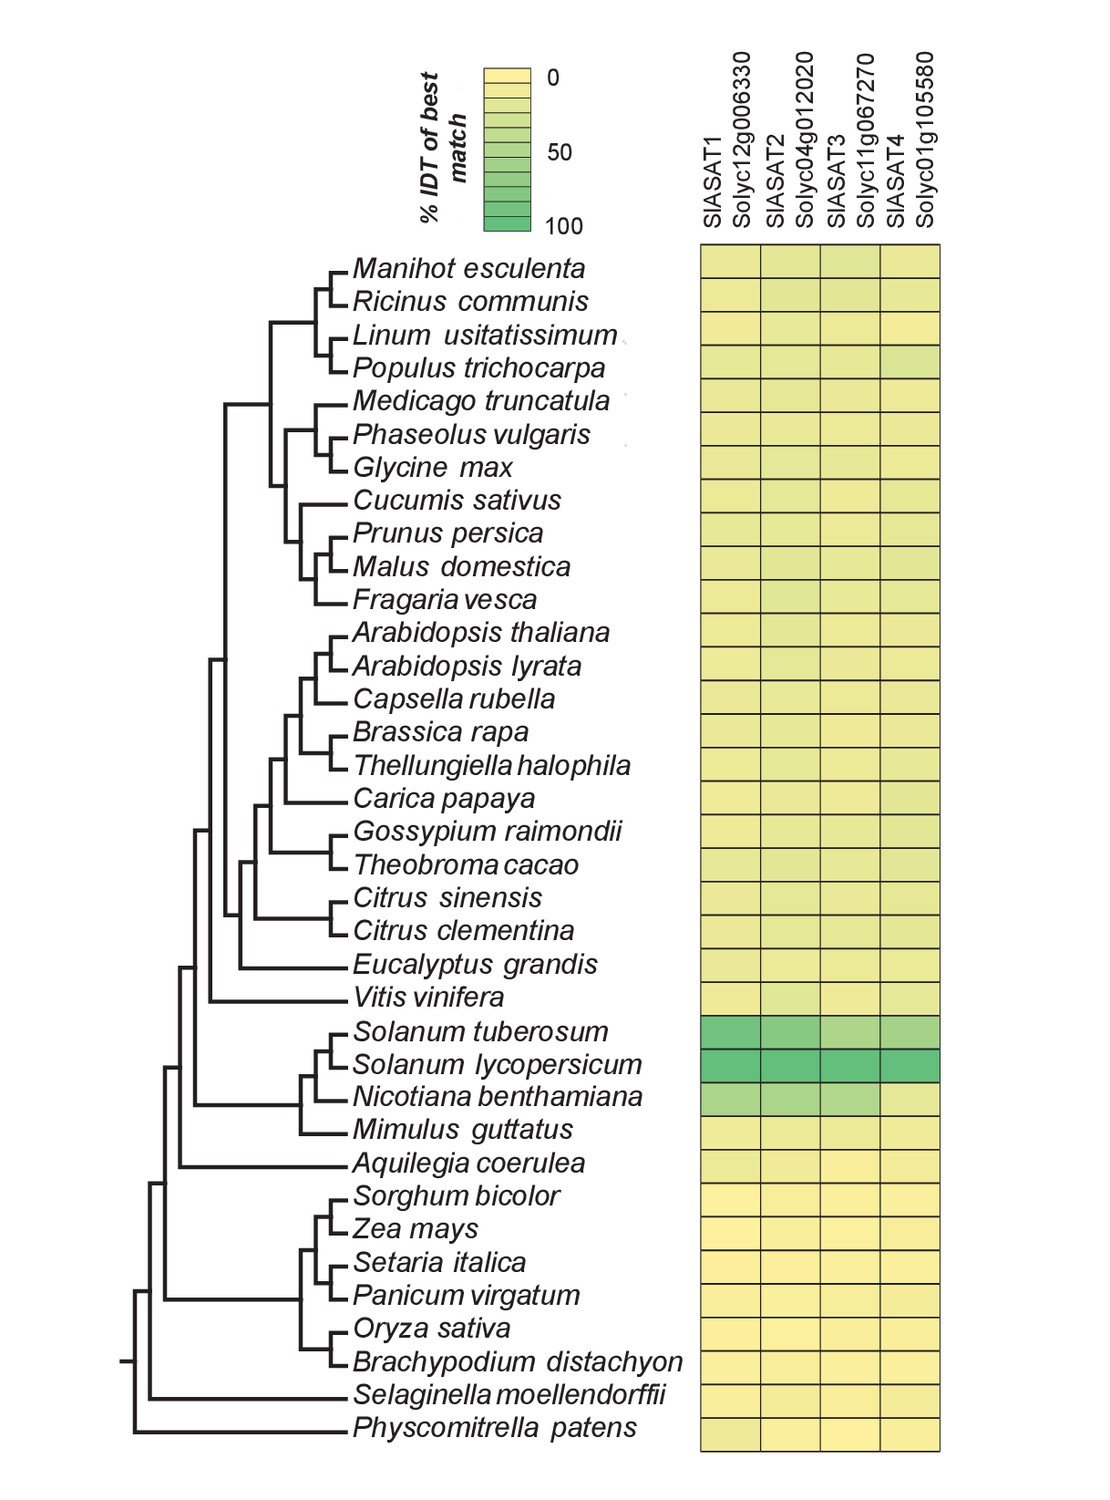
The phylogenetic context of tomato ASATs.
Results of protein BLAST (BLASTP) between SlASAT sequences and proteomes of each species in the Phytozome database. The % identity (% IDT) values for the top BLASTP hits in each species are shown.
Figure 6—figure supplement 2
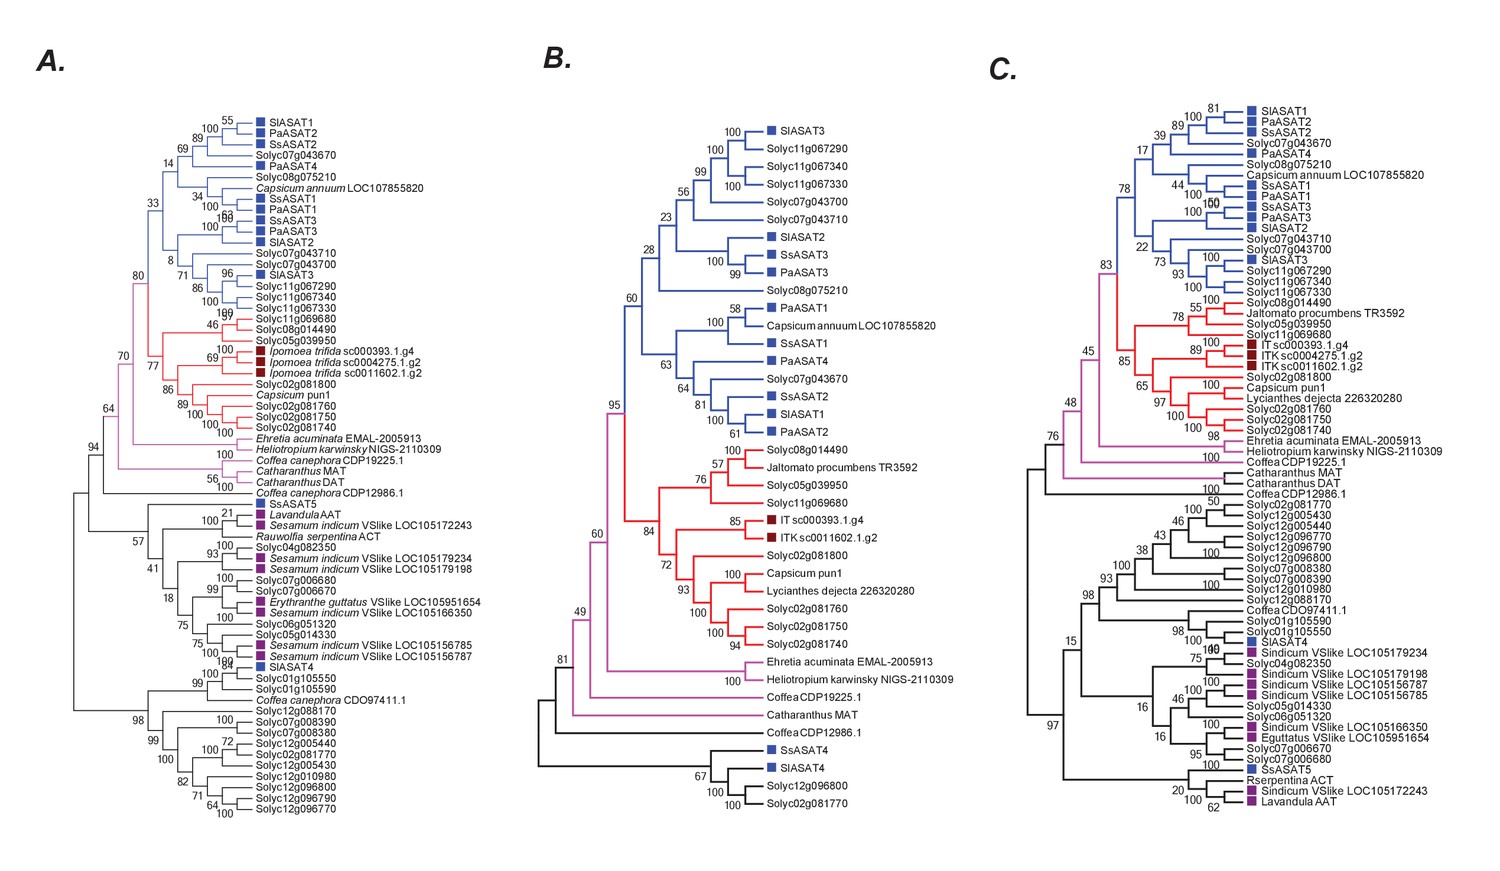
Robustness of the phylogenetic relationships.
(A) A maximum likelihood tree obtained using the best model (JTT + G + I + F with five rate categories) as per maximum likelihood based search of multiple models. Sites with <70% coverage were deleted. (B) NJ tree using mostly the sequences in the pink +blue + red clade, with 100% site coverage and JTT model (C) NJ tree of all the sequences obtained using JTT. Only sites with 100% coverage were used for this analysis. Please see Figure 6A for explanation of the various branch and label colors. Bootstrap support values are a result of 100 iterations.
Figure 6—figure supplement 3
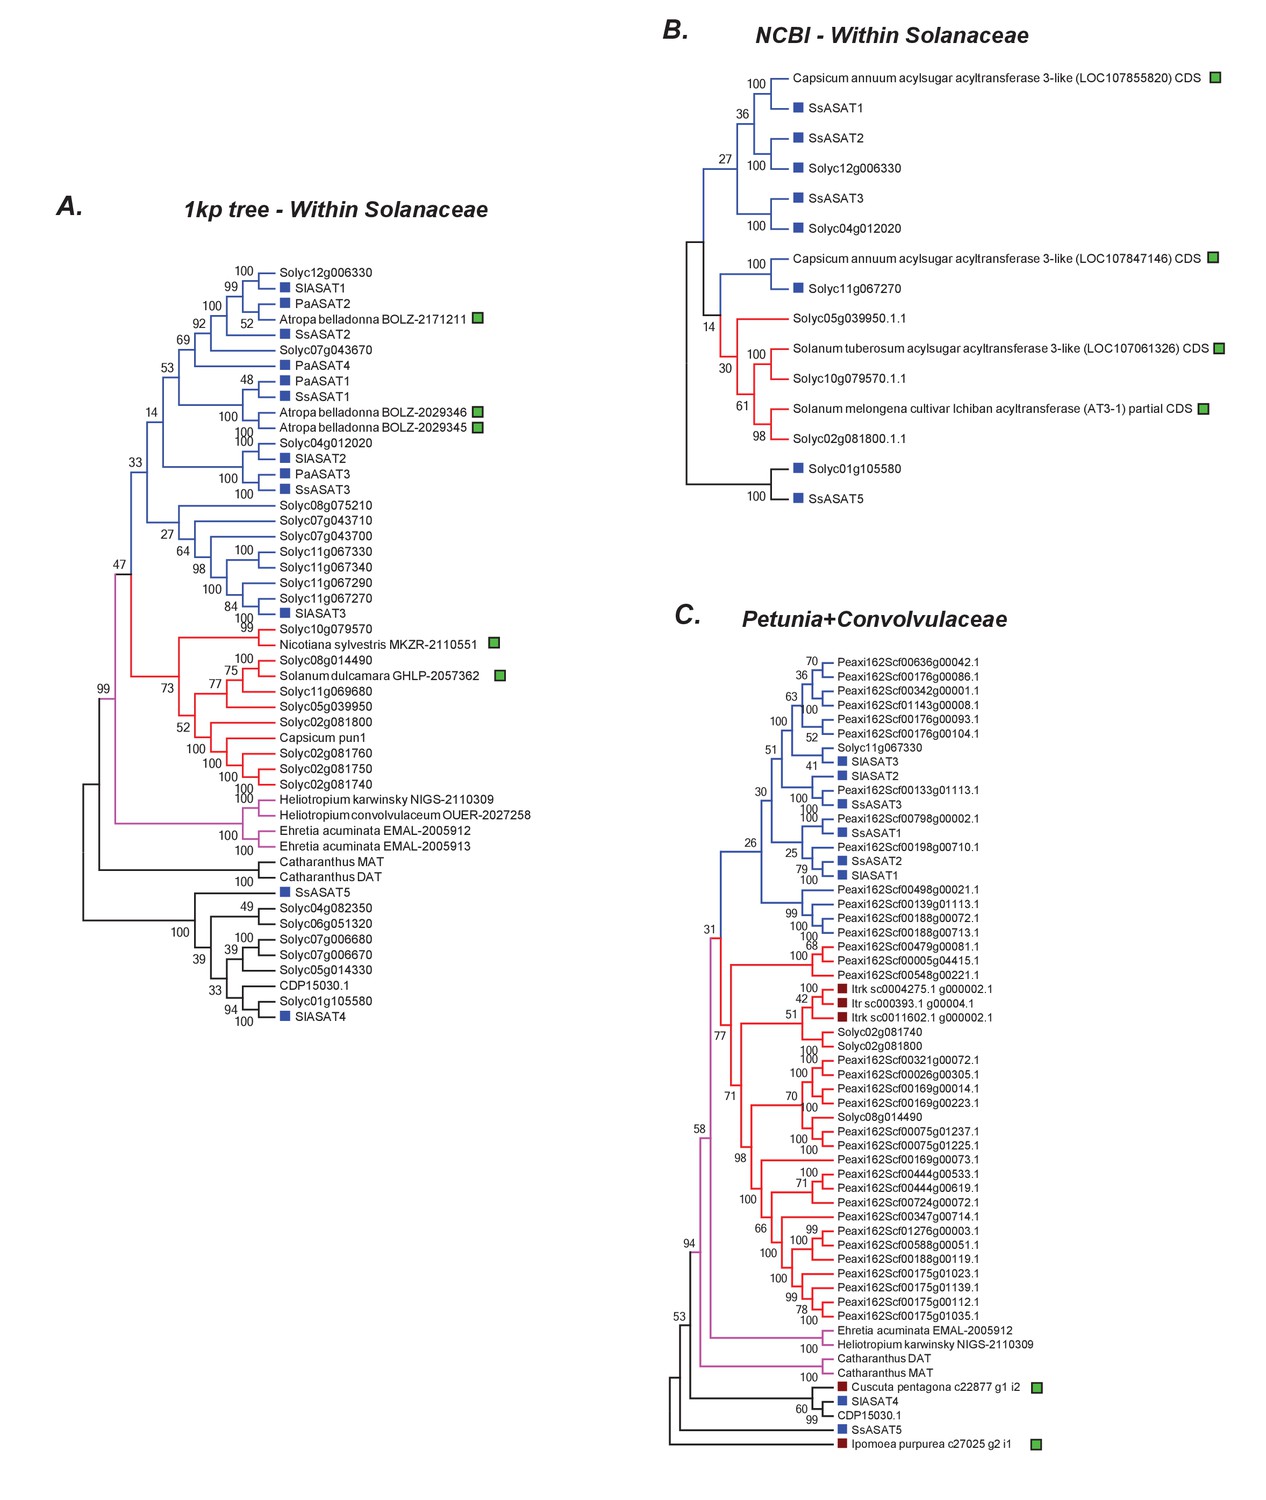
Additional related sequences do not affect our inferences regarding ASAT clade emergence.
Hits obtained using various BLAST strategies (A,B) and using Petunia Clade III BAHDs (C) are shown in a phylogenetic context with ASATs and other relevant homologs. The novel hits that were not included in the final gene tree in Figure 6 are shown by a green square. All trees were generated using NJ, using the JTT model with 100 bootstraps. All sites with <80% coverage were eliminated.
Figure 6—figure supplement 4
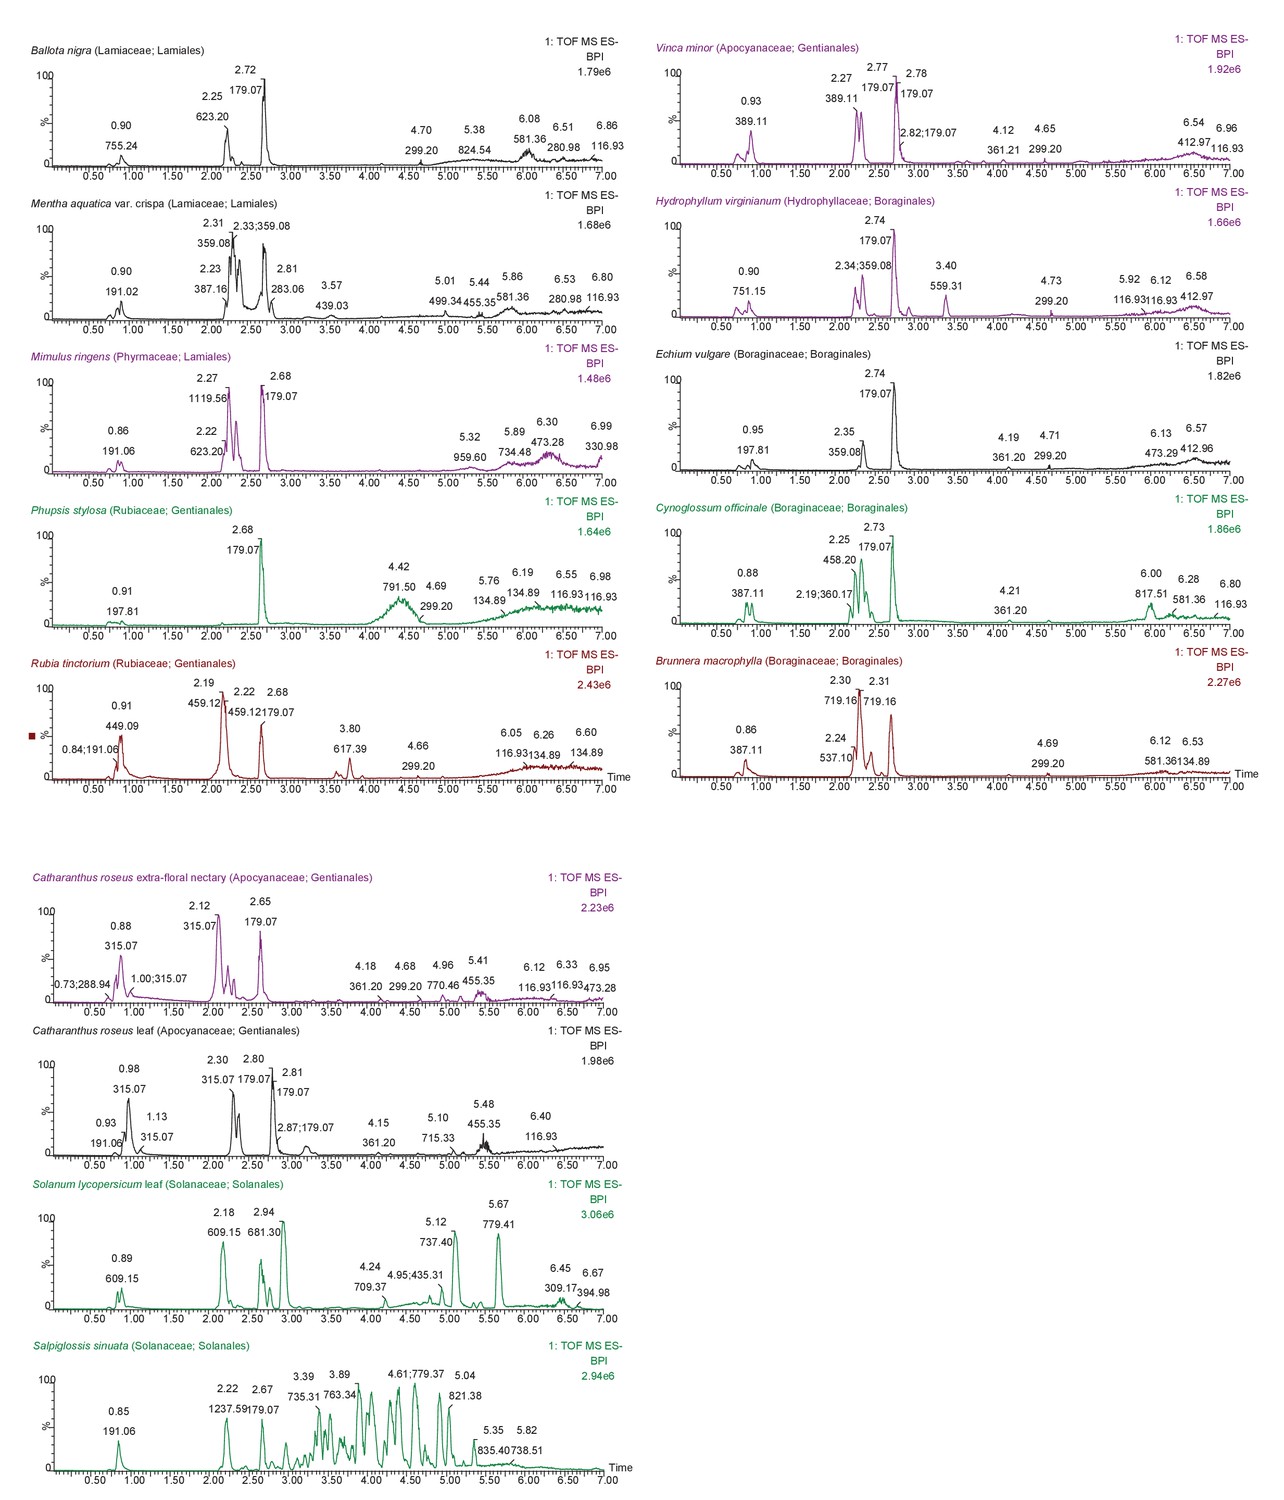
LC/MS profiles of leaf surface metabolites from 11 species from the Gentianales, Lamiales, Boraginales orders collected from the living collection at the MSU Botanical Gardens.
Positive controls S. lycopersicum M82 and Salpiglossis sinuata are also included. Samples were run on a C18 column as described in the Methods. These profiles show that peaks with m/z ratios consistent with acylsugars are found only in the Solanaceae species.
Figure 7 with 1 supplement
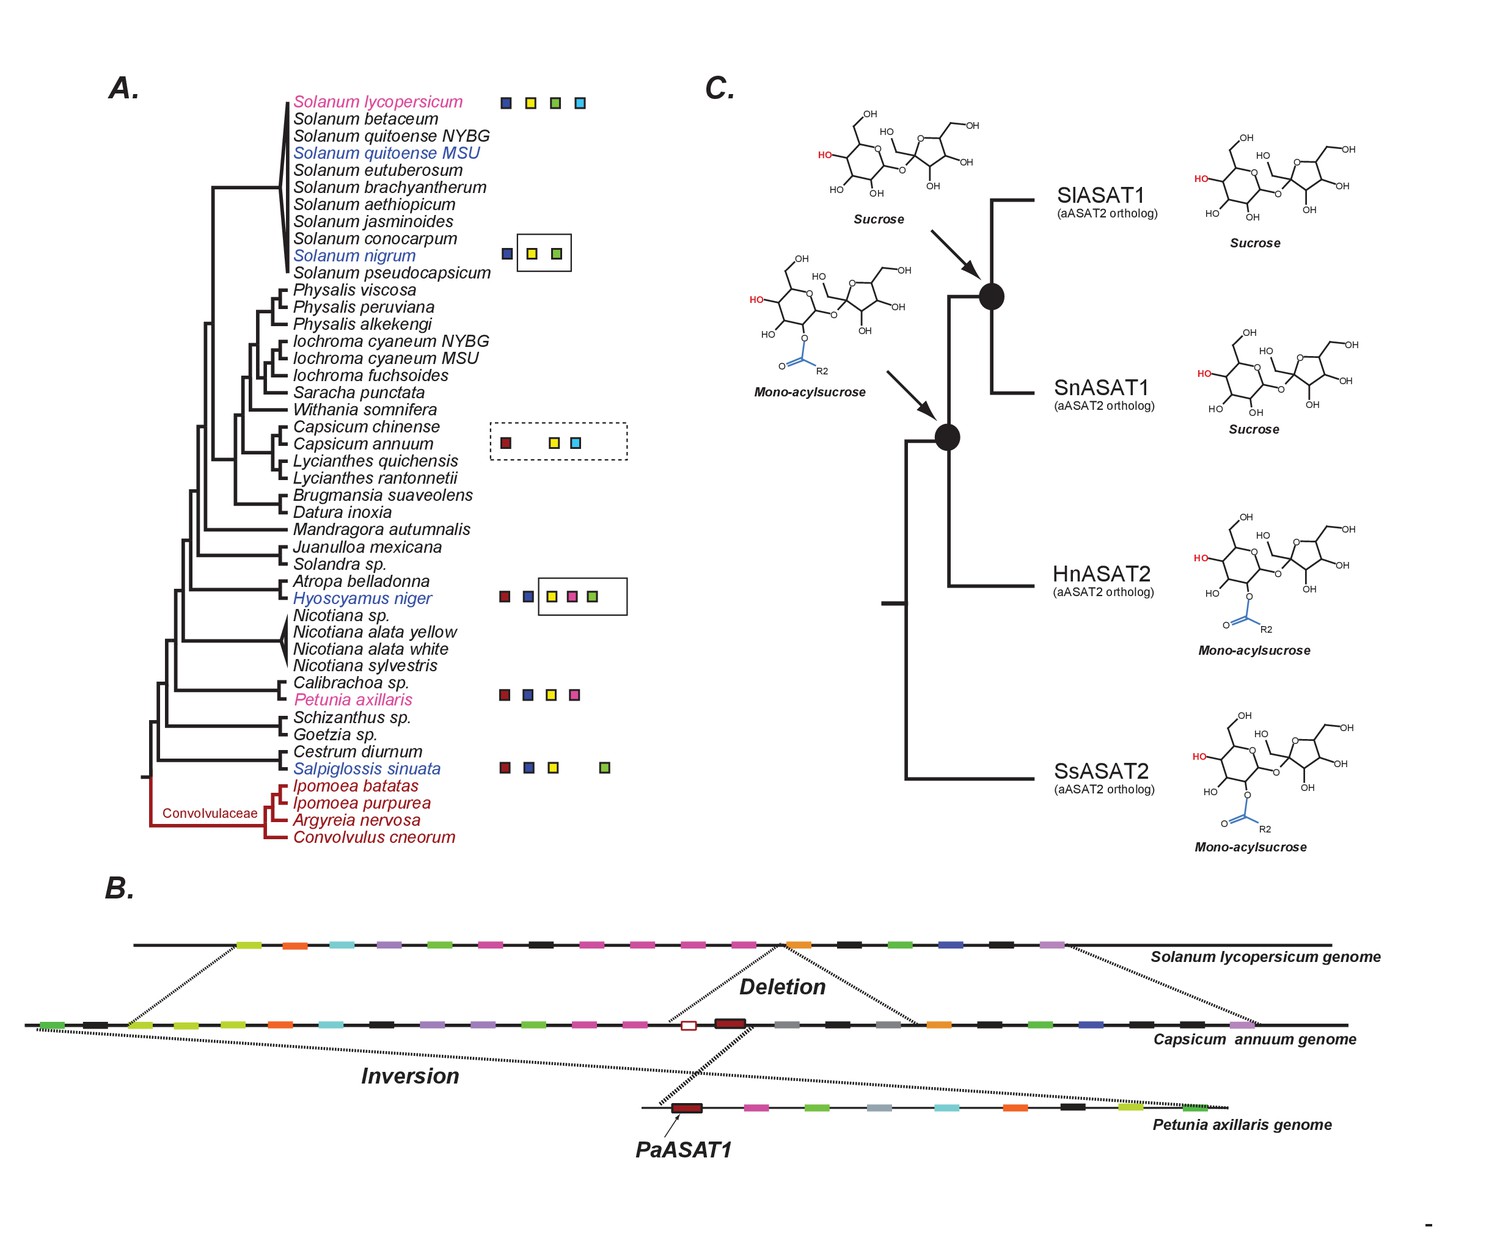
The evolution of acylsugar biosynthesis in Solanaceae.
(A) ASAT activities overlaid on the Solanaceae phylogenetic relationships. Each colored square represents a single ASAT, starting from ASAT1 and moving sequentially down the pathway to ASAT5 (left to right, sequentially). Homologs are represented by the same color. Squares not contained within a box are experimentally validated activities. A solid black box indicates that a highly identical transcript exists in the RNA-seq dataset and is trichome-high. A dashed box indicates that, based on a BLAST search, the sequence exists in the genome for the contained enzymes. In vitro validated S. nigrum and H. niger activities, including their phylogenetic positions, are highlighted in pink and Convolvulaceae species are in red. See Figure 7—source data 1 for results of the BLAST analysis. (B) Orthologous genomic regions between three species harboring aASAT1 orthologs. Each gene in the region is shown by a colored block. Orthologous genes are represented by the same color. The PaASAT1 gene (red box) has two homologous sequences in the Capsicum syntenic region, but one of them is truncated. aASAT1 ortholog is not seen in the syntenic region in tomato. Genes used to make this figure are described in Figure 7—source data 2. (C) Substrate utilization of aASAT2 orthologs from multiple species is described based on the activities presented in Figure 7—figure supplement 1. Hyoscyamus niger (Hn), Salpiglossis sinuata (Ss), Solanum nigrum (Sn), Solanum lycopersicum (Sl). The hydroxyl group highlighted in red shows the predicted position of acylation by the respective aASAT2 ortholog.
-
Figure 7—source data 1
Results of BLAST searches performed using ASAT sequences as queries and multiple databases as subjects.
BLASTP or TBLASTN was performed, and only the top hit of a query is shown. Results were used to infer Figure 7A.
- https://doi.org/10.7554/eLife.28468.044
-
Figure 7—source data 2
Syntenic blocks between pairs of species identified by MCScanX.
Grey and red colors indicate non-tandem and tandem-duplicated genes, respectively, as identified by MCScanX. Comparisons between tomato and Solanum phureja are based on results of a manual analysis performed using the GBrowse utility on the SpudDB database.
- https://doi.org/10.7554/eLife.28468.045
Figure 7—figure supplement 1
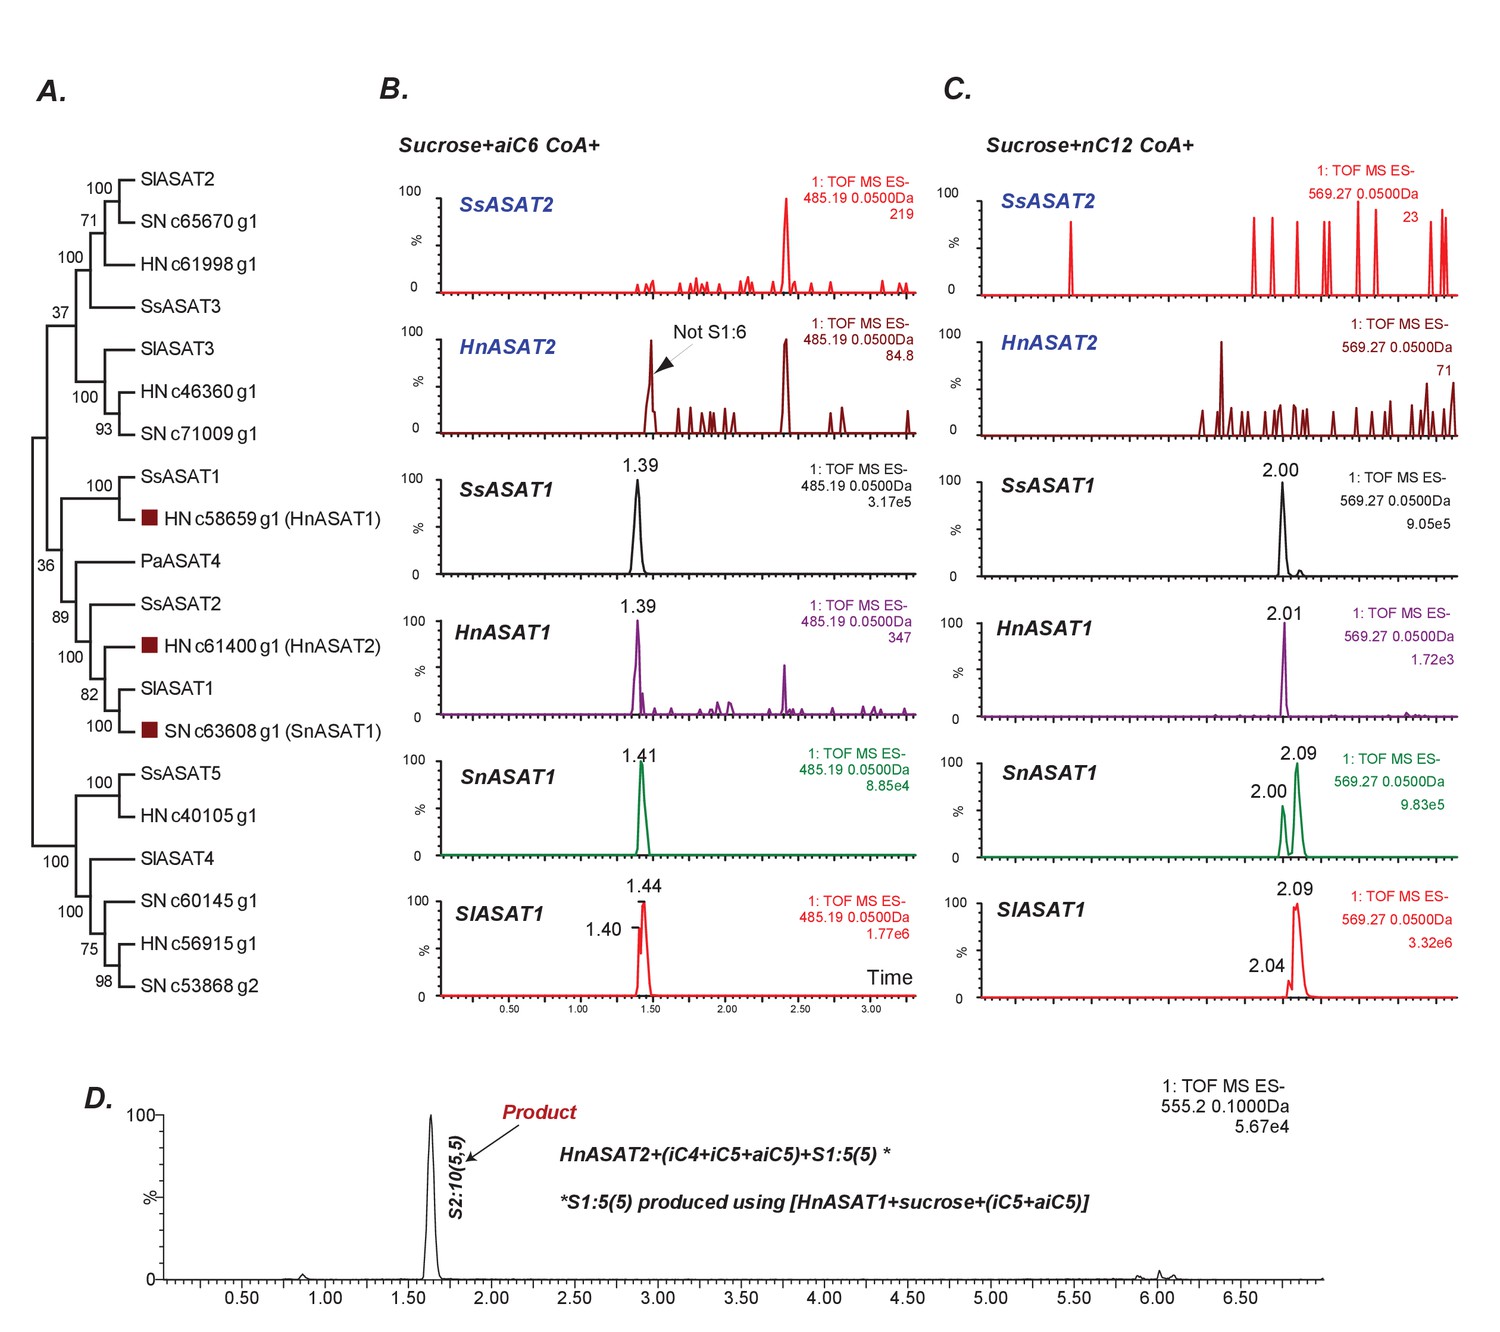
Some aASAT2 orthologs cannot catalyze sucrose to mono-acylsucrose conversion.
(A) Neighbor-joining tree made using Salpiglossis and tomato ASATs and their best hits in S. nigrum (Sn) and H. niger (Hn) transcriptome database. Tree was made using default parameters in MEGA6 for alignment and phylogeny, and identifies putative aASAT2 orthologs in Sn and Hn. (B–D) LC/MS extracted ion chromatograms for S1:6(6) [B], S1:12(12) [C] and S2:10(5,5) [D]. All reactions were run on a C18 LC column. Results show that Hn, Ss, Sn and SlASAT1s can catalyze sucrose to mono-acylsucrose conversion using aiC6 and nC12 CoA. However, aASAT2 orthologs in Hn and Ss are not able to catalyze this reaction. (D) HnASAT2 is able to catalyze di-acylsucrose formation using the HnASAT1 product.
Figure 8
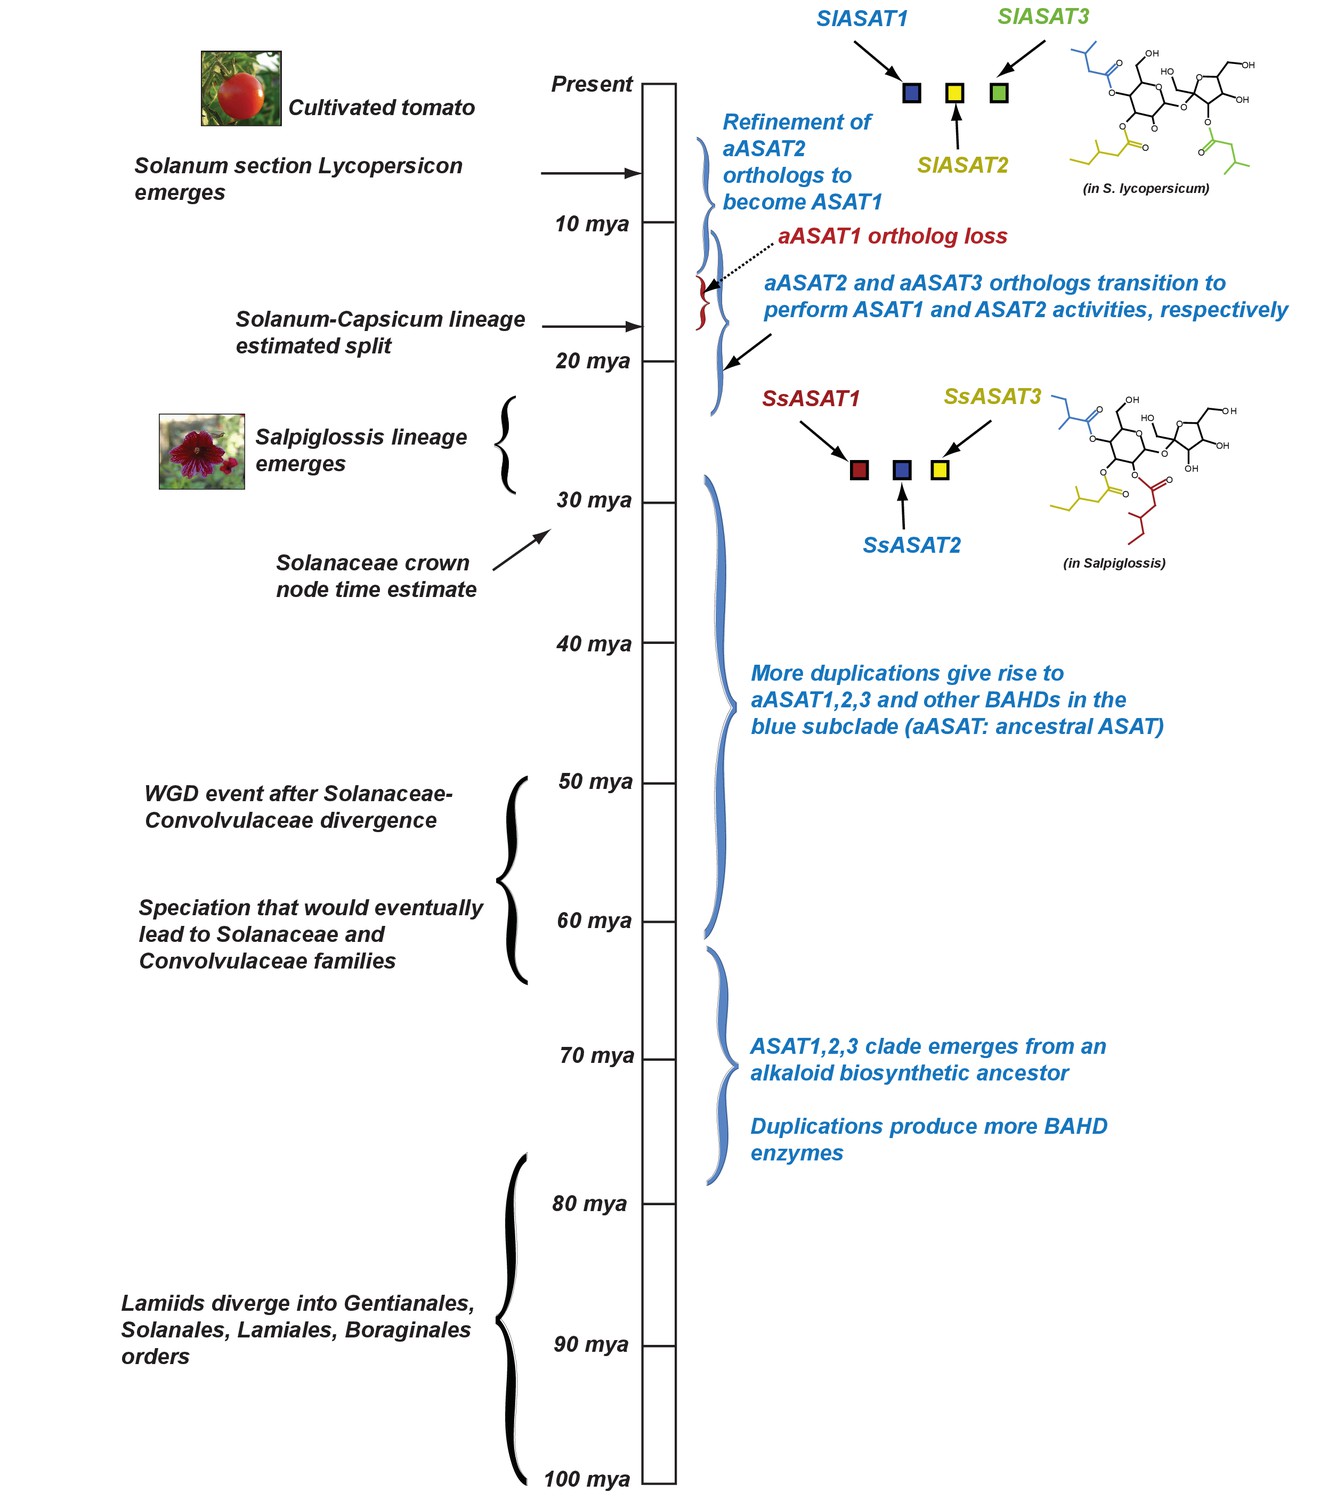
Proposed model for evolution of acylsugar biosynthesis over 100 million years.
Events in plant evolution are noted on the left and the acylsugar biosynthetic pathway developments are noted on the right of the timeline. Tri-acylsugars produced by Salpiglossis and tomato ASAT1,2,3 enzymes are shown with the chain color corresponding to the color of the enzyme that adds the chain. Images obtained from Wikimedia Commons under Creative Commons CC BY-SA 3.0 license. We note that both Salpiglossis and Tomato ASAT activities exist in the current time, and Salpiglossis is not ‘ancestral’. We use the word ‘lineages’ (eg: Salpiglossis lineage) to refer to the branch leading up to the currently existing (extant) species.
Tables
Table 1
RNA-seq data statistics
https://doi.org/10.7554/eLife.28468.015| Item | S. nigrum | S. quitoense | H. niger | S. sinuata |
|---|---|---|---|---|
| Original read pairs | 81,314,841 | 85,374,110 | 86,161,659 | 80,302,734 |
| Filtered read pairs (% original) | 73346531 (90.2%) | 76734781 (89.9%) | 76819022 (89.2%) | 71129160 (88.6%) |
| Normalized read pairs (% normalized) | 17301238 (23.6%) | 15350023 (20.0%) | 20779972 (27.1%) | 17905057 (25.2%) |
| Total transcript isoforms | 160,583 | 124,958 | 189,711 | 149,136 |
| Longest isoforms (% total) | 78,020 (49%) | 72,426 (58%) | 96,379 (51%) | 77,970 (52.3%) |
| With > 10 reads | 32,105 | 32,044 | 38,252 | 32,798 |
| With predicted peptide > 50aa | 23,224 | 22,289 | 26,262 | 23,570 |
| Differentially expressed*,† (%>10 reads) | 10,386 (32%) | 12,194 (38%) | 9007 (24%) | 7091 (22%) |
| Trichome high† (% differentially expressed) | 2292 (22.1%) | 3547 (29.1%) | 3321 (36.8%) | 1888 (26.6%) |
-
* Differentially expressed genes at p<0.05 (corrected for multiple testing); 2 p<0.05, fold change >2
† Some differentially expressed transcripts were confirmed by RT-PCR, as shown in Figure 2—figure supplement 3.
Additional files
-
Supplementary file 1
GO categories enriched among trichome-high genes in different Solanaceae species.
The enrichment columns show whether the GO is enriched in trichome high transcripts in this species, based on Fisher Exact Test 1: yes, 0: no. In the ‘# of genes’ column, 0 = GO category not enriched among trichome high genes in this species.
- https://doi.org/10.7554/eLife.28468.047
-
Supplementary file 2
Sequences identified in this study.
The transcript identifier as per the assembler Trinity nomenclature is noted in the part after the bar (|). Green and yellow highlighted sequences are the two regions targeted for VIGS in Salpiglossis.
- https://doi.org/10.7554/eLife.28468.048
-
Supplementary file 3
Primer sequences used in this study.
- https://doi.org/10.7554/eLife.28468.049
-
Supplementary file 4
Experimental conditions for VIGS experiments.
- https://doi.org/10.7554/eLife.28468.050
-
Supplementary file 5
MEGA6 aligned file in the *.
mas format. These sequences were used to make Figure 6A.
- https://doi.org/10.7554/eLife.28468.051
Download links
A two-part list of links to download the article, or parts of the article, in various formats.
Downloads (link to download the article as PDF)
Open citations (links to open the citations from this article in various online reference manager services)
Cite this article (links to download the citations from this article in formats compatible with various reference manager tools)
Evolutionary routes to biochemical innovation revealed by integrative analysis of a plant-defense related specialized metabolic pathway
eLife 6:e28468.
https://doi.org/10.7554/eLife.28468


