The AAA protein Msp1 mediates clearance of excess tail-anchored proteins from the peroxisomal membrane
- Harvard University, United States
Figures
Figure 1 with 2 supplements
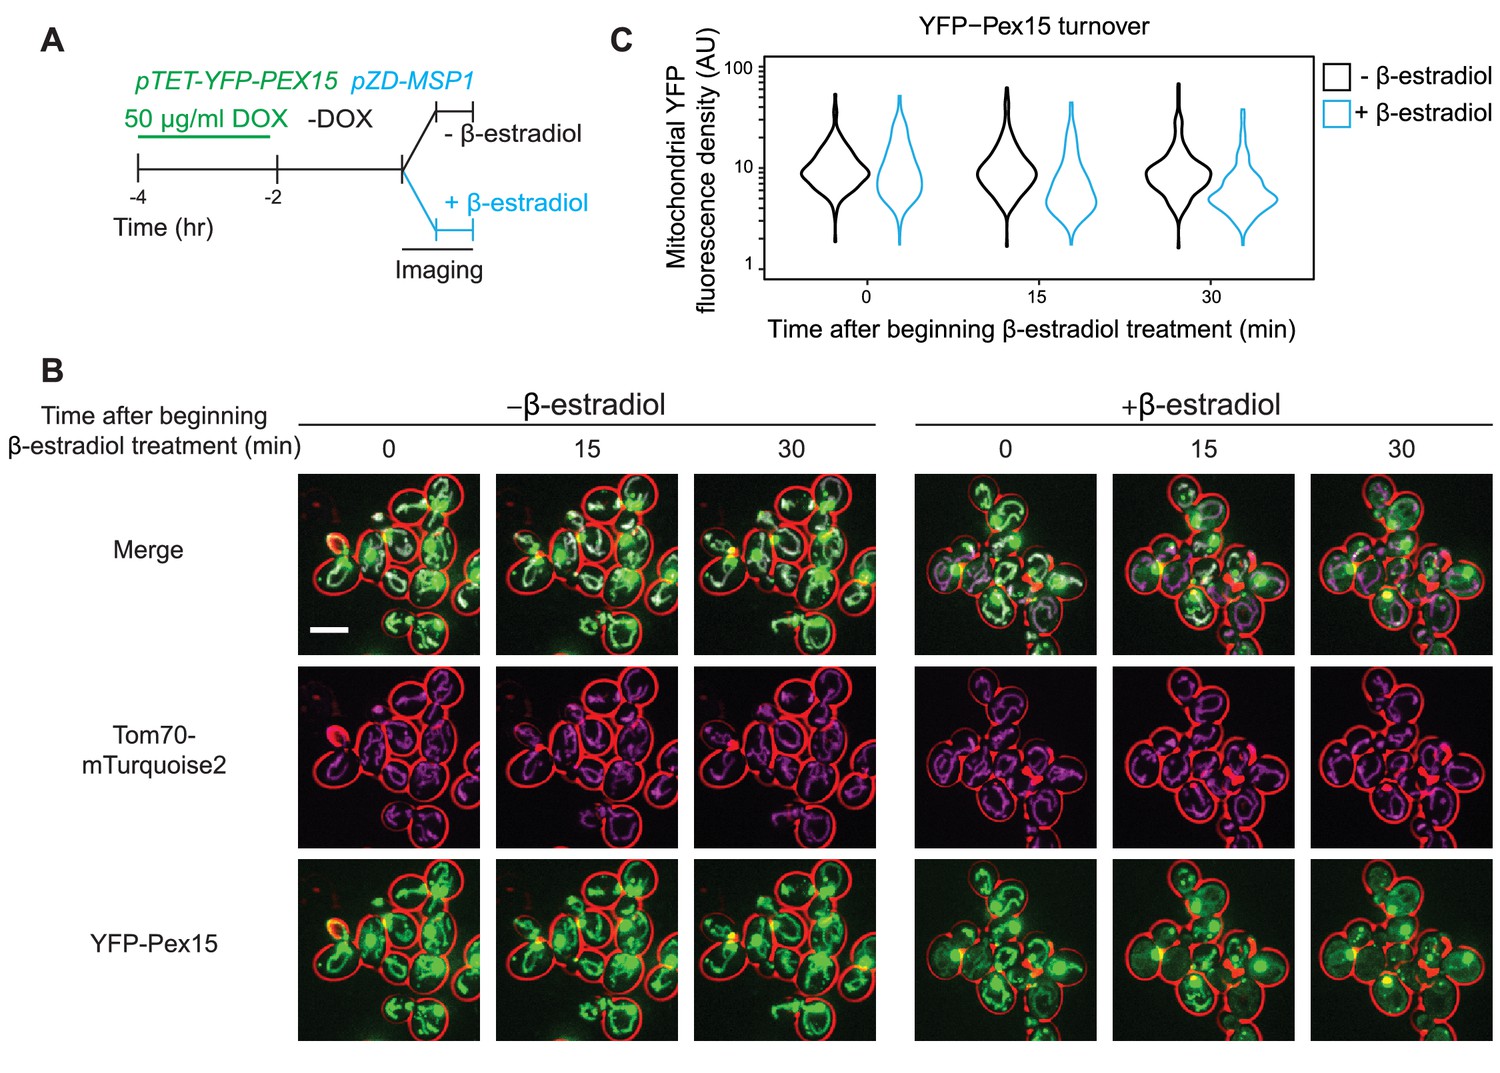
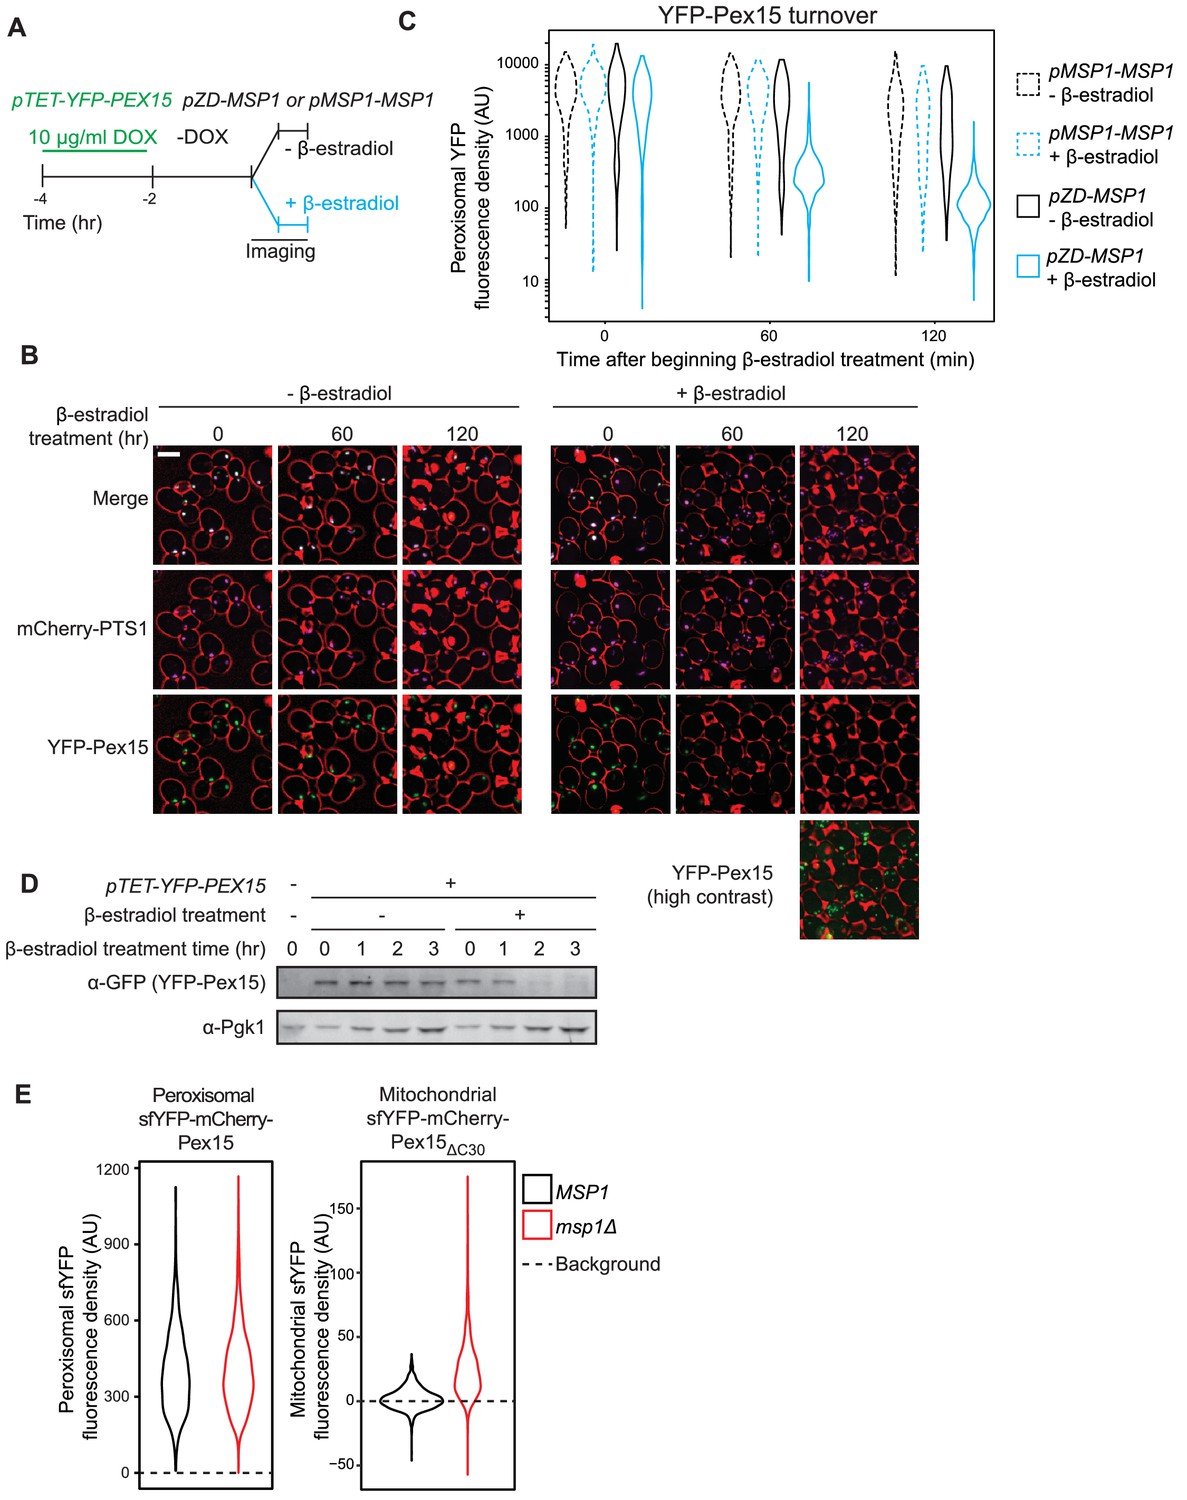
Pulse-chase analysis of mitochondrial Pex15 turnover by Msp1.
(A) Cells containing the doxycycline-inducible promoter driving YFP-Pex15 expression and the β-estradiol-inducible promoter driving Msp1 expression were grown for 2 hr in the presence of 50 µg/ml doxycycline (DOX) before they were washed and grown for 2 hr in drug-free media. PEX15 mRNAs have a half-life of ~31 min (Geisberg et al., 2014), arguing that approximately 7.3% of PEX15 mRNAs remained when imaging began. This calculation likely overestimates the persistence of PEX15 mRNA on a per cell basis because it doesn’t account for PEX15 mRNA dilution due to cell division. Following this period of substrate pre-loading, half of the cells were exposed to 1 µM β-estradiol while the other half received vehicle, followed by time-lapse imaging of both cell populations using a spinning disk confocal microscope. This experiment was performed twice with similar results. (B) Representative confocal micrographs from the experiment described in part A. Each image represents a maximum intensity projection of a Z-stack. Red cell outlines originate from a single bright-field image acquired at the center of the Z-stack. Scale bar, 5 μm. (C) Quantitation of mitochondrial YFP-Pex15 fluorescence from the experiment described in part A. YFP-Pex15 fluorescence density corresponds to the total YFP-Pex15 signal at each computationally-defined mitochondrion (marked by Tom70-mTurquoise2) divided by the mitochondrial pixel volume (see Materials and methods and Figure 1—figure supplement 2 for more details). Shown are violin plots of the resulting YFP-Pex15 density distributions. These data represent analysis of 123 mock-treated and 93 β-estradiol-treated cells followed throughout the time course as well as progeny from cell divisions during the experiment.
Figure 1—figure supplement 1
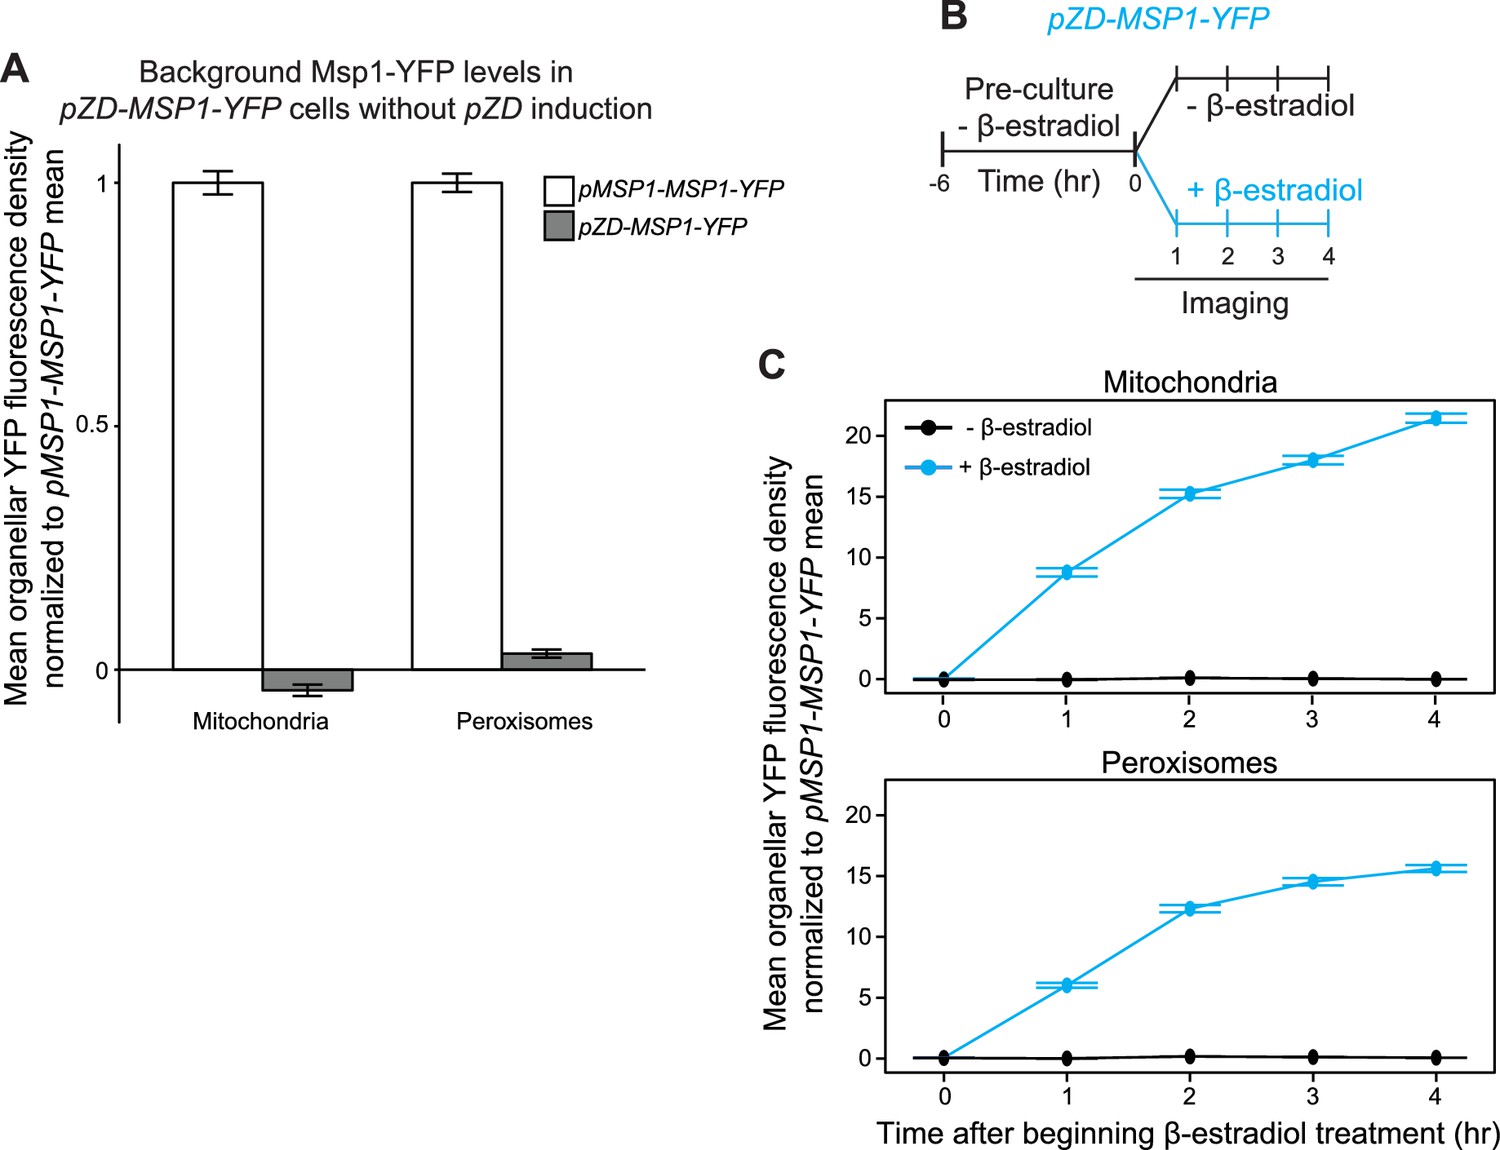
Supporting evidence for Msp1 turnover of YFP-Pex15 at mitochondria.
(A) Quantitation of Msp1-YFP levels at mitochondria and peroxisomes in pMSP1-MSP1-YFP and un-induced pZD-MSP1-YFP cells. Msp1-YFP fluorescence density corresponds to the total Msp1-YFP signal at each computationally-defined mitochondrion marked by Tom70-mTurquoise2 (left) or peroxisome marked by mCherry-PTS1 (right) divided by the organelle’s pixel volume (see Materials and methods and Figure 1—figure supplement 2 for details). Shown are the mean fluorescence densities for each sample normalized to the pMSP1-driven Msp1-YFP mean fluorescence density at the same organelle. 0 is defined for each organelle as the mean YFP fluorescence density in untagged MSP1 cells. Error bars represent standard error of the population mean. The pZD-MSP1-YFP data here are reproduced as the –β-estradiol 0 hr timepoint in part C. (B) Experimental timeline of the staged expression experiment for monitoring Msp1-YFP levels following pZD induction. Cells expressing Msp1-YFP from the ZD promoter at the native locus (the Z4EV expression cassette was integrated upstream of the ZD promoter) were pre-cultured before half of the cells were exposed to 1 µM β-estradiol while the other half received vehicle, followed by time-lapse imaging of both cell populations using a spinning disk confocal microscope. (C) Quantitation of mitochondrial (top) and peroxisomal (bottom) Msp1-YFP fluorescence density from the experiment described in part B. Msp1-YFP fluorescence density corresponds to the total Msp1-YFP signal at each computationally-defined mitochondrion marked by Tom70-mTurquoise2 (top) or peroxisome marked by mCherry-PTS1 (bottom) divided by the organelle’s pixel volume (see Materials and methods and Figure 1—figure supplement 2 for more details). Shown are the mean fluorescence densities for each sample normalized to the MSP1 promoter-driven Msp1-YFP mean at the same organelle. Error bars represent standard error of the population mean.
Figure 1—figure supplement 2
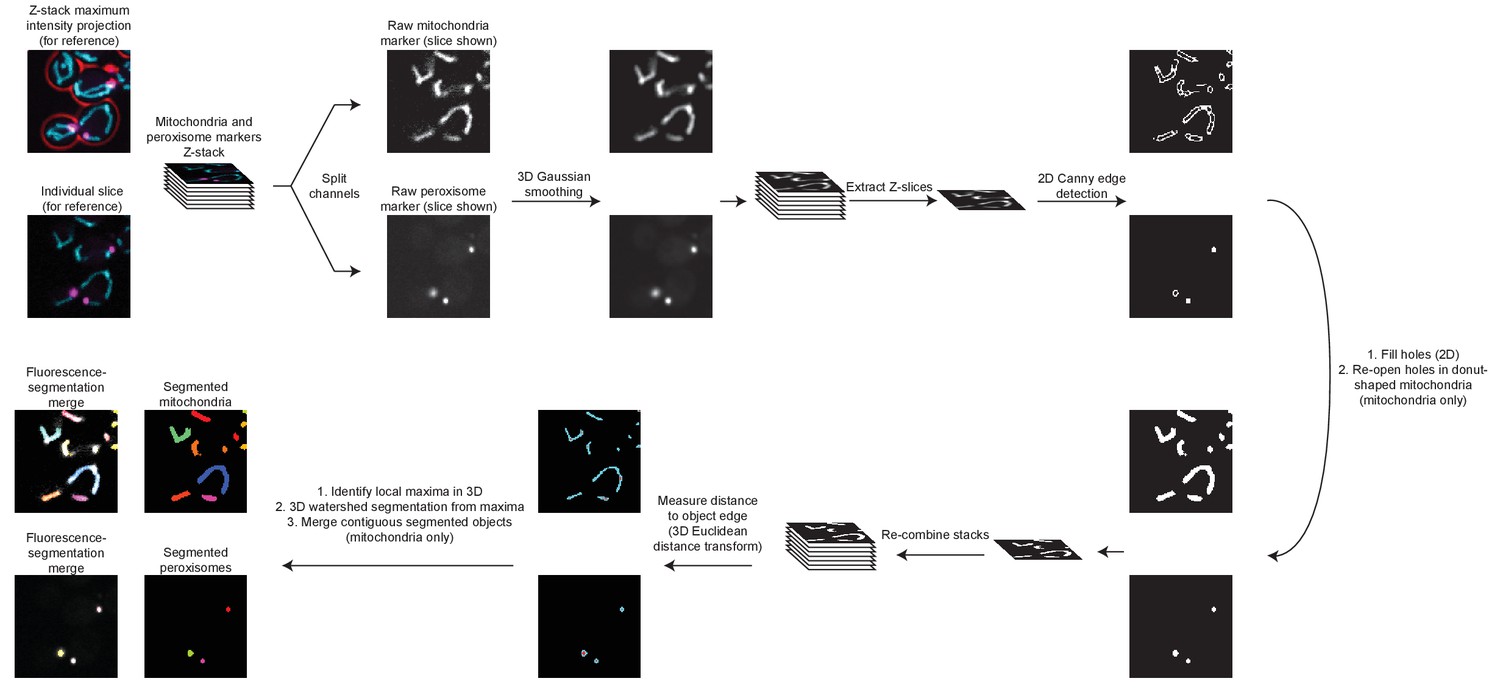
Schematic of the processing pipeline for identifying mitochondria and peroxisomes from fluorescence microscopy images.
Beginning at the top left, fluorescence channels for mitochondria (cyan) and peroxisomes (magenta) are split into separate Z-stacks. After 3-dimensional Gaussian smoothing through the Z-stack, each individual slice is analyzed using a Canny edge detector (Canny, 1986) to identify object edges. Next, enclosed areas are filled to generate a mask representing areas of the slice containing mitochondria or peroxisomes. For mitochondria, holes in regions containing donut-shaped organelles are re-opened. Stacks are re-combined and a 3-dimensional Euclidean Distance Transformation is used to identify pixels within the masked organelles with the greatest distance to the edge of the object. These local maxima are used as seed points for watershed-based object segmentation. For mitochondria, contiguous objects from watershed segmentation are combined to form one mitochondrion. See Materials and methods for additional details, and see Videos 1 and 2 for a comparison of fluorescent organelle marker image inputs to segmentation outputs.
Figure 2 with 1 supplement
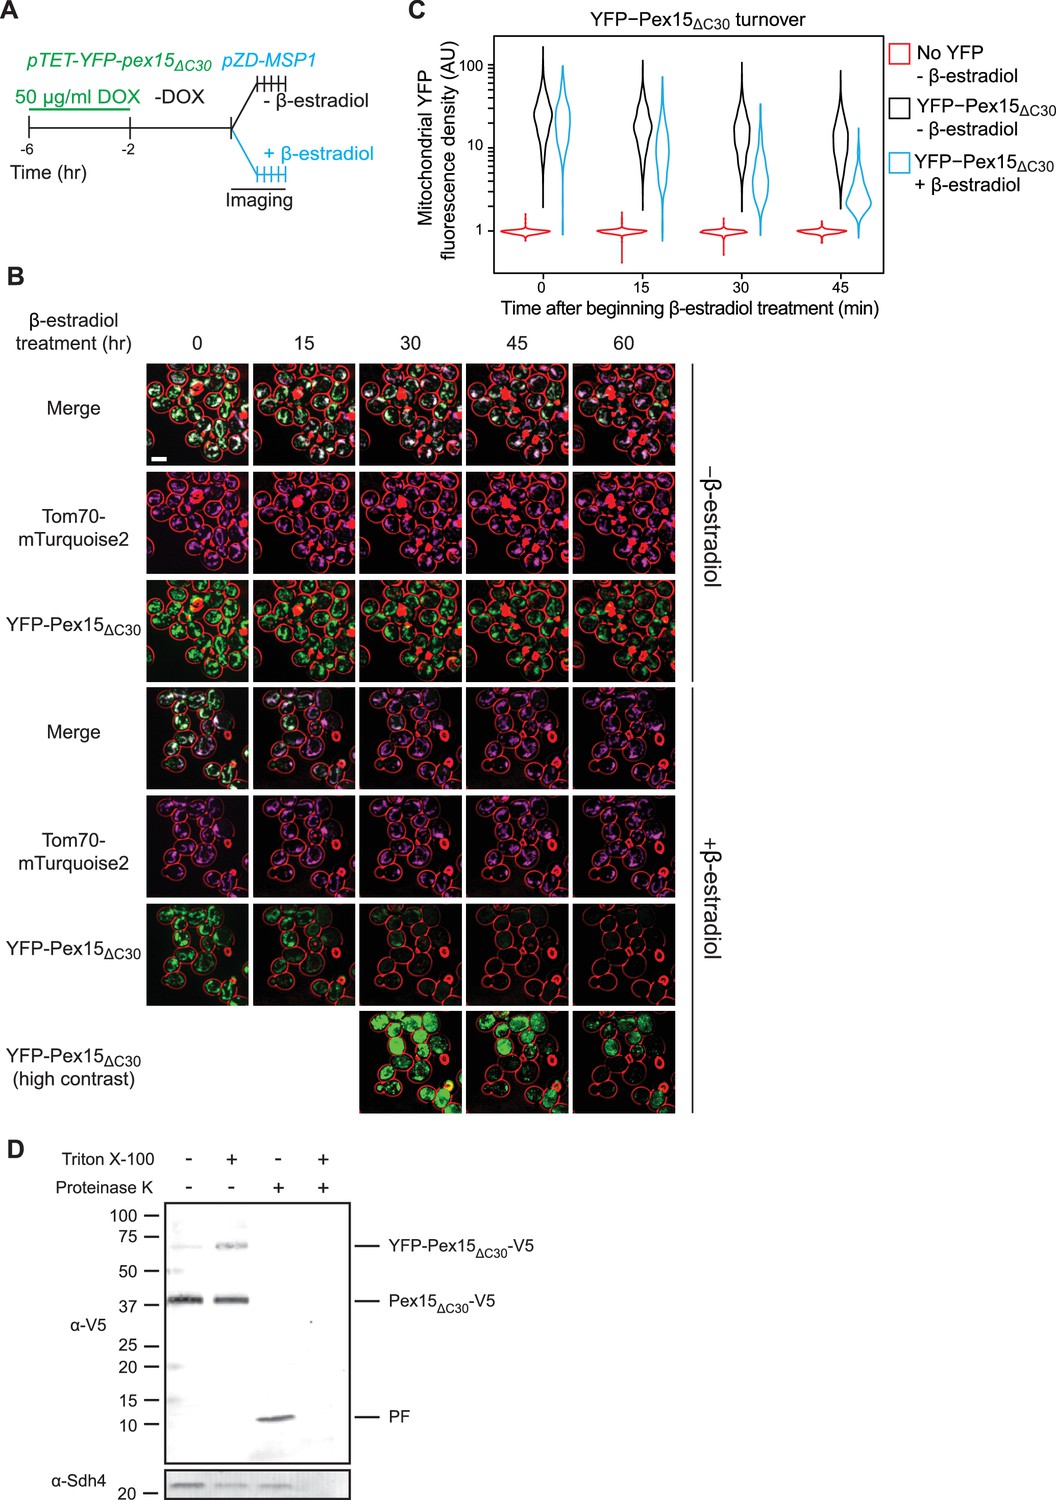
Pulse-chase analysis of mitochondrial Pex15ΔC30 turnover by Msp1.
(A) Experimental timeline of the staged expression experiment for monitoring Msp1-dependent turnover of mitochondrial YFP-Pex15ΔC30. This experiment was performed twice with similar results. (B) Representative confocal micrographs from the experiment described in part A. Each image represents a maximum intensity projection of a Z-stack. Red cell outlines originate from a single bright-field image acquired at the center of the Z-stack. Contrast-enhanced YFP-Pex15ΔC30 fluorescence is shown for later timepoints +β-estradiol to permit visualization of dim signals. Scale bar, 5 μm. (C) Quantitation of mitochondrial YFP-Pex15ΔC30 fluorescence from the experiment described in part B. YFP-Pex15ΔC30 fluorescence density corresponds to the total YFP signal at each computationally-defined mitochondrion (marked by Tom70-mTurquoise2) divided by the mitochondrial pixel volume (see Materials and methods for more details). These data represent analysis of 382 mock-treated and 210 β-estradiol-treated TET-YFP-PEX15ΔC30 cells and 198 cells lacking YFP-tagged Pex15 followed throughout the time course as well as progeny from cell divisions during the experiment. Laser power was increased from the experiment shown in Figure 1B–C, and therefore AUs are not comparable between these experiments. (D) Protease protection assay monitoring YFP-Pex15ΔC30-V5 integration into mitochondria. Crude mitochondria were isolated from TET-YFP-pex15ΔC30-V5 cells (see Materials and methods for details) and subjected to Proteinase K (PK) or mock treatment in the presence or absence of 1% Triton X-100. Samples were resolved by SDS-PAGE and analyzed by immunoblotting with the indicated antibodies. Immunoblotting with an α-V5 antibody visualized bands at the predicted molecular weight for full-length YFP-Pex15ΔC30-V5 (top), Pex15ΔC30-V5 lacking the YFP tag (middle and Figure 2—figure supplement 1), and a smaller protease-resistant fragment (PF, bottom). Immunoblotting was performed against the mitochondrial inner membrane protein Sdh4 to assess accessibility of the mitochondrial intermembrane space to PK. See Figure 2—figure supplement 1 for α-YFP immunoblotting.
Figure 2—figure supplement 1
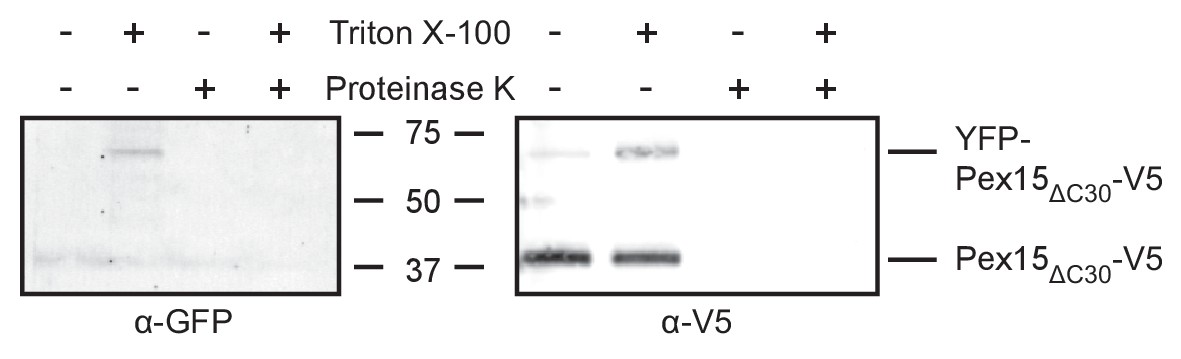
Supporting evidence for Msp1-dependent turnover of mitochondrial YFP-Pex15ΔC30.
SDS-PAGE resolution and α-GFP vs. α-V5 immunoblotting of protease protection samples from Figure 2D. The α-GFP antibody also recognizes YFP. The α-V5 immunoblot shown is a cropped region from the blot in Figure 2D.
Figure 3 with 1 supplement
Pulse-chase analysis of peroxisomal Pex15 turnover by Msp1.
(A) Experimental timeline of a pulse-chase analysis similar to the one described in Figure 1A but with 10 µg/ml DOX. This experiment was performed twice with similar results. (B) Representative confocal micrographs from the experiment described in part A. Each image represents a maximum intensity projection of a Z-stack. Red cell outlines originate from a single bright-field image acquired at the center of the Z-stack. Scale bar, 5 μm. Contrast-enhanced YFP-Pex15 fluorescence is shown for the last timepoint +β-estradiol to permit visualization of dim signals. (C) Quantitation of peroxisomal YFP-Pex15 fluorescence from the experiment described in part A. YFP-Pex15 fluorescence density corresponds to the total YFP-Pex15 signal at each computationally-defined peroxisome (marked by mCherry-PTS1) divided by the peroxisomal pixel volume (see Materials and methods for more details). Shown are violin plots of the resulting YFP-Pex15 density distributions. Solid lines represent cells with Msp1 expression driven by the β-estradiol-inducible ZD promoter. Dashed lines represent cells with Msp1 produced from the endogenous MSP1 promoter. These data represent analysis of 270 mock-treated and 304 β-estradiol-treated pMSP1-MSP1 cells and 219 mock-treated and 319 β-estradiol-treated pZD-MSP1 cells followed throughout the time course as well as progeny from cell divisions during the experiment. The 515 nm laser power was decreased relative to the experiments in Figures 1 and 2 and therefore AUs are not comparable between these experiments. (D) Immunoblot analysis of YFP-Pex15 levels after activating MSP1 expression. Whole cell lysates were prepared from cells grown as described in part A at the indicated timepoints after initiating β-estradiol treatment, and then YFP-Pex15 protein was resolved by SDS-PAGE and immunoblotting. Each sample was prepared from an equal volume of culture to measure turnover of YFP-Pex15 from equivalent amounts of starting material. α-Pgk1 immunoblotting was performed as a loading control. Immunoblotting revealed no significant YFP-Pex15 turnover in the absence of Msp1 induction, whereas the corresponding peroxisomal Pex15 levels dropped somewhat during the timecourse (compare lanes 2–5 to left Figure 3C left panels). YFP-Pex15 dilution by cell division may explain this discrepancy. (E) Quantitation of endogenously expressed peroxisomal sfYFP-mCherry-Pex15 (left) or mitochondrial sfYFP-mCherry-Pex15ΔC30 (right) sfYFP fluorescence density in wild-type and msp1Δ cells. Peroxisomal sfYFP fluorescence density corresponds to the total sfYFP signal at each computationally-defined peroxisome (marked by mTurquoise2-PTS1) divided by the peroxisome volume in pixels. Mitochondrial sfYFP fluorescence density corresponds to the total sfYFP signal at each computationally-defined mitochondrion (marked by Tom70-mTurquoise2) divided by the mitochondrial volume in pixels. Shown are violin plots of the resulting sfYFP fluorescence density distributions. Background represents the mean auto-fluorescence in the sfYFP channel from peroxisomes and mitochondria in strains lacking fluorescently labeled Pex15. Background is normally distributed around the mean and therefore low-fluorescence or non-fluorescent organelles can have negative fluorescence density after background subtraction. These data represent analysis of 941 sfYFP-mCherry-Pex15 MSP1 cells, 942 sfYFP-mCherry-Pex15 msp1Δ cells, 807 sfYFP-mCherry-Pex15ΔC30 MSP1 cells, and 918 sfYFP-mCherry-Pex15ΔC30 msp1Δ cells.
Figure 3—figure supplement 1
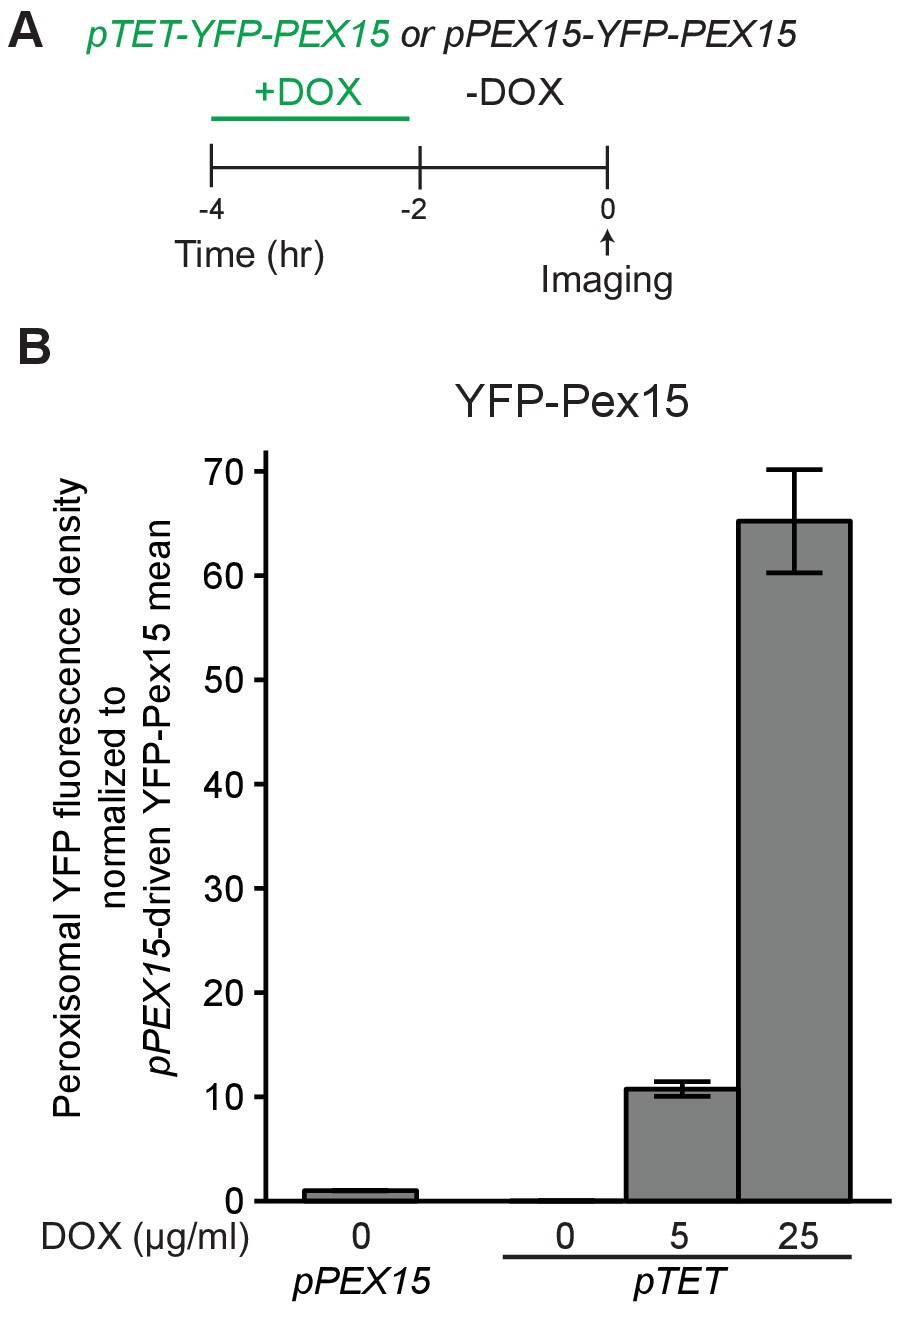
Supporting evidence that Msp1 induces turnover of overexpressed Pex15 at peroxisomes.
(A) Experimental timeline of the staged expression experiment for comparing peroxisomal YFP-Pex15 levels when YFP-Pex15 is produced from the PEX15 promoter or the TET promoter in the presence of varying doxycycline concentrations. (B) Quantitation of peroxisomal YFP-Pex15 fluorescence from the experiment described in part A. YFP-Pex15 fluorescence density corresponds to the total YFP-Pex15 signal at each computationally-defined peroxisome (marked by mCherry-PTS1) divided by the peroxisomal pixel volume (see Materials and methods for more details). Shown are the mean peroxisomal fluorescence densities for each sample normalized to the steady state peroxisomal YFP density mean for cells producing YFP-Pex15 from the endogenous PEX15 promoter. Error bars represent standard error of the population mean.
Figure 4 with 1 supplement
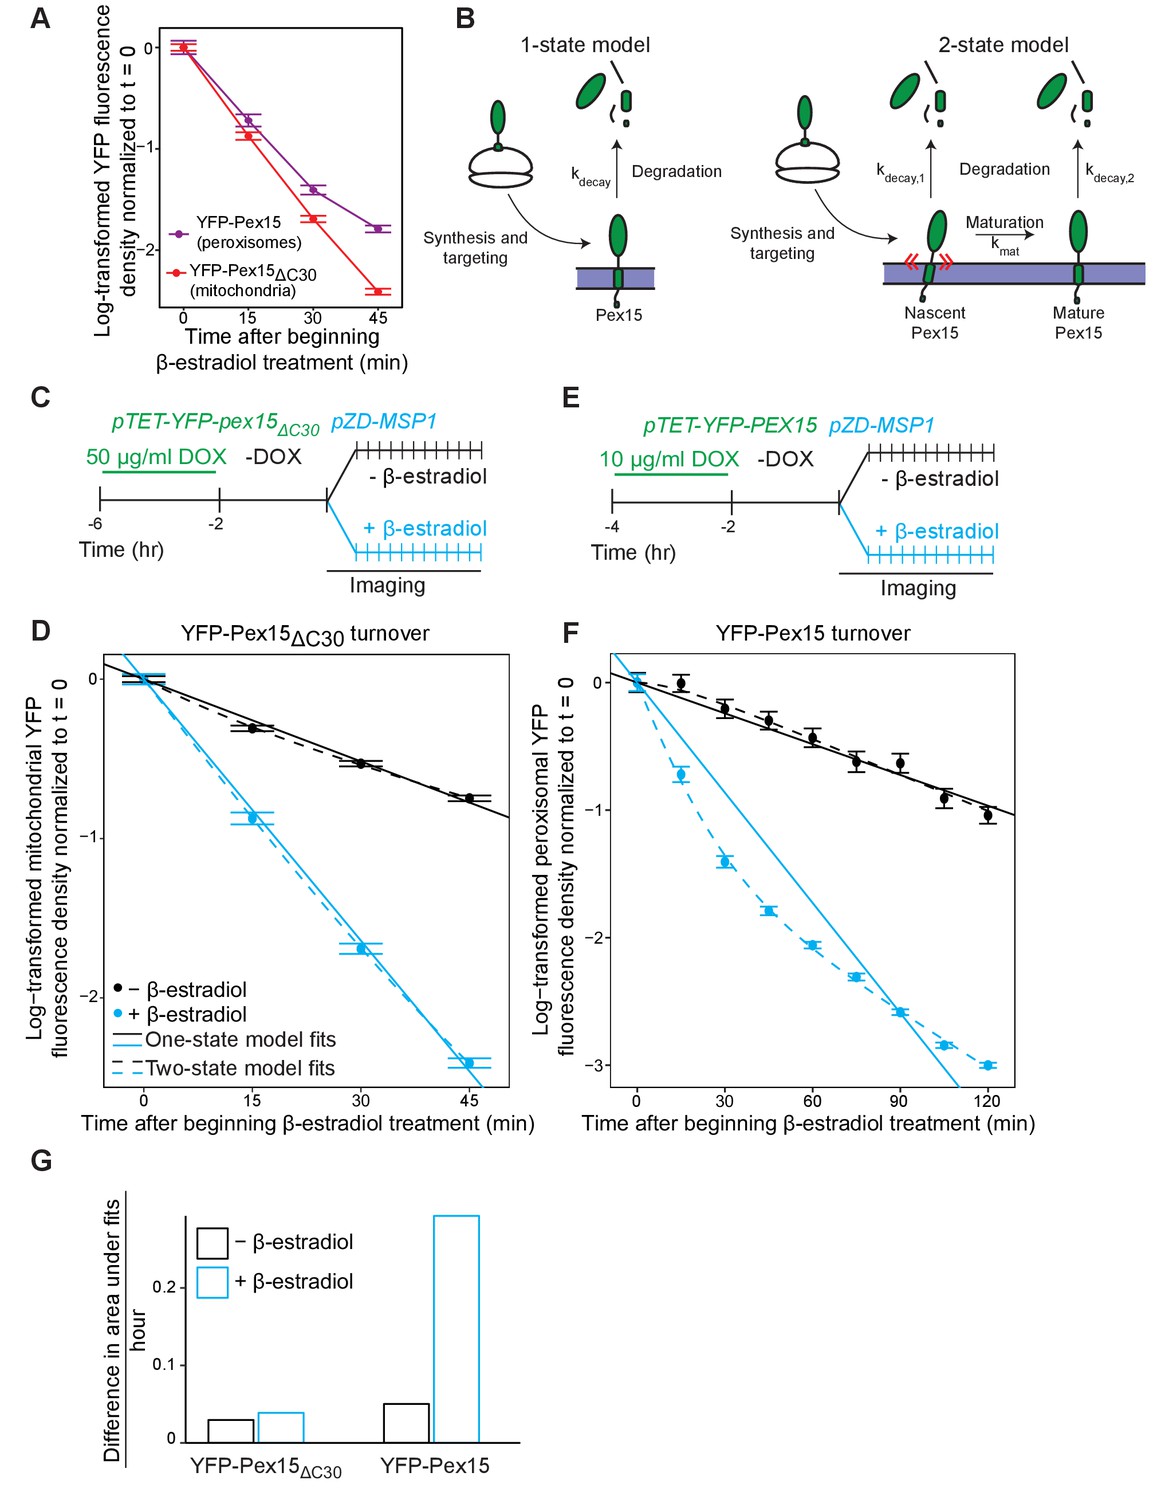
Experimental and theoretical evidence for the 2-state model of Pex15 turnover at peroxisomes.
(A) The apparent difference in the kinetic profiles of Msp1-induced substrate turnover at peroxisomes (Pex15) versus mitochondria (Pex15ΔC30). These data represent quantitation of data from the experiments described in Figure 2 (YFP-Pex15ΔC30) and additional timepoints from the experiment described in Figure 3 (YFP-Pex15). YFP signal density at mitochondria (red) or peroxisomes (purple) is plotted after normalization to the 0 hr timepoint, with lines directly connecting timepoints. Error bars represent standard error of the mean. These data are reproduced in parts D and F. (B) Schematics of the two competing models for Pex15 turnover. In the 1-state model, newly-synthesized Pex15 is first targeted and inserted into the peroxisome membrane and then degraded by a simple exponential decay process that occurs with the rate constant kdecay. In the 2-state model, there is an additional exponential maturation process that converts Pex15 from a nascent state to a mature state at a rate defined by kmat. In addition, this model includes the new exponential decay constant kdecay,2 for the mature Pex15 state that is distinct from the kdecay,1 of the nascent state. (C) Experimental timeline of the staged expression experiment for monitoring Msp1-dependent turnover of mitochondrial Pex15ΔC30 with high temporal resolution. (D) Quantitation of mitochondrial YFP-Pex15ΔC30 fluorescence from the experiment described in part C. YFP signal density at mitochondria was determined as described in Figure 1 and plotted after normalization to the 0 hr timepoint. Error bars represent standard error of the mean. Data were fitted to the competing models described in part B as indicated (See Materials and methods for model fitting details). See Figure 4—figure supplement 1A for fit parameters. (E) Experimental timeline of the staged expression experiment for monitoring Msp1-dependent turnover of peroxisomal Pex15 with high temporal resolution. This experiment was performed twice with similar results. (F) Quantitation of peroxisomal YFP-Pex15 fluorescence from the experiment described in part E. YFP signal density at peroxisomes was determined as described in Figure 3C and plotted as in part D. See Figure 4—figure supplement 1A for fit parameters. See Figure 4—figure supplement 1B for a similar plot containing only 0–45 min timepoints as plotted for YFP-Pex15ΔC30 in part D. (G) Area between the 1-state and 2-state fits shown in parts D and F. See Materials and methods for details. Total area between curves is divided by time to normalize between fits from different time scales.
Figure 4—figure supplement 1

Supporting evidence for the 2-state model of Pex15 turnover at peroxisomes.
(A) Fit quality and parameters from model fits shown in Figure 4D and F. RSS, residual sum of squares. Reported rate constants represent the model’s best fit parameters. N.s., not significantly different from 0; *p<0.01; **p<0.0001. (B) Quantitation of peroxisomal YFP-Pex15 fluorescence for the first four timepoints shown in Figure 4F. Data were fitted to the competing models described in Figure 4B. See Figure 4E–F for additional details.
Figure 5 with 1 supplement
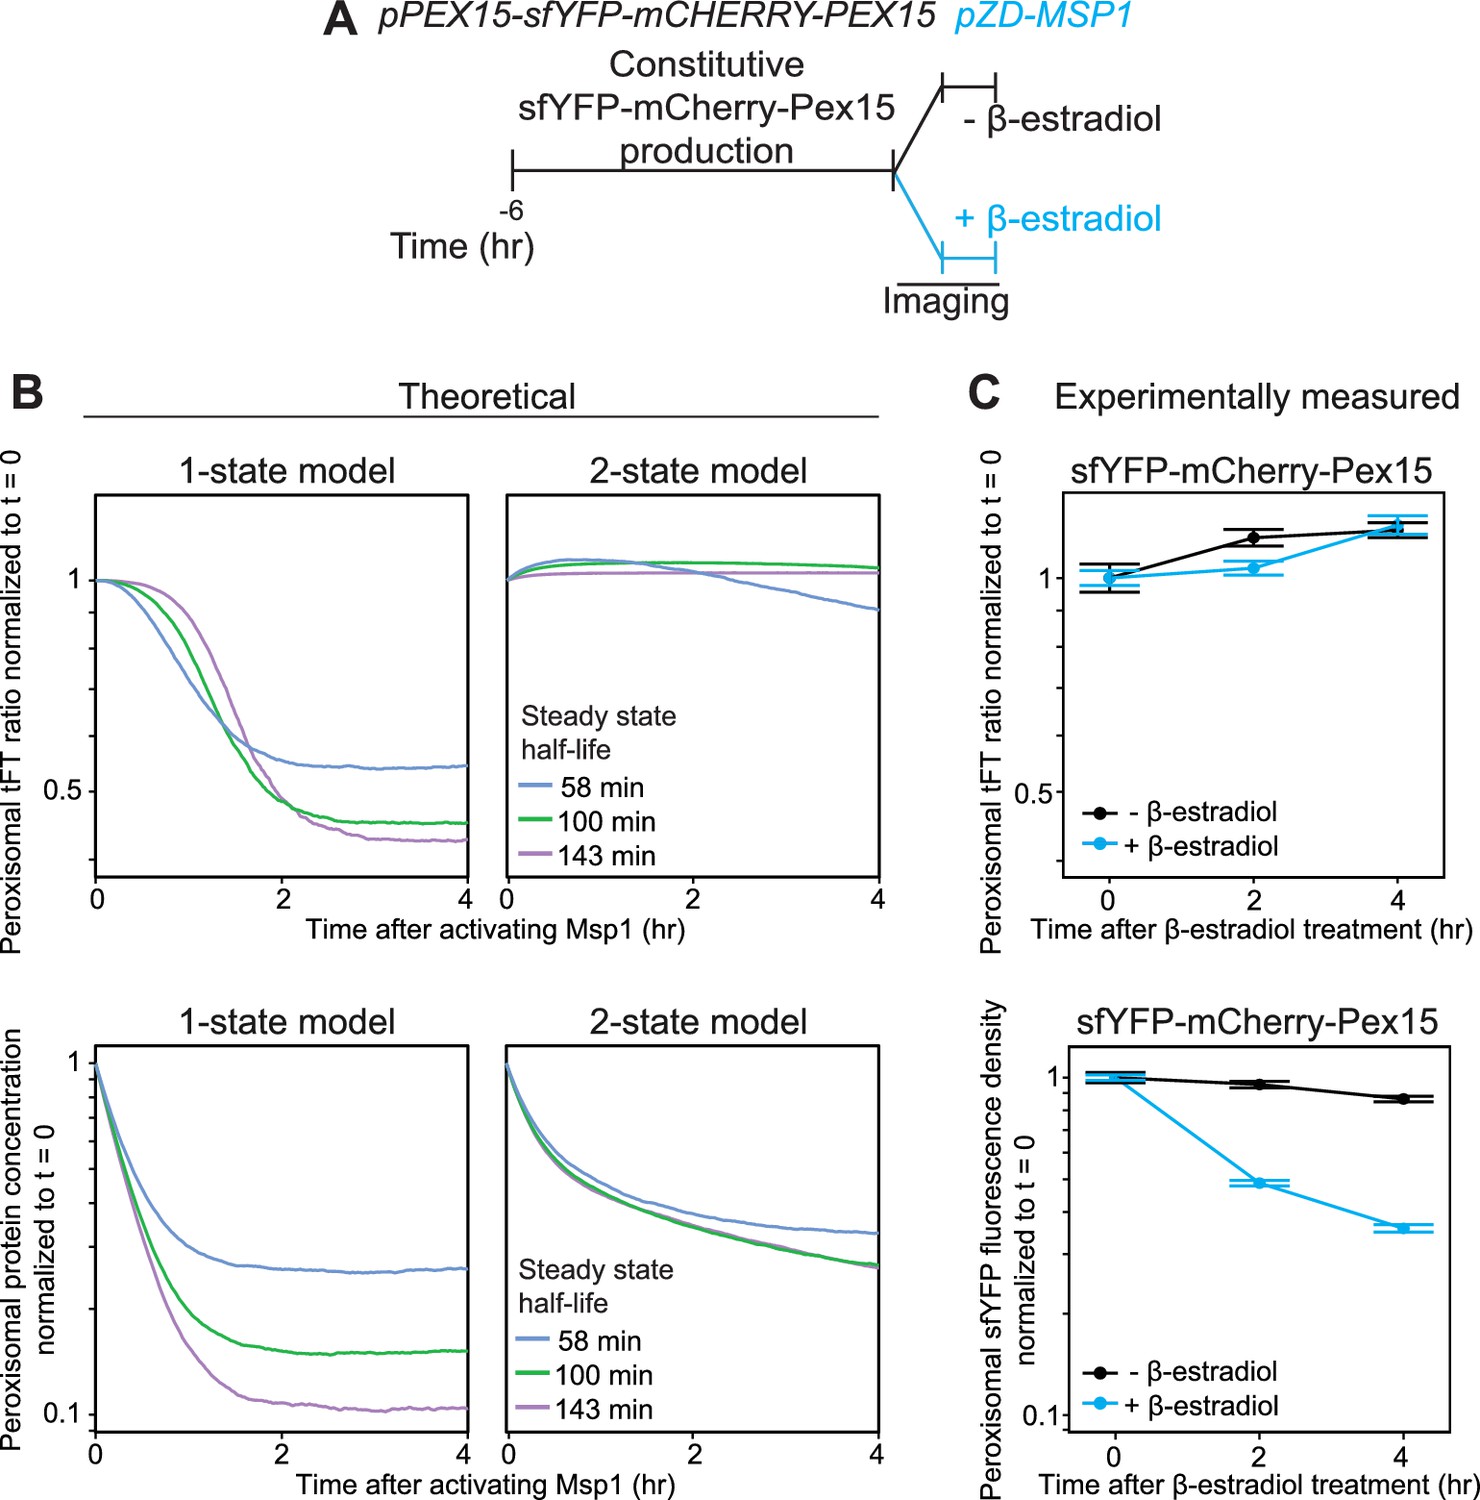
Experimental measurement of Pex15 levels and age after Msp1 activation compared to theoretical modeling.
(A) Schematic of the staged expression experiment for monitoring turnover of sfYFP-mCherry-Pex15 expressed from the native genomic PEX15 promoter following Msp1 overexpression. (B) Simulations of mCherry/sfYFP ratio (top) and Pex15 decay (bottom) as a function of time following Msp1 activation in a 1-state or 2-state regime. Different colors show Pex15 dynamics resulting from the indicated theoretical half-life parameters. See Materials and methods for simulation details. (C) Experimentally measured mCherry/sfYFP ratio (top) and sfYFP density decay (bottom) from the experiment described in part B. Error bars represent standard error of the mean. Greater than 100 cells were imaged for each sample at each time point, and different fields of cells were imaged at each time point to minimize photobleaching. This experiment was performed twice with similar results.
Figure 5—figure supplement 1

Supporting information for tandem fluorescent timer-tagged Pex15.
(A) Tandem fluorescent timer schematics. Pex15 is N-terminally tagged with a superfolding YFP (sfYFP) followed by mCherry. sfYFP matures with a half-time of ~10 min (Hansen and O'Shea, 2013), whereas mCherry matures with a half-time of ~40 min (Khmelinskii et al., 2012). (B) Theoretical fraction of sfYFP molecules and mCherry molecules that are fluorescent at indicated times following synthesis as well as the ratio of mCherry:sfYFP fluorescence signal. Curves calculated based on maturation rates in A.
Figure 6 with 1 supplement

Pex3 protects Pex15 from Msp1-induced turnover.
(A) Whole cell lysates prepared from PEX3 msp1Δ and PEX3-FLAG msp1Δ cells expressing tFT-Pex15 from its native genomic promoter or lacking tagged Pex15 were solubilized with NP-40 and then incubated with anti-FLAG resin. The resulting immunoprecipitates (IP) were washed and then eluted with FLAG peptide. IP inputs, post-IP depleted lysates, and IP elutions were resolved by SDS-PAGE and analyzed by immunoblotting with the indicated antibodies (see Materials and methods for details). *, a tFT-Pex15 degradation product lacking the N-terminal sfYFP. (B) Schematic of the staged degradation experiment for monitoring tFT-Pex15 turnover following Pex3-AID degradation. Wild-type and msp1Δ cells containing tFT-Pex15 constitutively expressed from the PEX15 promoter and expressing Pex3-AID were grown in exponential phase for 6 hr. The experiment was performed in the presence and absence of the E3 ligase OsTir1 which ubiquitinates Pex3-AID following Auxin treatment (Nishimura et al., 2009). Half of the cells were then subjected to treatment with 1 mM Auxin while the other half received DMSO vehicle, followed by time-lapse imaging of both cell populations using a spinning disk confocal microscope. (C) Quantitation of peroxisomal sfYFP fluorescence from tFT-Pex15 from the experiment described in part B. YFP signal density at peroxisomes was determined as described in Figure 3C and plotted after normalization to the 0 hr timepoint of the identically treated MSP1 strain. Error bars represent standard error of the mean. These data represent analysis of >100 cells for each sample at each timepoint. Different fields of cells were imaged at each timepoint to minimize photobleaching. This experiment was performed twice with similar results. (D) Schematic of the staged expression experiment for monitoring Msp1-dependent turnover of peroxisomal Pex15 in the presence and absence of overexpressed Pex3. This experiment was performed twice with similar results. (E) Quantitation of peroxisomal YFP-Pex15 fluorescence from the experiment described in part D. YFP signal density at peroxisomes was determined as described in Figure 3C and plotted as in Figure 4F. Pex3-overexpressing cells (pTDH3-PEX3) are shown with dashed lines, whereas solid lines indicate peroxisomal YFP levels in cells producing Pex3 from its endogenous promoter. These data represent analysis of 243 mock-treated and 128 β-estradiol-treated PEX3 wild type cells and 171 mock-treated and 197 β-estradiol-treated pTDH3-PEX3 cells followed throughout the time course as well as progeny from cell divisions during the experiment.
Figure 6—figure supplement 1

Supporting evidence for Pex15 interaction with Pex3 and rapid in situ destruction of Pex3-AID.
(A) Quantitation of peroxisomal sfYFP-mCherry-Pex15 sfYFP fluorescence density in wild-type, pex1Δ, and pex6Δ cells. sfYFP fluorescence density corresponds to the total sfYFP-mCherry-Pex15 (produced from its native promoter and integrated at the ura3 locus) signal at each computationally-defined peroxisome (marked by Pex11-mTurquoise2) divided by the organelle’s pixel volume (see Materials and methods for details). Shown are the mean fluorescence densities for each sample normalized to the wild-type mean. Error bars represent standard error of the population mean. (B) Confocal micrographs of cells producing C-terminally GFP-AID tagged Pex3 from its native locus in the presence and absence of 1 mM Auxin treatment for 1 hr. mCherry-PTS1 was produced constitutively from a strong promoter at the TRP1 locus and OsTir1 was produced constitutively from a strong promoter at the leu2 locus (see Materials and methods for strain details). Each image represents a maximum intensity projection of a Z-stack. Red cell outlines originate from a single bright-field image acquired at the center of the Z-stack. Below, quantitation of the fraction of peroxisomes containing GFP fluorescence in the presence and absence of Auxin treatment. Scale bar, 5 μm. n.d., none detected. (C) Cells expressing Pex3-V5-AID (from the native locus) and OsTIR1 (from a transgene at the leu2 locus) as indicated were treated with Auxin for the indicated times prior to whole-cell lysate preparation. Samples were resolved by SDS-PAGE and analyzed by immunoblotting with the indicated antibodies. Hsc82 is an abundant chaperone that served as a loading control. (D) Immunoblotting analysis similar to the one described in part C but with the additional use of cycloheximide (CHX) as indicated. Pgk1 is an abundant glycolytic enzyme that served as a loading control. (E) Immunoblotting analysis as described in part D comparing Pex3-V5-AID turnover in the presence and absence of Msp1. Pgk1 is an abundant glycolytic enzyme that served as a loading control. (F) Wild-type and msp1Δ cells containing the doxycycline-inducible promoter driving YFP-Pex15 expression (pTET-YFP-PEX15) and expressing Pex3-AID were grown for 3 hr in the presence of 10 µg/ml doxycycline (DOX) before they were washed and grown for 2 hr in drug-free media. Following this period of substrate pre-loading, half of the cells were exposed to 1 mM Auxin, followed by time-lapse imaging of both cell populations using a spinning disk confocal microscope. (G) Quantitation of peroxisomal YFP-Pex15 fluorescence from the experiment described in part F. YFP signal density at peroxisomes was determined as described in Figure 2 and plotted after normalization to the –Auxin sample value at the 0 hr timepoint of the corresponding strain. Error bars represent standard error of the mean. These data represent analysis of 299 mock-treated MSP1 cells, 344 Auxin-treated MSP1 cells, 314 mock-treated msp1Δ cells, and 203 Auxin-treated msp1Δ cells followed throughout the time course as well as progeny from cell divisions during the experiment. This experiment was performed three times with similar results. (H) Quantitation of peroxisomal YFP-Pex15 fluorescence density at timepoint 0 in wild-type and msp1Δ -Auxin samples from part F-G. Peroxisomal fluorescence density corresponds to the total YFP fluorescence signal at each computationally-defined peroxisome (marked by mCherry-PTS1) divided by the pixel volume of the peroxisome. Error bars represent standard error of the mean. See parts F-G for additional details. (I) Schematic of the staged degradation experiment for monitoring Pex11-tFT and Pex12-tFT turnover following Pex3-AID degradation. Wild-type and msp1Δ cells containing Pex11-tFT or Pex12-tFT constitutively expressed from their respective native promoter and expressing OsTir1 and Pex3-AID were grown in exponential phase for 6 hr. Cells were then subjected to treatment with 1 mM Auxin followed by time-lapse imaging using a spinning disk confocal microscope. (J) Quantitation of peroxisomal sfYFP fluorescence from Pex11-tFT (left panel) and Pex12-tFT (right panel) from the experiment described in part F. YFP signal density at peroxisomes was determined as described in Figure 3C and plotted after normalization to the 0 hr timepoint of the MSP1 strain. Error bars represent standard error of the mean. These data represent analysis of >100 cells for each sample at each timepoint. Different fields of cells were imaged at each timepoint to minimize photobleaching.
Figure 7 with 1 supplement
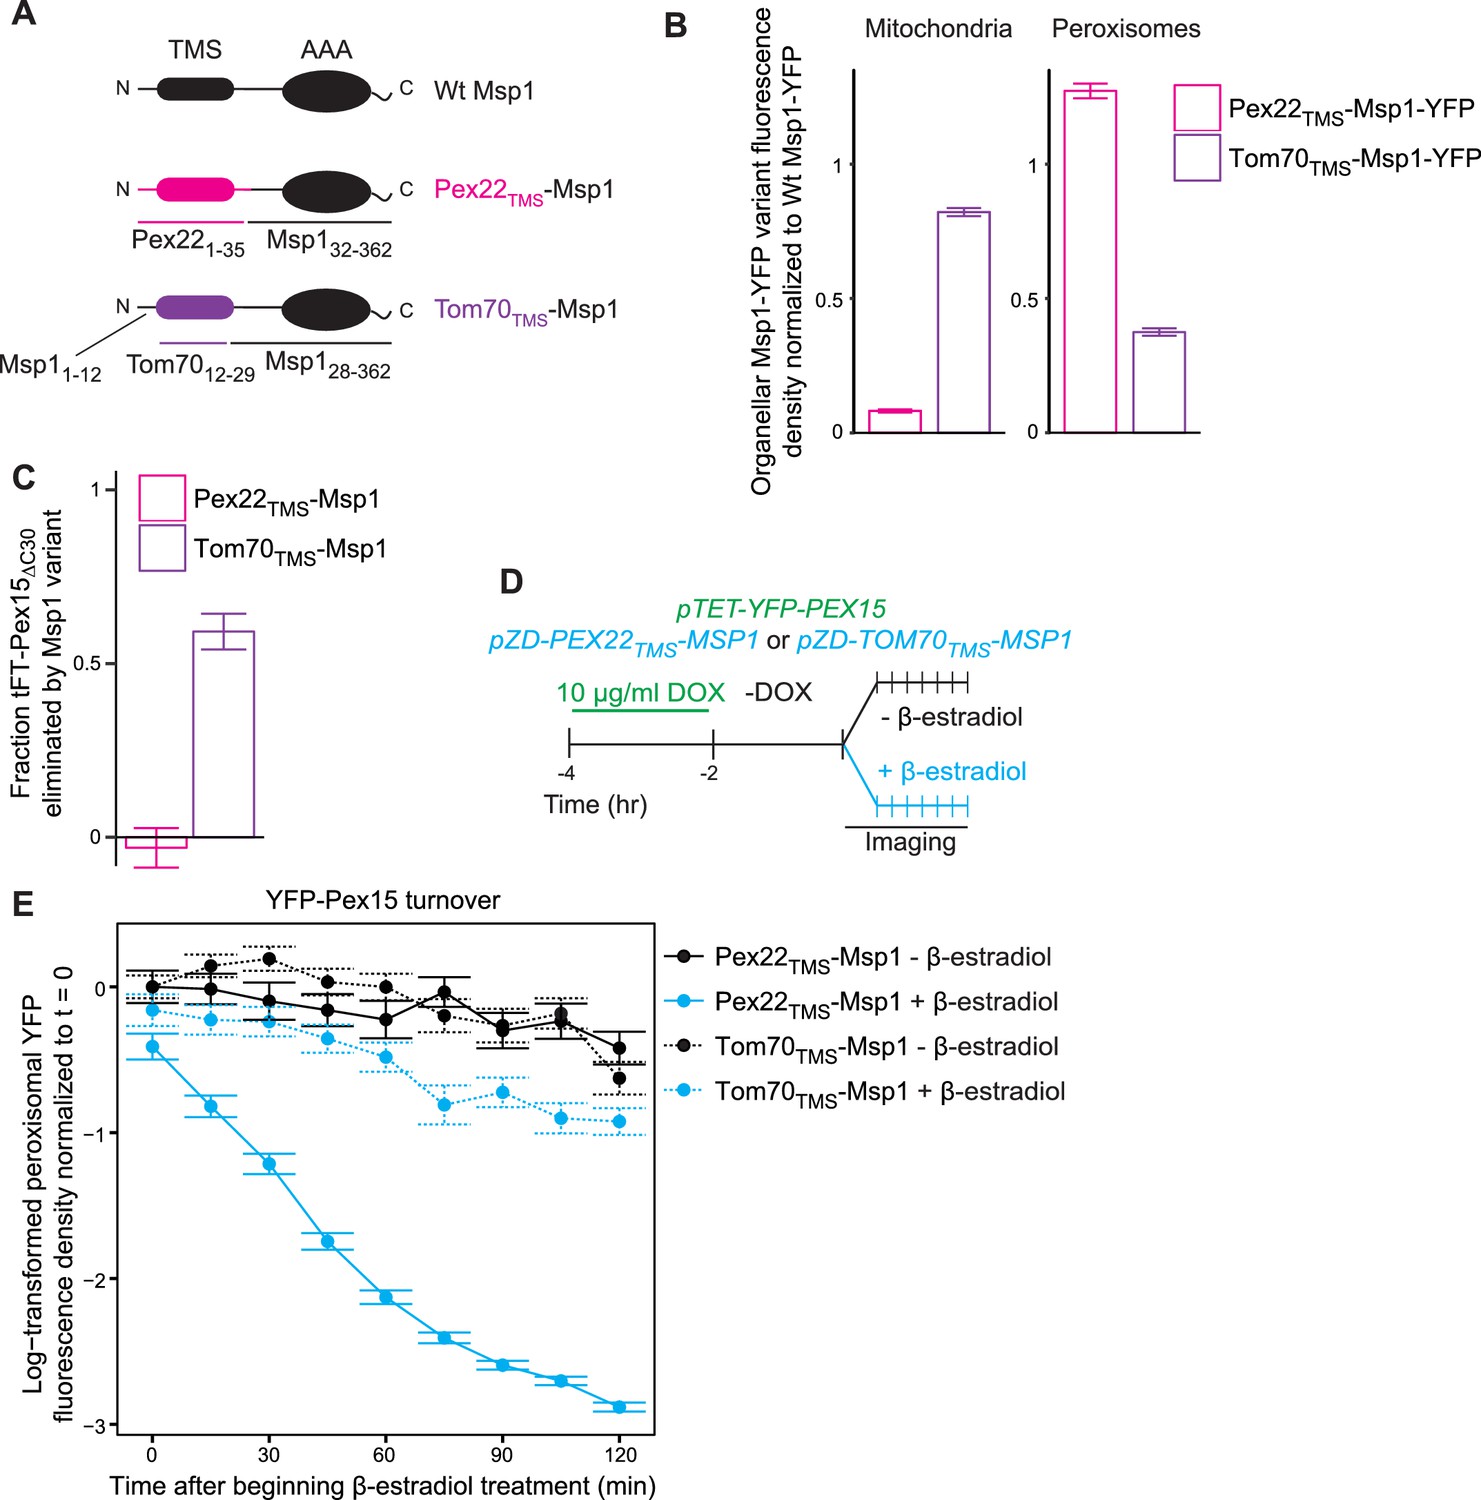
The Msp1 TMS targets Msp1 to peroxisomes and mitochondria, but is dispensible for substrate engagement.
(A) Schematic representation of Msp1 TMS chimaeras. Top, wild type Msp1, with an N-terminal TMS and C-terminal AAA ATPase domain. Middle, Msp1 with its N-terminal 31 amino acids deleted and replaced with the first 35 amino acids of Pex22. Bottom, Msp1 with its TMS (residues 13–27) replaced with residues 12–29 of Tom70. (B) Quantitation of mitochondrial (left) and peroxisomal (right) YFP density in cells producing Pex22TMS-Msp1-YFP (pink) or Tom70TMS-Msp1-YFP (purple) from the native MSP1 promoter. YFP signal density was determined at mitochondria as described in Figure 2C, and at peroxisomes as described in Figure 3C. YFP fluorescence density at each organelle was normalized to the mean fluorescence density at the same organelle for wild type Msp1-YFP. Error bars represent standard error of the population mean. See Figure 7—figure supplement 1A for representative images. These data represent analysis of >250 cells from each strain. (C) Quantitation of endogenously expressed mitochondrial tFT-Pex15ΔC30 sfYFP fluorescence density in cells producing Pex22TMS-Msp1 or Tom70TMS-Msp1 from the native MSP1 promoter. Mitochondrial sfYFP fluorescence density was calculated as described for Figure 3E. Bars represent the fraction of tFT-Pex15ΔC30 eliminated by the Msp1 variant, calculated as (mitochondrial mean YFP density in msp1Δ - mitochondrial mean YFP density in TMS variant)/(mitochondrial mean YFP density in msp1Δ - mitochondrial mean YFP density in MSP1). See Figure 7—figure supplement 1B for a violin plot of the mitochondrial sfYFP fluorescence distributions. These data represent analysis of >250 cells from each strain. (D) Experimental timeline of the staged expression experiment for monitoring turnover of peroxisomal Pex15 following transient expression of Pex22TMS-Msp1 or Tom70TMS-Msp1 from the ZD promoter. (E) Quantitation of peroxisomal YFP-Pex15 fluorescence from the experiment described in part D. YFP signal density at peroxisomes was determined as described in Figure 3C and plotted as in Figure 4F. Cells producing Pex22TMS-Msp1 and Tom70TMS-Msp1 from the ZD promoter are shown with solid lines and dashed lines respectively. These data represent analysis of 158 mock-treated Pex22TMS-Msp1 cells, 231 β-estradiol-treated Pex22TMS-Msp1 cells, 130 mock-treated Tom70TMS-Msp1 cells, and 171 β-estradiol-treated Tom70TMS-Msp1 cells followed throughout the time course as well as progeny from cell divisions during the experiment.
Figure 7—figure supplement 1
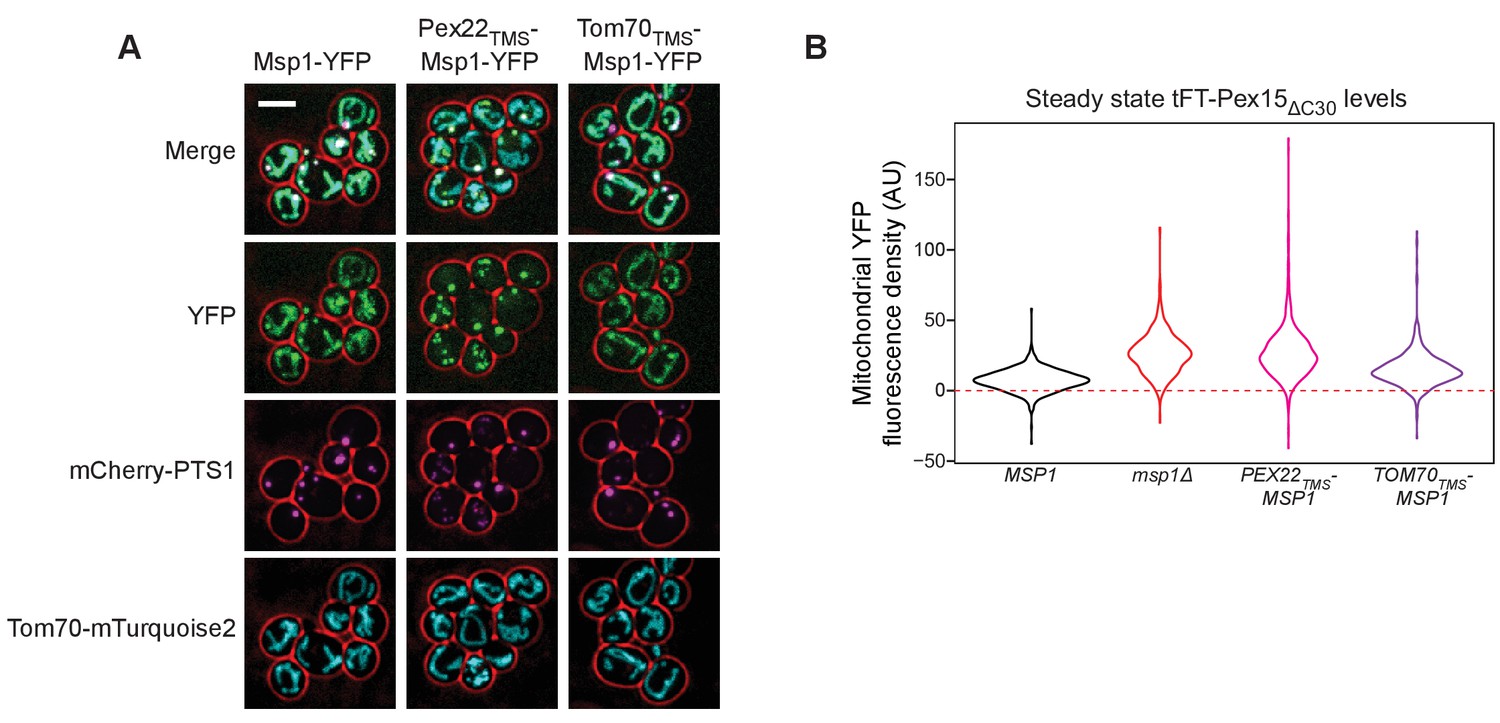
Supporting evidence for the role of the Msp1 TMS in membrane targeting and substrate clearance.
(A) Representative confocal micrographs from the experiment described in Figure 7B. Each image represents a maximum intensity projection of a Z-stack. Red cell outlines originate from a single bright-field image acquired at the center of the Z-stack. Scale bar, 5 μm. (B) Quantitation of endogenously expressed mitochondrial tFT-Pex15ΔC30 sfYFP fluorescence density in wild type cells (black), msp1Δ cells (red), or cells producing Pex22TMS-Msp1 or Tom70TMS-Msp1 from the native MSP1 promoter (pink and purple, respectively). See Figure 7C for additional details. Mitochondrial sfYFP fluorescence density was calculated as described for Figure 3E. Shown are violin plots of the resulting sfYFP fluorescence density distributions. Red dashed background line represents the mean auto-fluorescence in the sfYFP channel from mitochondria in strains lacking fluorescently labeled Pex15. Background is normally distributed around the mean and therefore low-fluorescence or non-fluorescent organelles can have negative fluorescence density after background subtraction.
Figure 8
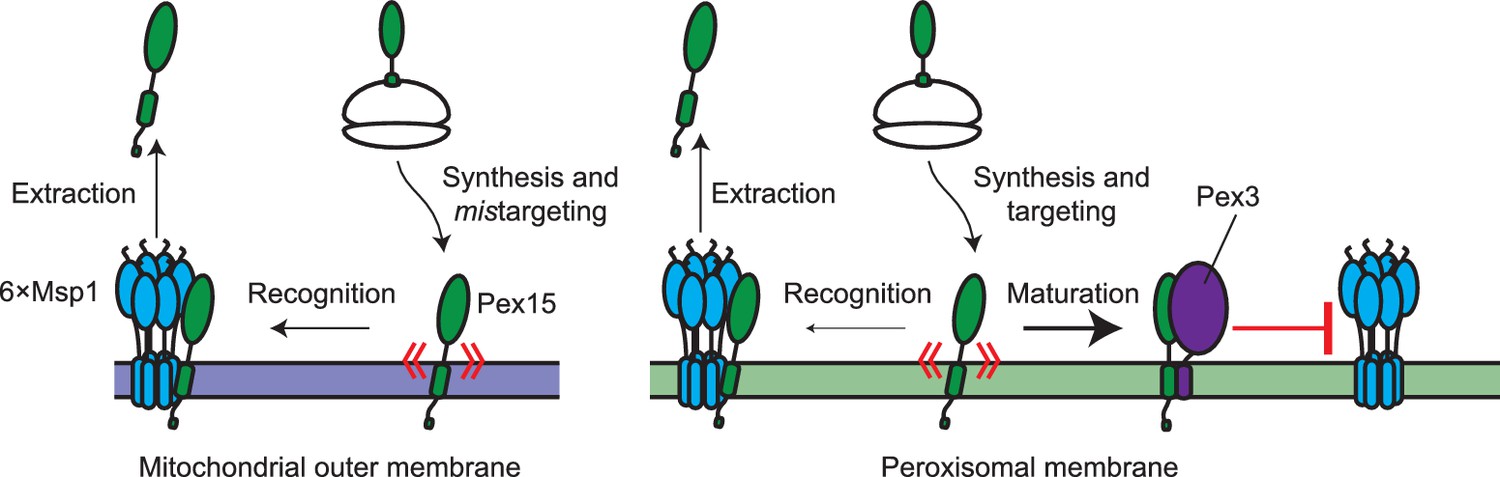
Model for substrate selection by Msp1.
On the left, mistargeted Pex15 inserts into mitochondria and is then recognized by Msp1 for extraction. On the right, following insertion into peroxisomes, nascent Pex15 can be recognized by Msp1 in principle but in practice this requires either Pex15 and/or Msp1 to be present above their usual levels. Otherwise, normal Msp1 recognition is slow relative to the faster ‘maturation’ process involving Pex3 interaction with Pex15, which blocks Msp1 recognition.
Author response image 1

Videos
Video 1
Representative output from segmenting mitochondria in confocal Z-stacks.
An animated Z-stack showing raw Tom70-mTurquoise2 fluorescence visualized by spinning disk confocal microscopy (left), segmented mitochondria identified in the image (middle), and an overlay of the raw image and segmentation output (right). See Materials and methods and Figure 1—figure supplement 2 for segmentation details. Each contiguous single-color object represents one segmented mitochondrion. Video travels from the bottom to the top of the Z-stack in 0.2 μm slices.
Video 2
Representative output from segmenting peroxisomes in confocal Z-stacks.
An animated Z-stack showing raw mCherry-PTS1 fluorescence visualized by spinning disk confocal microscopy (left), segmented peroxisomes identified in the image (middle), and an overlay of the raw image and segmentation output (right). See Materials and methods and Figure 1—figure supplement 2 for segmentation details. Each contiguous single-color object represents one segmented peroxisome. Video travels from the bottom to the top of the Z-stack in 0.2 μm slices.
Tables
Key resources table
| Reagent type (species) or resource | Designation | Source or reference | Identifiers | Additional information |
|---|---|---|---|---|
| strain, strain background (S. cerevisiae) | BY4741 | PMID: 9483801 | ||
| strain, strain background (S. cerevisiae) | BY4741 trp1Δ::pTDH3- mTURQUOISE2-PTS1-SpHIS5 | This paper | Euroscarf:VDY3349 | |
| strain, strain background (S. cerevisiae) | BY4741 trp1Δ::pTDH3- mTURQUOISE2-PTS1-SpHIS5 ura3Δ::pPEX15-sfYFP- mCHERRY-PEX15-tPEX15-KANMX | This paper | Euroscarf:VDY3350 | |
| strain, strain background (S. cerevisiae) | BY4741 trp1Δ::pTDH3- mTURQUOISE2-PTS1-SpHIS5 ura3Δ::pPEX15-sfYFP- mCHERRY-PEX15-tPEX15-KANMX msp1Δ::HPHMX | This paper | Euroscarf:VDY3351 | |
| strain, strain background (S. cerevisiae) | BY4741 trp1Δ::pTDH3- mTURQUOISE2-PTS1-SpHIS5 ura3Δ::pPEX15-sfYFP- mCHERRY-PEX15- tPEX15-KANMX CgLEU2-Z4EV-pZD-MSP1 | This paper | Euroscarf:VDY3352 | |
| strain, strain background (S. cerevisiae) | BY4741 trp1Δ::pTDH3- mTURQUOISE2-PTS1-SpHIS5 ura3Δ::pPEX15-sfYFP- mCHERRY-PEX15-tPEX15- KANMX pex15Δ::URA | This paper | Euroscarf:VDY3516 | |
| strain, strain background (S. cerevisiae) | BY4741 trp1Δ::pTDH3- mTURQUOISE2-PTS1-SpHIS5 ura3Δ::pPEX15-sfYFP- mCHERRY-PEX15- tPEX15-KANMX pex15Δ::URA msp1Δ:: HPHMX PEX3-3FLAG-NATMX | This paper | Euroscarf:VDY3518 | |
| strain, strain background (S. cerevisiae) | BY4741 trp1Δ::pTDH3- mTURQUOISE2-PTS1-SpHIS5 pex15Δ::URA msp1Δ::HPHMX PEX3-3FLAG-NATMX | This paper | Euroscarf:VDY3519 | |
| strain, strain background (S. cerevisiae) | BY4741 TOM70- mTURQUOISE2-SpHIS5 | This paper | Euroscarf:VDY3354 | |
| strain, strain background (S. cerevisiae) | BY4741 TOM70- mTURQUOISE2-SpHIS5 ura3Δ::pPEX15-sfYFP- mCHERRY-pex15ΔC30- tPEX15-KANMX | This paper | Euroscarf:VDY3355 | |
| strain, strain background (S. cerevisiae) | BY4741 TOM70- mTURQUOISE2-SpHIS5 ura3Δ::pPEX15-sfYFP- mCHERRY-pex15ΔC30- tPEX15-KANMX msp1Δ::HPHMX | This paper | Euroscarf:VDY3356 | |
| strain, strain background (S. cerevisiae) | BY4741 TOM70- mTURQUOISE2-SpHIS5 trp1Δ::pTDH3-mCHERRY- PTS1-CgURA3 | This paper | Euroscarf:VDY3357 | |
| strain, strain background (S. cerevisiae) | BY4741 TOM70- mTURQUOISE2-SpHIS5 trp1Δ::pTDH3-mCHERRY- PTS1-CgURA3 MSP1- YFP-KANMX | This paper | Euroscarf:VDY3358 | |
| strain, strain background (S. cerevisiae) | BY4741 TOM70- mTURQUOISE2-SpHIS5 trp1Δ::pTDH3-mCHERRY- PTS1-CgURA3 CgLEU2- Z4EV-pZD-MSP1- YFP-KANMX | This paper | Euroscarf:VDY3359 | |
| strain, strain background (S. cerevisiae) | BY4741 TOM70- mTURQUOISE2-SpHIS5 trp1Δ::pTDH3-mCHERRY- PTS1-CgURA3 CgLEU2- Z4EV-pZD-MSP1 | This paper | Euroscarf:VDY3360 | |
| strain, strain background (S. cerevisiae) | BY4741 trp1Δ::pTDH3- mCHERRY-PTS1-CgURA3 YFP-PEX15-tPEX15-KANMX | This paper | Euroscarf:VDY3001 | |
| strain, strain background (S. cerevisiae) | BY4741 TOM70- mTURQUOISE2-SpHIS5 trp1Δ::pTDH3-mCHERRY- PTS1-CgURA3 ura3Δ::CgTRP1-rTA-pTET- YFP-PEX15-tPEX15 | This paper | Euroscarf:VDY3607 | |
| strain, strain background (S. cerevisiae) | BY4741 TOM70- mTURQUOISE2-SpHIS5 trp1Δ::pTDH3-mCHERRY- PTS1-CgURA3 CgLEU2-Z4EV-pZD-MSP1 ura3Δ::CgTRP1-rTA-pTET- YFP-PEX15-tPEX15 | This paper | Euroscarf:VDY3527 | |
| strain, strain background (S. cerevisiae) | BY4741 TOM70- mTURQUOISE2-SpHIS5 trp1Δ::pTDH3-mCHERRY- PTS1-CgURA3 CgLEU2-Z4EV-pZD-MSP1 ura3Δ::CgTRP1-rTA-pTET- YFP-PEX15-tPEX15 NATMX-pTDH3-PEX3 | This paper | Euroscarf:VDY3608 | |
| strain, strain background (S. cerevisiae) | BY4741 TOM70- mTURQUOISE2-SpHIS5 trp1Δ::pTDH3-mCHERRY- PTS1-CgURA3 CgLEU2- Z4EV-pZD-MSP1 ura3Δ::CgTRP1- rTA-pTET-YFP-pex15ΔC30-tPEX15 | This paper | Euroscarf:VDY3362 | |
| strain, strain background (S. cerevisiae) | BY4741 TOM70- mTURQUOISE2-SpHIS5 trp1Δ::pTDH3-mCHERRY- PTS1-CgURA3 CgLEU2-Z4EV-pZD-MSP1 ura3Δ::CgTRP1-rTA-pTET- YFP-pex15ΔC30-V5-tPEX15 | This paper | Euroscarf:VDY3412 | |
| strain, strain background (S. cerevisiae) | BY4741 trp1∆::pTDH3- mCherry-PTS1::HPHMX, Pex3-GFP-AID-HIS3M × 6 leu2∆::pTDH3-OsTIR1- CgLEU2 | This paper | Euroscarf:VDY2837 | |
| strain, strain background (S. cerevisiae) | BY4741 PEX3-V5-AID-KANMX | This paper | Euroscarf:VDY2770 | |
| strain, strain background (S. cerevisiae) | BY4741 PEX3-V5-AID-KANMX leu2Δ::pTDH3-OsTIR1-CgLEU2 | This paper | Euroscarf:VDY2773 | |
| strain, strain background (S. cerevisiae) | BY4741 PEX3-V5-AID-KANMX leu2Δ::pTDH3-OsTIR1-CgLEU2 msp1Δ::HIS | This paper | Euroscarf:VDY3399 | |
| strain, strain background (S. cerevisiae) | BY4741 TOM70- mTURQUOISE2-SpHIS5 trp1Δ::pTDH3-mCHERRY- PTS1-CgURA3 ura3Δ::CgTRP1- rTA-pTET-YFP-PEX15-tPEX15 PEX3-V5-AID-KANMX leu2Δ::pTDH3-OsTIR1-CgLEU2 | This paper | Euroscarf:VDY3363 | |
| strain, strain background (S. cerevisiae) | BY4741 TOM70- mTURQUOISE2-SpHIS5 trp1Δ::pTDH3-mCHERRY- PTS1-CgURA3 ura3Δ::CgTRP1- rTA-pTET-YFP-PEX15-tPEX15 PEX3-V5-AID-KANMX leu2Δ::pTDH3-OsTIR1- CgLEU2 msp1Δ::HPHMX | This paper | Euroscarf:VDY3364 | |
| strain, strain background (S. cerevisiae) | BY4741 PEX11-mTURQ UOISE2-SpHIS5 | This paper | Euroscarf:VDY3444 | |
| strain, strain background (S. cerevisiae) | BY4741 PEX11- mTURQUOISE2-SpHIS5 ura3Δ::pPEX15-sfYFP- mCHERRY-PEX15- tPEX15-KANMX | This paper | Euroscarf:VDY3445 | |
| strain, strain background (S. cerevisiae) | BY4741 PEX11- mTURQUOISE2-SpHIS5 ura3Δ::pPEX15-sfYFP- mCHERRY-PEX15-tPEX15- KANMX pex1Δ::NATMX | This paper | Euroscarf:VDY3446 | |
| strain, strain background (S. cerevisiae) | BY4741 PEX11- mTURQUOISE2-SpHIS5 ura3Δ::pPEX15-sfYFP- mCHERRY-PEX15-tPEX15- KANMX pex6Δ::URA | This paper | Euroscarf:VDY3447 | |
| strain, strain background (S. cerevisiae) | BY4741 PEX3-V5-AID-KANMX trp1Δ::pTDH3- mTURQUOISE2-PTS1-SpHIS5 | This paper | Euroscarf:VDY3528 | |
| strain, strain background (S. cerevisiae) | BY4741 PEX3-V5-AID-KANMX trp1Δ::pTDH3- mTURQUOISE2-PTS1-SpHIS5 leu2Δ::pTDH3-OsTIR1-CgLEU2 | This paper | Euroscarf:VDY3529 | |
| strain, strain background (S. cerevisiae) | BY4741 PEX3-V5-AID-KANMX trp1Δ::pTDH3- mTURQUOISE2-PTS1-SpHIS5 PEX11-sfYFP-mCHERRY-CgURA3 leu2Δ::pTDH3-OsTIR1-CgLEU2 | This paper | Euroscarf:VDY3609 | |
| strain, strain background (S. cerevisiae) | BY4741 PEX3-V5-AID-KANMX trp1Δ::pTDH3-mTURQ UOISE2-PTS1-SpHIS5 PEX11-sfYFP-mCHERRY- CgURA3 leu2Δ::pTDH3-OsTIR1- CgLEU2 msp1Δ::HPHMX | This paper | Euroscarf:VDY3610 | |
| strain, strain background (S. cerevisiae) | BY4741 PEX3-V5-AID-KANMX trp1Δ::pTDH3-mTUR QUOISE2-PTS1-SpHIS5 PEX12-sfYFP-mCHERRY- CgURA3 leu2Δ::pTDH3- OsTIR1-CgLEU2 | This paper | Euroscarf:VDY3611 | |
| strain, strain background (S. cerevisiae) | BY4741 PEX3-V5-AID-KANMX trp1Δ::pTDH3-mTURQ UOISE2-PTS1-SpHIS5 PEX12-sfYFP- mCHERRY-CgURA3 leu2Δ::pTDH3-OsTIR1- CgLEU2 msp1Δ::HPHMX | This paper | Euroscarf:VDY3612 | |
| strain, strain background (S. cerevisiae) | BY4741 PEX3-V5-AID-URA trp1Δ::pTDH3-mTURQU OISE2-PTS1-SpHIS5 ura3Δ::pPEX15-sfYFP- mCHERRY-PEX15-tPEX15-KANMX | This paper | Euroscarf:VDY3615 | |
| strain, strain background (S. cerevisiae) | BY4741 PEX3-V5-AID-URA trp1Δ::pTDH3-mTURQU OISE2-PTS1-SpHIS5 ura3Δ::pPEX15-sfYFP- mCHERRY-PEX15-tPEX15- KANMX msp1Δ::HPHMX | This paper | Euroscarf:VDY3616 | |
| strain, strain background (S. cerevisiae) | BY4741 PEX3-V5-AID-URA trp1Δ::pTDH3-mTURQU OISE2-PTS1-SpHIS5 ura3Δ::pPEX15-sfYFP- mCHERRY-PEX15-tPEX15- KANMX leu2Δ::pTDH3- OsTIR1-CgLEU2 | This paper | Euroscarf:VDY3613 | |
| strain, strain background (S. cerevisiae) | BY4741 PEX3-V5-AID-URA trp1Δ::pTDH3-mTURQU OISE2-PTS1-SpHIS5 ura3Δ::pPEX15-sfYFP- mCHERRY-PEX15- tPEX15-KANMX leu2Δ::pTDH3-OsTIR1- CgLEU2 msp1Δ::HPHMX | This paper | Euroscarf:VDY3614 | |
| strain, strain background (S. cerevisiae) | BY4741 TOM70- mTURQUOISE2-SpHIS5 trp1Δ::pTDH3-mCHERRY- PTS1-CgURA3 PEX22TMS-MSP1-YFP | This paper | Euroscarf:VDY3617 | |
| strain, strain background (S. cerevisiae) | BY4741 TOM70- mTURQUOISE2-SpHIS5 trp1Δ::pTDH3-mCHERRY- PTS1-CgURA3 TOM70TMS- MSP1-YFP | This paper | Euroscarf:VDY3618 | |
| strain, strain background (S. cerevisiae) | BY4741 TOM70- mTURQUOISE2-SpHIS5 ura3Δ::pPEX15-sfYFP- mCHERRY-pex15ΔC30- tPEX15-KANMX PEX22TMS-MSP1 | This paper | Euroscarf:VDY3619 | |
| strain, strain background (S. cerevisiae) | BY4741 TOM70- mTURQUOISE2-SpHIS5 ura3Δ::pPEX15-sfYFP- mCHERRY-pex15ΔC30- tPEX15-KANMX TOM70TMS-MSP1 | This paper | Euroscarf:VDY3620 | |
| strain, strain background (S. cerevisiae) | BY4741 TOM70- mTURQUOISE2-SpHIS5 trp1Δ::pTDH3-mCHERRY- PTS1-CgURA3 CgLEU2-Z4EV-pZD- PEX22TMS-MSP1 ura3Δ::CgTRP1-rTA- pTET-YFP-PEX15-tPEX15 | This paper | Euroscarf:VDY3621 | |
| strain, strain background (S. cerevisiae) | BY4741 TOM70- mTURQUOISE2-SpHIS5 trp1Δ::pTDH3-mCHERRY- PTS1-CgURA3 CgLEU2-Z4EV-pZD- TOM70TMS-MSP1 ura3Δ::CgTRP1-rTA- pTET-YFP-PEX15-tPEX15 | This paper | Euroscarf:VDY3622 | |
| antibody | Mouse anti-V5 monoclonal | Invitrogen | Cat #R960 | |
| antibody | Mouse anti-FLAG monoclonal (M2) | Sigma | Cat #F3165 | |
| antibody | Mouse anti-mCherry monoclonal (1C51) | Novus | Cat #NBP1-96752 | |
| antibody | Mouse anti-Pgk1 monoclonal | Thermo Fisher | Cat #459250 | |
| antibody | Rabbit anti-Hsc82 polyclonal | Abcam | Cat #ab30920 | |
| antibody | Rabbit anti-Sdh4 polyclonal | Pfanner Lab | Kind gift of N. Pfanner | |
| antibody | Mouse anti-GFP monoclonal | Sigma | Cat # 11814460001 | |
| antibody | Goat anti-mouse IgG (H + L)-HRP conjugated secondary | Bio-Rad | Cat #170–6515 | |
| recombinant DNA reagent | pKT211 (pKT-YFP- SpHIS5) (plasmid) | PMID: 15197731 | ||
| recombinant DNA reagent | pKT-mTURQUOISE2- SpHIS5 (plasmid) | This paper | ||
| recombinant DNA reagent | pKT-pTDH3-mTURQU OISE2-SpHIS5 (plasmid) | This paper | ||
| recombinant DNA reagent | pKT-pTDH3-mCHERRY- CgURA3 (plasmid) | This paper | ||
| recombinant DNA reagent | pNH604-rTA-pTET-YFP- PEX15 (plasmid) | This paper | ||
| recombinant DNA reagent | pNH604-rTA-pTET-YFP- pex15ΔC30 (plasmid) | This paper | ||
| recombinant DNA reagent | pFA6a-pPEX15-sfYFP- mCHERRY-PEX15- KANMX (plasmid) | This paper | ||
| recombinant DNA reagent | pFA6a-pPEX15-sfYFP- mCHERRY-pex15ΔC30- KANMX (plasmid) | This paper | ||
| recombinant DNA reagent | pFA6a-V5-AID- KANMX (plasmid) | PMID: 27798238 | ||
| recombinant DNA reagent | pFA6a-V5-AID- URA3 (plasmid) | PMID: 27798238 | ||
| recombinant DNA reagent | pFA6a-GFP-AID- HIS3M × 6 (plasmid) | PMID: 27798238 | ||
| recombinant DNA reagent | pNH605-OsTIR1 (plasmid) | PMID: 27798238 | ||
| recombinant DNA reagent | pNH605-Z4EV-pZD (plasmid) | This study | ||
| recombinant DNA reagent | p3FLAG-NATMX (plasmid) | PMID: 17719544 | ||
| peptide, recombinant protein | Proteinase K | Sigma | Cat #3115879001 | |
| commercial assay or kit | SuperSignal West Femto Substrate | Thermo Fisher | Cat #34095 | |
| chemical compound, drug | 3-indoleacetic acid (Auxin) | Sigma | Cat #I3750 | |
| chemical compound, drug | β-Estradiol | Sigma | Cat #E8875 | |
| chemical compound, drug | Doxycycline | Sigma | Cat #D3447 | |
| chemical compound, drug | Cycloheximide | Sigma | Cat #C7698 | |
| chemical compound, drug | Concanavalin A | MP Biomedicals | Cat #2195283 | |
| chemical compound, drug | 3 × FLAG peptide | Sigma | Cat #F4799 | |
| chemical compound, drug | Complete Protease Inhibitor Cocktail, EDTA-free | Sigma | Cat #5056489001 | |
| chemical compound, drug | Phenylmethylsulfonylfluoride | Sigma | Cat #78830 | |
| software, algorithm | R 3.3.0 | R foundation for Statistical Computing | www.R-project.org/ | |
| software, algorithm | ggplot2 R package | Hadley Wickham | www.ggplot2.org/ | |
| software, algorithm | reshape2 R package | Hadley Wickham | www.CRAN.R-project.org/package=reshape2 | |
| software, algorithm | gridExtra R package | Baptiste Auguie | www.CRAN.R-project.org/package=gridExtra | |
| software, algorithm | readr R package | Hadley Wickham, Jim Hester, Roman Francois | www.CRAN.R-project.org/package=readr | |
| software, algorithm | plyr R package | Hadley Wickham | www.CRAN.R-project.org/package=plyr | |
| software, algorithm | Cairo R package | Simon Urbanek and Jeffrey Horner | www.CRAN.R-project.org/package=Cairo | |
| software, algorithm | minpack.lm R package | Timur V. Elzhov, Katharine M. Mullen, Andrej-Nikolai Spiess, Ben Bolker | www.CRAN.R-project.org/package=minpack.lm | |
| software, algorithm | Python 3.5.2 | Python Software Foundation | www.python.org/ | |
| software, algorithm | scipy Python package | Open source | www.scipy.org/ | |
| software, algorithm | numpy Python package | Open source | www.numpy.org/ | |
| software, algorithm | scikit-image Python package | Open source | www.scikit-image.org/ | |
| software, algorithm | pyto_segmenter Python package | This paper | https://github.com/deniclab/pyto_segmenter | |
| software, algorithm | Various Python and R analysis scripts | This paper | https://github.com/deniclab/Weir_2017_Analysis |
Additional files
-
Transparent reporting form
- https://doi.org/10.7554/eLife.28507.021
Download links
A two-part list of links to download the article, or parts of the article, in various formats.
Downloads (link to download the article as PDF)
Open citations (links to open the citations from this article in various online reference manager services)
Cite this article (links to download the citations from this article in formats compatible with various reference manager tools)
The AAA protein Msp1 mediates clearance of excess tail-anchored proteins from the peroxisomal membrane
eLife 6:e28507.
https://doi.org/10.7554/eLife.28507


