Fibroblast growth factors (FGFs) prime the limb specific Shh enhancer for chromatin changes that balance histone acetylation mediated by E26 transformation-specific (ETS) factors
- University of Edinburgh, United Kingdom
- University of Bristol, United Kingdom
Figures
Figure 1
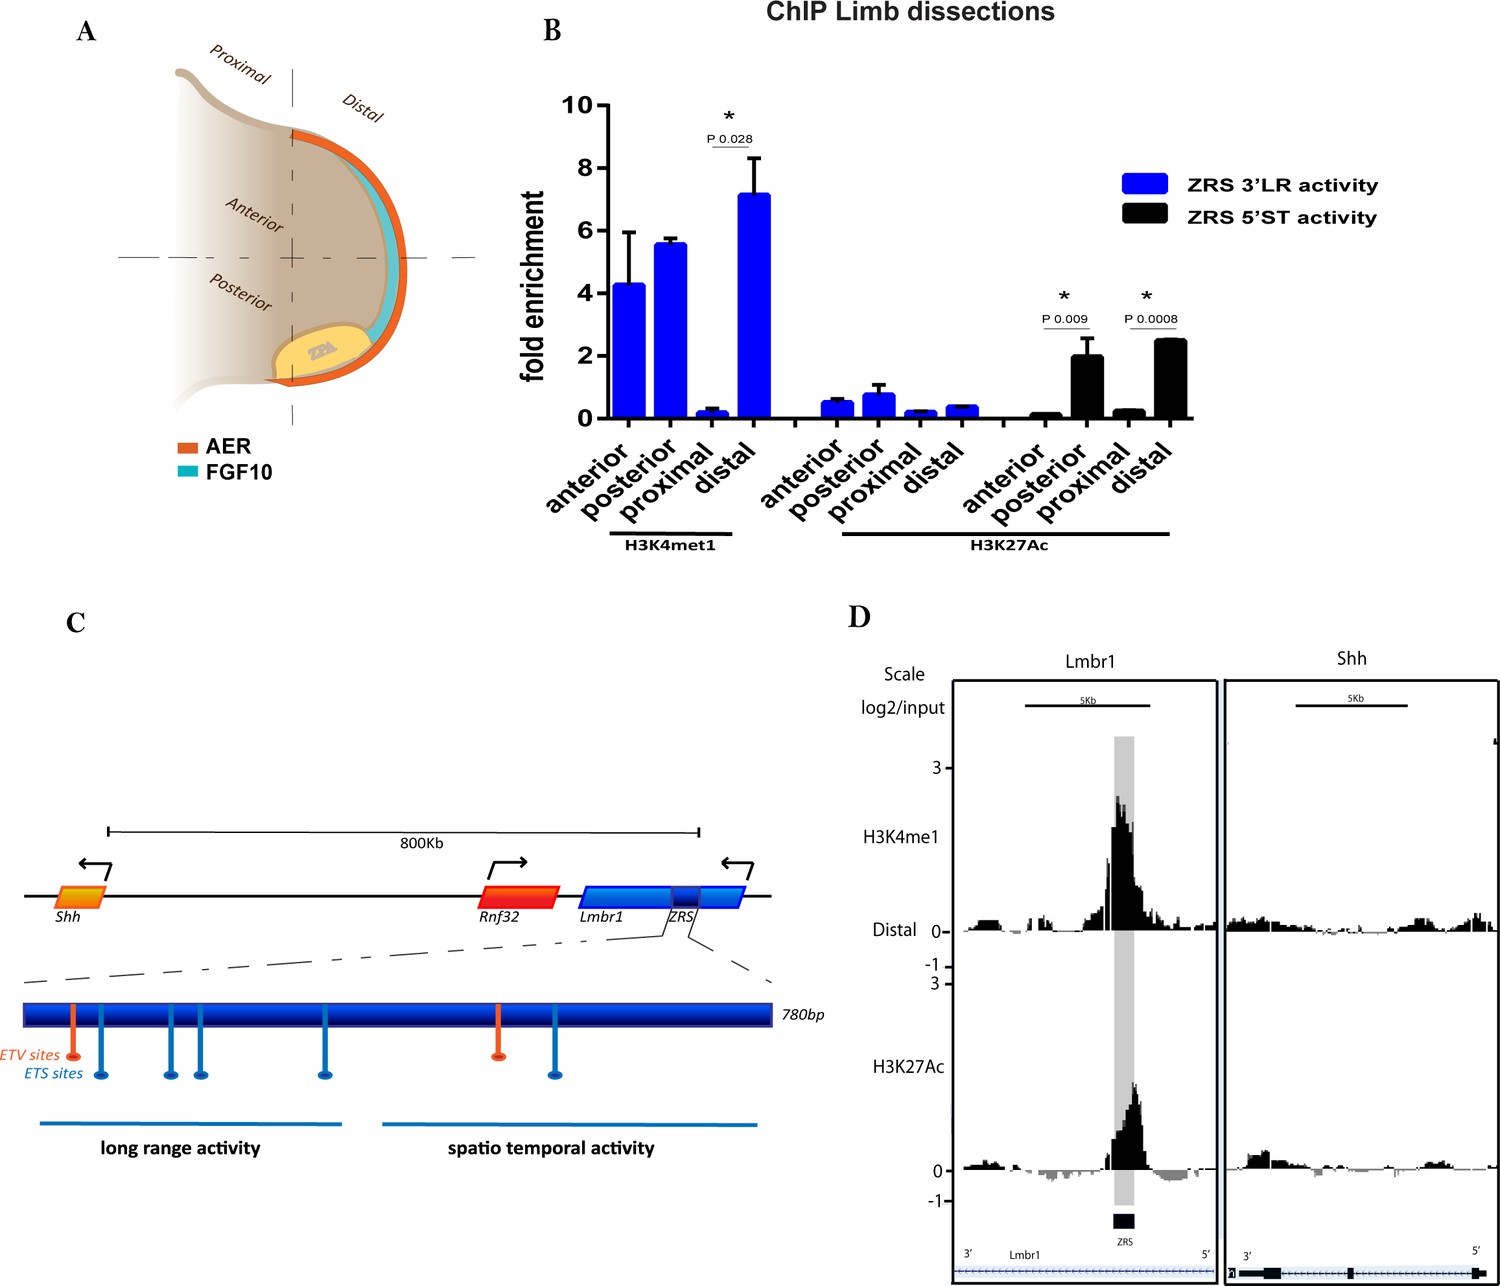
H3K4me1 and H3K27ac distribution over the ZRS in embryonic day 11.5 (E11.5) limb buds.
(A) Representation of an E11.5 mouse limb bud. The apical ectodermal ridge (orange), the ZPA (yellow) and FGF10 (cyan) are responsible for the anterior/posterior limb patterning and for directing the proliferation of the distal portion of the limb. The limb buds were dissected into anterior-posterior or distal-proximal regions. (B) Chromatin from E11.5 dissected limb buds tissue was enriched by chromatin immunoprecipitation (ChIP) for H3K4me1 and H3K27ac histone modifications. DNA was quantified by quantitative PCR. Means of fold enrichment over nonspecific IgG recoveries and ±SEM from two independent experiments are plotted. (C) Schematic of the ZRS (dark blue box) lying in intron 5 of Lmbr1 (blue box), 800 kb away from Shh gene. Within the ZRS (dark blue box) five ETS binding sites (light blue) and two ETV binding sites (orange) are highlighted. The primers used to evaluate the ChIP experiments are localized over the long-range activity and the spatiotemporal activity sequences, both indicated with a blue line (complete list of oligos in Supplementary file 1). (D) ChIP-on-chip analysis of distal mesenchyme from two biological replicates of E11.5 limb buds using antibodies to two different histone modifications (H3K4me1 and H3K27ac). Data for two different genomic regions, the fifth intron of Lmbr1 gene and the Shh gene, are shown. The y axis is the log2 for each ChIP/input DNA and the x axis represents a segment of DNA. The DNA region containing the ZRS is highlighted by the grey shading. As controls, the whole of the Shh coding region plus promoter (Shh) is shown.
Figure 2 with 3 supplements
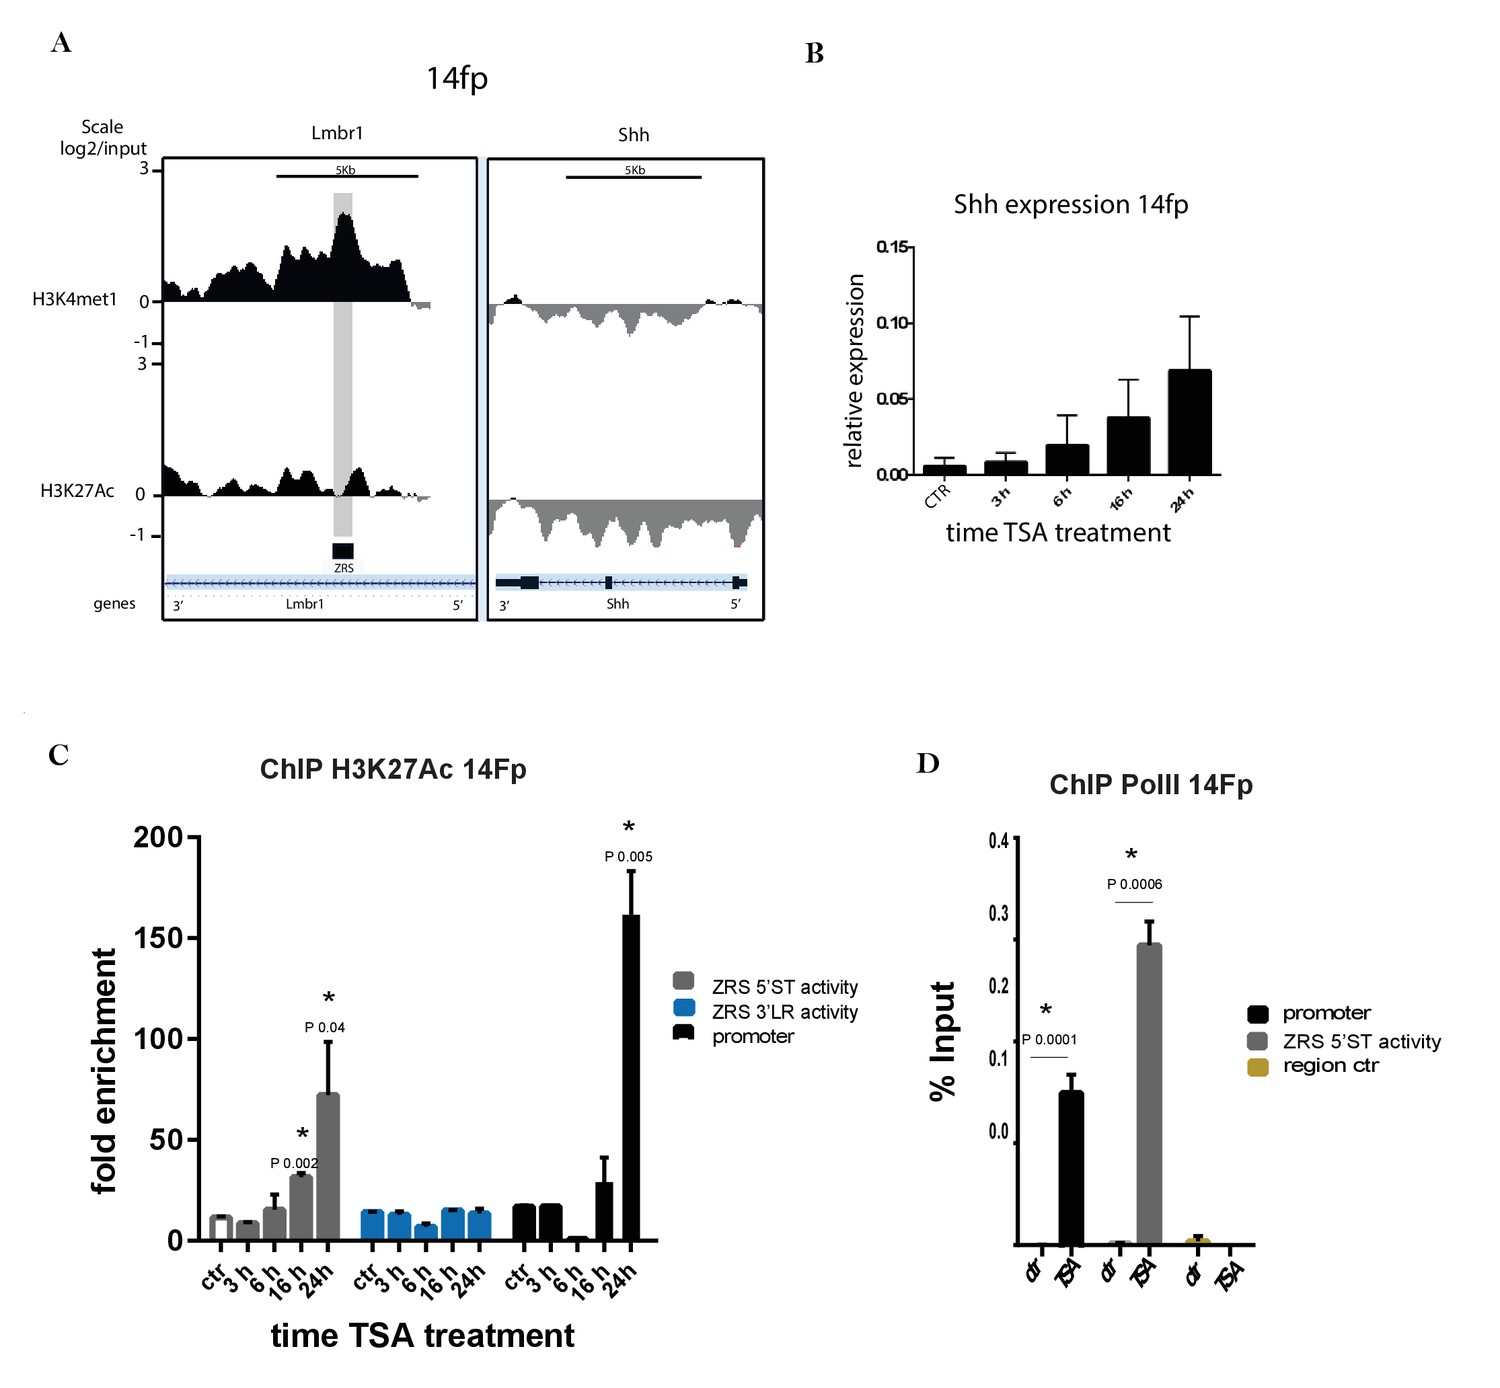
Trichostatin A (TSA) treatment activates Shh in a limb-derived cell line (14Fp).
(A) Chromatin immunoprecipitation (ChIP) from two biological replicates of E11.5 limb-derived cell line (14Fp cell line) using antibodies to two different histone modifications (H3K4me1 and H3K27ac) analysed by hybridizing to tiling microarrays. Summary is presented using two different genomic regions, the y axis is log2 for each ChIP/input DNA and the x axis represents a segment of DNA from the microarray. The DNA region containing the ZRS is highlighted by the grey shading. As controls, the whole of the Shh coding region plus promoter is shown. (B) Time course of the expression of Shh in E11.5 limb-derived cell line after TSA treatment detected by quantitative reverse transcriptase PCR. The Shh levels were evaluated relative to control and normalized to glyceraldehyde 3-phosphate dehydrogenase expression levels. Data points represent the average of triplicate determinations ± SEM. (C) Chromatin from 14Fp was harvested 3, 6, 18, and 24 hr after TSA treatment or 24 hr with DMSO as control (ctr). Shown are results from ChIP analysis using anti-H3K27ac antibody. Enrichment of H3K27ac at the 5’ spatiotemporal (5’ST) (grey), 3’ long range (3’LR) (blue) and promoter (black) was detected by quantitative PCR and represented as mean of fold enrichment/background (IgG) ± SEM over three biological replicates; a negative control region was analysed and did not give an appreciable signal (data not shown). (D) Shown are results from ChIP analysis using anti-RNA Pol II antibody after 24 hr of TSA treatment. Indicated are the shh promoter (black), the 5’ST (grey) and control region (yellow). Recovered DNA sequences were quantified as percentage of input and ±SEM from two independent experiments and are plotted. The IgG did give no detectable signal.
Figure 2—figure supplement 1
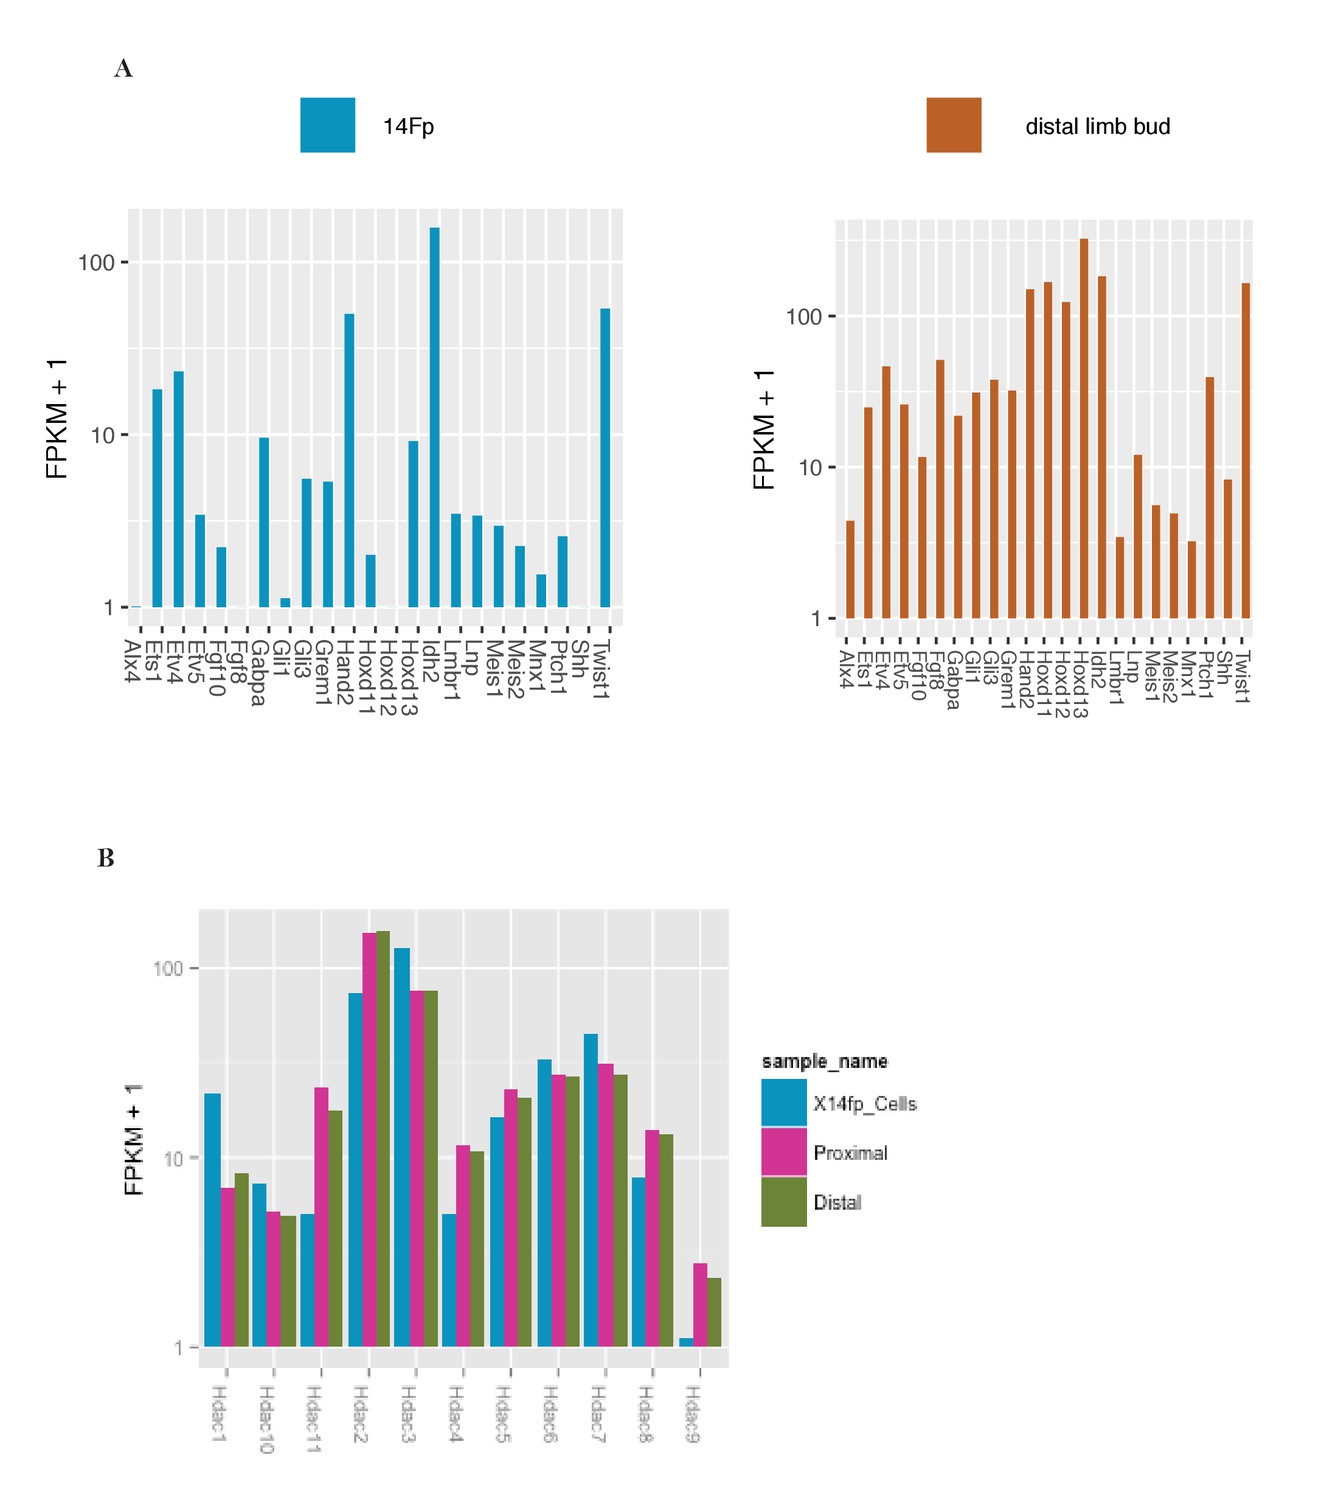
RNA-seq analysis of the 14Fp cell line and of the distal limb bud.
(A) RNA-seq analysis for 14Fp cell line and embryonic day 11.5 (E11.5) distal limb bud. Fragments per kilobase per million reads (FPKM + 1) are plotted for a selected number of genes involved in limb development. (B) RNA-seq analysis of E11.5 limb bud distal and proximal tissue and 14Fp cell line. The relative expression FPKM + 1 of Hdacs genes is represented in the chart. Two biological replicates were analysed for each sample.
Figure 2—figure supplement 2
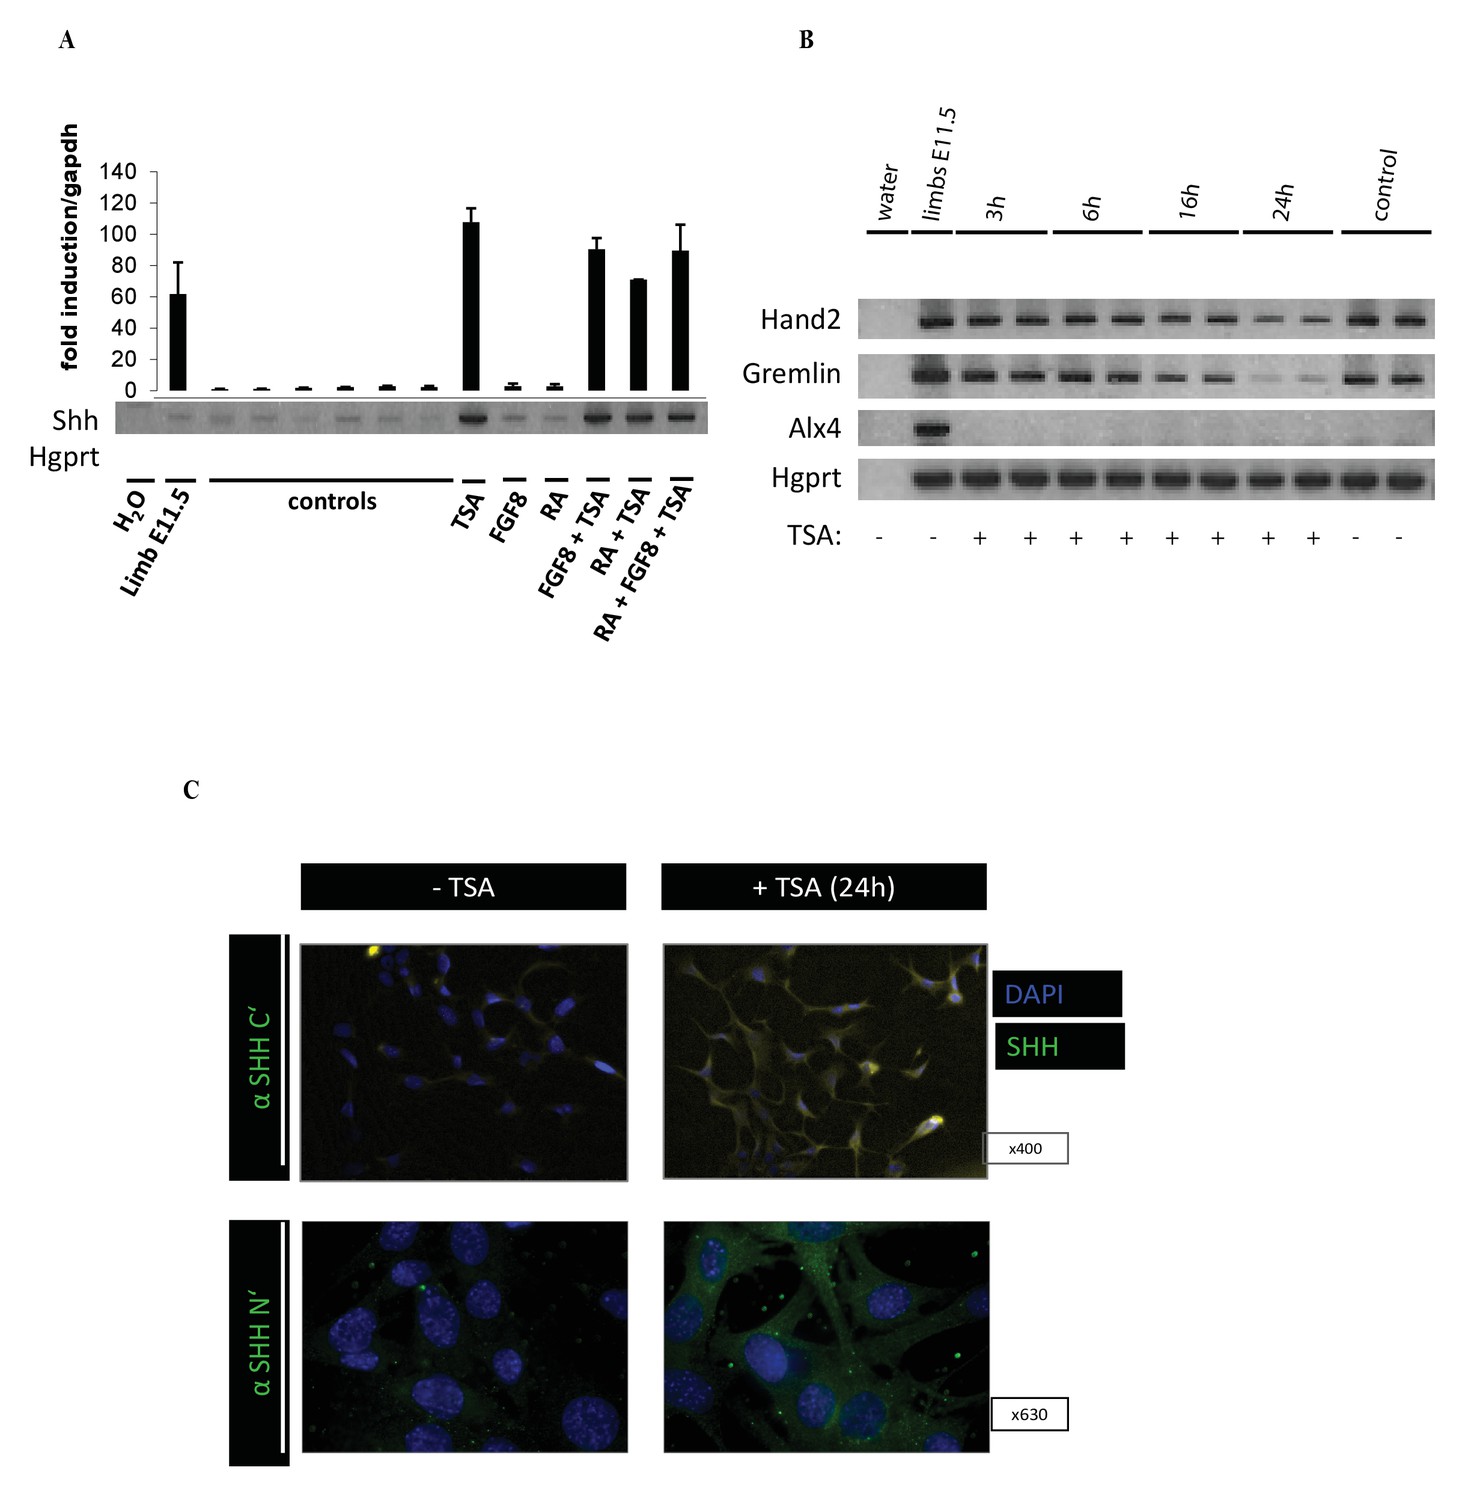
Induction of Shh expression in the 14Fp cell line.
(A) Reverse transcriptase (RT)-PCR and quantitative RT-PCR to detect the expression of Shh in embryonic day 11.5 (E11.5) limb specific cell line 14fp after treatment with trichostatin A (TSA), FGF8, RA, and their combinations. The Shh levels were evaluated relative to control and normalized to glyceraldehyde 3-phosphate dehydrogenase levels. RT-PCR was normalized to hypoxanthine-guanine phosphoribosyltransferase (HGPRT). Data points represent the average of triplicate determinations ± SEM. (B) RT-PCR from 14Fp harvested 3, 6, 16, and 24 hr after TSA treatment or 24 hr after DMSO treatment as control (ctr). Levels of the limb specific markers Hand2, Gremlin, and Alx4 were evaluated and normalized to HGPRT. (C) Immunofluorescence analysis of endogenous SHH in 14Fp cells treated without and with TSA. Cells were stained with antibodies directed against the SHH C-terminal and SHH N-terminal portion of the protein (ABCAM) 1/500, nuclei were counterstained with DAPI. An Alexa Fluor 488 (1/1000) (ThermoFisher) was used as the secondary antibody.
Figure 2—figure supplement 3
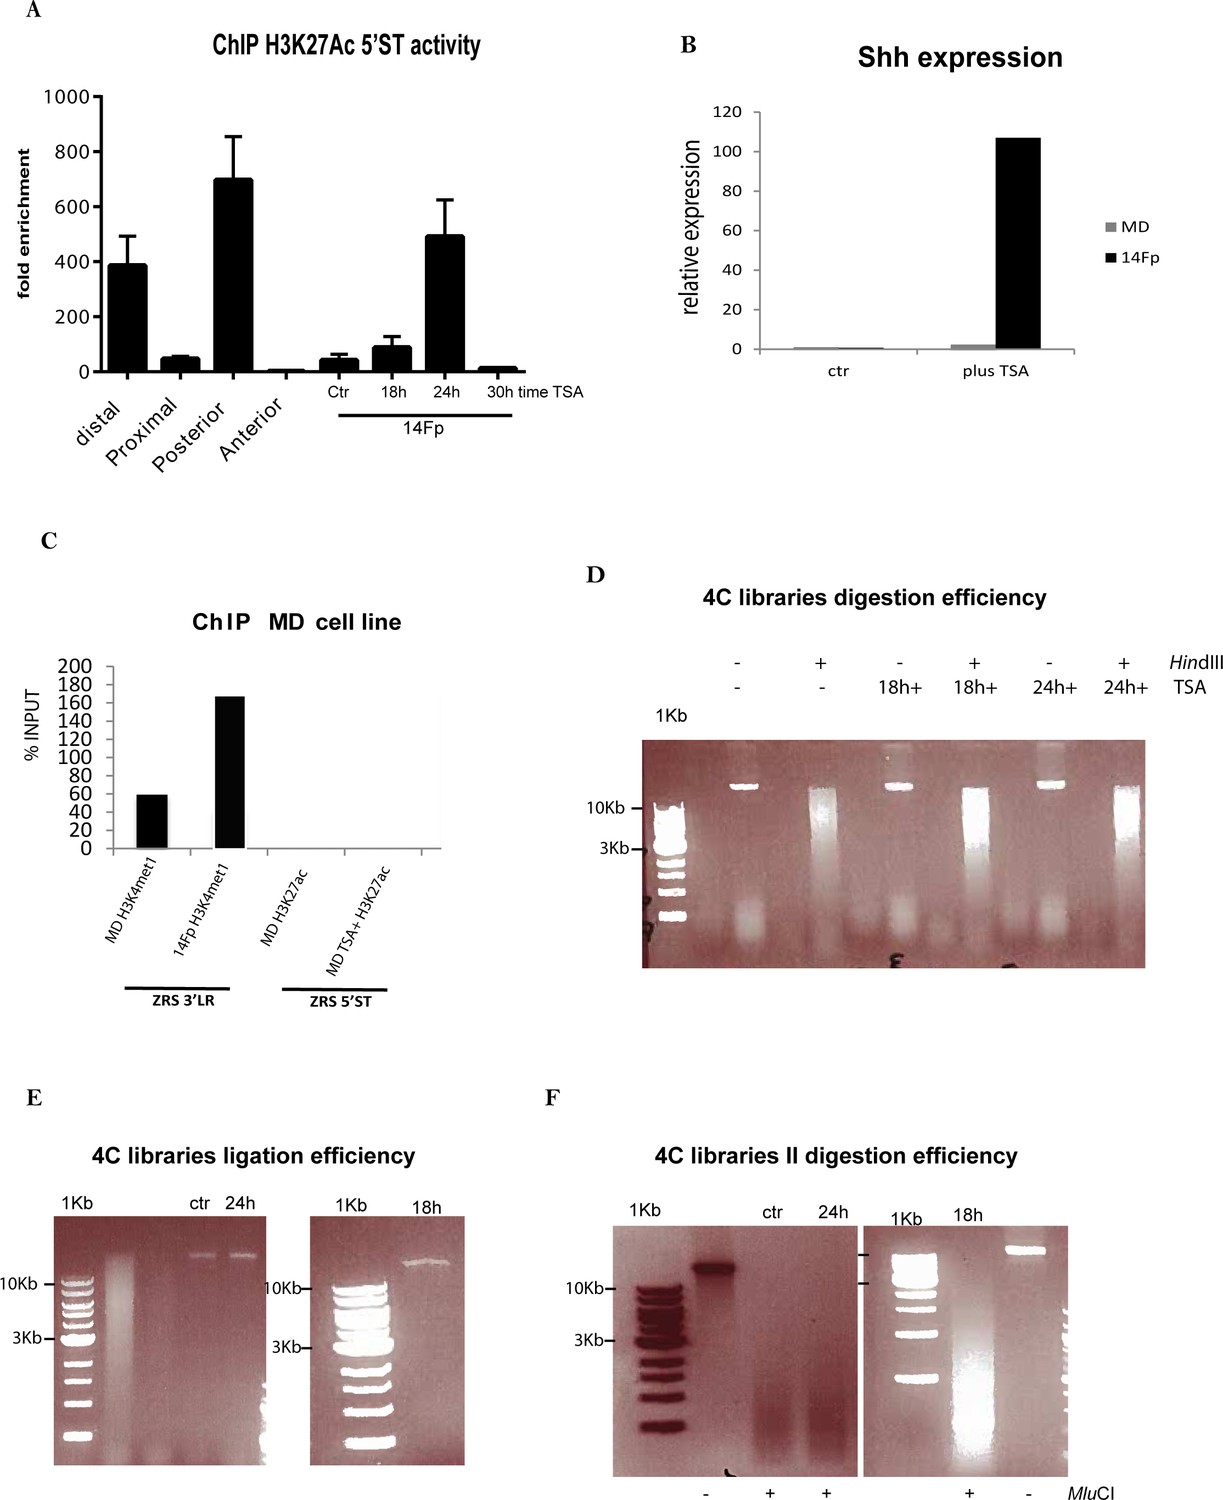
Specificity of Shh expression and efficiency of 4C library preparation after TSA induction in the 14Fp cell line.
(A) Chromatin was prepared from embryonic day 11.5 (E11.5) dissected limb buds (distal, proximal, anterior, and posterior) and from 14Fp cells 18, 24, and 30 hr after trichostatin A (TSA) treatment, 24 hr treatment with DMSO was used as control (ctr). Shown are results from chromatin immunoprecipitation (ChIP) analysis using anti-H3K27ac antibody. Enrichment of H3K27ac at the 5’ spatiotemporal (5’ST) region was detected by quantitative PCR (qPCR) and represented as mean of fold enrichment/background (IgG) ± SEM over three biological replicates. (B) Quantitative reverse transcriptase PCR to detect the expression of Shh in embryonic cell lines at E11.5 from the limb (14Fp) and the mandible (MD) after TSA treatment. MDs do not express Shh in response to the treatment. The Shh levels were evaluated relative to control and normalized to Gapdh levels. (C) ChIP of 14Fp and MD cell line using antibodies to two different histone modifications (H3K4me1 and H3K27ac) analysed by qPCR. Low enrichment of H3K4me1 with the 3’ long-range (3’LR) oligos set was observed in MD in comparison to 14Fp and no enrichment of H3K27ac with the oligos set 5’ST was observed after TSA treatment. (D) Gel with three 3C samples for the 4C experiment (ctr, 18 hr TSA, and 24 hr TSA). Undigested and HindIII digested DNA after crosslinking was run on a 0.6% agarose gel and appears as a high molecular weight smear running from roughly 12 to 4 kb showing that they were all efficiently digested. (E) Final 3C templates run as one tight band above 10 kb in size on 0.6% agarose gel for the ctr, 18 hr TSA, and 24 hr TSA ligated samples. On the first lane as control a digested template is loaded. (F) Final 3C libraries are redigested with MluCI and the products were run on a 1.2% agarose gel appearing as smear between roughly 0.3 and 1 kb. As control the ligated products are run together with the samples.
Figure 3 with 1 supplement
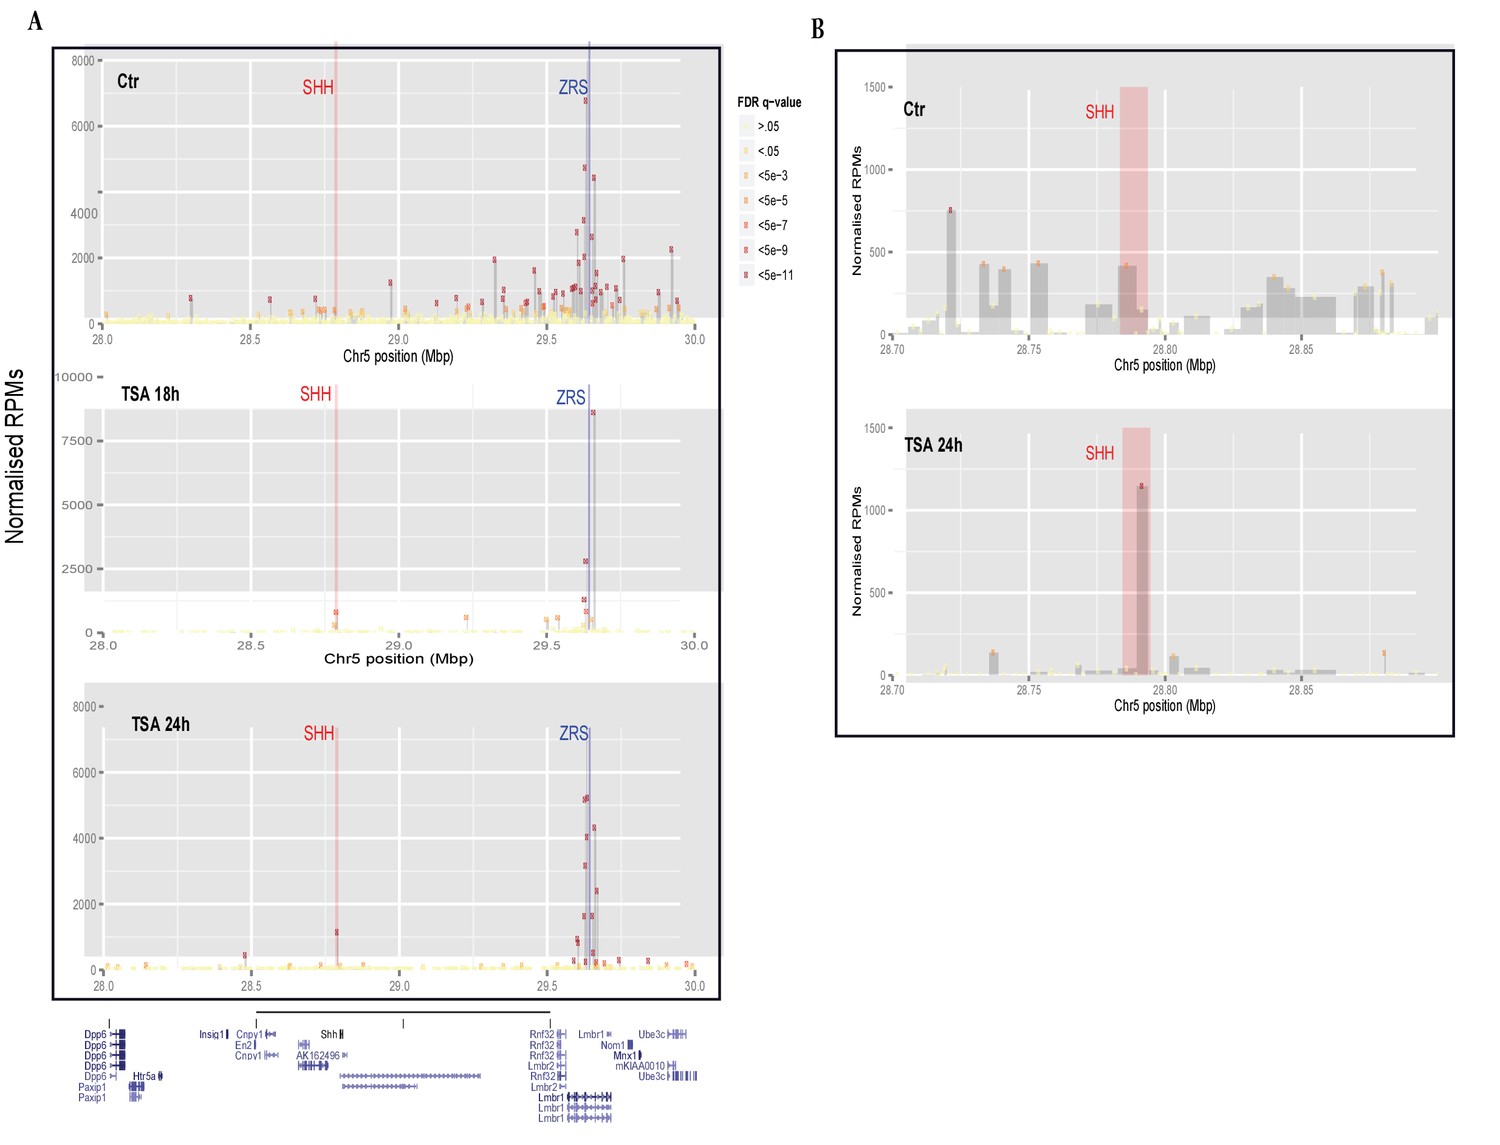
Trichostatin A (TSA) treatment induces a ZRS–SHH interaction.
(A) The profile of 4C-seq at the ZRS locus in 14Fp cells. Control and TSA treatment after 18 and 24 hr are shown. ZRS shown as the enhancer (anchor) bait fragment along an approximately 2 Mb region of chromosome 5 (UCSC genome browser view of chr5:28,000,000–30,000,000 (mm9)). The x axis represents the position on chromosome 5 and the y axis the normalized reads as read per million sequences (RPMs). Only highly significant interactions are shown (false discovery rate [FDR] q-value <5⇥105). The blue bar represents the location of the ZRS (bait) and the red bar represents the Shh gene. Each rectangle is a restriction fragment, the dots coloured at the top of each rectangle reflect the FDR q-value indicating the significance of the interaction (legend between A and B). (B) Focus on the Shh region (red bar in the zoomed-in view) shows the number of interactions of the bait region with SHH in both untreated and TSA treated (after 24 hr) samples.
Figure 3—figure supplement 1

Chromatin conformation capture (3C) analysis in 14Fp cells induced to expression Shh.
(A) Gel with four 3C samples (ctr and 24 hr trichostatin A (TSA), in biological replicates). Crosslinked DNA was either undigested or HindIII digested crosslinked DNA was run on 0.6% agarose gel. DNA appears as a high molecular weight smear running from roughly 12 to 4 kb showing that those were all efficiently digested. (B) Final 3C templates run as one tight band above 10 kb on a 0.6% agarose gel for the two biological replicates for samples either treated (+) or untreated (−) with TSA. (C) 3C analysis of TSA (black lines) and no TSA treated 14Fp cell line (red lines). The relative level of each ligation product (fragments −1 to 5) has been plotted according to its distance (in kb) from the 5’ end of the ZRS (see map below graphs). The bait primer and the TaqMan probe are listed in TS2 which were designed according to the position of the HindIII fragment at the 5’end of the ZRS. The mean of two biological replicates is plotted. The data were normalized to an internal region of the ZRS included in between two HindIII fragments (ZRS 3’ long-range ChIP, TS1). Below the graphs, the HindIII restriction fragments are indicated. HindIII fragments are numbered from fragments −1 to 5. The locations of the Shh gene and the promoter are indicated (black rectangles, black rectangle with arrow). The position of the bait is also indicated (black circle). (D) 3C analysis of posterior (black lines) and anterior (red lines) limb tissue dissected at embryonic day 11.5 (E11.5). (E) Representation of fold change of expressing Shh samples versus nonexpressing Shh samples. TSA treated 14Fp over untreated 14Fp relative crosslinking frequencies are represented with black bars and E11.5 posterior limb tissue over E11.5 anterior limb tissue is represented with grey bars. The means ± SEM are plotted.
Figure 4 with 1 supplement
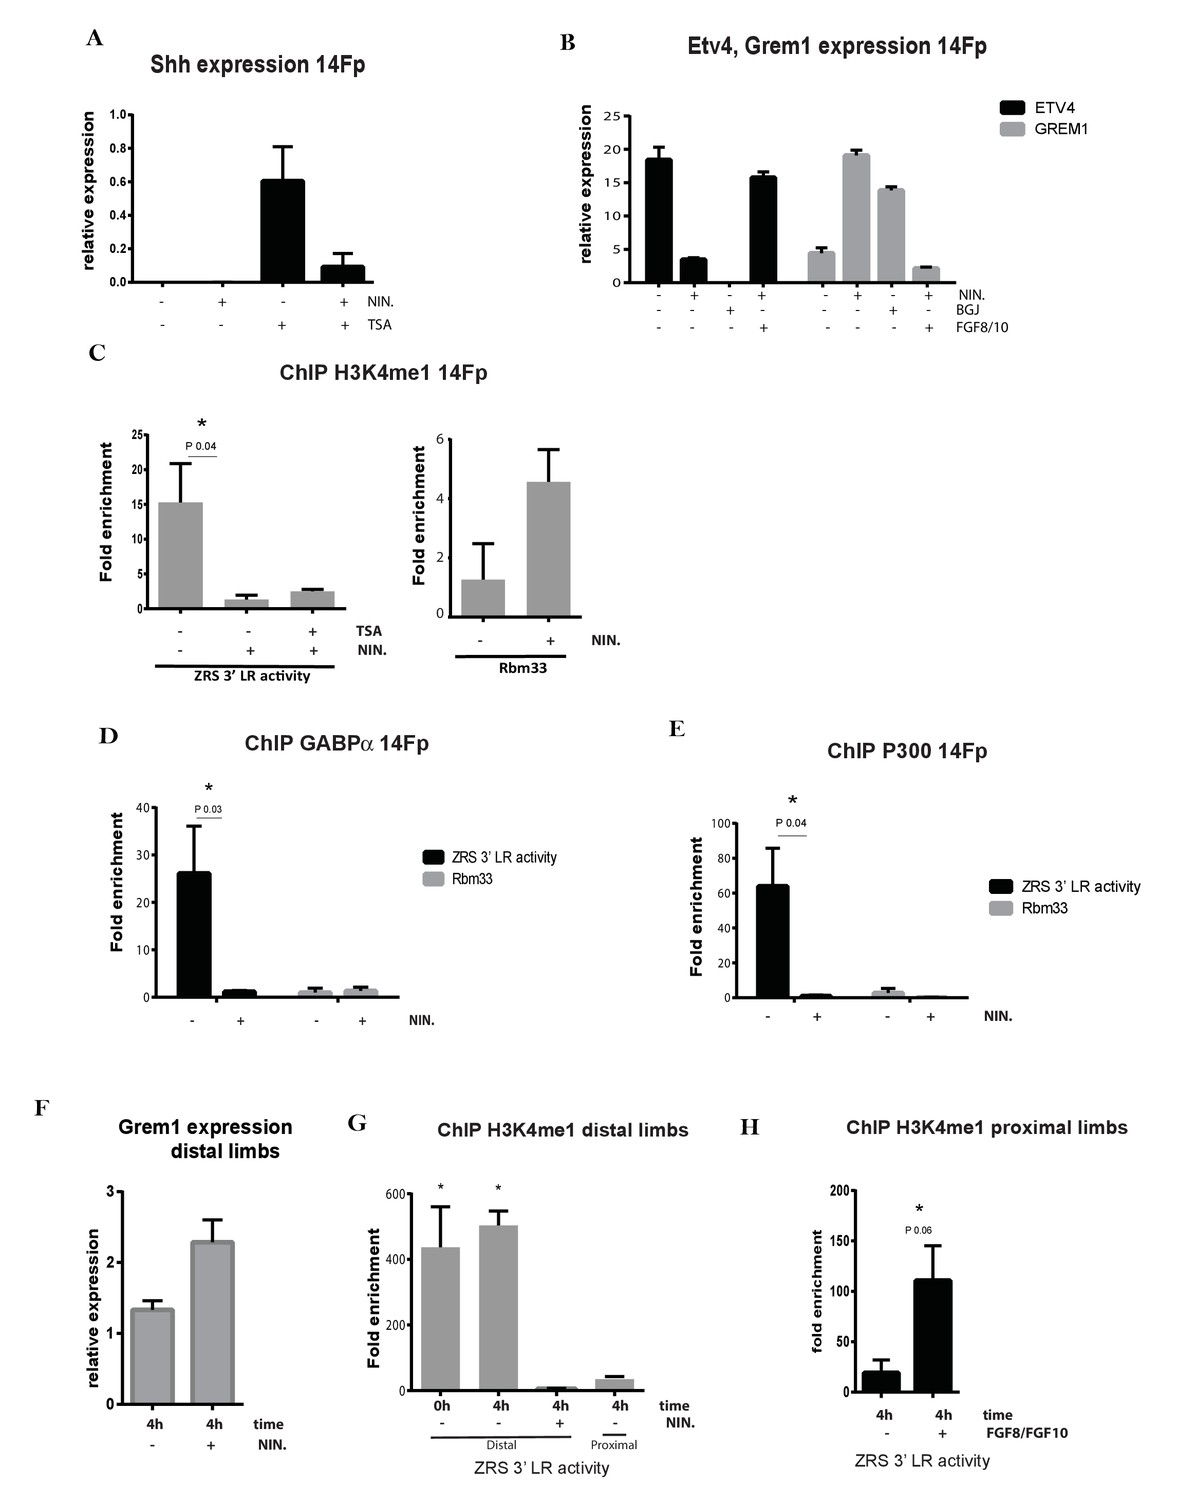
Fibroblast growth factors (FGFs) are crucial in priming Shh limb specific enhancer.
(A) Quantitative reverse transcriptase (qRT)-PCR was used to detect the expression levels of Shh in 14Fp cell line after trichostatin A (TSA) and nintedanib (NIN) treatment. The Shh levels were evaluated relative to control and normalized to glyceraldehyde 3-phosphate dehydrogenase levels. Data points represent the mean of three biological replicates ± SEM. (B) qRT-PCR to detect the expression of Grem1 (grey bars) and Etv4 (black bars) after 4 hr of NIN, with or without supplement of FGF8/10 for 6 hr. Also shown is BGJ398 (BGJ) treatment. Data points represent the average of duplicate determinations ± SEM. (C) Chromatin from the 14Fp cell line was harvested after TSA and NIN treatment and ChIP for H3K4me1 was carried out. DNA was quantified by q-PCR using the ZRS 3’ long range (3’LR) and Rbm33 oligos. Data are represented as mean ± SEM of the fold enrichment over nonspecific IgG recoveries from two independent experiments. (D–E) Chromatin immunoprecipitation (ChIP) analyses after NIN treatment where performed to further analyse the enrichment of the transcription factor GABPα and P300 over the ZRS (black) and on a specific genomic control region, Rbm33 intron (grey). DNA was quantified by q-PCR. Mean (±SEM) of the fold enrichment over nonspecific IgG recoveries from two independent experiments is plotted. (F) qRT-PCR to detect the expression of Grem1 in the distal limb bud after 4 hr of NIN treatment. (G) ChIP of distal and proximal limb tissue from limb buds using an antibody against H3K4me1. Distal limb tissue was treated for 4 hr with or without NIN. Proximal limb tissue was used as negative control. DNA was quantified by q-PCR and fold enrichment over nonspecific IgG recoveries using the ZRS 3’LR oligos and ±SEM from two independent experiments were plotted. (H) H3K4me1 ChIP of the proximal limb tissue at embryonic day 11.5 after 4 hr of exposure to FGF8 and FGF10. Fold enrichment over nonspecific IgG recoveries and ±SEM from two independent experiments are plotted. DNA was quantified by q-PCR using the ZRS 3’LR oligos.
Figure 4—figure supplement 1
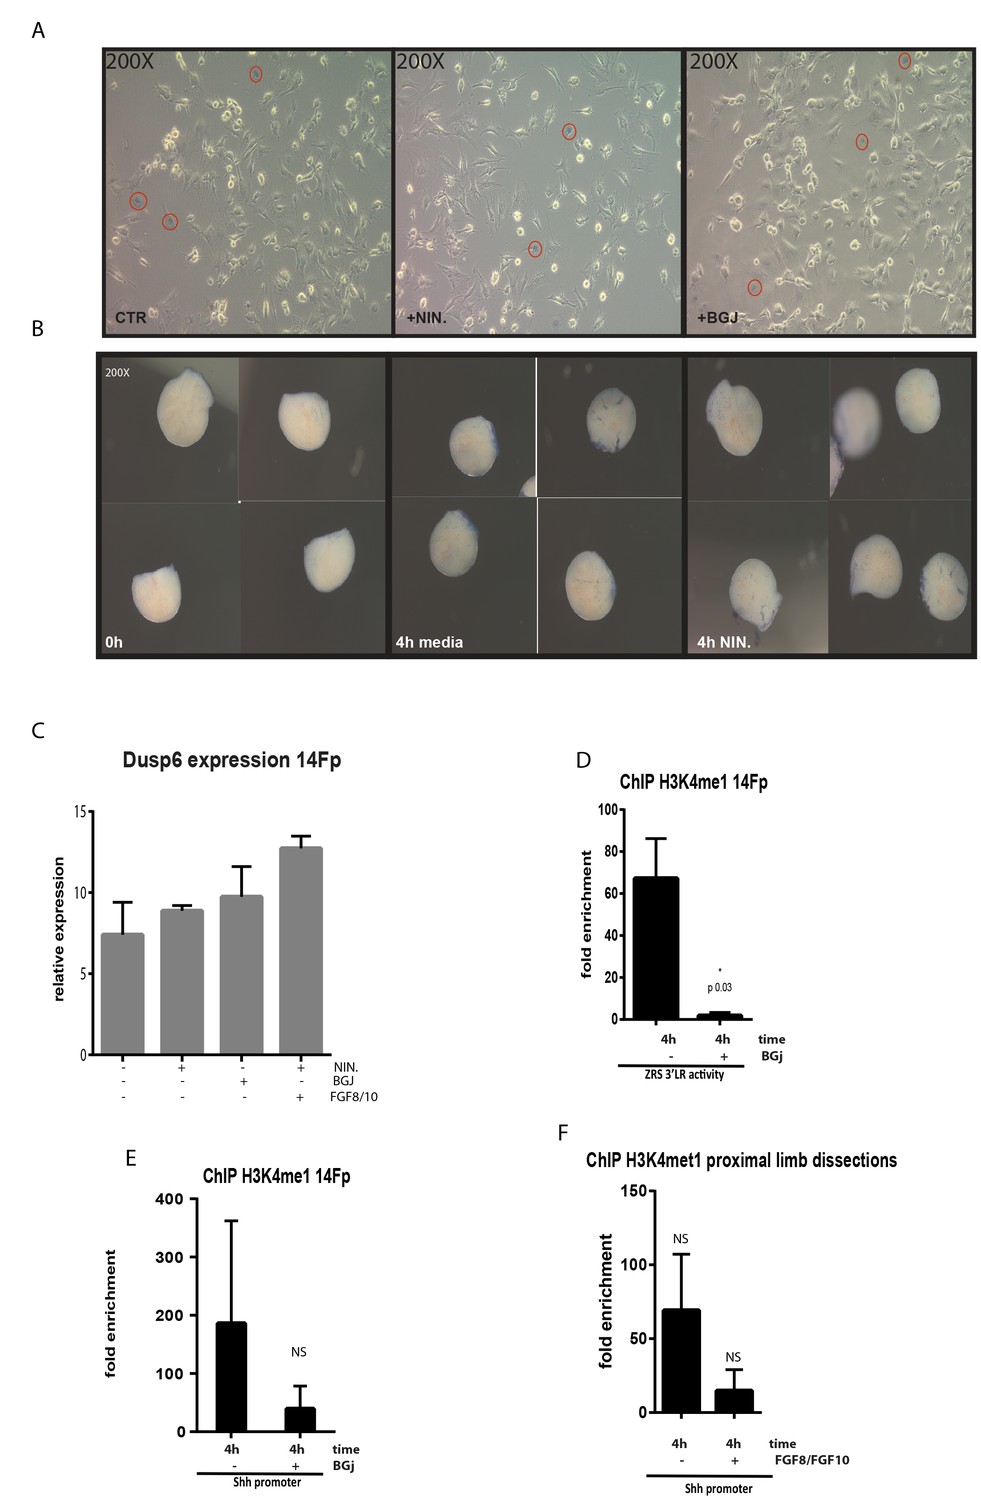
Analysis of 14Fp and limb bud cultures after treatment with the NIN and BJG inhibitors.
(A) Cell morphology of 14Fp was assessed after nintedanib (NIN) and BGJ398 (BGJ) treatments by microscopy. Cells were stained with 1× trypan blue and the number of blue nuclei assessed (red circles). No differences were observed between the different treatments and the control. (B) Trypan blue staining was performed on limb tissue dissected following a treatment of 4 hr with NIN and analysed by microscopy. Represented are time 0, 4 hr media alone or 4 hr with NIN. No differences were observed between the media alone or NIN treatment. (C) Quantitative reverse transcriptase (qRT)-PCR to detect the expression of Dusp6 after 4 hr of NIN, with or without supplement of FGF8/10 for 6 hr, and BGJ treatment. Data points represent the average of duplicate determinations ± SEM. (D) Chromatin from 14Fp was harvested after BGJ treatments and chromatin immunoprecipitation (ChIP) for H3K4me1 was carried out. DNA was quantified by q-PCR using the ZRS 3’ long range (3’LR) (D) and Shh promoter oligos (E) as control. Data are represented as mean ± SEM of the fold enrichment over nonspecific IgG recoveries from two independent experiments. (F) H3K4me1 ChIP of the proximal mesenchyme of embryonic day 11.5 (E11.5) limb buds after 6 hr of exposure to FGF8 and FGF10. Fold enrichment over nonspecific IgG recoveries and ± SEM from two independent experiments are plotted. DNA was quantified by q-PCR using Shh promoter oligos.
Figure 5 with 1 supplement

GABPα co-localizes with P300 and modulates ZRS acetylation status.
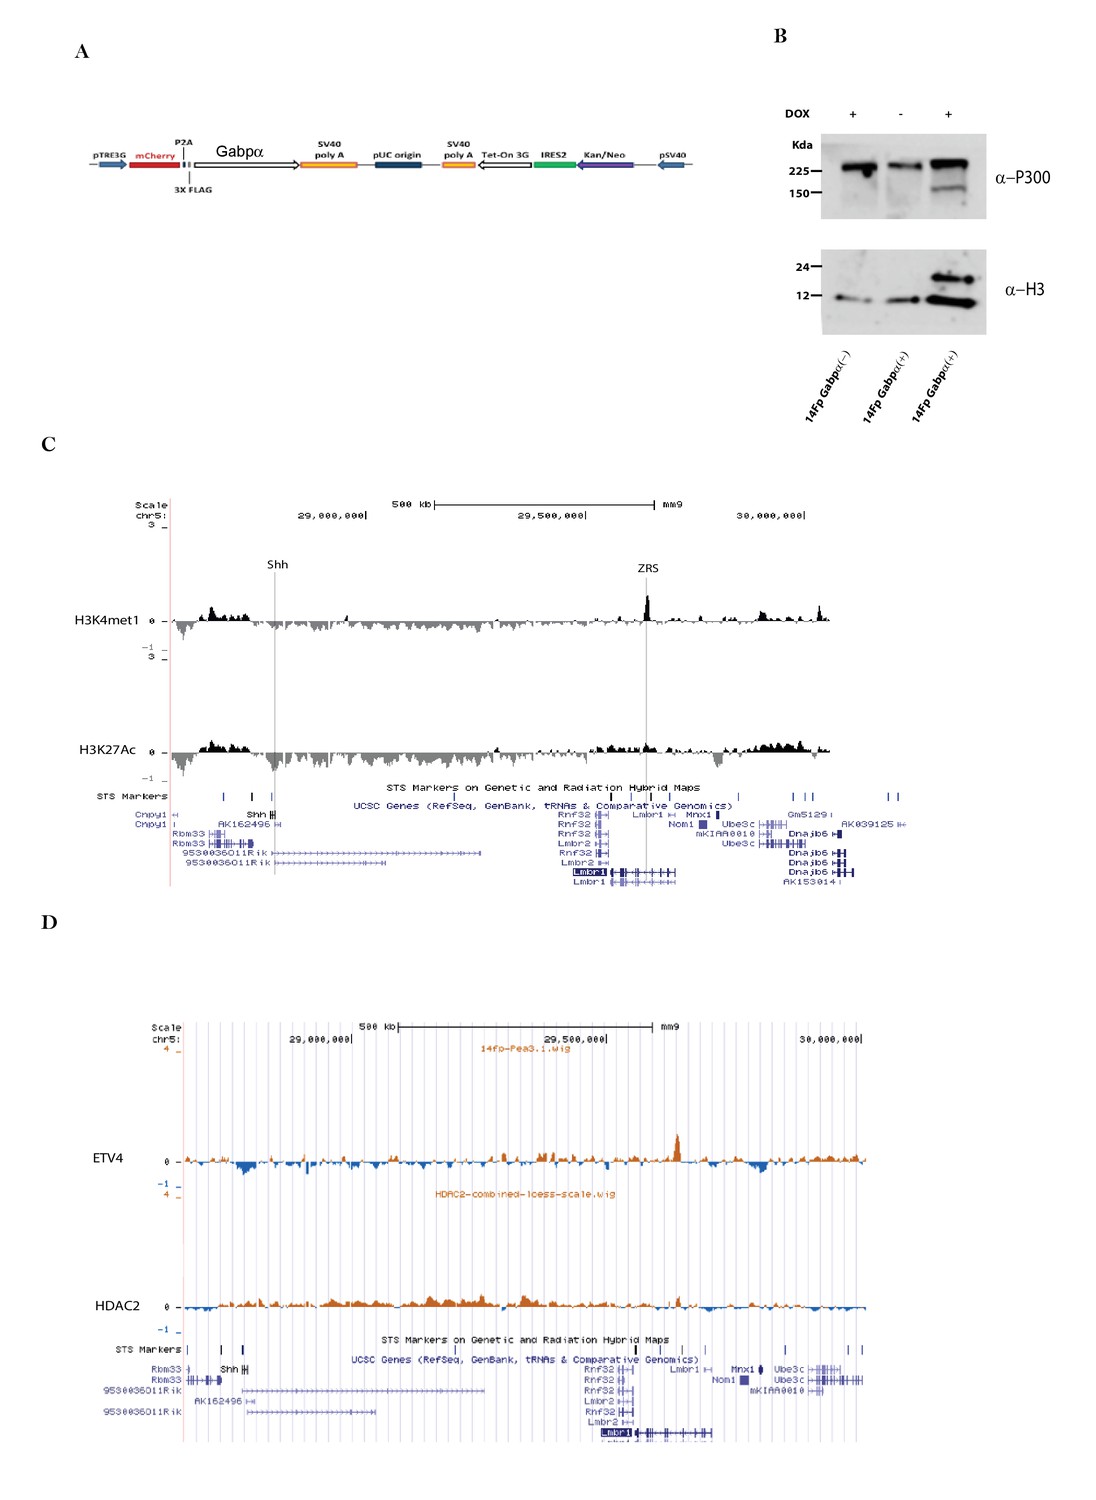
(A) Chromatin immunoprecipitation (ChIP) analysis from two biological replicates on the 14Fp cell line using GABPα and p300 antibodies using tiling microarrays. Summary is presented using two different genomic regions, the y axis is log2 for each ChIP/input DNA and the x axis represents a segment of DNA from the microarray. The DNA region containing the ZRS is highlighted by the grey shading. As controls, the whole of the Shh coding region plus promoter is shown. (B) 14Fp nuclear cell extracts from cells stably transfected with 3Xflag-Gabpα (Figure 5—figure supplement 1E) treated with or without doxycycline were analysed by immunoprecipitation with anti-p300 antibody followed by Western blot analysis with anti-flag-tag antibody. As control the empty vector plus doxycycline was used. (C) Western blot analysis with anti-GABPα of 14Fp nuclear cell extracts transiently transfected with Gabpα small interfering RNA (siRNA) (siGabp-α) or nonspecific siRNA (siCTR) and trichostatin A (TSA) treated. (D) Quantitative reverse transcriptase (qRT)-PCR was used to detect the messenger RNA (mRNA) levels of Shh (grey box) and Gabpα (black box) in 14Fp cells transfected with Gabpα siRNA or nonspecific siRNA. Eighteen hours after transfection, the cells were treated with 1 μM TSA for 24 hr. Shh and Gabpα levels were evaluated relative to control and normalized to glyceraldehyde 3-phosphate dehydrogenase levels from two biological replicates. (E) qRT-PCR to detect the mRNA levels of Shh (black box) and Gabpα (grey box) in 14Fp cells stably transfected with 3Xflag-Gabpα vector and an empty vector as control. Data points represent the mean ± SEM of three biological replicate. (F) Chromatin from 14Fp cells stably transfected with 3Xflag-Gabpα vector and an empty vector as control was analysed by ChIP for H3K27ac histone modification and ETV4 enrichment. DNA was quantified by q-PCR using the ZRS 5’ spatiotemporal (5’ST) activity oligo set. Data are represented as mean ± SEM of the fold enrichment over nonspecific IgG recoveries from two independent experiments. (G–H) Chromatin from 14Fp cells stably transfected with 3Xflag-Gabpα vector and an empty vector as control was analysed by ChIP for GABPα and P300. DNA was quantified by q-PCR using the ZRS 3’ long-range (3’LR) and 5’ST activity oligos sets. Average of percentage of input ±SEM from two independent experiments are plotted.
Figure 5—figure supplement 1
Analysis of 14Fp cells after mis-expression of of flag-tagged GABPa.
(A) Map of the plasmid pSV40-Tet3G- pTRE3G-mCherry-Gabpα, showing in schematic fashion the relative positions of notable features of the plasmid. (B) 14Fp nuclear cell extracts stably transfected with 3Xflag-Gabpα and with an empty vector treated with or without doxycycline were analysed by Western blot analysis with anti-P300 and normalized with anti-H3. (C–D) Zoom out of the ChIP-chip in 14Fp cell line using H3K27ac and H3K4me1 antibodies (C) and ETV4 and HDAC2 antibodies (D). Visualized is the region included between Shh gene and Lmbr1 gene.
Figure 6
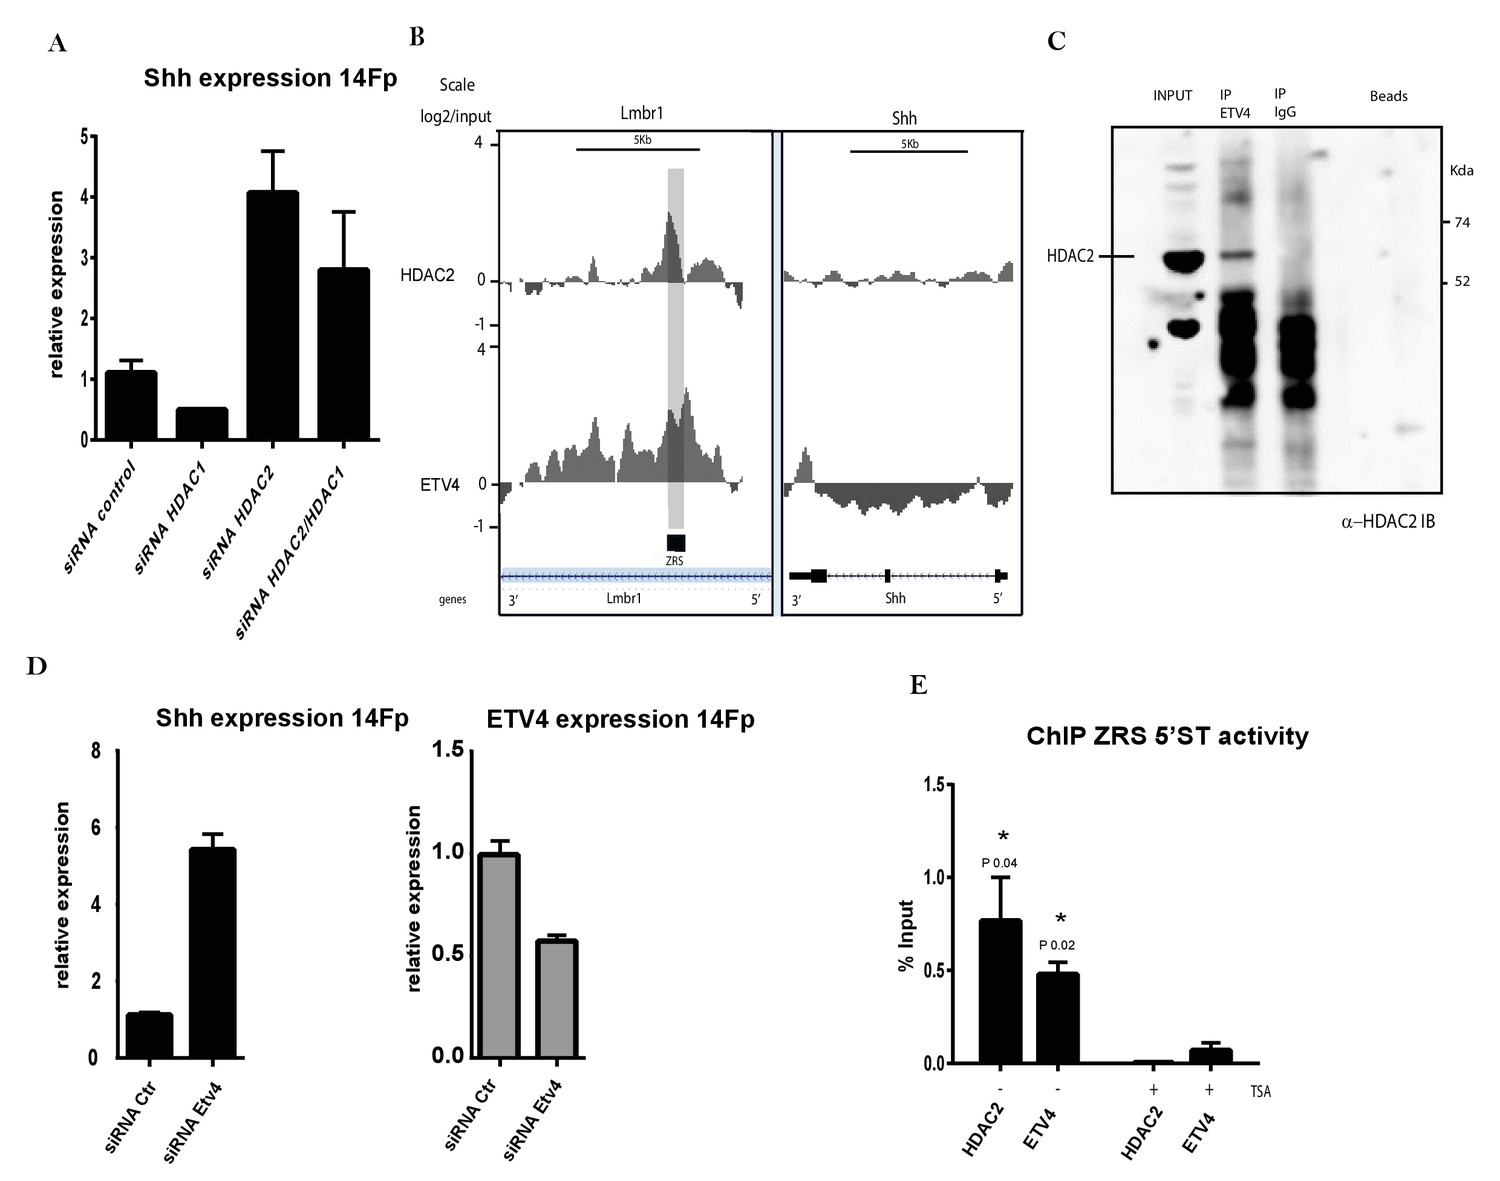
ETV4 acts as a repressor via interactions with HDAC2.
(A) Quantitative reverse transcriptase (qRT)-PCR to detect the messenger RNA (mRNA) levels of Shh (black box) in 14Fp cells transfected with HDAC1 and HDAC2 small interfering RNA (siRNA) either alone or combined and with nonspecific siRNA as control. Data were collected after 18 hr of transfection. Shh levels were evaluated relative to control and normalized to glyceraldehyde 3-phosphate dehydrogenase levels. Data points represent the average of triplicate determinations ± SEM. (B) ChIP from two biological replicates using the 14Fp cell line and anti-ETV4 and HDAC2 antibodies analysed by hybridizing to tiling microarrays (Figure 5—figure supplement 1B). Summary is presented using two different genomic regions, the y axis is log2 for each ChIP/input DNA and the x axis represents a segment of DNA from the microarray. The DNA region containing the ZRS is highlighted by the grey shading. As controls, the whole of the Shh coding region plus promoter is shown. (C) 14Fp nuclear cell extracts were analysed by immunoprecipitation with anti-ETV4 and IgG antibodies followed by Western blot analysis with anti-HDAC2. (D) qRT-PCR to detect the mRNA levels of Shh (black box) and Etv4 (grey box) in 14Fp cells transiently transfected with ETV4 siRNA (siRNA Etv4) or nonspecific siRNA (siRNA Ctr). Data points represent the average of triplicate determinations ± SEM. (E) Shown are results from chromatin immunoprecipitation (ChIP) analysis using anti-HDAC2 and ETV4 antibody after 24 hr of trichostatin A (TSA) treatment. Recovered DNA sequences were quantified by quantitative PCR using 5’ spatiotemporal (5’ST) oligo set. Average percentage of input and ±SEM from two independent experiments are plotted. The IgG did not give detectable signal.
Figure 7
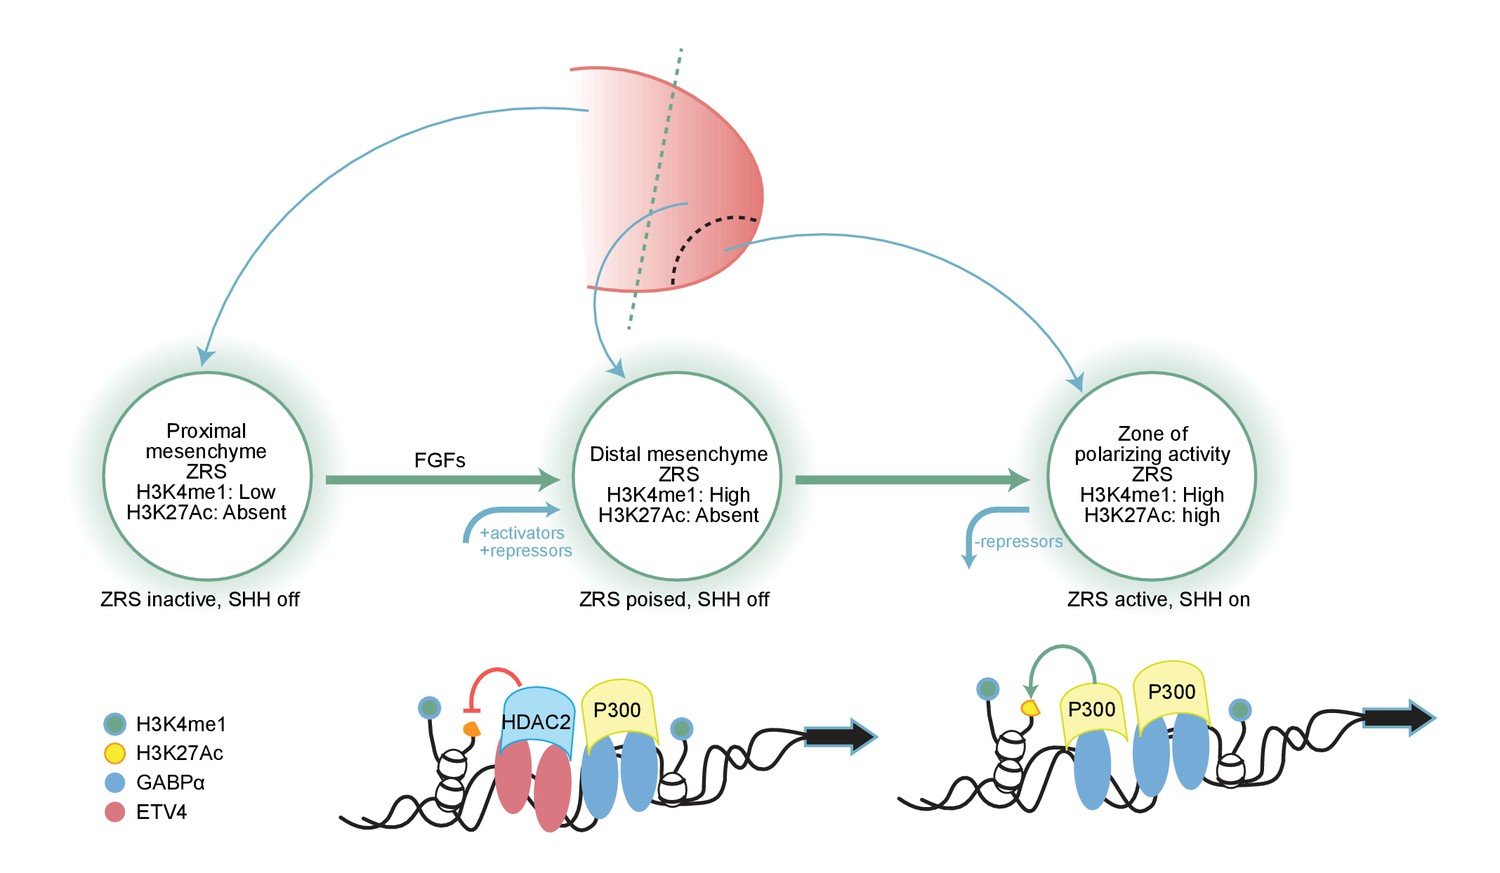
Fibroblast growth factor (FGF) signalling is responsible for priming the ZRS for local chromatin changes mediated by E26 transformation-specific factors.
Summary model showing how FGF signalling in the distal mesenchyme regulates the ZRS poised state and that this allows the stepwise recruitment of transcriptional regulators to the ZRS. FGF signalling has a dual fundamental role; firstly, as an activator it is responsible for priming and maintaining the ZRS and secondly, as a repressor inducing the expression on ETV4 which restricts the expression of the ZRS. ETV4 (red oval) interacts with HDAC2 (light blue rectangle) to maintain the inactivity of the poised ZRS enhancer throughout the distal mesenchyme, while GABPα (blue oval) acts within the ZPA domain to recruit p300 (yellow rectangle), trigger H3K27 (orange circle) acetylation, and thereby activate Shh transcription.
Additional files
-
Supplementary file 1
(A) List of oligos used for qRT-PCR, q-PCR and ChIP.
(B) List of oligos used for 3C and 4C analysis.
- https://doi.org/10.7554/eLife.28590.016
-
Transparent reporting form
- https://doi.org/10.7554/eLife.28590.017
Download links
A two-part list of links to download the article, or parts of the article, in various formats.
Downloads (link to download the article as PDF)
Open citations (links to open the citations from this article in various online reference manager services)
Cite this article (links to download the citations from this article in formats compatible with various reference manager tools)
Fibroblast growth factors (FGFs) prime the limb specific Shh enhancer for chromatin changes that balance histone acetylation mediated by E26 transformation-specific (ETS) factors
eLife 6:e28590.
https://doi.org/10.7554/eLife.28590


