The C. elegans neural editome reveals an ADAR target mRNA required for proper chemotaxis
- Brian A Yee

- Aidan C Manning
- Suba Rajendren
- Pranathi Vadlamani
- Emily C Wheeler
- Alain Domissy
- Michael C Washburn
- Gene W Yeo
- Heather A Hundley
- Indiana University, Indiana
- University of California at San Diego, United States
- Agency for Science, Technology and Research, Singapore
- National University of Singapore, Singapore
Figures
Figure 1
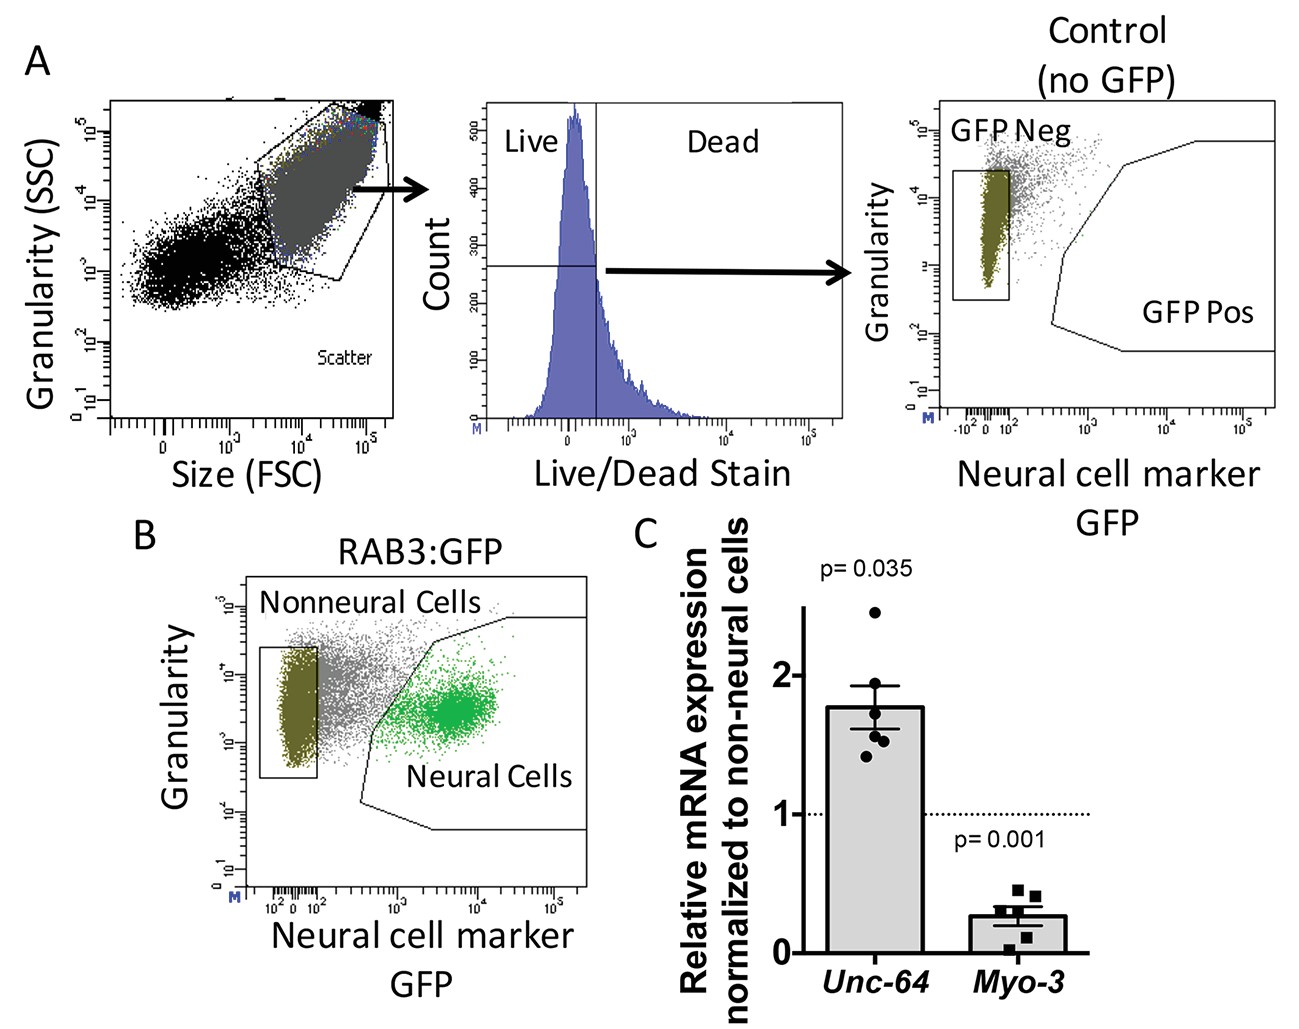
Neural cell isolation.
(A) To establish gating parameters L1 worms were digested into a single cell suspension and stained with a live/dead stain. SSC (side scatter) and FSC (forward scatter) were used to select the single cell population and dead cells from this population were excluded. FACS was used to isolate single live neural (GFP) and non-neural cells from (B) transgenic C. elegans expressing GFP driven by the neural promoter (rab3). (C) mRNA expression of neural syntaxin (unc-64) and non-neural myo-3 were determined by qRT-PCR relative to the housekeeping gene gpd-3 for 6 independent biological replicates. Levels of mRNA expression in control non-neural cells were normalized and set to 1 (dotted line) and relative expression of neural mRNA was plotted with SEM. Student‘s t-test comparing non-neural to neural for each gene.
Figure 2
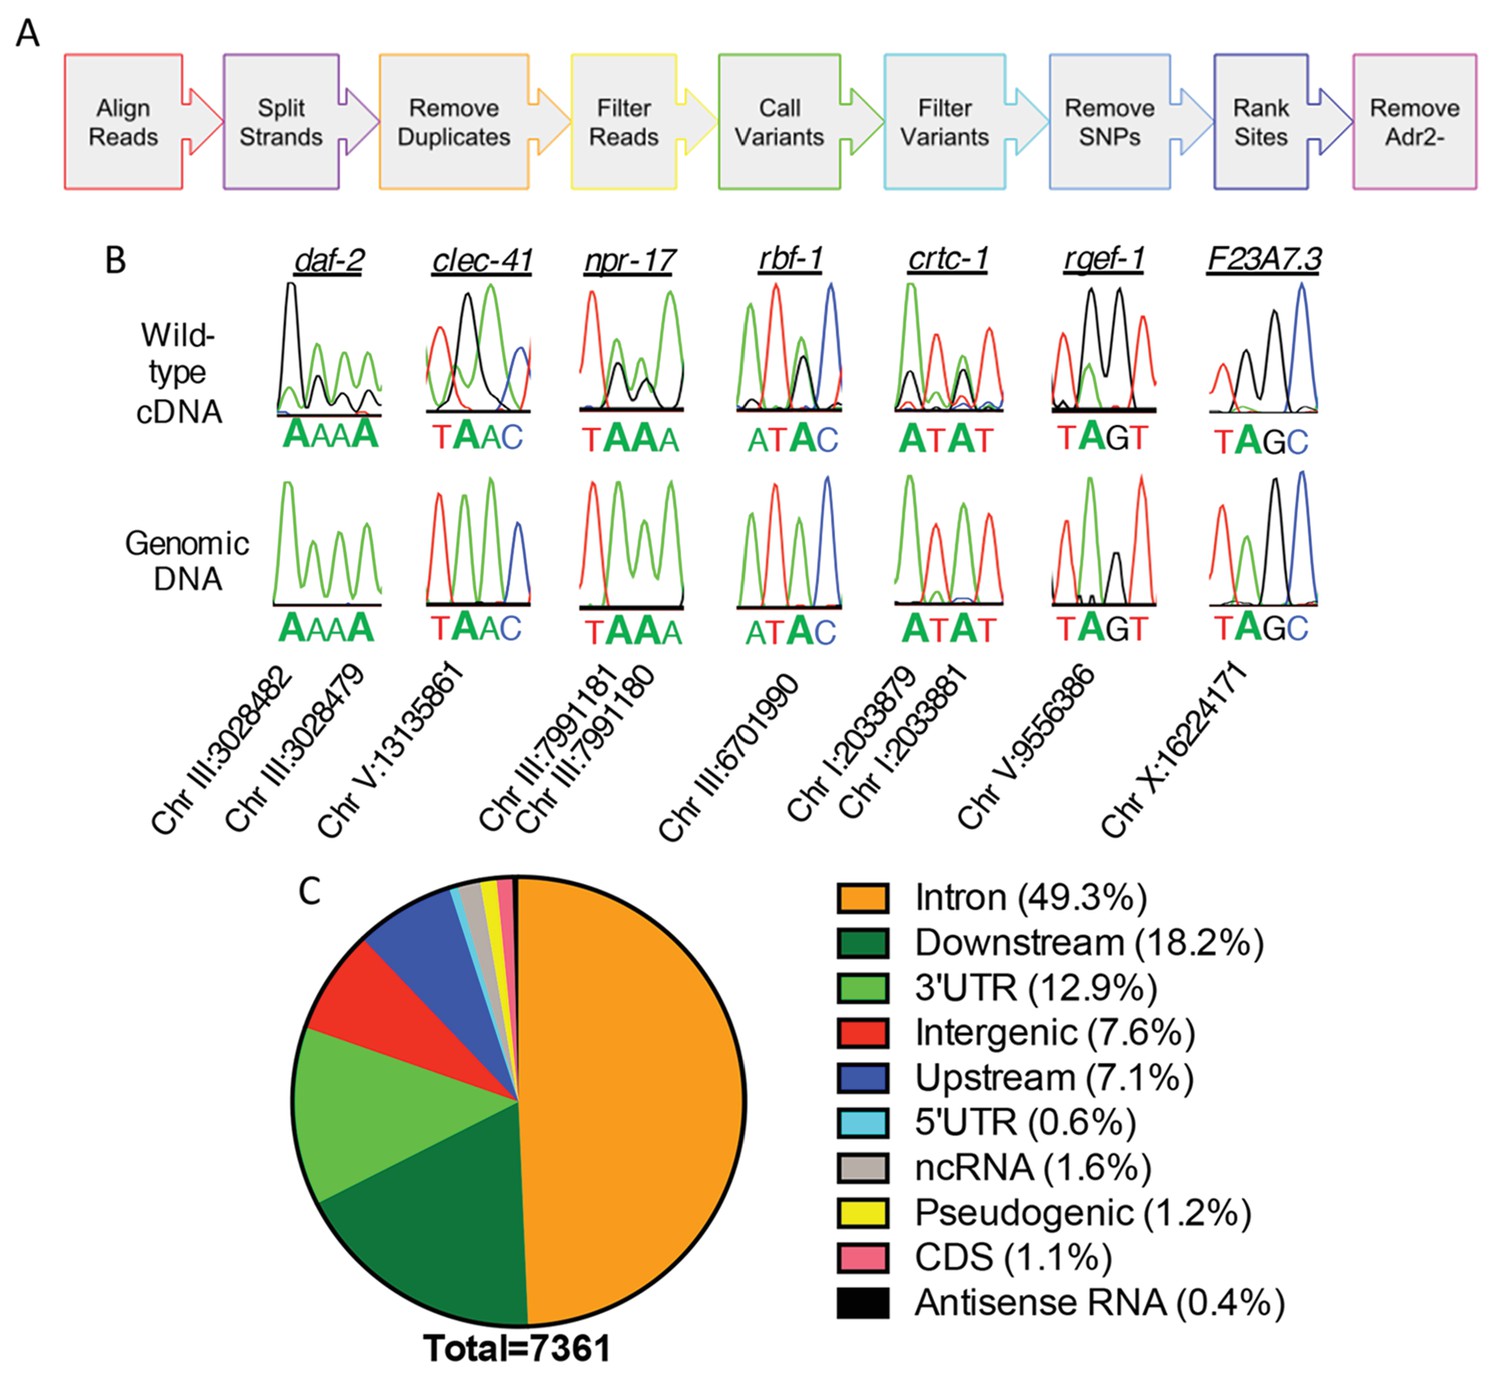
Neural editome of C. elegans.
(a) RNA-seq libraries generated from C. elegans neural cells were sequenced using an Illumina NextSeq500 from 3 independent biological replicates. The data was processed with our SAILOR software with a series of steps (represented by each colored arrow) to identify A-to-I editing sites. (B) Sanger sequencing chromatograms of cDNA amplified from wild-type RNA and genomic DNA surrounding editing sites predicted by the bioinformatics pipeline. The specific gene analyzed is listed above the chromatograms and the chromosomal coordinates (ce11) for each editing site are listed below each chromatogram. The nucleotides at each position are represented with a different color (Green = Adenosine, Black = Guanosine, Blue = Cytidine, Red = Thymidine). A-to-I editing sites can be identified by peaks that are green (A) in the amplified genomic DNA and black (G) or a mixture of black (G) and green (A) in the cDNA. (C) Distribution of predicted neural A-to-I editing sites based on location in the genome (intron, coding sequence (CDS), 3’ UTR, 5’ UTR, noncoding RNA (ncRNA), antisense RNA, pseudogenic regions, 2000 bp upstream or downstream or intergenic).
Figure 3
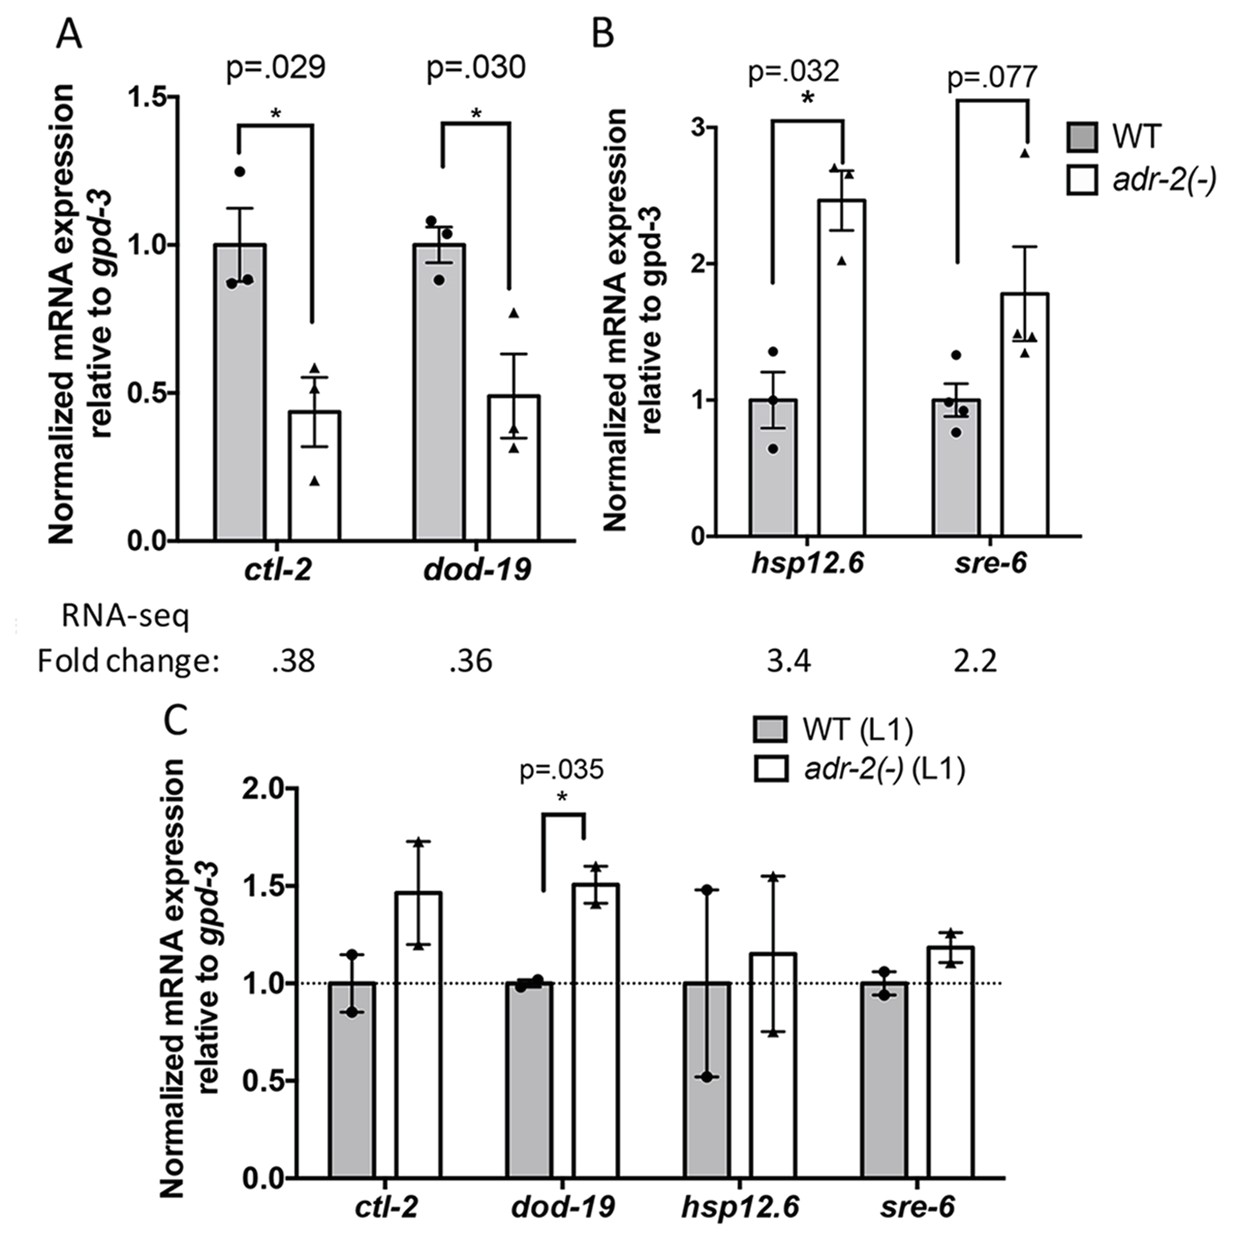
Differential gene expression in neural cells isolated from adr-2(-) worms.
RNA was isolated (A–B) from wild-type (WT) and adr-2(-) neural cells (3 or 4 biological replicates) or (C) WT and adr-2(-) L1 whole worms (2 biological replicates). qRT-PCR was used to determine the relative expression of mRNA. Expression levels of the indicated genes were normalized to expression levels of the endogenous control gpd-3 and plotted with SEM. Student’s t-tests comparing WT to adr-2(-), *p<0.05.
Figure 4 with 1 supplement
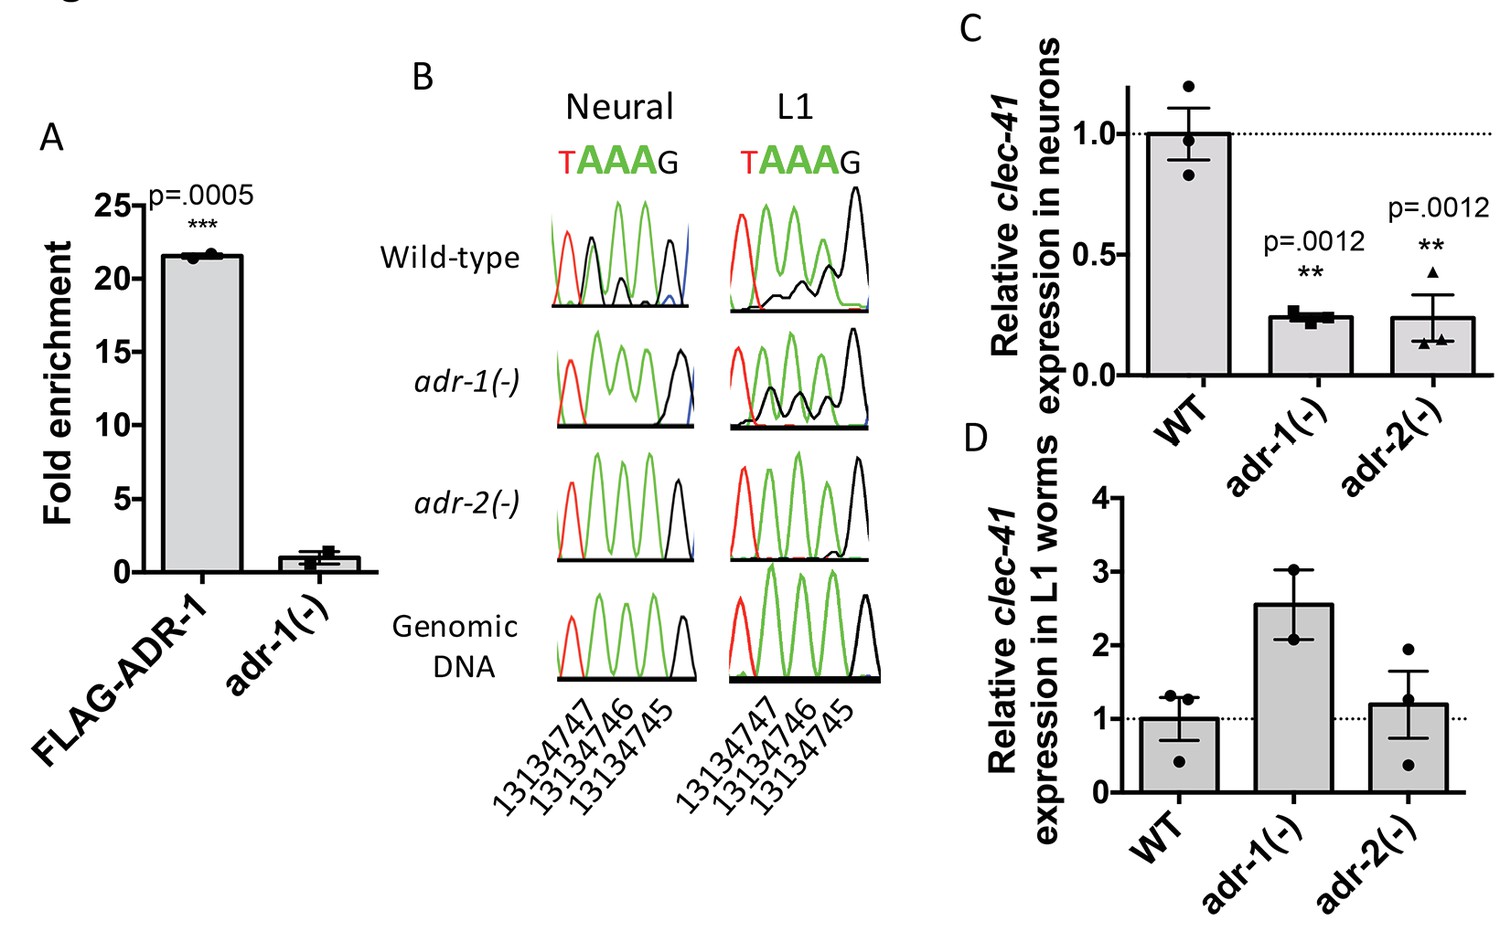
Neural A-to-I RNA editing and expression of clec-41 is regulated by ADR-1 and ADR-2.
(A) Lysates from adr-1(-) worms and worms expressing FLAG-ADR-1 were subjected to a FLAG immunoprecipitation (IP). qRT-PCR was performed on both RNA from the input lysates as well as the IP samples. The levels of clec-41 in the IP samples was divided by the level of clec-41 in the lysate and the fold enrichment of this ratio for FLAG-ADR-1 normalized to the negative control adr-1(-) was determined. The average of two independent biological replicates is plotted with error bars representing the SEM. Student’s t-test, ***p<0.001. (B) Sanger sequencing chromatograms of clec-41 genomic DNA or cDNA amplified from the indicated strains. The chromosomal coordinates (ce11) for the edited adenosines in the wild-type cDNA are indicated below the chromatograms, representative from three (Neural) or 2 (L1) independent biological replicates (Quantification of all editing sites can be seen in Figure 4—figure supplement 1) RNA isolated from neural cells (C) or L1 whole worms (D) for the indicated strains was subjected to reverse transcription and qRT-PCR to determine levels of clec-41 from three independent biological replicates. The average expression of clec-41 relative to the house-keeping gene, gpd-3 were normalized to WT and plotted with SEM. One-way ANOVA followed by Dunnett’s Multiple Comparisons Correction, **p<0.01.
Figure 4—figure supplement 1
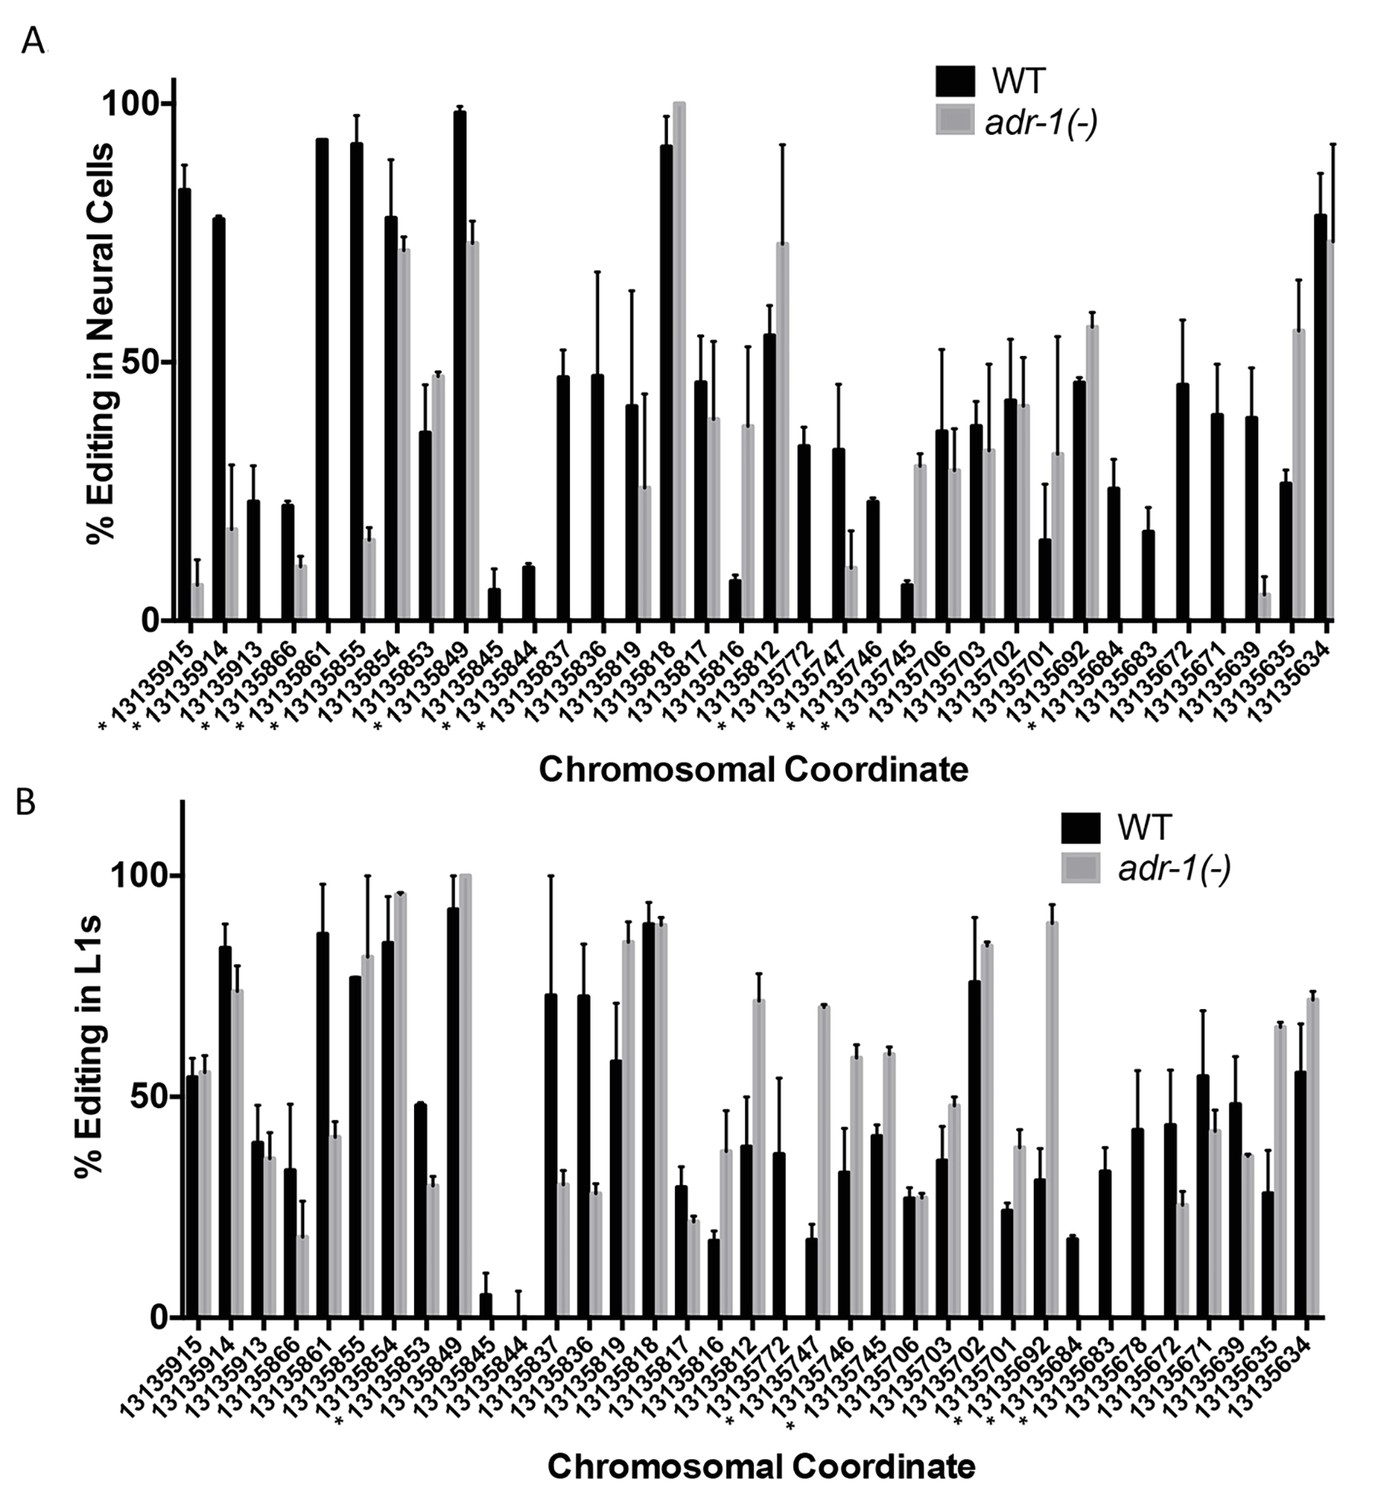
Changes in editing of the clec-41 3’ UTR upon loss of adr-1.
RNA isolated from wild-type (WT) and adr-1(-) (A) neural cells or (B) whole L1 worms was subjected to reverse-transcription and PCR amplification followed by Sanger sequencing to assess editing within the clec-41 3’ UTR. Editing levels were calculated by measuring the height of the guanosine peak (indicative of inosine) in the sequencing chromatogram and dividing by the combined height of the adenosine and guanosine peaks. The average percent editing was plotted from three (neural) or two (L1) biological replicates. Error bars represent the SEM. Student’s t-test, *p<0.05, * denoted next to chromosomal coordinate.
Figure 5 with 1 supplement
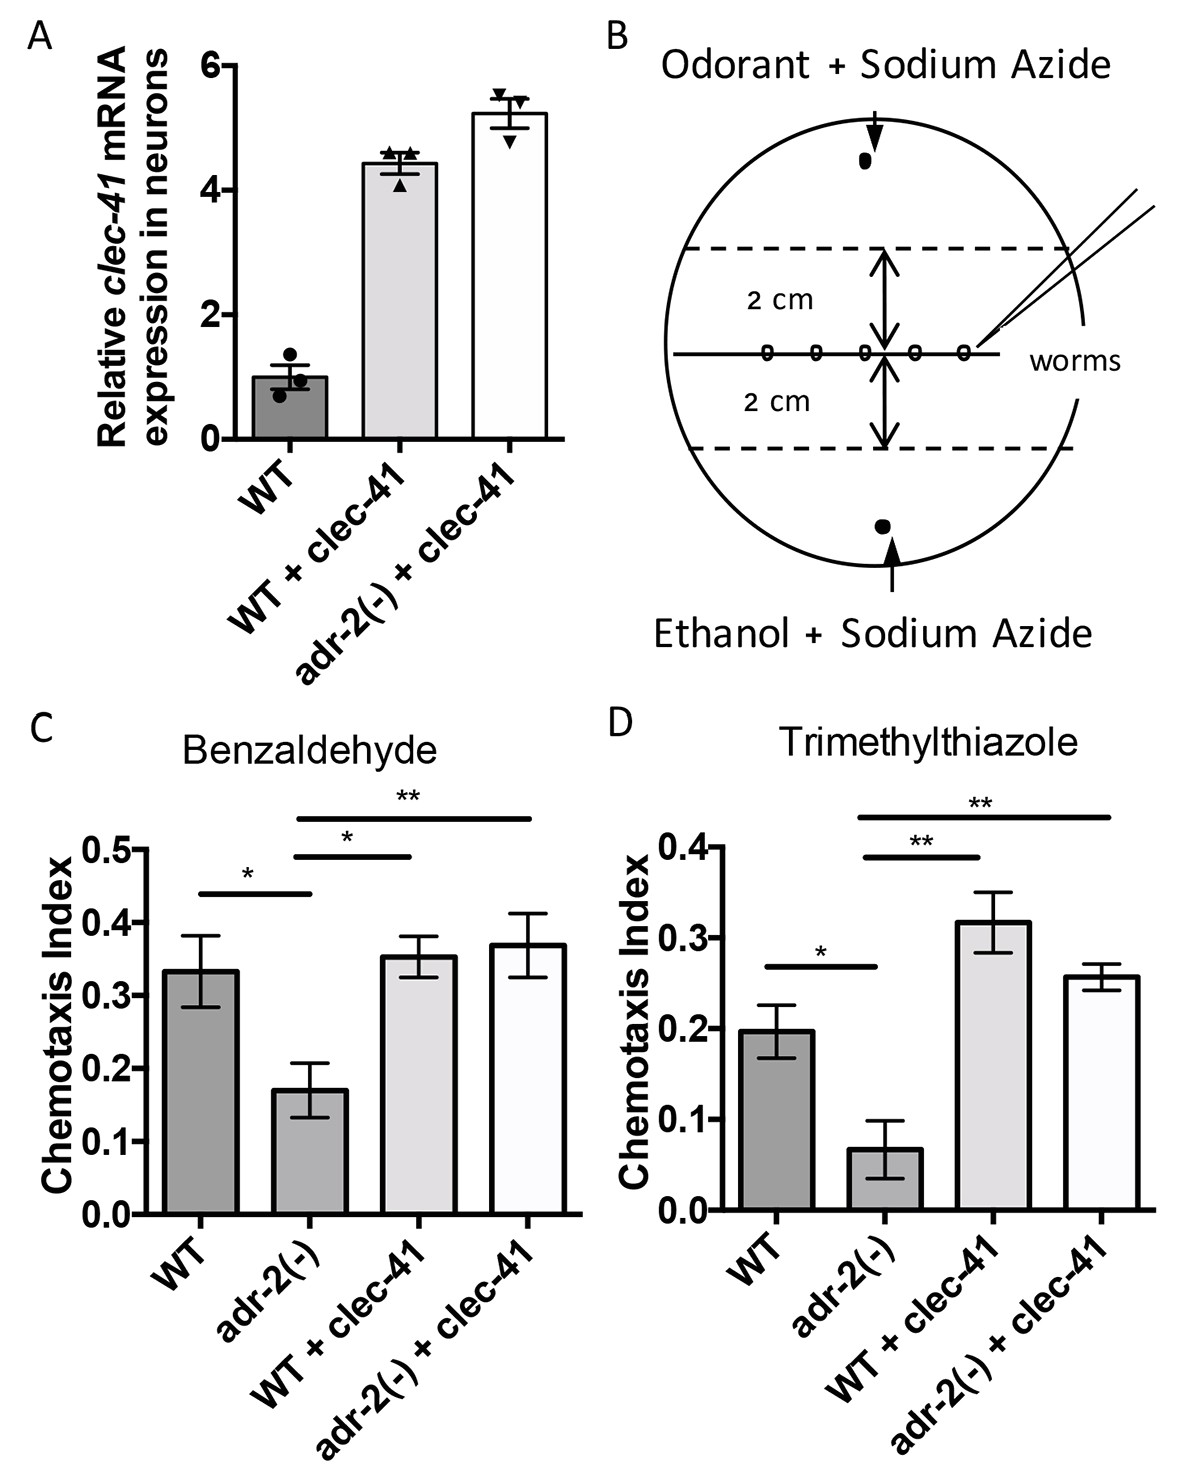
Rescue of clec-41 expression in adr-2(-) neural cells prevents disruptions in chemotaxis.
RNA was isolated from neural cells from wild-type (WT) as well as WT +clec-41 and adr-2(-)+clec-41 transgenic worms expressing clec-41 using the pan-neural rab-3 promoter for (A) qRT-PCR analysis of clec-41 expression. The endogenous control gpd-3 was used to normalize expression levels. (B) Chemotaxis assays used 60 cm plates. The chemoattractant (odorant) was spotted on one side and an ethanol control on the other. Worms were placed in the middle and allowed to migrate for 1 hr prior to counting (Wang et al., 2016) and the Chemotaxis Index of WT, adr-2(-) as well as WT +clec-41 and adr-2(-)+clec-41 to (C) Benzaldehdye (1:1000 dilution) or (D) Trimethylthiazole (1:10,000 dilution) was determined from 7 and 3 independent biological replicates, respectively. The chemotaxis index to trimethylthiazole (1:10,000 dilution) of worms expressing only the clec-41 3’ UTR in neural cells or expressing clec-41 in nonneural tissue was determined as a control (Figure 5—figure supplement 1). One-way ANOVA followed by Tukey’s Multiple Comparisons Correction. *p<0.05, **p<0.01.
Figure 5—figure supplement 1
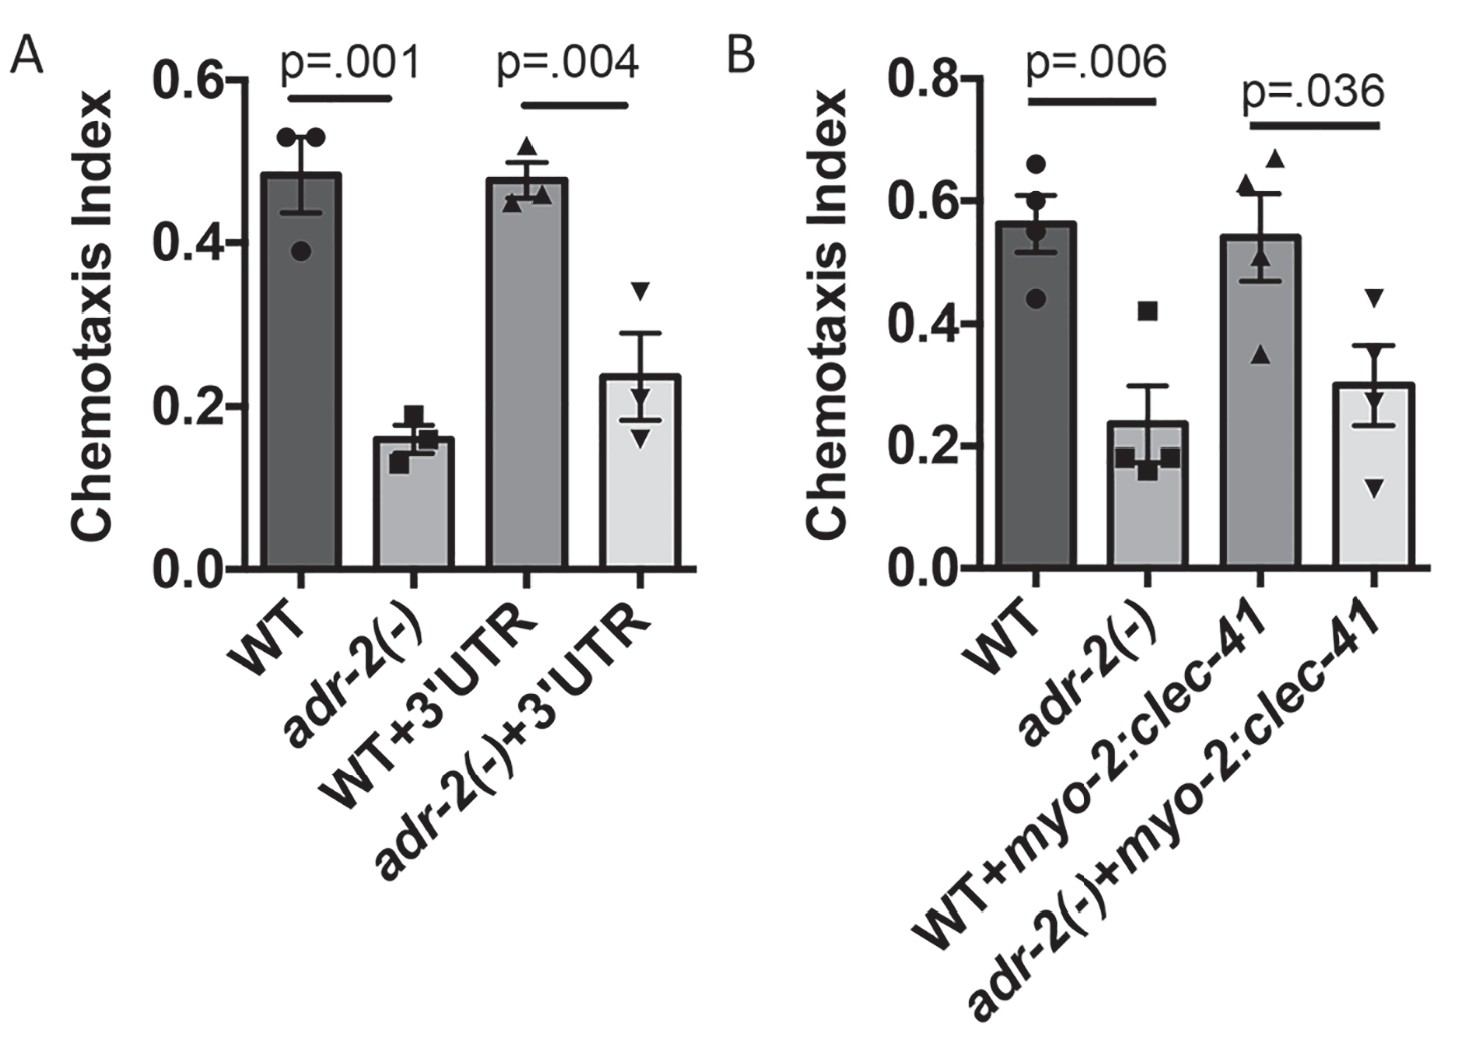
Neural expression of clec-41 gene required for proper chemotaxis.
The Chemotaxis Index of WT, adr-2(-) as well as (A) WT +gfp:clec-41 3' UTR and adr-2(-)+gfp:clec-41 3' UTR or (B) WT and adr-2(-) expressing clec-41 in pharyngeal muscle tissue (clec-41 transgene driven by myo-2 promoter) to trimethylthiazole (1:10,000 dilution) was determined from 3 independent biological replicates. One-way ANOVA followed by Sidak’s Multiple Comparisons Correction.
Figure 6 with 1 supplement
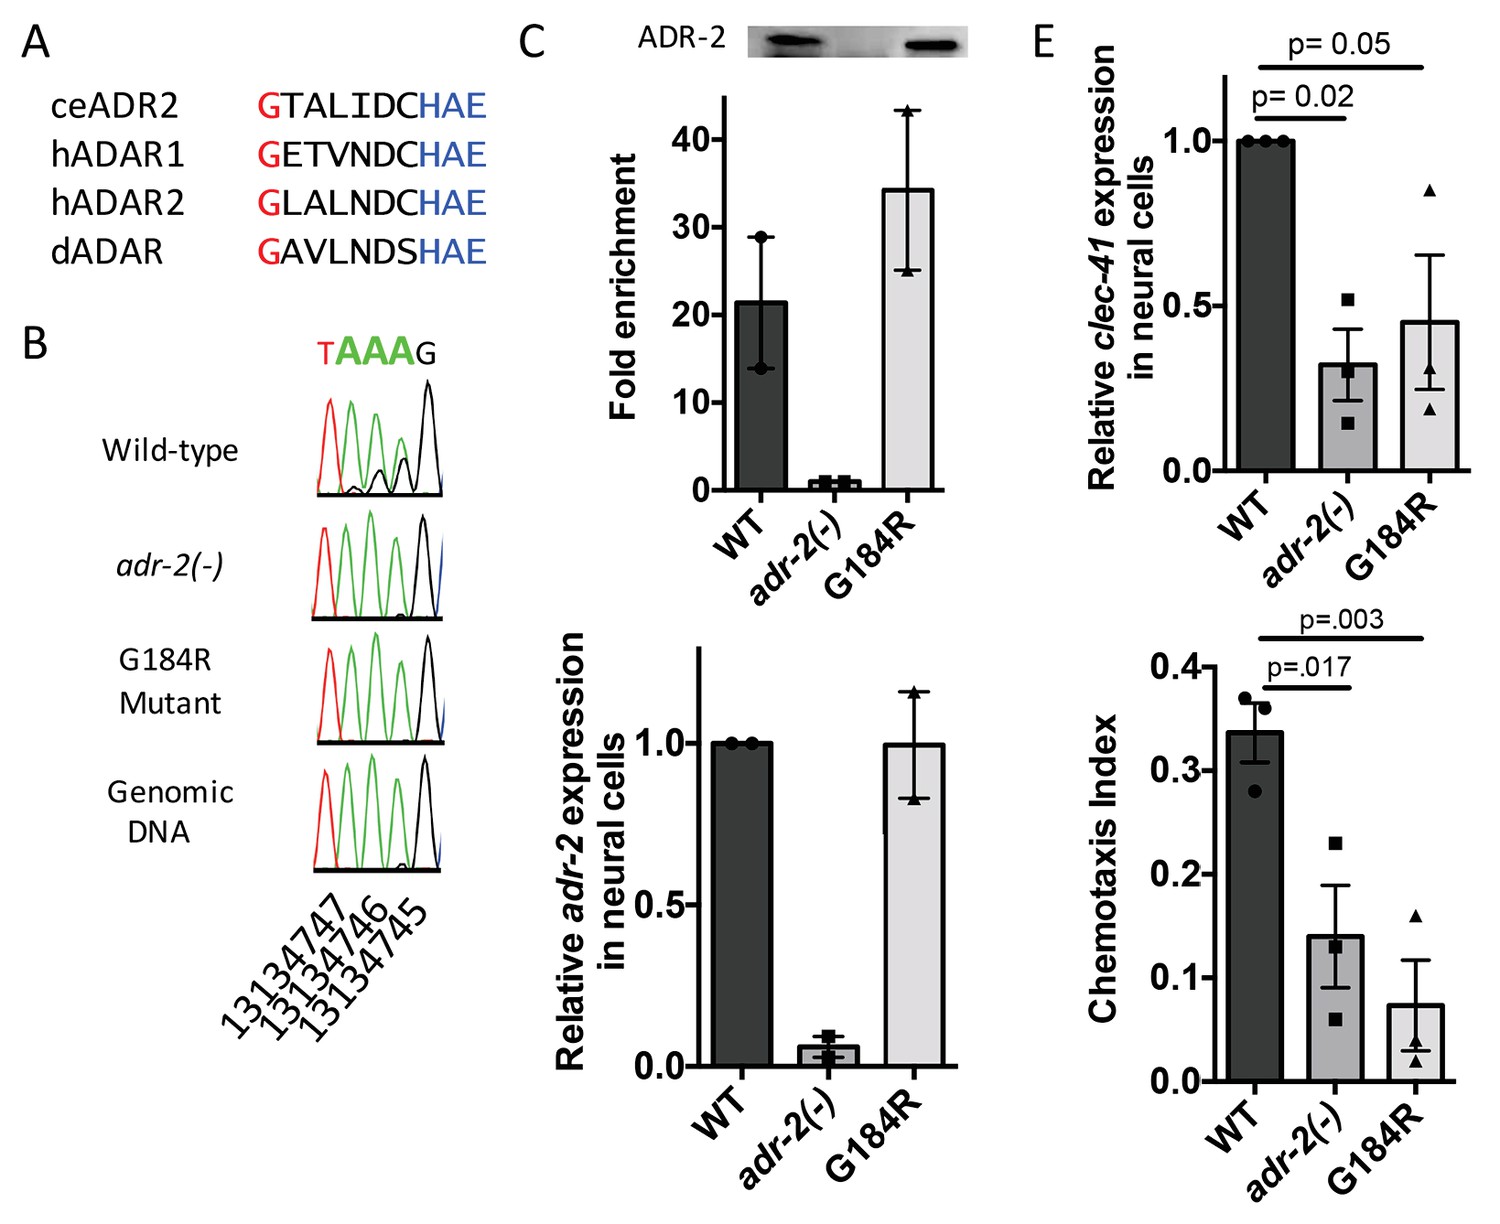
Deamination is required for both proper clec-41 expression and proper chemotaxis.
(A) Alignment of ADAR sequences from several species demonstrating conservation of the Glycine residue at position 184 in the C. elegans ADR-2 protein. This G is near the conserved HAE deamination motif and is mutated to arginine (R) in the adr-2(G184R) worms. (B) RNA from adr-2(G184R) worms was isolated and compared to RNA from wild-type and adr-2(-) worms. RT-PCR and Sanger sequencing of the clec-41 3’ UTR was performed for all three strains. The chromosomal coordinates (ce11) for each editing site are listed below each chromatogram. The nucleotides at each position are represented with a different color (Green = Adenosine, Black = Guanosine, Blue = Cytidine, Red = Thymidine). A-to-I editing sites can be identified by peaks that are green (A) in the amplified genomic DNA and black (G) or a mixture of black (G) and green (A) in the cDNA. (C) Lysates from WT, adr-2(-) and adr-2(G184R) worms were subjected to an ADR-2 immunoprecipitation (IP). Western blotting of the IP samples with an ADR-2 antibody indicate similar levels of ADR-2 in the WT and adr-2(G184R) IPs. qRT-PCR was performed on both RNA from the input lysates as well as the IP samples. The levels of clec-41 in the IP samples was divided by the level of clec-41 in the lysate and the fold enrichment of this ratio for WT and adr-2(G184R) normalized to the negative control adr-2(-) was determined. (D–E) RNA was isolated from neural cells from wild-type (WT), adr-2(-) and adr-2(G184R) worms. qRT-PCR analysis of (D) adr-2 and (E) clec-41 expression was analyzed in neural cells of all three strains. The endogenous control gpd-3 was used to normalize expression levels. (F) Chemotaxis Index of WT, adr-2(-) as well as adr-2(G184R) worms to trimethylthiazole (1:10,000 dilution) was determined from 3 independent biological replicates. One-way ANOVA followed by Dunnett’s Multiple Comparisons Correction.
Figure 6—figure supplement 1
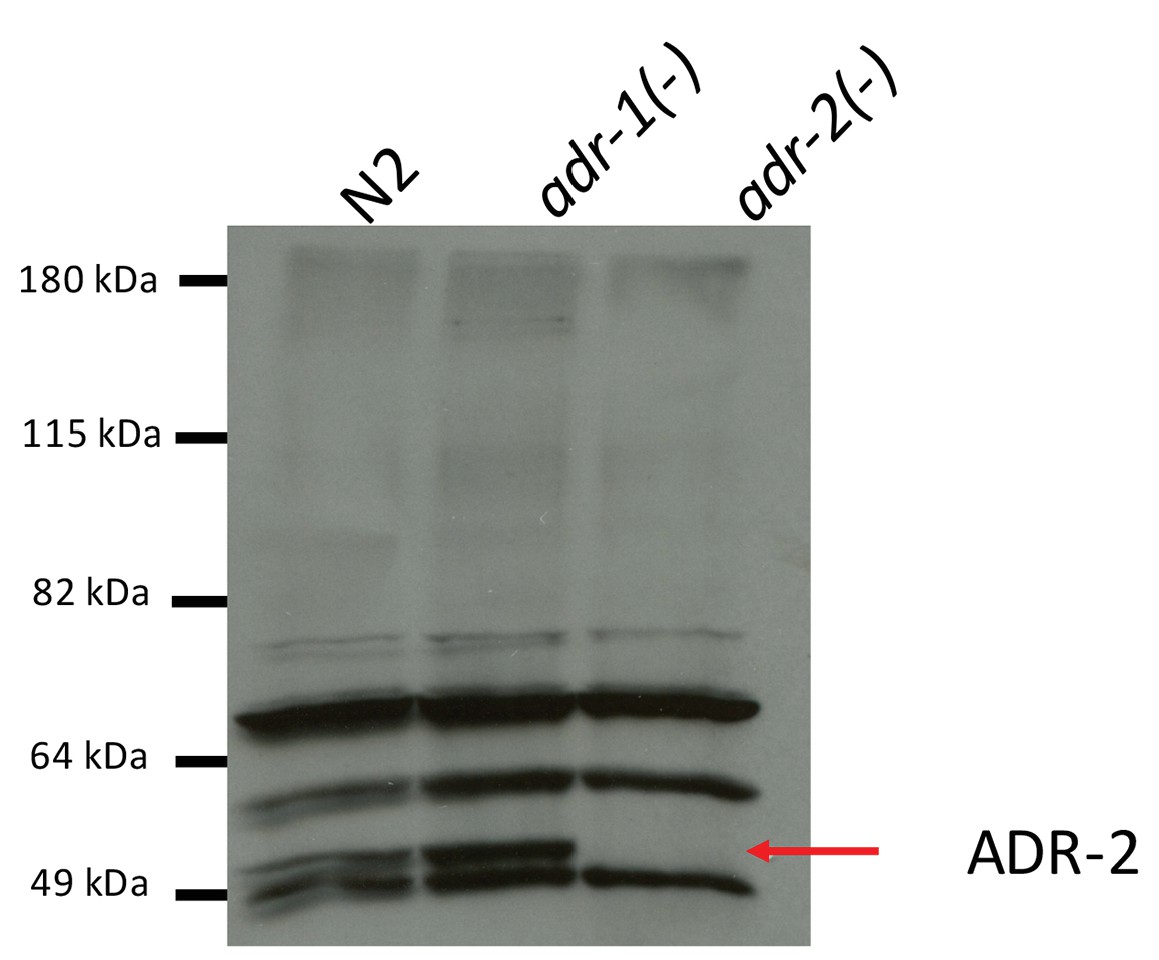
Specificity of ADR-2 Antibody.
Lysates from wild-type (WT), adr-1(-) and adr-2(-) worms were subjected to SDS-PAGE and immunoblotting with a custom ADR-2 antibody.
Tables
Table 1
Sequences of all primers used in this study.
https://doi.org/10.7554/eLife.28625.012| Sequence | ||
|---|---|---|
| qRT-PCR | ||
| unc-64 | Forward | Gccattgatcacgacgagcaaggagccgga |
| Reverse | Ccagcaatatcgagttgtctctgaattcgtc | |
| myo-3 | Forward | ccagaagaatatcagacgctacttggac |
| Reverse | taacaataagctcttcttgctcctgtttg | |
| gpd-3 | Forward | ggaggagccaagaaggtc |
| Reverse | aagtggagcaaggcagtt | |
| ctl-2 | Forward | caagccaactcaaggagtgaagaatctcac |
| Reverse | catcttccatactggaaagtctcccttctc | |
| dod-19 | Forward | ccaggatatacgagcatcgattcgacaacc |
| Reverse | gaagctccaggatatctagtatctctcttg | |
| hsp12.6 | Forward | caatgtcctcgacgacgatgatcacttc |
| Reverse | gaatccttctttacattgtgctccatatgg | |
| sre-6 | Forward | gaaagatgctttgcgacatgtttcgctgg |
| Reverse | cgggcatcatgatagaaatcaagagaag | |
| clec-41 | Forward | actctggaagattctattccccaagc |
| Reverse | cgactgtaaatggaaattgatgcctgac | |
| Editing Assays | ||
| daf-2 | RT primer | ctatttcgagcattgaggccgaattgaggc |
| Forward #1 | cgagaatgaatgaatattgtcagatgtcggag | |
| Reverse #1 | cgagcgctacgtcgaattccaataactc | |
| Forward #2 | gaaaatttggaagaaggtgagctggggg | |
| Reverse #2 | ggtgggttaccgaaatttgagactttgc | |
| clec-41 | RT primer | acaccacgaaaaataattacagtgctggcc |
| Forward #1 | ctcaacagattcatctggccaaggttcagg | |
| Reverse #1 | acaccacgaaaaataattacagtgctggcc | |
| Forward #2 | ggttcaggattcagtgcaaatttttgggcg | |
| Reverse #2 | agctcgagattactctacacttctcttctt | |
| npr-17 | RT primer | gctattgagttcattgagccatttacctggg |
| Forward #1 | ccaacttcaacaaagatatcgatcaaatcg | |
| Reverse #1 | cattgagccatttacctgggaaaatgtggc | |
| Forward #2 | gacgacaacaacaacagcttcaacagc | |
| Reverse #2 | gttccgtataagtgttttacccagaagcg | |
| rbf-1 | RT primer | gtgtcaatgtgattgagccaaggctacctg |
| Forward #1 | ggggttattcaagtagtttcgcaac | |
| Reverse #1 | tgagccaaggctacctgaatattttg | |
| Forward #2 | ggggttattcaagtagtttcgcaac | |
| Reverse #2 | gtgagaagaagaggaagatggaatattgatg | |
| crtc-1 | RT primer | ctctaatgccttcagattggcgccacctac |
| Forward #1 | ccaccaaacacccaacaactcattccatg | |
| Reverse #1 | ccttcagattggcgccacctacaacatgg | |
| rgef-1 | RT primer | gaggaaagtgtgtggaagactggtg |
| Forward #1 | ggaagtacaccagatgaagaaattggtcttg | |
| Reverse #1 | gcgtagagatcaaacaagtgggatagg | |
| F23A7.3 | RT primer | ctaactgccaacaaacgactatctcaaatg |
| Forward #1 | cacaactctcttgctggataggtccgaacg | |
| Reverse #1 | ctaactgccaacaaacgactatctcaaatg | |
| Forward #2 | gctggataggtccgaacgtcgtctaatg | |
| Reverse #2 | ctattctcatggagcatctgccattcc |
Additional files
-
Supplementary file 1
A-to-I editing sites identified in neural cells.
The high confidence editing sites identified by the bioinformatics pipeline are listed on the first sheet of the excel document (RNA-seq Identified Sites). The chromosome number (Column A) and coordinate in ce11 reference genome (Column B) are given for each predicted editing site. The approximate editing percentage (Column C) based on the frequency of reads with guanosine at that coordinate within unique reads as well as the number of unique reads covering that position (Column D) is listed. The predicted editing site was assigned (described in detail in the methods section) to a genic region (Column E) and a gene (Column F and G). A list of editing sites identified using Sanger sequencing editing assays from mRNAs identified by the bioinformatics pipeline are listed on the second sheet of the excel document (Sanger-seq Verification). Gene-specific reverse transcription followed by PCR amplification and Sanger sequencing was used to examine editing events in the indicated genes (Column A). The chromosome number (Column B) and coordinate in ce11 reference genome (Column C) are given for each adenosine to inosine detected as well as the percent editing as determined using the RNA-seq data (Column D). The methods used to detect the A-to-I change was listed (Column D and E) as well as confirmation (yes), decline (no), or inability to accurately determine (ND) the presence of A-to-I editing at a given adenosine. A list of all genes and the novel genes identified by the pipeline as edited are listed on the third sheet of the excel document (Edited Genes). All edited genes (Column A and B) were aligned with a document containing all identified editing sites in C. elegans from numerous published RNA-seq data sets (Supplementary file 3 [Goldstein et al., 2017]). Novel edited genes identified in this study are listed (Column C and D). Genes identified as edited by SAILOR were queried using Wormbase to identify genes that regulate chemotaxis and/or locomotion and these genes are listed on sheet four of the excel document (Locomotion and Chemotaxis Genes). The wormbase IDs and gene names (Column A and B) are listed for genes identified as regulators of this biological process. The genes were then aligned with an unpublished RNA-seq data set of RNAs bound by ADR-1 (Column C).
- https://doi.org/10.7554/eLife.28625.013
-
Supplementaty file 2
Differential gene expression identified from the transcriptome-wide RNA-seq.
Genes whose transcripts exhibited ≥2 fold change in expression between wild-type and adr-2(-) neural cells are listed. Upregulated (Sheet 1) and downregulated (Sheet 2) genes are listed by gene name (Column A) and Wormbase ID (Column B). The base Mean, or mean expression of each gene normalized to sequencing depth for all samples is listed (Column C), as well as the fold change in expression observed when comparing the wild-type to adr-2(-) (Column D) and the adjusted p-value from DESeq2 (Column E). Genes whose expression was examined by qRT-PCR are marked with yellow and listed as verified (Column F). The four edited genes are listed as Edited (Column G).
- https://doi.org/10.7554/eLife.28625.014
-
Transparent reporting form
- https://doi.org/10.7554/eLife.28625.015
Download links
A two-part list of links to download the article, or parts of the article, in various formats.
Downloads (link to download the article as PDF)
Open citations (links to open the citations from this article in various online reference manager services)
Cite this article (links to download the citations from this article in formats compatible with various reference manager tools)
The C. elegans neural editome reveals an ADAR target mRNA required for proper chemotaxis
eLife 6:e28625.
https://doi.org/10.7554/eLife.28625


